- 1School of Engineering and Technology, China University of Geosciences (Beijing), Beijing, China
- 2College of Urban and Environmental Sciences, Peking University, Beijing, China
- 3School of Urban Geology and Engineering, Hebei GEO University, Shijiazhuang, China
Rock–ice avalanches have increased in recent years due to global warming. On 12 March 2004, a massive failure of rock mass (
Introduction
As a result of global warming, glacier-related hazards are attracting more and more attention. Rock–ice avalanche, a critical glacier-related hazard, has recently been widely studied (Coe et al., 2018; Leinss et al., 2021; Pudasaini and Krautblatter, 2021; Zhang et al., 2023). Rock–ice avalanches are rapid mass movement events in which ice is believed to influence the runout dynamics either as the underlying surface or as part of the moving mass (Schneider et al., 2011; Dufresne, 2014; Aaron et al., 2017; Yang et al., 2019). Although rock–ice avalanches always occur in cold, high-mountain areas, their hypermobility can cause major damage in piedmont regions and can even cause chains of geohazardous events. The Kolka rock–ice avalanche in 2002 caused the deaths of approximately 140 people (Huggel et al., 2005). The Langtang rock–ice avalanche in 2015 buried a village and killed more than 350 people (Gnyawali et al., 2020). The recent Chamoli rock–ice avalanche (2021) caused more than 200 casualties and a catastrophic flood (Shugar et al., 2021; Fan et al., 2022).
Previous studies have observed that rock avalanches in glacial environments usually exhibit greater travel distances and lower apparent friction coefficients than those in non-glacial environments (Evans, 1989; De Blasio, 2014). For example, Sosio (2015) has demonstrated that ice and snow could enhance mobility with respect to rock avalanches of comparable magnitude evolving in non-glacial settings by up to 25–30%. The mobility of rock–ice avalanches is believed to be controlled by multiple factors, including the volume, topography, ice and water content, and frictional characteristics of the path surface (Schneider et al., 2011). Recently, much research has examined the influence of ice content, subducting layer glaciers, and ice melt water on mobility using physical models and numerical simulations. To date, several hypotheses on the hypermobility of the rock–ice avalanche have been proposed, including 1) that propagation onto glaciers offers a smooth surface with a low friction coefficient, which contributes to the long runout of rock avalanches on glaciers (Bottino et al., 2002; Sosio et al., 2012; Delaney and Evans, 2014); 2) that mixing with ice and snow could hamper clast collisions and favors the formation of dense flow behavior, which could significantly reduce the friction coefficients of both dry and partially saturated debris (Schneider et al., 2011; Yang et al., 2019); and 3) that ice melting reduces granular friction via saturation of the basal material and fluidization effects (McSaveney, 1978, 2002; De Blasio, 2014).
Compared with rock avalanches in non-glacial environments (Hewitt, 1998; Dufresne et al., 2016, 2019; Dufresne, 2017; Wang et al., 2018; Wang et al., 2019; Zeng et al., 2019; Wang S. et al., 2020; Zeng et al., 2021; Chen et al., 2022), the sedimentary characteristics of rock–ice avalanches show some differences. For instance, researchers have observed a 0.5–4.5-m deep pit formed by melting ice at the front of the Yigong rock–ice avalanche (Yang et al., 2015), chaotic topography with irregular hills and depressions formed by differential ablation in the Miage Glacier rock–ice avalanche (Deline, 2009), and larger clasts concentrated distally in the Sherman Glacier rock–ice avalanche (Sosio et al., 2008, 2012). These sedimentary structures are considered to be related to the transformation of the solid phase (ice) to the fluid phase, which could fundamentally alter the mechanical processes (Evans and Delaney, 2015). In addition, interesting numerical simulation studies of rock–ice avalanches have been conducted in recent years and have greatly deepened our understanding of rock–ice avalanche kinematics and dynamic processes. For example, Schneider et al. (2010) present a new approach for rock–ice avalanche dynamic analysis based on a combination of computational model results and seismic data. Pudasaini and Krautblatter (2014) proposed a two-phase mass flow model for simulating the emplacement process of rock–ice avalanches. Finally, Sansone et al. (2021) derived a framework of simplified mathematical models for rock–ice avalanches from a complete three-phase approach.
Although rock–ice avalanches have been extensively studied globally, they are relatively rare in China. On 12 March 2004, a violent rockfall occurred on the south slope of Yulong Mountain and transformed into a rock–ice avalanche with a travel distance of 4860 m and an H/L ratio of 0.4. Cui (2013) named this event the Ganheba rock–ice avalanche. On 3 May 2019, a new rockfall occurred in this area, covering the proximal deposits of the 2004 rock–ice avalanche. Yulong Mountain, where the giant landslide occurred, is the southernmost snow mountain in China and is important for disaster assessment at other snow mountains and in permafrost areas in China. However, the geomorphological and sedimentary characteristics of the Ganheba rock–ice avalanche are more like those of rock avalanches than other rock–ice avalanches. This observation led us to realize that perhaps the amount of ice involved in the movement in this event was not significant. In addition, a previous report suggests that this failure of rock mass was the result of freeze–thaw action (Zhang et al., 2007), but there has been no systematic study of its formation and evolution process. Therefore, the Ganheba rock–ice avalanche may provide an opportunity to study landslides that are between rock avalanches and rock–ice avalanches, which could help us understand the influence of ice and the glacial environment.
This study was designed to investigate the geomorphology, sedimentary characteristics, formation mechanism, and emplacement process of the Ganheba rock–ice avalanche based on two field survey records (April 2007 and April 2021), historical remote sensing images, and a discrete element model. We analyzed in detail the formation of some interesting sedimentary structures and the velocity characteristics during the movement. The numerical simulation shows the model of single-phase dry granular flows and, with suitable parameters, can reproduce the emplacement process of the Ganheba rock–ice avalanche. This study not only provides insight into the emplacement mechanism of a rock–ice avalanche but also helps deepen the understanding of the formation and evolution of glacier-related hazards in the eastern Tibetan Plateau.
Geological setting
The Ganheba rock–ice avalanche occurred on the southern slope of the main peak of Yulong Mountain, which is located in Yunnan Province at the southeast margin of the Tibetan Plateau (Figure 1A). This mountain is oriented roughly NNW–SSE, with a length of 35 km from north to south. It is the southernmost snow mountain in China and the southernmost marine glacier area in Eurasia. Recent studies have shown that the glaciers in Yulong Mountain are experiencing rapid retreat and that current atmospheric conditions are unlikely to suppress this loss trend (Wang Y.-F. et al., 2020; Yan et al., 2021a).
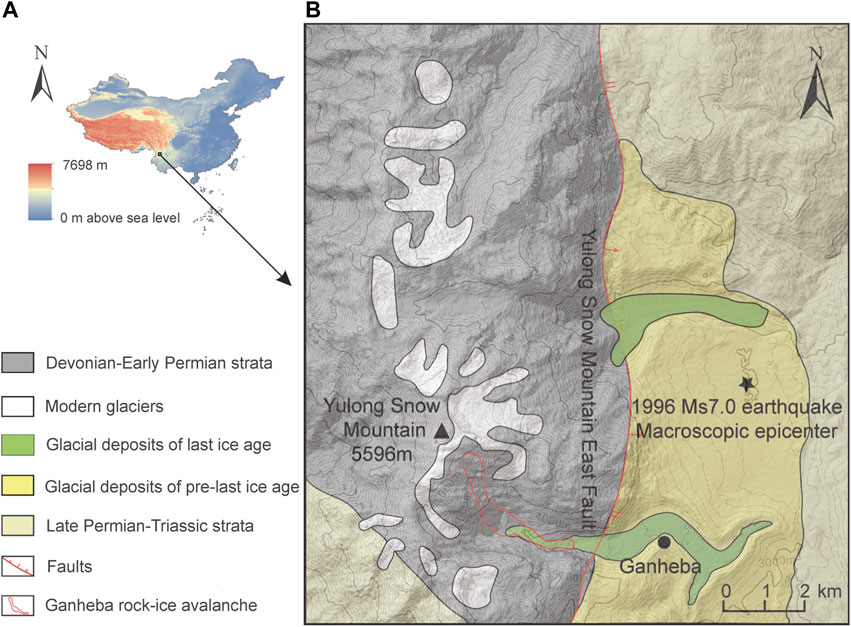
FIGURE 1. Location map of the study area (A). Geological map of the study area (B) (after Wu et al., 2008).
In the area in which the study was conducted, the Yulong Mountain East Fault (Lijiang–Daju fault) passes through the eastern piedmont; this is a normal fault that caused an earthquake of magnitude 7.0, with a source depth of 10 km, on 3 February 1996 (Figure 1B) (Yan et al., 2021b). This was the most violent earthquake in the Lijiang area to date (Han et al., 2004). An inventory from this event indicates that more than 200 landslides were triggered by this earthquake (Tang and Grunert, 1999). More than 400 earthquakes have occurred in Yunnan Province in the 20th century, including 13 of magnitude 7 or greater (Huang et al., 2000; Lai et al., 2021). This large number of seismic events indicates that the tectonic activity in the area is very intense and could cause serious rock damage.
The Ganheba rock–ice avalanche occurred in a glacial valley in the southern part of Yulong Mountain. Two huge lateral moraines and a terminal moraine are developed at the exit of the glacial valley, which formed during the last glacial period (the Dali ice age). The slopes on both sides of the glacial valley are very steep (50–80°) and have developed fissures. This area is composed of thick gray limestone and tuff. Previous studies have demonstrated that the study area is located in the compound anticline of the Indo-Sinian geosyncline, where the shear joints developed (Zhang et al., 2007). In our field investigation, two sets of structural surfaces in the study area were measured (dip direction and dip angle: 111°∠75°; 300°∠89°) with a spacing of 30–100 cm. Although there is no perennial river, the glacial meltwater always forms a stream in summer.
Data and methods
Remote sensing and field investigation
To identify the characteristics of the Ganheba rock–ice avalanche and distinguish its subsequent deformation, remote sensing was used in this study. Table 1 presents the remote sensing data used in this study. All the images had been geometrically corrected before they were downloaded, so we performed only radiometric and atmospheric correction on some images after downloading them. Unfortunately, there is no high-resolution data available that predates the rock–ice avalanche. The geomorphological characteristics, including glacier distribution, topography, source characteristics, and deposit characteristics, were identified based on the remote sensing data. To further clarify the geomorphological and sedimentary characteristics of the Ganheba rock–ice avalanche, field investigations were also conducted using the high-accuracy (10 cm) handheld Global Navigation Satellite System (Trimble 7x), a laser rangefinder (Newcon LRM2000pro and Nikon Coolshot40), a compass, and a camera. It is worth noting that due to the 2019 rockfall covering the proximal deposits of the 2004 rock–ice avalanche, the field investigation was conducted mainly at the middle deposits and distal deposits, while the proximal deposit analysis relied on the interpretation of historical remote sensing images.
Discrete element modeling
Although the Ganheba rock–ice avalanche consisted of ice and rock, its geomorphological and sedimentary characteristics are more like those of a rock avalanche. Therefore, a single-phase dry granular flow model was used in the present study rather than a multi-phase flow model. PFC2D 5.0 was employed in this study to simulate the emplacement process of the Ganheba rock–ice avalanche. This discrete element modeling method has been widely used for rock avalanches in recent years (Deng et al., 2017; Zhang et al., 2019; Gao et al., 2020; Zhang S. et al., 2022; Zhang Y. et al., 2022). The sliding surface in this study was modeled using wall elements, and the rock mass was simulated as an assembly of particles cemented together using the parallel-bond model. A total of 10,858 ball elements with different radii were used for the rock mass modeling (1 m: 40%, 1–2 m: 30%, 2–4 m: 20%, 4–8 m: 10%).
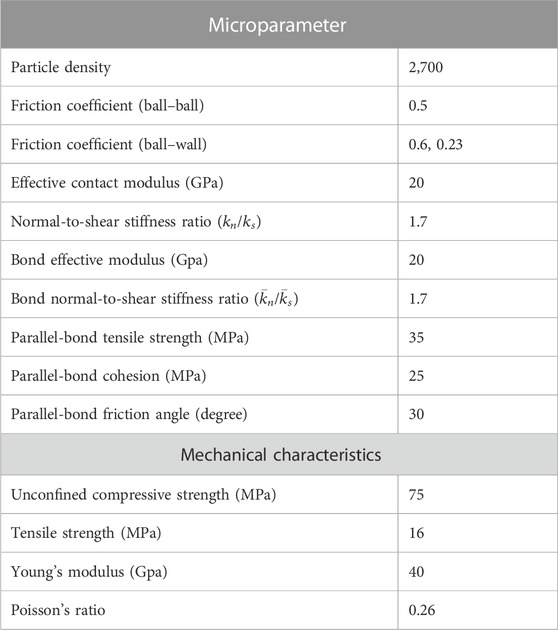
The microparameters (Table 2) and corresponding mechanical characteristics were derived from previous studies and from uniaxial compression in PFC2D software (rock test in PFC2D examples with a sample of
Damping was also considered in this study. Although damping between particles is small during dynamic simulations of rock avalanches, the damping effect between the particles and the ground should be noted, especially when the particles impact the ground. The viscous normal and shear damping constants of granular particles within the rock mass (ball–ball contacts) and the normal and shear damping coefficients of the particles along the slide surface (ball–wall contacts) were determined to be 0.02, 0.02, 0.21, and 0.02, respectively (Gao et al., 2020).
Results
Geometric and geomorphological characteristics
Figures 2A, B present the Landsat 5 remote sensing images of the Ganheba rock–ice avalanche before and after the landslide. It is clear that the Ganheba rock–ice avalanche changed the local landscape, with a large amount of material filling the glacial valley. The change in the source area could be preliminarily identified by the Landsat 5 satellite. Before the landslide, a sizable dangerous rock body (yellow circle in Figure 2A) was exposed, while the size of this dangerous rock body became smaller after the landslide (Figure 2B). However, there is a confusing issue in that the accumulation boundary shown in Figure 2B appears to differ from the current morphology. To exclude the effect of a secondary landslide, the spot data were employed here. Although the deposited area in Figures 2C, D appears to be different, we found that the locations of the toes (the distal part of the deposits) were similar in both of these remote sensing images. Therefore, the difference between these images can mainly be attributed to the low accuracy and different satellite elevation angles. In addition, creep under freeze–thaw action may have played a role in changing the plan shape of the deposits. Figures 2E, F present the landform change in the proximal deposits caused by the 2019 rockfall, but it is evident that the middle and distal deposits were not covered in this event.
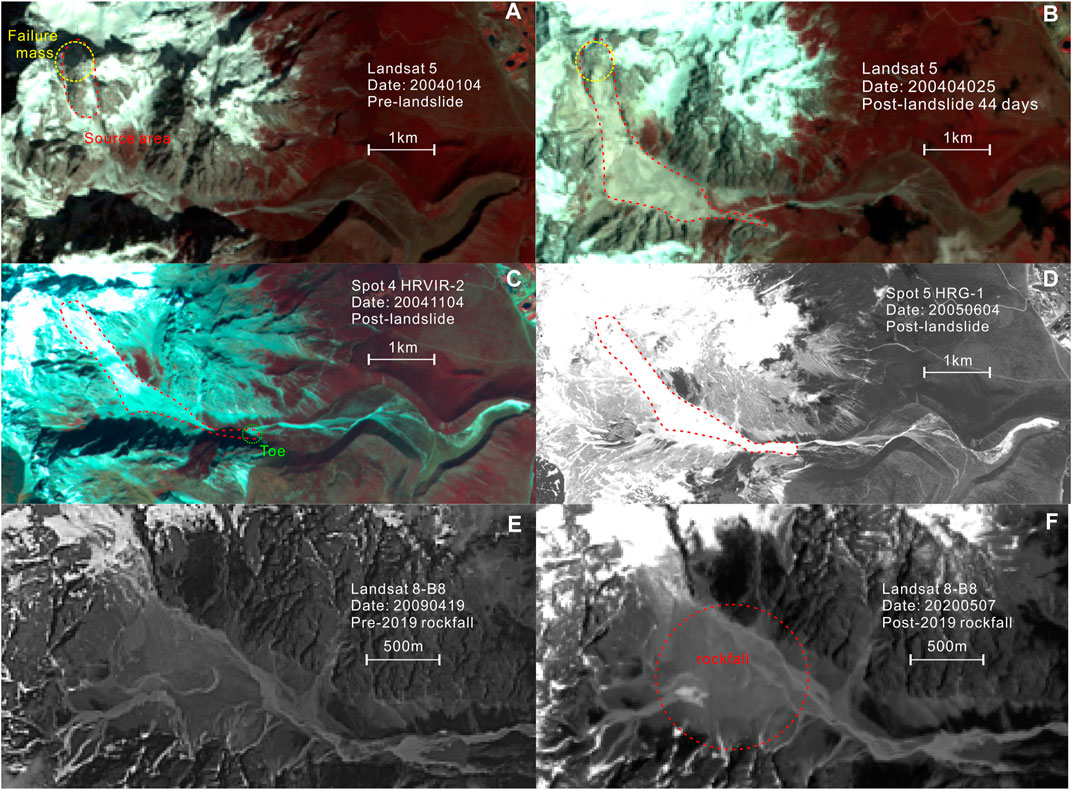
FIGURE 2. Remote sensing images of the Ganheba rock–ice avalanche at different times. The red lines represent the range of the source area [panel (A)], the 2004 rock-ice avalanche panel [panel (B–D)], and the 2019 rockfall deposits [in panel (F)], respectively. The yellow lines in panel (A) and (B) show the change of the rock body in the source area. Panel (E) shows the geomorphological characteristics of deposits in 2009 before the 2019 rockfall.
Based on this series of remote sensing images, the range of the Ganheba rock–ice avalanche could be determined. Figures 3A, B present a high-resolution plan view and longitudinal profile of the Ganheba rock–ice avalanche. According to the width, slope, and deposit distribution, the Ganheba rock–ice avalanche could be divided into the following areas: the source area, the transition zone, and accumulation zones 1 and 2 (Figure 3).
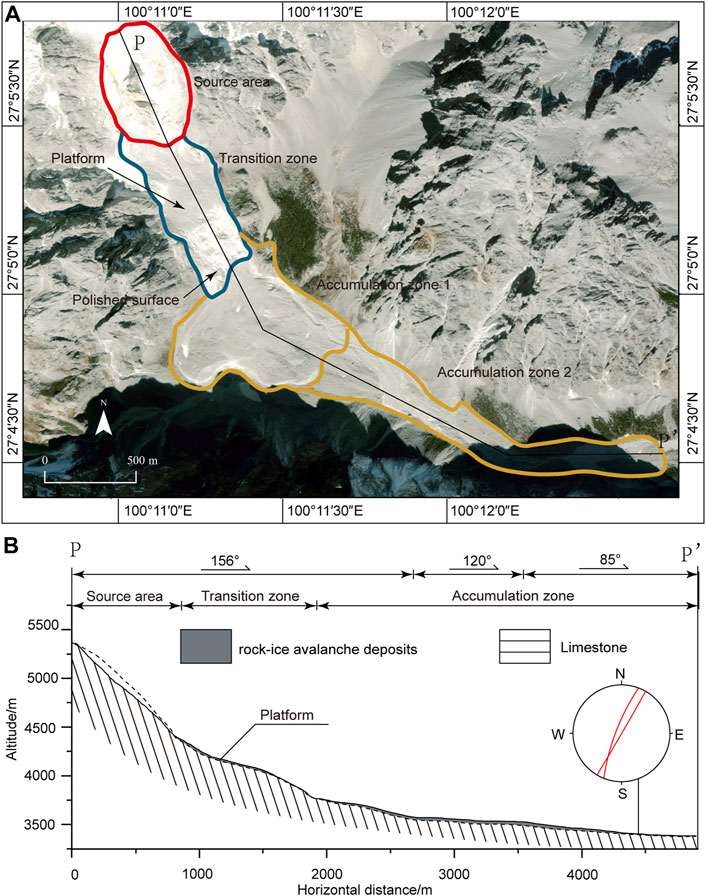
FIGURE 3. Zoning (A) and the longitude profile (B) of the Ganheba rock–ice avalanche. In panel (B), the stereographic projection represents the two sets of the structural surfaces of bedrock.
According to the digital elevation model (ALOS 12.5 m), the source area of the Ganheba rock–ice avalanche was a steep slope (about 45°), with a maximum elevation of approximately 5,350 m. Table 3 presents other geometric parameters, including the length, width, and area of the source area. The most striking observation concerning the source area is the yellow weathering surface in the gray rock body (Figure 4), which may have controlled the development of the failure mass. A series of fissures was also observed in the remote sensing and field images; these could be roughly divided into two groups (east-facing and west-facing) (Figures 4A, B). Based on the remaining protruding rock body in the source area, the thickness of the failure mass was estimated at 30 m. Thus, the failure volume was estimated to be approximately
The transition zone of the Ganheba rock–ice avalanche is approximately 694 m in length and 300 m in width. A gently sloping platform of 40 m in length divides the transition zone into three parts: an upward slope, the platform, and a downward slope (Figure 3B). The platform’s upward slope is approximately 40° and 260 m in length. The platform’s downward slope is approximately 26° and 410 m in length. Figure 2A shows that there had been a significant amount of snow on the platform before the landslide, which was scraped off by the rock–ice avalanche during the movement. Previous studies have reported some residual deposits on the gently sloping platform just after the landslide (Zhang et al., 2007; Cui, 2013), but this is no longer evident. On the platform’s downward slope, some polished surfaces were observed, which may have been formed by the glacier and could have reduced the basal friction of the rock–ice avalanche (Figure 3A).
The accumulation zone of the Ganheba rock–ice avalanche consists of a wide proximal part and narrow distal part (Figure 3A), which is controlled by the local terrain of the glacial valley. The length of the entire accumulation zone is about 2,860 m, and its elevation ranges from 3,379 to 3,712 m asl. Figures 5A, B present the dramatic changes in the proximal landform between 2005 (panel A) and 2013 (panel B). In Figure 5A, the proximal part shows a fan shape, with a length and width of about 350 m. Numerous longitudinal fissures had developed on the surface of the proximal fan, indicating it to be more like an ice accumulation than a rock avalanche deposit. In Figure 5B, the proximal fan is missing but several arc-shaped transverse ridges have developed, which may represent the deformation of the deposits. This phenomenon is similar to that of the Sherman ice–rock debris flow landslide (Shugar and Clague, 2011).
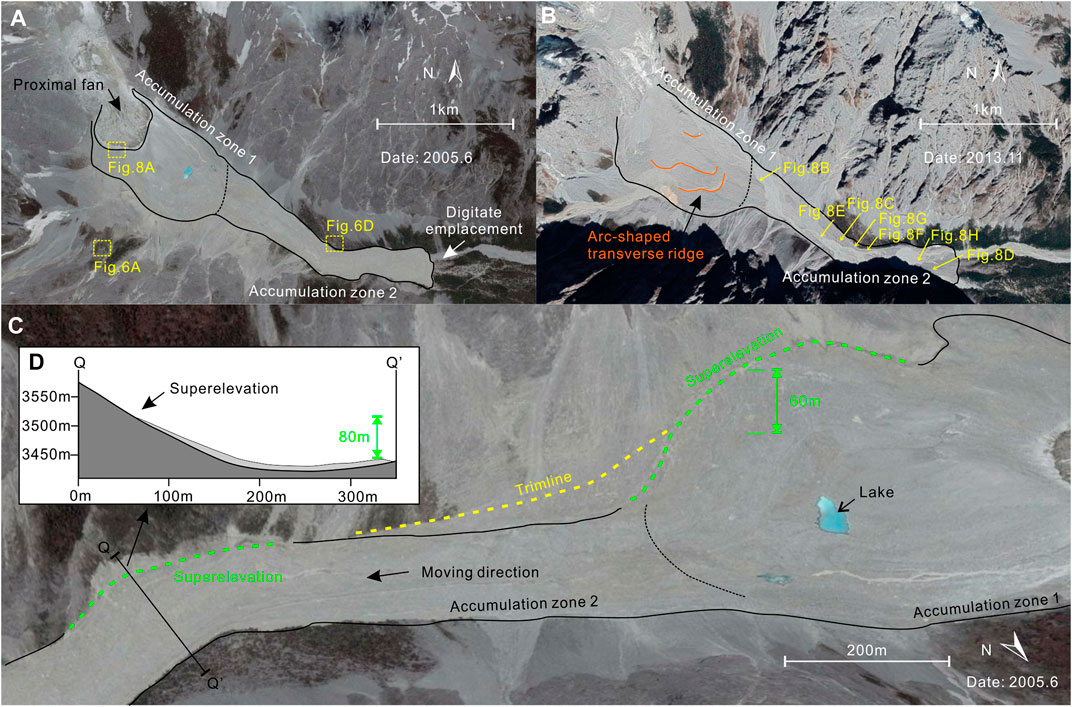
FIGURE 5. Remote sensing images of the accumulation zone in 2005 (A), 2013 (B), and 2018 (C). Superelevation in the path curves is also present (D).
According to the changes in the deposited width and extending direction (moving direction), the accumulation zone can be divided into two parts, accumulation zone 1 and accumulation zone 2 (Figure 3A). Accumulation zone 1 is about 0.414 km2, with an average slope of 22°. The maximum thickness of its deposits is over 60 m near the transition zone. Given the limited resolution of the satellite data from 2005 (Figure 5A), no surface landforms were identified in accumulation zone 1, except the 60 m superelevation and the trimline (Figure 5C). Although the superelevation and trimlines appear similar, “superelevation” indicates the run-up and always occurs at bends in the travel path, while “trimline” represents the thinning of the moving materials, which can be found along mostly straight sections (Strom and Abdrakhmatov, 2018). In addition, the 2008 field investigation indicates that after the landslide occurred, many trees on the south side of accumulation zone 1 were destroyed by the powerful blasts of air (Figure 5A, Figure 6A).
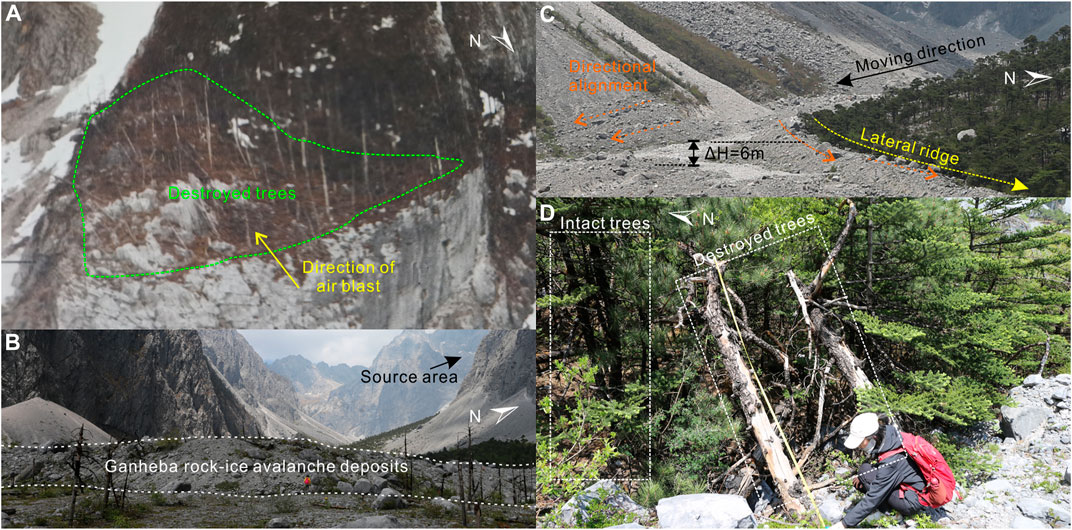
FIGURE 6. Destroyed trees in accumulation zone 1 (A); front deposits (B), lateral ridge (C), and destroyed trees (D) in accumulation zone 2.
Accumulation zone 2 is about 0.429 km2, with an average slope of 10°. The front of the distal deposits shows digitate emplacement (Figure 5A) with a thickness of about 5 m (Figure 6B). Based on the relatively flat surface of the deposits, the average thickness of accumulation zone 2 was determined to be approximately 8 m. Other detailed parameters are presented in Table 3. During the 2021 field investigation, no hummock or transverse ridges were observed. However, the lateral ridge (levee) is obvious on the north side of the deposits (Figure 6C), at 6 m higher than the middle deposits. On the outside of the lateral ridge, destroyed trees were observed frequently, while some trees further from the deposits were well-preserved (Figure 6D).
In this study, the volume of the deposits was estimated by the deposited area and the average thickness; the results are presented in Table 3. The volume of the failure mass was approximately
Based on its topographical and geomorphological characteristics, the velocity characteristics of the Ganheba rock–ice avalanche were estimated in the present study. Scheidegger (1973) proposed a method to estimate the velocity of a large landslide (>
where v is the estimated velocity, H is the height difference (m) from the top point of the source area to the estimated point, L is the corresponding horizontal length, and f is the apparent friction coefficient (f =0.4 in this study). The result was calculated based on the P–P′ profile (Figure 3B) and is represented by the red line in Figure 7.
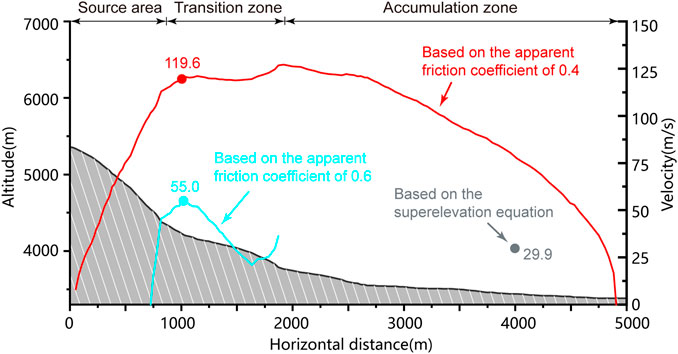
FIGURE 7. Velocity estimation for the Ganheba rock–ice avalanche based on the longitudinal profile and superelevation characteristics.
However, using the apparent friction coefficient as the global basal friction coefficient would underestimate the basal friction coefficient from the source area to the transition zone, because there is a strong spreading effect in rock–ice avalanches during their late moving stages (Davies et al., 1999). In this study, the failure mass was not considered to have been transformed into the avalanche mass during the early moving stage. Meanwhile, the basal friction coefficients for the source area and the transition zone were determined to be 0.6. Based on the aforementioned two assumptions, a velocity distribution from the source area to the transition zone was recalculated; this is illustrated in Figure 7 with a blue line. The recalculated result indicates that the velocity could have reached a maximum of 55 m/s at the platform thanks to the steep slope (48°), which is significantly smaller than the result using the apparent friction coefficient.
Considering that the movement of the avalanche mass in the accumulation zone is spreading rather than sliding as a rigid body, the superelevation at accumulation zone 2 was used to evaluate the velocity. Based on the Eq. 2 (Zeng et al., 2021), the velocity of the avalanche mass at the Q-Q’ (Figures 5C, D) was estimated to be 29.9 m/s:
where the radius of curvature
Although we were not able to quantify the movement velocity of the avalanche mass in the distal part, the presence of destroyed and intact trees near the distal deposits suggests that the avalanche was not moving extremely quickly (Figure 6D).
Sedimentary characteristics
Previous studies have identified a large amount of ice mass distributed on the surface of the proximal deposits in accumulation zone 1 (Figure 8A). The size of the largest ice mass was more than a hundred meters (Zhang et al., 2007; Cui, 2013), which means the fragmentation of the ice was not violent. The preservation of the huge intact ice mass indicates a differential fragmentation between ice and rock during the emplacement process of the Ganheba rock–ice avalanche. Meanwhile, this phenomenon suggests that the ice may not have been violently mixed into the avalanche mass. It is worth noting that the location of the ice mass could explain the geomorphic change in the proximal fan between 2005 and 2013 (Figures 5A, B). Based on the proximal fan, the volume of the ice mass can be estimated at
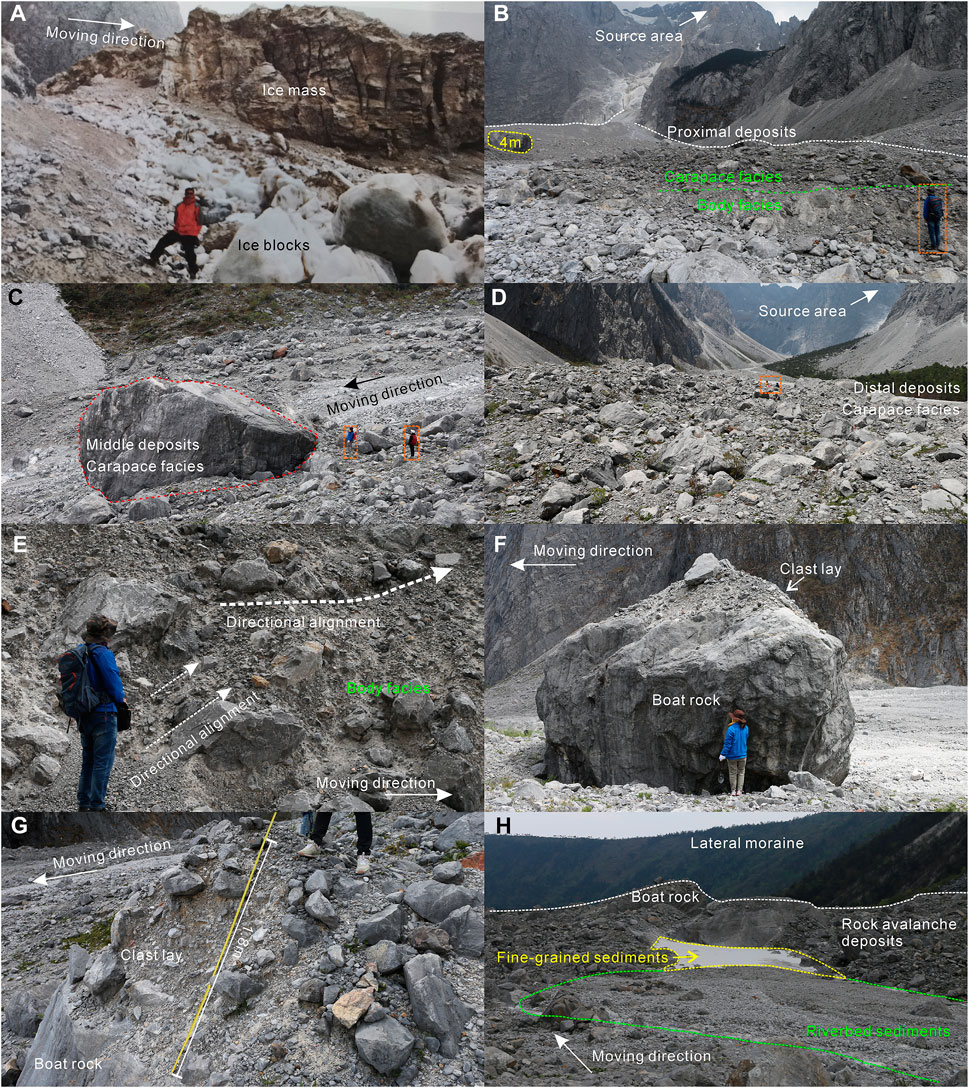
FIGURE 8. Sedimentary characteristics of the Ganheba rock–ice avalanche. (A) Ice mass on the surface of the proximal deposits. (B) Proximal deposits. (C) Middle deposits. (D) Distal deposits. (E) Body facies in distal deposits. (F) Boat rock with thin clast lying in middle deposits. (G) Boat rock with thick clast lay. (H) Riverbed sediments and fine-grained sediments on the surface of the distal deposits.
Dufresne et al. (2016) have proposed a facies model of rock avalanches, consisting of carapace, body, and basal facies. In the Ganheba rock–ice avalanche, the carapace and body facies were composed of gray limestone. Figures 8B–D show the characteristics of carapace facies on the proximal, middle, and distal deposits in accumulation zone 2. Most blocks in the carapace facies are about 50–100 cm in diameter, while some are over 1 m. We found that the block sizes and the number of the carapace facies roughly increase with travel distance, especially for metablocks (>1 m). Although glacial meltwater has modified the deposits, especially the carapace facies, we believe the local meltwater is insufficient to transport these tons, or even tens of tons, of metablocks.
Compared with carapace facies that may have undergone late modification, the solidified body facies are more representative of the original sedimentary characteristics. The body facies are matrix-supported with decimeter-sized clasts in both the proximal and distal deposits in accumulation zone 2. The directional alignment is widespread in body facies (Figure 8E), while jigsaw fractures are not observed. Most survivor clasts in the body facies are 50–100 cm, indicating that the spacing of the structure surfaces may play a controlling role. However, we did not find any evidence for the presence of ice in the middle or distal deposits in either the 2007 or the 2021 field investigation.
Interestingly, a special sedimentary structure of the clast layer accumulated on the metablock was found in the Ganheba rock–ice avalanche. The clast layer exhibits a similar matrix-supported structure as the body facies (Figures 8F, G). The metablock is usually more than 5 m in diameter. Cui has called this structure “boat rock” (Cui, 2013). This structure is similar to that observed in the Blanc and Lamplugh rock–ice avalanche deposits, where small clasts are piled on larger ones (Deline, 2009; Dufresne et al., 2019). We found that the thickness of some clasts laid in boat rocks is only about 10 cm (Figure 8F), while some can reach 1.8 m (Figure 8G).
Another interesting finding is that some rock avalanche deposits have been re-transported and rounded by glacial meltwater and have formed riverbed sediments on the surface of the rock avalanche deposits. In addition, white ultrafine-grained deposits were also found to be widely distributed on the surface of the distal deposits (Figure 8H); these are similar to glacial meal and are thought to be caused by the sorting action of the glacial meltwater.
Simulation results
Figure 9 and Figure 10 show the emplacement process and velocity characteristics, respectively, of the Ganheba rock–ice avalanche discrete element model. The entire process lasted 105 s with a travel distance of 4680 m, which is close to the actual horizontal distance of 4860 m.
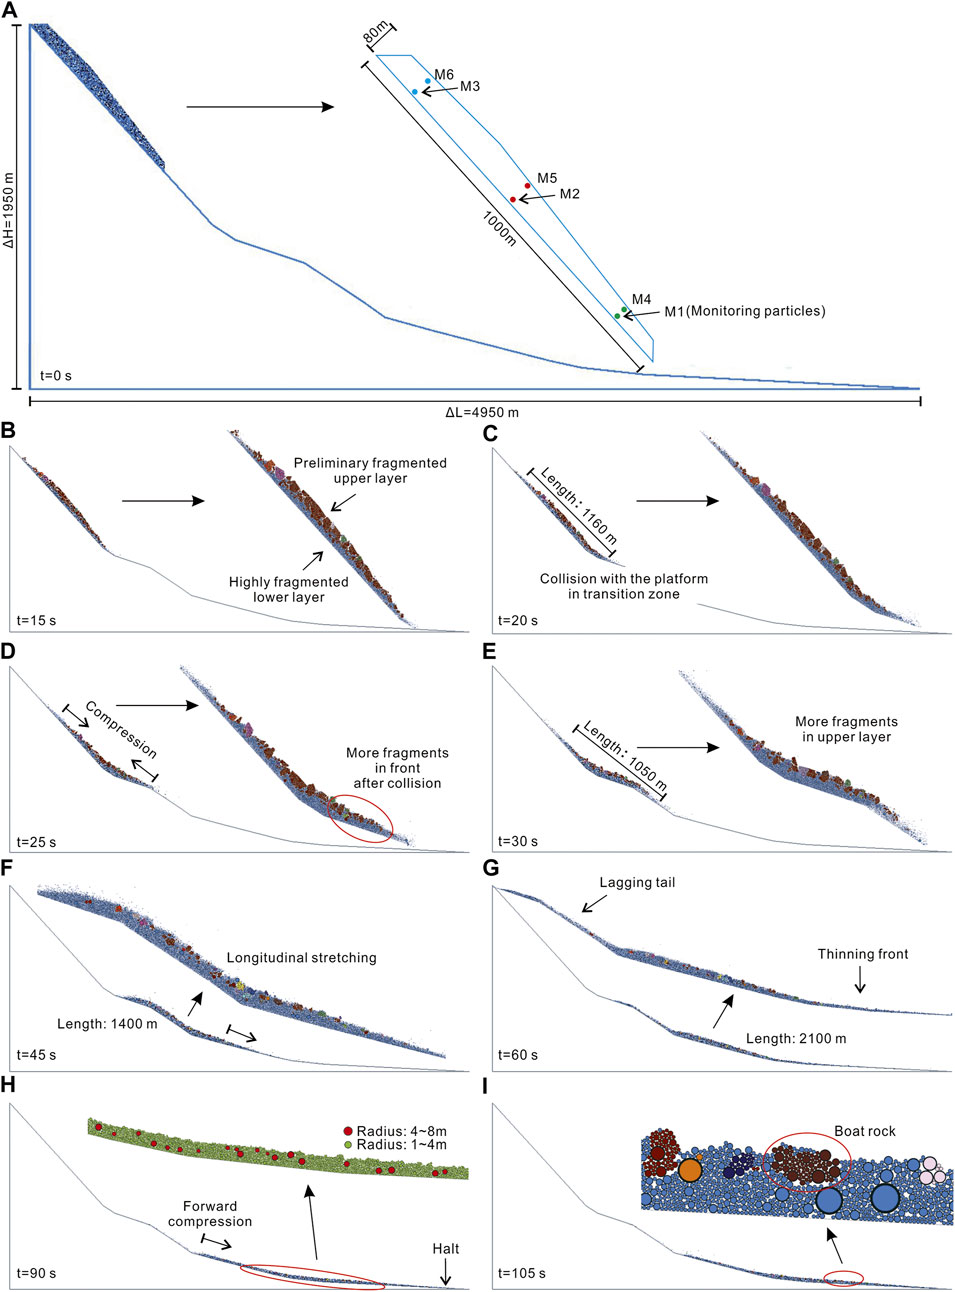
FIGURE 9. Emplacement process of the Ganheba rock–ice avalanche at different times in the discrete element model. In panel (A), M1∼M6 represent monitoring particles in the rock mass model. In panel (B–G) and (I), the different color blocks represent the fragments, and the blue ball couldn’t continue to break. In panel (H), different colors represent different particle sizes, and the results show that there is no obvious inverse grain-size effect.
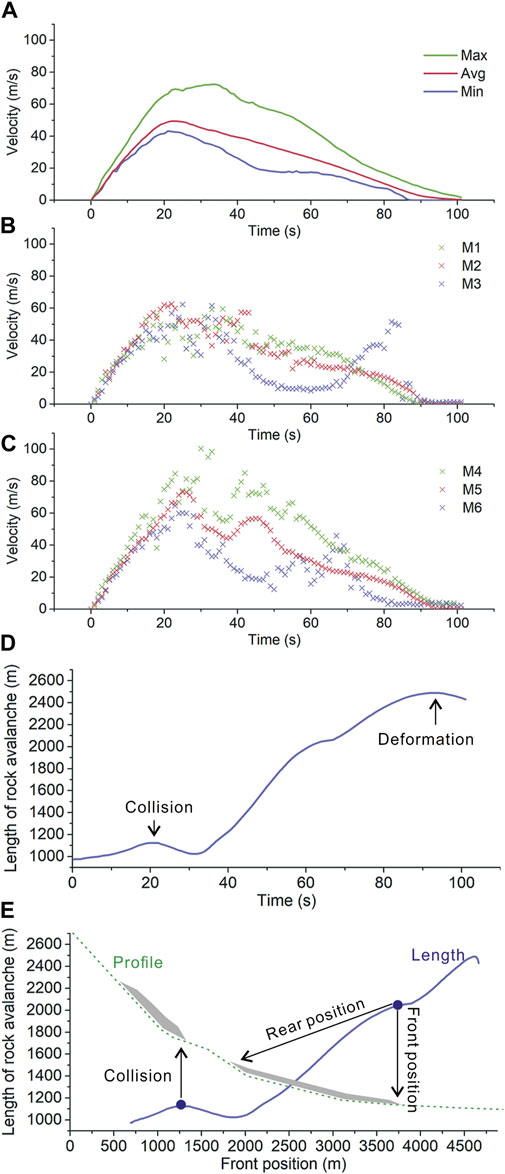
FIGURE 10. Maximum velocity (v95% in velocity distribution curve at a certain time), minimum velocity (v5% in velocity distribution curve at a certain time), average velocity (A), monitoring particle velocity (B, C), and change of avalanche mass length (D, E) during the emplacement process. When the front of the avalanche mass reached x=1,250 m (at 20 s), the front impacted the platform and the length of avalanche mass reached 1,150 m. When the front of the avalanche mass reached x=3,750 m (at 67 s), the rear reached x=1750 m, and increases in length became slower.
Figure 9 also illustrates the simulated fragmentation process. It is clear that the lower layer of the sliding body fragmented violently after initiation, with the upper layer exhibiting limited fragmentation. After the sliding body impacted the platform of the transition zone, fragmentation was enhanced and the sliding body transformed into the avalanche mass. When the avalanche mass entered the accumulation zone, its emplacement began to be controlled by a thinning and spreading process, with fragmentation becoming weak.
The velocity distribution of the monitoring particles M1 to M6 (Figure 9A, Figure10B) shows two peaks during the movement process. The first peak of all monitoring particles occurred around 23 s, while the second peak occurred at different times. Figure 10B also indicates that the particles in the upper layer moved more quickly than those in the lower layer and that the particles at the front moved faster than those at the rear. Although there are two velocity peaks for single particles, the average velocity distribution of the avalanche mass exhibits only one peak at ca. 23 s (Figure 10A). Based on the average velocity distribution, the movement of the avalanche mass between 0 and 23 s was an acceleration process. At this stage, the six monitoring particles did not show significant velocity differentiation, especially between 0 and 16 s. After 23 s, the avalanche mass exhibited a decelerating motion until it halted. It is worth noting that when the center of mass reached the platform at 23 s, the average velocity of the avalanche mass also reached its maximum. Figure 10 also indicates that the maximum velocity of the front (M4) could have reached 82 m/s, which is much larger than the estimate based on the sliding friction of 0.6 (Figure 7).
Consistent with the details presented in Figure 9, the length of the avalanche mass (Figures 10D, E) also shows that the avalanche mass was controlled by a longitudinal compression process (23–32 s) after the front collided with the platform in the transition zone. At 32 s, the length of the avalanche reached a minimum, which was only 86% of the length at 20 s. After 32 s, the avalanche mass resumed a stretching state because the front entered the accumulation zone. We also found that the length increased more quickly after 32 s than it did between 0 and 20 s. This finding indicates that the velocity differentiation between the front and rear became larger after 32 s, which coincides with the velocity distribution characteristics of the monitoring particles (Figures 10B, C). The other interesting phenomenon of Figures 10D, E is that between 60 and 75 s, the length increases became slower, which we considered to be caused by the lagging tail of avalanche mass (Figure 9E).
Although the avalanche mass stopped moving completely at 105 s, the front of the avalanche mass had halted earlier, at 95 s. Based on the velocity distribution (Figure 10), this inconsistency in stopping time could be attributed to the continued movement of the rear particles, which also caused a length reduction (Figures 10D, E). The numerical simulation result indicates that when the front reached x=3,900 m (the position of superelevation), the velocity of the front was reduced to ca. 40 m/s, which is close to the velocity estimated from the superelevation. Based on the velocity distribution and length change of the avalanche mass, the emplacement process of the discrete element model can be divided into four stages: acceleration (0–23 s), collision compression (23–32 s), spreading deceleration (32–95 s), and deformation (95–105 s).
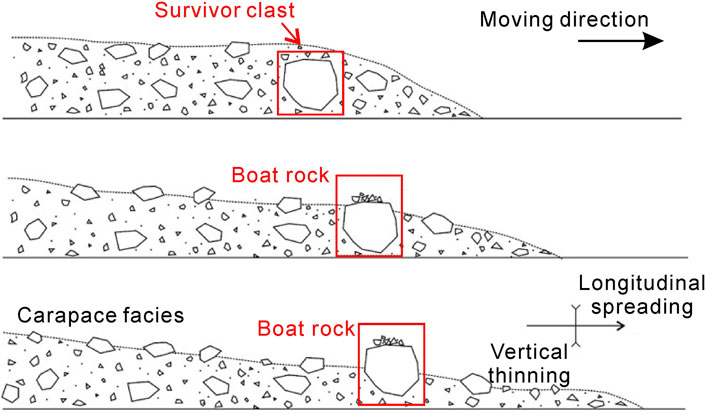
The discrete elements model also reproduced various sedimentary characteristics of the Ganheba rock–ice avalanche, including its stratified structures, carapace facies, and boat rocks (Figure 9I). Although the upper and lower layers did not move with the same velocity, there was no violent mixing between them. Figure 9H also shows that large-size particles remained uniformly distributed in the avalanche mass rather than migrating to the upper layer, which suggests that particle migration in the vertical direction was very weak. During the spreading stage, the large fragments on the surface of the avalanche mass, which make up the carapace facies, were preserved. This process also illustrates the fact that the movement of the carapace facies is a passive process (Dufresne et al., 2016; Dufresne et al., 2019; Zhang et al., 2019; Chen et al., 2022).
Discussion
Trigger factors
Seismic activity near the study area is frequent, and at least 10 earthquakes have occurred within 20 km of Yulong Mountain since the 20th century. In 1996, the Lijiang earthquake (M7) induced more than 200 landslides, including some rockfalls triggered in the study area, where the seismic intensity was Ⅸ (Tang and Grunert, 1999). However, seismic data indicate that the occurrence of the Ganheba rock–ice avalanche was not directly related to earthquakes in 2004. Nevertheless, these frequent historical earthquakes may have caused accumulated damage to the bedrock in the study area (Gischig et al., 2016).
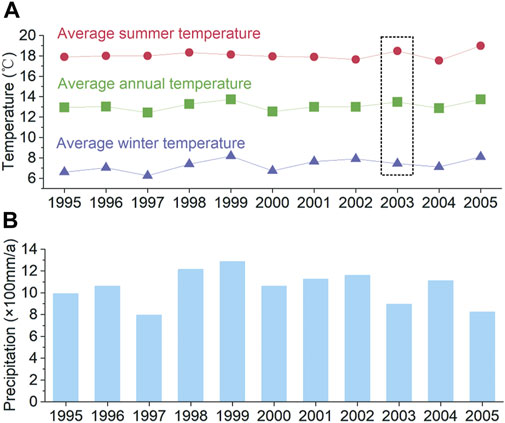
Recently, the influence of permafrost degradation and increased freeze–thaw action in the evolution of rock avalanches has been widely studied (Fischer et al., 2006; Coe et al., 2018; Bessette-Kirton and Coe, 2020). In summer, ice-melt water penetrates the structural surfaces and fissures of the rock body, and in winter, it freezes back into ice, causing expansion of fissures and reducing the strength of the rock (Gruber and Haeberli, 2007; Hasler et al., 2012). The source area of the Ganheba rock–ice avalanche is between 4,337 and 5400 m above sea level and near the Yanggongjiang-5 glacier. Previous studies have found that the glacier area of Yanggongjiang-5 plummeted from 0.72 km2 to 0.052 km2 between 1957 and 2001 (Du et al., 2013). Local meteorological data show that the Lijiang region experienced historically high summer temperatures and less precipitation than usual in 2003 (Figure 11), which would lead to extensive melting of the ice and strong freeze–thaw action from 2003 to 2004. Since this rock–ice avalanche occurred in April, we considered the rising temperature in spring to be the direct cause of this rock mass destabilization, which would enhance the ice melt, reduce the friction within the fractures (Faillettaz et al., 2015), and generate hydrostatic pressure in the bedrock (Gruber and Haeberli, 2007).
Remote sensing images and field investigation have indicated that the protruding rock body, developed fissures, and structure surface contributed to the formation of the failure mass in the source area. Therefore, geological structures, historical earthquake effects, and freeze–thaw action can be identified as the mechanisms behind the failure of the Ganheba rock–ice avalanche. In addition, karstification may influence the formation of the failure mass, based on the regional lithology and the karst hole in accumulation zone 1 in field observations (Cui, 2013). In general, the failure of the Ganheba rock–ice avalanche arose from complex long-term actions rather than an episode of heavy rainfall or an earthquake.
Emplacement process
Although the Ganheba rock–ice avalanche is a modern landslide, its geomorphic and sedimentary characteristics have been modified by glacial meltwater and late deformation. Two sets of field survey records historical remote sensing images, and 2D discrete element modeling (PFC2D) provide important insight into the emplacement process of the Ganheba rock–ice avalanche.
Its morphological characteristics suggest that the Ganheba rock–ice avalanche slid down the south slope of Yulong Mountain (5,350 above sea level), initially moving in a 120° direction and then turning to 85°. The entire emplacement process was controlled by the valley topography. The distal deposits are located at an altitude of approximately 3,379 m, with a run-out of 4,860 m from the source area. The H/L ratio was determined to be 0.4. The 2007 field investigation and remote sensing images indicate that the failure mass is a double-layered structure, with ice on the top and rock on the bottom. However, most of the ice was accumulated on the surface of the proximal deposits. Thus, it was considered not to have been mixed into the avalanche mass during its movement. In contrast, the snow on the platform in the transition zone may have been entrained by the avalanche mass (Figure 2A), although we did not find the relevant sedimentary features in the deposits. Aaron and McDougall (2019) have pointed out that snow entrainment could increase the saturation level of the materials and enhance mobility.
Unfortunately, because the basal layer is not exposed, the underlying substrate was not observed during the field investigation. However, the widespread distributed riverbed sediments and ultrafine-grained sediments on the surface of the deposits lead us to believe that the valley prior to the Ganheba rock–ice avalanche was also covered by fluvial deposits, due to the glacial meltwater and large amounts of fine clasts from the frequent rockfall. There is no doubt that those fluvial deposits could act as a low-strength lubrication layer (Hungr and Evans, 2004; Aaron and McDougall, 2019).
To compare the mobility of the Ganheba rock–ice avalanche with other rock and rock–ice avalanches, the regression equations (
Based on the assumptions of the low-strength lubrication layer and small ice and snow entrainment, the internal friction coefficient (ball–ball) in the discrete element model was set to 0.5, and the basal friction coefficient (ball–wall) was set to different values in different zones (0.6 for the source area and the transition zone, and 0.23 for the accumulation zone). The value of 0.23 is the result of repeated tests in which the simulated Ganheba rock–ice avalanche could realize the expected travel distance. These simulation results, while preliminary, suggest that it is inappropriate to use apparent friction coefficients or excessively small global friction coefficients for simulation of rock and rock–ice avalanches because improper friction coefficient settings will affect the velocity estimation.
Although Figure 7 gives the velocity estimation based on the apparent friction coefficient, this result is considered physically meaningless (Legros, 2002). The velocity distribution based on the apparent friction coefficient represents the movement of a particle from the top point of the source area to the toe of the accumulation, which clearly does not correspond to the real situation. In contrast, the rigid body assumption and the 0.6 friction coefficient assumption from the source area to the platform in the transition should be accepted because the sliding body had not undergone violent fragmentation and stretching before the collision. The velocity estimation based on the aforementioned two assumptions is consistent with the average velocity calculated from the numerical simulation (v=55 m/s). It should be noted that after the collision, the front of the sliding body immediately transformed into the avalanche mass and continued to accelerate, so the maximum velocity of the front could have reached 82 m/s. Therefore, the rigid body assumption should be discarded after the collision has occurred. Meanwhile, 82 m/s should be considered as the maximum front velocity of this rock–ice avalanche.
The inverse calculation of the velocity of the highly fragmented avalanche mass is more difficult in the late moving stage than in the early moving stage because it is more like a flow than a rigid body. In this study, a superelevation 900 m from the front of the deposits was employed to estimate the velocity (Figure 5C). The result indicates that when the avalanche mass reached this path curve, the velocity had decreased to 29.9 m/s. This result is considered credible because the trees on both sides of the avalanche mass were not destroyed by the air wave (Figure 6D), which means that the velocity of the avalanche mass was not very high at this position. Although the velocity for the corresponding position from the numerical simulation is slightly larger than the estimation based on superelevation, this degree of error could be acceptable. Considering that the numerical simulation meets our expectations for both travel distance and velocity characteristics, we considered that the simulated result could reflect the emplacement process of the Ganheba rock–ice avalanche to some extent. Therefore, we believe that the entire emplacement of this rock–ice avalanche lasted approximately 105 s, which is similar to the duration of other rock and rock–ice avalanches (Crosta et al., 2007; Sosio et al., 2008; Cox et al., 2015; Zhu et al., 2019; Gao et al., 2020).
The materials of the Ganheba rock–ice avalanche are highly fragmented, but the grain size distribution is very complex, especially for the carapace facies. Previous studies have observed that carapace facies are dependent on the fracturing of the bedrock in the source area (Charrière et al., 2016; Strom and Abdrakhmatov, 2018). In the Ganheba rock–ice avalanche, the spacing of the structural surface is variable, so its complex carapace facies could be interpreted. When we noticed the intact ice mass on the surface of the proximal deposits, we realized that the violent collision with the terrain could not have left the failure mass completely fragmented and that the initial structural surface had played a crucial role (Dufresne et al., 2016; Chen et al., 2022). Meanwhile, the well-preserved ice on the proximal surface also suggests that ice may not have played a role in enhancing mobility, except for the application of overlying loads. Unfortunately, the ice–rock double-layered structure was not detected in the numerical simulation, perhaps limited by the small number of particles. The discrete elements model reproduced the progressive fragmentation process from bottom to top in the sliding body, which negates the migration of the particles in the vertical direction and supports carapace facies as the result of differential fragmentation. In addition, the formation of the boat rocks, which is caused by the thinning of the avalanche mass and the exposure of the survivor clasts, was also reproduced in the numerical simulation (Figure 12).
Based on the geomorphic and sedimentary characteristics of the Ganheba rock–ice avalanche and on a numerical simulation of the avalanche, the kinematic process of this rock–ice avalanche is proposed to have occurred as follows:
(1) Failure and acceleration stage: The failure mass (
(2) Collision compression stage: When the sliding body reached the platform in the transition zone, it violently collided with the terrain. Therefore, the sliding body underwent further violent fragmentation and completely transformed into avalanche mass. During this process, the snow on the platform was scraped off and mixed into the avalanche mass. Meanwhile, the rear part of the avalanche mass pushed the front part, resulting in longitudinal compression and momentum transfer. The front velocity reached a maximum of 82 m/s.
(3) Spreading deceleration stage: When the avalanche mass reached the accumulation zone, under the influence of the topography, it turned eastward into the narrow glacier valley. The multiple terrain collisions resulted in energy dissipation. Controlled by the low-strength lubrication layer (fluvial sediments) and laterally confined terrain, the avalanche mass spread forward as a laminar flow. During this process, the avalanche mass underwent constant longitudinal stretching and thinning. At 95 s, based on the numerical simulation, the front of the avalanche mass eventually stopped near the exit of the glacier valley.
(4) Deformation stage: Although the front of the Ganheba rock–ice avalanche stopped moving at 95 s, the numerical simulation showed that the rear of the avalanche mass continued to move until 105 s, resulting in a deformation of the avalanche mass. Although relevant geomorphic evidence of the deformation stage was not found in the Ganheba rock–ice avalanche, we observed digitate emplacement in the transition zone of the Walai rock avalanche (Chen et al., 2022), which proves the continued moving of the rear materials and the existence of the deformation stage. It is worth noting that during the entire emplacement process, ice and snow did not play an important role in enhancing mobility because most of it had accumulated in the proximal fan and no relevant evidence was found in the middle and distal deposits.
Conclusion
Recently, rock–ice avalanches have been occurring more frequently at high altitudes around the world (Coe et al., 2018; Leinss et al., 2021; Fan et al., 2022). Since Yulong Mountain is the southernmost snow mountain in China, the failure of the giant rock mass here could offer important insights into the evolution of the rock–ice avalanche in high-altitude regions of China. In this study, we conducted an analysis of historical remote sensing images, a field investigation, and 2D discrete element modeling. The formation and emplacement process of the Ganheba rock–ice avalanche have been discussed in detail. The significant findings and results of this study can be summarized as follows:
(1) The failure of the Ganheba rock–ice avalanche was caused by the long-term effects of historical seismic effects and freeze–thaw action. The failure mass was an ice–rock double-layered structure, with a rock volume of
(2) Under the control of the local topography and low-strength lubrication materials, the Ganheba rock–ice avalanche traveled a horizontal distance of 4860 m, with an H/L ratio of 0.4 and a moving time of 105 s. The platform in the transition zone facilitated the fragmentation of the failure mass. Based on the velocity estimation from its geomorphological characteristics and the numerical simulation, the emplacement process of the Ganheba rock–ice avalanche can be divided into four stages: failure and acceleration, collision compression, spreading deceleration, and deformation. The maximum velocity of the front of the avalanche mass was determined to be 82 m/s.
(3) The progressive fragmentation of the Ganheba rock–ice avalanche was reproduced in the numerical simulation. The sedimentary characteristics—including the nearly intact ice mass on the proximal deposits and the variable block size in carapace facies—further confirm the differential fragmentation and the notion that the initial structures were important in fragmentation. Spreading of the avalanche mass can also be described by the numerical simulation, and the widely observed directional alignments and boat rocks confirm that the gradual thinning and spreading process controlled the emplacement process of the avalanche mass in the accumulation zone.
Data availability statement
The original contributions presented in the study are included in the article/supplementary material; further inquiries can be directed to the corresponding author.
Author contributions
JC: field investigation, writing—original manuscript, content layout, and project administration; RC: field investigation, drawing graphs, and review and editing; LS: field investigation, analysis of results, and review and editing; ZC: field investigation, and review and editing. SC: Review and editing.
Funding
This work was supported by the Special Foundation for National Science and Technology Basic Research Program of China (grant number 2019FY101605), the National Key Research and Development Program of China (grant number 2018YFC1505003), and the National Natural Science Foundation of China (grant number 41571012). National Pre-research Funds of Hebei GEO University in 2023 (KY2022005).
Conflict of interest
The authors declare that the research was conducted in the absence of any commercial or financial relationships that could be construed as a potential conflict of interest.
Publisher’s note
All claims expressed in this article are solely those of the authors and do not necessarily represent those of their affiliated organizations, or those of the publisher, the editors, and the reviewers. Any product that may be evaluated in this article, or claim that may be made by its manufacturer, is not guaranteed or endorsed by the publisher.
References
Aaron, J., McDougall, S., Moore, J. R., Coe, J. A., and Hungr, O. (2017). The role of initial coherence and path materials in the dynamics of three rock avalanche case histories. Geoenvironmental Disasters 4, 5. doi:10.1186/s40677-017-0070-4
Aaron, J., and McDougall, S. (2019). Rock avalanche mobility: The role of path material. Eng. Geol. 257, 105126. doi:10.1016/j.enggeo.2019.05.003
Bessette-Kirton, E. K., and Coe, J. A. (2020). A 36-year record of rock avalanches in the saint elias mountains of Alaska, with implications for future hazards. Front. Earth Sci. 8, 293. doi:10.3389/feart.2020.00293
Bottino, G., Chiarle, M., Joly, A., and Mortara, G. (2002). Modelling rock avalanches and their relation to permafrost degradation in glacial environments. Permafr. Periglac. Process. 13, 283–288. doi:10.1002/ppp.432
Charrière, M., Humair, F., Froese, C., Jaboyedoff, M., Pedrazzini, A., and Longchamp, C. (2016). From the source area to the deposit: Collapse, fragmentation, and propagation of the Frank Slide. GSA Bull. 128, B31243.1–351. doi:10.1130/B31243.1
Chen, R., Chen, J., Xu, H., Cui, Z., He, Q., and Gao, C. (2022). The morphology and sedimentology of the Walai rock avalanche in southern China, with implications for confined rock avalanches. Geomorphology 413, 108346. doi:10.1016/j.geomorph.2022.108346
Coe, J. A., Bessette-Kirton, E. K., and Geertsema, M. (2018). Increasing rock-avalanche size and mobility in glacier bay national park and preserve, Alaska detected from 1984 to 2016 Landsat imagery. Landslides 15, 393–407. doi:10.1007/s10346-017-0879-7
Cox, S. C., McSaveney, M. J., Spencer, J., Allen, S. K., Ashraf, S., Hancox, G. T., et al. (2015). Rock avalanche on 14 july 2014 from hillary ridge, aoraki/mount cook, New Zealand. Landslides 12, 395–402. doi:10.1007/s10346-015-0556-7
Crosta, G. B., Frattini, P., and Fusi, N. (2007). Fragmentation in the val pola rock avalanche, Italian alps. J. Geophys. Res. Earth Surf. 112, F01006. doi:10.1029/2005JF000455
Cui, Z. (2013). Diamicton and environment. Heibei: Hebei Science and Technology Publishing. (In Chinese, with English abstracts).
Davies, T. R., McSaveney, M. J., and Hodgson, K. A. (1999). A fragmentation-spreading model for long-runout rock avalanches. Can. Geotech. J. 36, 1096–1110. doi:10.1139/t99-067
De Blasio, F. V. (2014). Friction and dynamics of rock avalanches travelling on glaciers. Geomorphology 213, 88–98. doi:10.1016/j.geomorph.2014.01.001
Delaney, K. B., and Evans, S. G. (2014). The 1997 Mount Munday landslide (British Columbia) and the behaviour of rock avalanches on glacier surfaces. Landslides 11, 1019–1036. doi:10.1007/s10346-013-0456-7
Deline, P. (2009). Interactions between rock avalanches and glaciers in the Mont Blanc massif during the late Holocene. Quat. Sci. Rev. 28, 1070–1083. doi:10.1016/j.quascirev.2008.09.025
Deng, Q., Gong, L., Zhang, L., Yuan, R., Xue, Y., Geng, X., et al. (2017). Simulating dynamic processes and hypermobility mechanisms of the Wenjiagou rock avalanche triggered by the 2008 Wenchuan earthquake using discrete element modelling. Bull. Eng. Geol. Environ. 76, 923–936. doi:10.1007/s10064-016-0914-2
Du, J. K., Xin, H., He, Y., Niu, H., Pu, T., Cao, W., et al. (2013). Response of modern monsoon temperate glacier to climate change in Yulong Mountain. Sci. Geogr. Sin. 33, 890–896.
Dufresne, A. (2014). “An overview of rock avalanche-substrate interactions,” in Landslide science for a safer geoenvironment. Editors K. Sassa, P. Canuti, and Y. Yin (Cham: Springer International Publishing), 345–349. doi:10.1007/978-3-319-04999-1_49
Dufresne, A., Bösmeier, A., and Prager, C. (2016). Sedimentology of rock avalanche deposits – case study and review. Earth-Science Rev. 163, 234–259. doi:10.1016/j.earscirev.2016.10.002
Dufresne, A. (2017). “Rock avalanche sedimentology—recent progress,” in Advancing culture of living with landslides. Editors M. Mikos, B. Tiwari, Y. Yin, and K. Sassa (Cham: Springer International Publishing), 117–122. doi:10.1007/978-3-319-53498-5_14
Dufresne, A., Wolken, G. J., Hibert, C., Bessette-Kirton, E. K., Coe, J. A., Geertsema, M., et al. (2019). The 2016 Lamplugh rock avalanche, Alaska: Deposit structures and emplacement dynamics. Landslides 16, 2301–2319. doi:10.1007/s10346-019-01225-4
Evans, S. G. (1989). Catastrophic rock avalanches in glacial environments. Int. J. Rock Mech. Min. Sci. Geomechanics Abstr. 26, 337. doi:10.1016/0148-9062(89)91838-X
Evans, S. G., and Delaney, K. B. (2015). “Chapter 16 - catastrophic mass flows in the mountain glacial environment,” in Snow and ice-related hazards, risks, and disasters hazards and disasters series. Editors J. F. Shroder, W. Haeberli, and C. Whiteman (Boston: Academic Press), 563–606. doi:10.1016/B978-0-12-394849-6.00016-0
Faillettaz, J., Funk, M., and Vincent, C. (2015). Avalanching glacier instabilities: Review on processes and early warning perspectives. Rev. Geophys. 53, 203–224. doi:10.1002/2014rg000466
Fan, X., Yunus, A. P., Yang, Y.-H., Siva Subramanian, S., Zou, C., Dai, L., et al. (2022). Imminent threat of rock–ice avalanches in high mountain asia. Sci. Total Environ. 836, 155380. doi:10.1016/j.scitotenv.2022.155380
Fischer, L., Kääb, A., Huggel, C., and Noetzli, J. (2006). Geology, glacier retreat and permafrost degradation as controlling factors of slope instabilities in a high-mountain rock wall: The monte rosa east face. Nat. Hazards Earth Syst. Sci. 6, 761–772. doi:10.5194/nhess-6-761-2006
Gao, G., Meguid, M. A., Chouinard, L. E., and Xu, C. (2020). Insights into the transport and fragmentation characteristics of earthquake-induced rock avalanche: Numerical study. Int. J. Geomechanics 20, 04020157. doi:10.1061/(ASCE)GM.1943-5622.0001800
Gischig, V., Preisig, G., and Eberhardt, E. (2016). Numerical investigation of seismically induced rock mass fatigue as a mechanism contributing to the progressive failure of deep-seated landslides. Rock Mech. Rock Eng. 49, 2457–2478. doi:10.1007/s00603-015-0821-z
Gnyawali, K. R., Xing, A., and Zhuang, Y. (2020). Dynamic analysis of the multi-staged ice–rock debris avalanche in the Langtang valley triggered by the 2015 Gorkha earthquake, Nepal. Eng. Geol. 265, 105440. doi:10.1016/j.enggeo.2019.105440
Gruber, S., and Haeberli, W. (2007). Permafrost in steep bedrock slopes and its temperature-related destabilization following climate change. J. Geophys. Res. Earth Surf. 112, F02S18. doi:10.1029/2006jf000547
Han, Z., Guo, S., Xiang, H., Zhang, J., and Ran, Y. (2004). Seismotectonic environment of occurring the February 3, 1996 Lijiang M=7.0 earthquake, Yunnan province. Acta seimol. Sin. 17, 453–463. doi:10.1007/s11589-004-0025-1
Hasler, A., Gruber, S., and Beutel, J. (2012). Kinematics of steep bedrock permafrost. J. Geophys. Res. Earth Surf. 117. doi:10.1029/2011jf001981
Hewitt, K. (1998). Catastrophic landslides and their effects on the Upper Indus streams, Karakoram Himalaya, northern Pakistan. Geomorphology 26, 47–80. doi:10.1016/S0169-555X(98)00051-8
Huang, F. G., Shi, S. X., and Su, Y. J. (2000). Study on seismicity in Yunnan in the 20th century. J. Seismol. Res. 23, 1–9.
Huggel, C., Zgraggen-Oswald, S., Haeberli, W., Kaab, A., Polkvoj, A., Galushkin, I., et al. (2005). The 2002 rock/ice avalanche at kolka/karmadon, Russian caucasus: Assessment of extraordinary avalanche formation and mobility, and application of QuickBird satellite imagery. Nat. Hazards Earth Syst. Sci. 5, 173–187. doi:10.5194/nhess-5-173-2005
Hungr, O., and Evans, S. G. (2004). Entrainment of debris in rock avalanches: An analysis of a long run-out mechanism. Geol. Soc. Am. Bull. 116, 1240. doi:10.1130/B25362.1
Lai, G., Jiang, C., Wang, W., Han, L., and Deng, S. (2021). Correlation between the water temperature and water level data at the Lijiang well in Yunnan, China, and its implication for local earthquake prediction. Eur. Phys. J. Spec. Top. 230, 275–285. doi:10.1140/epjst/e2020-000255-3
Legros, F. (2002). The mobility of long-runout landslides. Eng. Geol. 63, 301–331. doi:10.1016/S0013-7952(01)00090-4
Leinss, S., Bernardini, E., Jacquemart, M., and Dokukin, M. (2021). Glacier detachments and rock–ice avalanches in the Petra Pervogo range, Tajikistan (1973–2019). Nat. Hazards Earth Syst. Sci. 21, 1409–1429. doi:10.5194/nhess-21-1409-2021
McSaveney, M. J. (1978). “Chapter 6 - Sherman Glacier Rock Avalanche, Alaska, U.S.A,” in Developments in geotechnical engineering rockslides and avalanches, 1. Editor B. Voight (Elsevier), 197–258. doi:10.1016/B978-0-444-41507-3.50014-3
Mcsaveney, M. J. (2002). Recent Rockfalls and Rock Avalanches in Mount Cook National Park, New Zealand. GSA Rev. Eng. Geol. 15, 35–70.
Pudasaini, S. P., and Krautblatter, M. (2014). A two-phase mechanical model for rock–ice avalanches. J. Geophys. Res. Earth Surf. 119, 2272–2290. doi:10.1002/2014JF003183
Pudasaini, S. P., and Krautblatter, M. (2021). The mechanics of landslide mobility with erosion. Nat. Commun. 12, 6793. doi:10.1038/s41467-021-26959-5
Sansone, S., Zugliani, D., and Rosatti, G. (2021). A mathematical framework for modelling rock–ice avalanches. J. Fluid Mech. 919, A8. doi:10.1017/jfm.2021.348
Scheidegger, A. E. (1973). On the prediction of the reach and velocity of catastrophic landslides. Rock Mech. 5, 231–236. doi:10.1007/bf01301796
Schneider, D., Bartelt, P., Caplan-Auerbach, J., Christen, M., Huggel, C., and McArdell, B. W. (2010). Insights into rock–ice avalanche dynamics by combined analysis of seismic recordings and a numerical avalanche model. J. Geophys. Res. Earth Surf. 115, F04026. doi:10.1029/2010JF001734
Schneider, D., Kaitna, R., Dietrich, W. E., Hsu, L., Huggel, C., and McArdell, B. W. (2011). Frictional behavior of granular gravel-ice mixtures in vertically rotating drum experiments and implications for rock–ice avalanches. Cold Regions Sci. Technol. 69, 70–90. doi:10.1016/j.coldregions.2011.07.001
Shugar, D. H., and Clague, J. J. (2011). The sedimentology and geomorphology of rock avalanche deposits on glaciers: Rock avalanches on glaciers. Sedimentology 58, 1762–1783. doi:10.1111/j.1365-3091.2011.01238.x
Shugar, D. H., Jacquemart, M., Shean, D., Bhushan, S., Upadhyay, K., Sattar, A., et al. (2021). A massive rock and ice avalanche caused the 2021 disaster at Chamoli, Indian Himalaya. Science 373, 300–306. doi:10.1126/science.abh4455
Sosio, R. (2015). “Chapter 7 - Rock–Snow–Ice Avalanches,” in Landslide hazards, risks, and disasters hazards and disasters series. Editors J. F. Shroder, and T. Davies (Boston: Academic Press), 191–240. doi:10.1016/B978-0-12-396452-6.00007-0
Sosio, R., Crosta, G. B., Chen, J. H., and Hungr, O. (2012). Modelling rock avalanche propagation onto glaciers. Quat. Sci. Rev. 47, 23–40. doi:10.1016/j.quascirev.2012.05.010
Sosio, R., Crosta, G. B., and Hungr, O. (2008). Complete dynamic modeling calibration for the Thurwieser rock avalanche (Italian Central Alps). Eng. Geol. 100, 11–26. doi:10.1016/j.enggeo.2008.02.012
Strom, A., and Abdrakhmatov, K. (2018). “Chapter 12 - Morphological and Structural Evidence of Rockslides’ (Rock Avalanches’) Motion Mechanism(s),” in Rockslides and rock avalanches of central Asia. Editors A. Strom, and K. Abdrakhmatov (Elsevier), 365–379. doi:10.1016/B978-0-12-803204-6.00012-0
Strom, A., Li, L., and Lan, H. (2019). Rock avalanche mobility: optimal characterization and the effects of confinement. Landslides 16, 1437–1452. doi:10.1007/s10346-019-01181-z
Tang, C., and Grunert, J. (1999). Inventory of landslides triggered by the 1996 Lijiang earthquake, Yunnan Province, China. Trans. Jpn. Geomorphol. Union 20, 335–349.
Wang, S., Che, Y., Pang, H., Du, J., and Zhang, Z. (2020). Accelerated changes of glaciers in the Yulong Snow Mountain, Southeast Qinghai-Tibetan Plateau. Reg. Environ. Change 20, 38. doi:10.1007/s10113-020-01624-7
Wang, Y., Cheng, Q., Lin, Q., Li, K., and Yang, H. (2018). Insights into the kinematics and dynamics of the Luanshibao rock avalanche (Tibetan Plateau, China) based on its complex surface landforms. Geomorphology 317, 170–183. doi:10.1016/j.geomorph.2018.05.025
Wang, Y., Cheng, Q., Shi, A., Yuan, Y., Qiu, Y., and Yin, B. (2019). Characteristics and transport mechanism of the Nyixoi Chongco rock avalanche on the Tibetan Plateau, China. Geomorphology 343, 92–105. doi:10.1016/j.geomorph.2019.07.002
Wang, Y., Cheng, Q., Yuan, Y., Wang, J., Qiu, Y., Yin, B., et al. (2020). Emplacement mechanisms of the Tagarma rock avalanche on the Pamir-western Himalayan syntaxis of the Tibetan Plateau, China. Landslides 17, 527–542. doi:10.1007/s10346-019-01298-1
Wu, Z., Zhang, Y., Hu, D., Zhao, X., and Ye, P. (2008). Exploration of the late quaternary normal faulting and its kinetic mechanism in the Haba-Yulong Xueshan east rift, Northwest Yunnan. Sci. in China: Series D. 11, 1361–1375.
Yan, X., Ma, J., Ma, X., Wang, S., Chen, P., and He, Y. (2021a). Accelerated glacier mass loss with atmospheric changes on Mt. Yulong, Southeastern Tibetan Plateau. J. Hydrology 603, 126931. doi:10.1016/j.jhydrol.2021.126931
Yan, X., Shi, Z., Wang, G., Zhang, H., and Bi, E. (2021b). Detection of possible hydrological precursor anomalies using long short-term memory: A case study of the 1996 Lijiang earthquake. J. Hydrology 599, 126369. doi:10.1016/j.jhydrol.2021.126369
Yang, H., Fan, X., and Pei, X. (2019). Front velocity and deposition characteristics of debris avalanches using physical modeling test. Arab. J. Geosci. 12, 569. doi:10.1007/s12517-019-4692-6
Yang, Q., Su, Z., Chen, L., and Huang, L. (2015). Flume tests on influence of ice to mobility of rock–ice avalanches. J. Eng. Geol. 23 (6), 1117–1126.
Zeng, Q., Zhang, L., Davies, T., Yuan, G., Xue, X., Wei, R., et al. (2019). Morphology and inner structure of Luanshibao rock avalanche in Litang, China and its implications for long-runout mechanisms. Eng. Geol. 260, 105216. doi:10.1016/j.enggeo.2019.105216
Zeng, Q., Zhu, J., Liao, L., Wei, R., Ma, F., Ma, X., et al. (2021). High mobility of the channelized ancient Linka rock avalanche within the Bangong - Nujiang suture zone, SE Tibetan Plateau. Eng. Geol. 282, 105999. doi:10.1016/j.enggeo.2021.105999
Zhang, M., Wu, L., Zhang, J., and Li, L. (2019). The 2009 Jiweishan rock avalanche, Wulong, China: deposit characteristics and implications for its fragmentation. Landslides 16, 893–906. doi:10.1007/s10346-019-01142-6
Zhang, N., He, Y., He, X., Pang, H., and Zhao, J. (2007). The Analysis icefall at Mt. Yulong. J. Mt. Sci. 125, 412–418.
Zhang, S., Yin, Y., Li, H., Wang, W., and Zhou, J. (2022). Transport process and mechanism of the Hongshiyan rock avalanche triggered by the 2014 Ludian earthquake, China. Landslides 19, 1987–2004. doi:10.1007/s10346-022-01878-8
Zhang, T., Gao, Y., Li, B., Yin, Y., Liu, X., Gao, H., et al. (2023). Characteristics of rock–ice avalanches and geohazard-chains in the Parlung Zangbo Basin, Tibet, China. Geomorphology 422, 108549. doi:10.1016/j.geomorph.2022.108549
Zhang, Y., Chen, J., Zhou, F., Bao, Y., Yan, J., Zhang, Y., et al. (2022). Combined numerical investigation of the Gangda paleolandslide runout and associated dam breach flood propagation in the upper Jinsha River, SE Tibetan Plateau. Landslides 19, 941–962. doi:10.1007/s10346-021-01768-5
Keywords: rock–ice avalanche, geomorphological characteristics, kinematic process, freeze–thaw action, discrete element modeling
Citation: Chen R, Chen J, Shi L, Cui Z and Chen S (2023) Geomorphological characteristics and the kinematic process of the Ganheba rock–ice avalanche in Yulong Mountain, China. Front. Earth Sci. 11:1017207. doi: 10.3389/feart.2023.1017207
Received: 11 August 2022; Accepted: 31 January 2023;
Published: 01 March 2023.
Edited by:
Hans-Balder Havenith, University of Liège, BelgiumReviewed by:
Chong Xu, Ministry of Emergency Management, ChinaWeiming Liu, Institute of Mountain Hazards and Environment (CAS), China
Copyright © 2023 Chen, Chen, Shi, Cui and Chen. This is an open-access article distributed under the terms of the Creative Commons Attribution License (CC BY). The use, distribution or reproduction in other forums is permitted, provided the original author(s) and the copyright owner(s) are credited and that the original publication in this journal is cited, in accordance with accepted academic practice. No use, distribution or reproduction is permitted which does not comply with these terms.
*Correspondence: Jian Chen, amlhbmNoZW5AY3VnYi5lZHUuY24=
 Ruichen Chen
 Jian Chen
 Lulu Shi
 Zhijiu Cui2
 Song Chen
