 Quanling Qin
 Xin Li1,2*
- 1School of Safety Science and Engineering, Henan Polytechnic University, Jiaozuo, China
- 2College of Geology and Mining Engineering, Xinjiang University, Ürümqi, China
Numerical simulation is an efficient method to quantitatively describe the reservoir dynamics of coalbed methane (CBM) reservoirs. The ideal steeply inclined model (ISIM), assumed to be a steeply inclined plate, has been widely applied in steep coalbed methane reservoir modeling, although the ISIM cannot accurately reflect the actual reservoir geological conditions. In this paper, the dynamics of CBM production and reservoirs using the ISIM and actual steeply inclined model (ASIM) were compared, taking the steep coal in the Fukang mining area located in northwestern China as an example, with the purpose of revealing the differences and applicability of the ASIM and ISIM. The ASIM and ISIM were established by Petrel software, and CBM production was matched and predicted by Eclipse software. Data reflecting reservoir dynamics, such as water saturation, reservoir pressure, and gas content, were extracted. The dynamic changes in the reservoir physical properties of the ASIM and ISIM were also compared. The results showed that: 1) multiple gas production peaks occurred in both ASIM and ISIM. The maximum daily gas production of ASIM occurred earlier than the maximum daily gas production of ISIM. The peak gas production and cumulative gas production of ASIM were both greater than the peak gas production and cumulative gas production of ISIM. 2) Due to the variations in grid shape and dip angle with each grid in the ASIM, the production effect of the ASIM was better than the production effect of the ISIM in the third stage (4–10 years) of drainage. 3) In the third stage (4–10 years) of drainage, the decrease rate of reservoir pressure of ASIM was larger than the decrease rate of reservoir pressure of ISIM because of the relatively better production performance of ASIM. 4) Differentiation of gas and water dominated the variation trend of gas content, and in the third stage (4–10 years) of drainage, the ASIM has higher recovery efficiency compared with ISIM. Compared with ISIM proposed by previous scholars, the ASIM was more helpful to monitor the dynamic behavior of coal reservoirs, and ASIM can provide a more reliable basis for guiding coalbed methane development.
1 Introduction
As an important part of unconventional natural gas resources, coalbed methane (CBM) has great potential for easing the scarcity of conventional natural gas, and its development is rising rapidly worldwide (Zou et al., 2019). Since the 1980s, China’s CBM resources have been studied extensively (Shao et al., 2015; Qin et al., 2018). In 2020, China’s surface production of CBM reached 5.767 billion m3, accounting for 3.07% of the total natural gas production, indicating that China has entered the early stage of CBM development, but improvement of production is encouraged to realize large-scale development (Qin et al., 2022). The southern Junggar Basin is the main battlefield for the CBM development of low rank coal reservoirs in China. The strike, dip and dip angles of coal reservoirs formed in this area vary sharply and are very different from the strike, dip, and dip angles of most coal-bearing basins, such as the Powder River Basin in the United States, the Surat Basin in Australia, the Albert Basin in Canada, and the Qinshui Basin in China. Replicating the in situ geological conditions of complex coal reservoirs of the southern Junggar Basin using physical experiments is very difficult, while numerical simulation can be used as an efficient tool to study CBM production characteristics by considering actual geological conditions.
Reservoirs usually undergo three processes during CBM production, namely, desorption, diffusion, and seepage. Under the action of a pressure difference, CBM desorbs from the surface of the coal matrix, diffuses into large fractures under the action of a concentration difference, and penetrates the wellbore under the action of flow potential energy (Senthamaraikkannan et al., 2016; Tang et al., 2018; Dong et al., 2020; Duan et al., 2020). To simulate the seepage process of CBM, it is necessary to include these three processes in a reservoir model. At present, many simulators have been used in CBM numerical simulations, providing a reference for formulating reasonable production systems and optimization schemes for CBM drainage under different conditions (Ibrahimet and Nasr-El-Din, 2015; Sayyafzadeh et al., 2015; Sun et al., 2017). Wan et al. (2016) determined the desorption range and pressure drop area of CBM with the method of numerical simulation and proved that critical analytical pressure, well spacing and permeability are the factors that affect the desorption area of CBM. Yarmohammadtooski et al. (2017) analyzed the production data for gas water flow with a numerical model and found that fracture compression and matrix shrinkage affected reservoir permeability at different production times, consistent with the actual production. Karacan et al. (2014) evaluated the CBM migration capacity of the Illinois Basin in the United States through multiwell historical fitting, providing the real distribution of reservoir parameters and contributing to the effective management of CBM development. Coal seams in China are characterized by multi-layer superposition, and the changes of reservoir physical properties are more complex in the process of coalbed methane multi-layer combined production. It was difficult to analyze physical properties completely based on actual production data. Therefore, numerical simulation has become main method to analyze interlayer interference of methane co-production (Quan et al., 2022a; Quan et al., 2022b).
The coal seams of the southern Junggar Basin are highly heterogeneous, and the previous ideas cannot be completely applied to numerical research in this area. Numerous scholars have studied the dynamic characteristics of the physical properties of inclined coal reservoirs during CBM production by numerical simulation. The scholars found that different burial depths of reservoirs led to differences in variations in physical properties, resulting in different rules of gas production. Meanwhile, with the increase in the coal seam dip angle, the difference in gas production gradually increased. (Fu et al., 2018; Kang et al., 2018; Kang et al., 2019; Kang et al., 2020; Liang et al., 2020). However, previous studies have greatly simplified the coal reservoir in the process of CBM simulation, which may distort the actual reservoir, and the reliability of the simulation results has been relatively low. However, previous studies on steeply inclined coal reservoir production simulation have greatly simplified the reservoir as an ideal steeply inclined model (ISIM), which may be distorted for the actual reservoir, and the reliability of the simulation results needs to be reconsidered.
The foundation of numerical simulation is the construction of a geological model, and the degree of coincidence between the simulated geological model and an actual geological model determines the reliability of the production simulation. In the previous numerical simulation of CBM production of steeply inclined coal reservoirs, most scholars usually set up ISIM to simulate the actual drainage process. However, there may still be a certain gap in guiding actual production. In this paper, a coal reservoir located in the Fukang mining area of the southern Junggar Basin was selected as the research subject. Xinjiang, an actual steeply inclined model (ASIM), was constructed by combining the seismic data using the model construction method in Petrel software of Schlumberger, and numerical simulation software was used to restore the CBM production process. Compared with the ISIM proposed by previous scholars, the ASIM was found to predict higher gas production, better drainage, pressure reduction, and higher recovery. The proposed ASIM model is more objective and vivid than the ISIM model. This work can provide guidance for CBM development where steep inclined coal reservoirs are found.
2 Geological setting
The southern Junggar Basin is located in northwest China, with an area of approximately 1.8 × 10³ km2 (Figure 1A). The CBM resource in the southern Junggar Basin is half the CBM resource in Xinjiang, which is an important area for CBM development (Liu et al., 2014; Ge et al., 2018). The southern Junggar Basin experienced Hercynian, Indosinian, Yanshanian and Himalayan movements, and a series of NW thrust faults formed (Guo et al., 2014) (Figure 1B). The Fukang mining area is located in the eastern part of the southern Junggar Basin (Zhang et al., 2021). Since the Mesozoic, the Fukang mining area has been influenced by the uplift of the Northern Tianshan and Bogda Mountains, resulting in a complex system of folds and faults under the action of Yanshanian and Himalayan movements (Fu et al., 2016). The southern limb of the Fukang syncline has a dip angle of 45°–70°, and the faults are mainly high-angle thrust faults (Zhang et al., 2021). Seven CBM well groups (CS5, CS8, CS11, CS18, CS13, CS15 and CS16) were drilled in the two limbs of the Fukang syncline (Figure 1C).
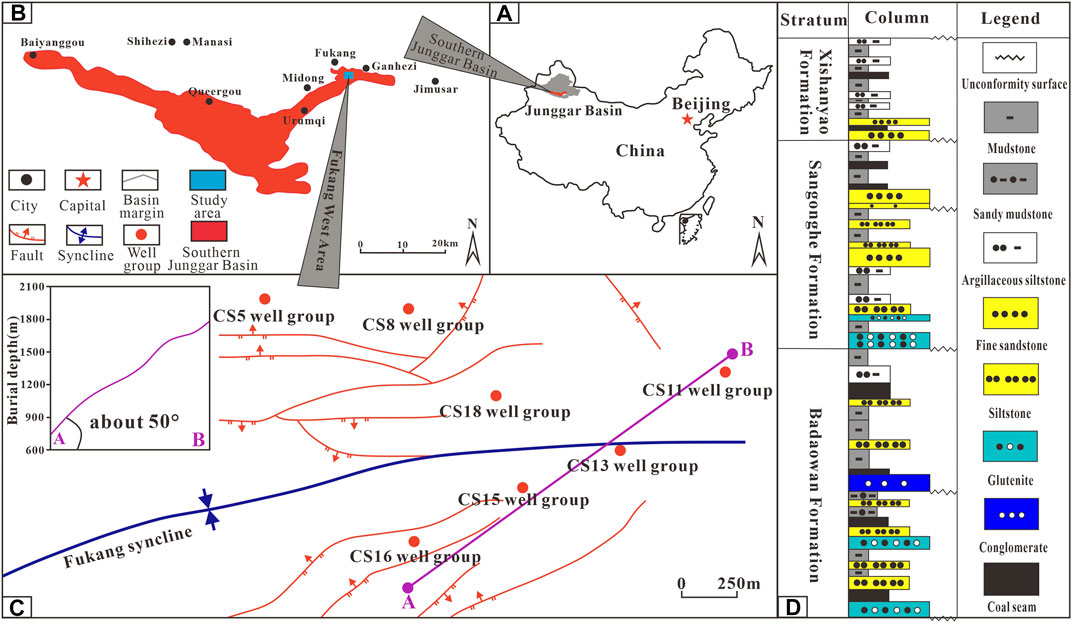
FIGURE 1. (A) Location map of the southern Junggar Basin. (B) Geological structure of the southern Junggar Basin. (C) Structural outline and well location distribution in the Fukang west area. (D) Coal-bearing stratum.
The coal-bearing strata in the study area are mainly the Xishanyao Formation of the Middle Jurassic (J2x) and the Badaowan Formation of the Lower Jurassic (J1b), with the Lower Jurassic Sangonghe Formation located between those two formations (Figure 1D) (Li et al., 2018). The lithology contains mudstone, sandy mudstone, argillaceous siltstone, fine sandstone, siltstone, glutenite, and coal, with small amounts of conglomerate. The thickness of the coal seam in the Badaowan Formation is more than 0.3 m, and the average total thickness is 68.48 m, which is the main CBM production layer (Zhang et al., 2021).
3 Model construction
3.1 Assumptions
A coal reservoir containing both a coal matrix and fracture is regarded as a dual porosity and single permeability model in this study (Liu et al., 2021). At present, most researchers generally believe that as drainage proceeds and when the reservoir pressure reaches below the critical desorption pressure, CBM desorbs from the coal matrix surface and diffuses into the fracture system according to Darcy’s law (Figure 2). In the process of CBM production simulation of this work, the following assumptions were made: 1) the adsorption of CBM occurs in the matrix unit, and the flow occurs in the fracture unit, which is the dual porosity and single permeability model; 2) the adsorption and desorption of methane follows the Langmuir isothermal adsorption equation (Eq. 1), and all methane is adsorbed in the matrix unit by default in the initial state; 3) the diffusion of methane follows Fick’s diffusion law (Eq. 2). When the reservoir pressure drops below the critical desorption pressure, methane is desorbed quickly and diffuses into the fracture unit for Darcy seepage (Eq. 3); 4) the software automatically initializes reservoir pressure according to the law of reservoir pressure variation as burial depth varies in the research area (Table 1); 5) shrinkage and expansion of the coal matrix are not considered.
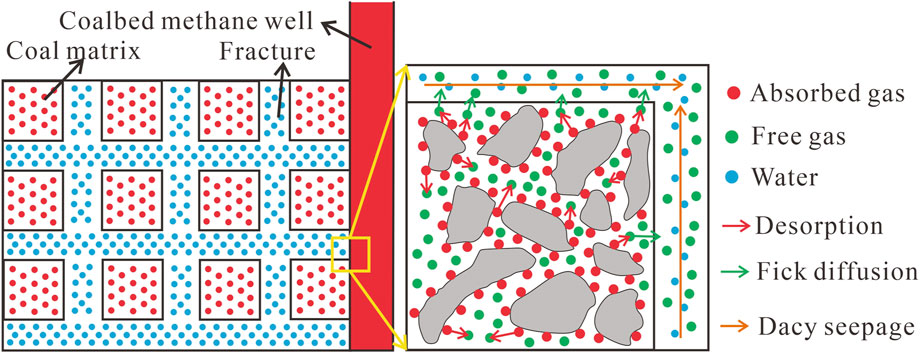
FIGURE 2. Theoretical model of the dual porosity and single permeability model (Qin et al., 2020).
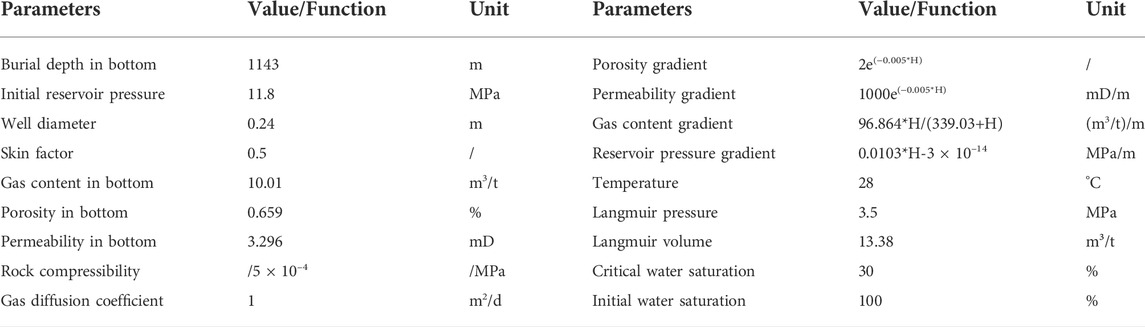
TABLE 1. Parameters of the simulation using the ASIM and ISIM models.
In the initial state, all CBM was adsorbed on the surface of the coal matrix, following the Langmuir isothermal adsorption equation (Eq. 1). When the gas pressure was lower than the critical desorption pressure, CBM was desorbed from the matrix:
where V is the volume of gas adsorbed by the solid under pressure P; VL is Langmuir volume (m³/t); PL is Langmuir pressure (MPa); and P is the gas pressure (MPa).
The gas concentration difference between the matrix and the fracture makes methane diffuse into the fracture unit, following Fick’s diffusion law (Eq. 2);
where Jv is the gas volume flux in a coal matrix; D is the diffusion coefficient; X is the gas content per unit volume of coal; and r is the radius of the coal particles.
The pressure differential between the fracture and the wellbore causes the methane to flow into the wellbore, following Darcy’s law (Eq. 3);
where Jv is the gas volume flux in a coal matrix, K is the permeability coefficient, P is the square of gas pressure, and r is the radius of coal particles.
3.2 Model construction
The ASIM and ISIM were constructed by corner grid. The former is the in situ reservoir model, which considers the topographic characteristics of the coal reservoir, and the latter is the coal reservoir assumed to be a 45° plate model. The length, width, and height of the two models were set as 1000 m × 1000 m × 17.6 m, and the number of grids was 40 × 40 × 3. The actual size of each grid is 25 m × 25 m × 5.87 m. The CS18 well is located in the center of the model. Details of those two models are illustrated below:
3.2.1 Actual steeply inclined model
Based on the coal seam interpreted by seismic data, the ASIM of the coal reservoir of the study area was constructed by Petrel (Figure 3). The dip angle of the model grid ranged between 0 and 61°, the dip direction was different due to the topographic fluctuation and geological structure variation, and the burial depth ranged from 765.74 m to 1691.51 m. The reservoir was divided into up-dip reservoirs and down-dip reservoirs, with CBM wells located at the center.
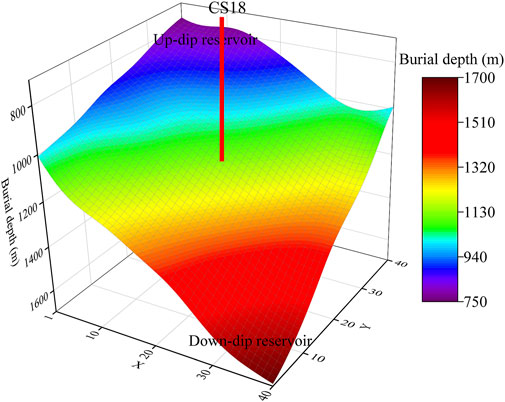
FIGURE 3. Actual steeply inclined model (ASIM).
3.2.2 Ideal steeply inclined model
Previous CBM researchers usually set the reservoir as a horizontal plate or an inclined plate with a certain dip angle when constructing the numerical model. Such a reservoir is homogeneous in reservoir parameters, and the degree of reservoir heterogeneity description is weak. Additionally, the influences of the actual terrain on the simulation results lack deep discussion. According to the research ideas of previous scholars, a plate coal reservoir model with a dip angle of 45° was constructed by using the CBM template provided by Eclipse. The burial depth of the model ranged from 801.28 m to 1493.52 m. The reservoir was divided into up-dip reservoirs and down-dip reservoirs, with the CS18 well located at the center (Figure 4).
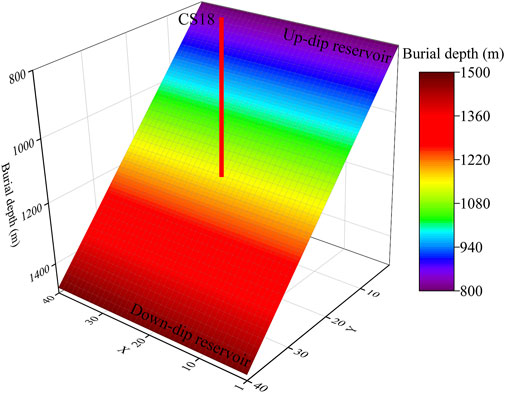
FIGURE 4. Ideal steeply inclined model (ISIM).
4 Simulation parameters
Attribute assignment and historical matching were carried out for the above two models. Burial depth was the main factor controlling the reservoir pressure, porosity, permeability, and gas content; thus, those four parameters were assigned by using the fitting relationship function between those four parameters and burial depth, and some parameters were based on Kang et al. (2019) (Figure 5). Related studies have shown that initial gas content and reservoir pressure are positively correlated with burial depth, while permeability and porosity are negatively correlated with burial depth (Shi et al., 2018; Hu, 2019; Wang et al., 2020; Zhao and Chi, 2020). Coal seams have porosities and permeabilities typically ranging between 0.5 and 2.5% and 0.1–100 mD, respectively (Karimpouli et al., 2020; Mostaghimi et al., 2017). With the continuous progress of coalification and physical compaction, the porosity of coal rock will decrease exponentially as burial depth increases (Xin et al., 2019). Therefore, when setting the porosity and permeability, the burial depth was taken as the independent variable to decrease exponentially. The modeling region is located at the Fukang syncline tip, where stress release results in increased permeability. The CS11 well group, located approximately 900 m adjacent to the CS18 well group, has a maximum well test permeability of 16.64 mD (Pu et al., 2021). The production process of CBM can be divided into a single-phase water flow stage, gas-water flow stage and single-phase gas flow stage; thus, the relative permeability curves of gas and water were used to describe the relative flow capacity of gas and water in fractures. The relative permeability curves of gas and water were fitted by the classical Corey equation (Corey, 1954). The relative permeability curves fitted by the ASIM and ISIM are shown in Figure 6. Simulation parameters are shown in Table 1, and relevant parameters of each grid in both the ASIM and ISIM models were based on the parameters of the reservoir located in the wellbore position.
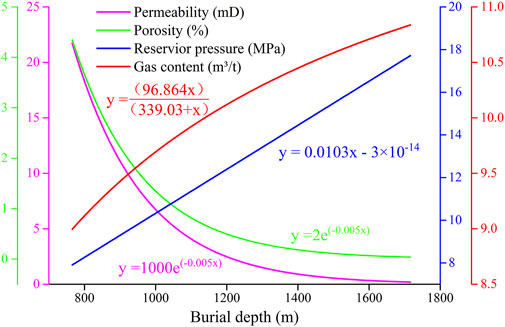
FIGURE 5. Parameters of permeability, porosity, pressure, and gas content in the ASIM and ISIM models.
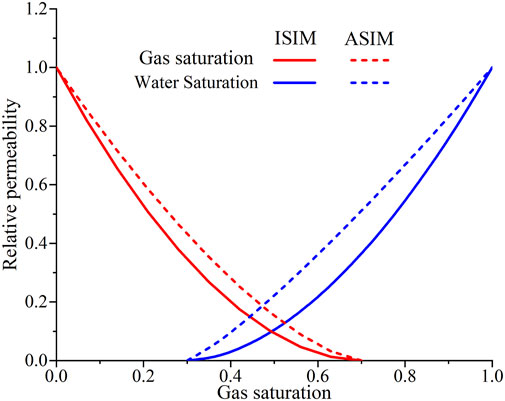
FIGURE 6. The relative permeability curves of gas and water in the ASIM and ISIM models.
5 Results
5.1 History matching
The rising stage of gas production in the CS18 well was selected for historical matching, and the declining stage of gas production was selected to test the validity of the model. The depletion development mode to describe the bottom hole pressure decrease was selected for simulating the CBM production (595 days) of the CS18 well (Figure 7A). By adjusting the porosity, permeability, gas content gradient, and relative permeability curves of gas and water, historical fittings matching the gas production data using ASIM and ISIM were carried out (Figure 7B). For 0–250 days, the ASIM matching degree was better than the matching degree of ISIM; for 250–450 days, the ASIM matching degree was better than the matching degree of ISIM; and for 450–595 days, the matching degree of both ASIM and ISIM was better. In general, the matching results of the ASIM and ISIM were acceptable.
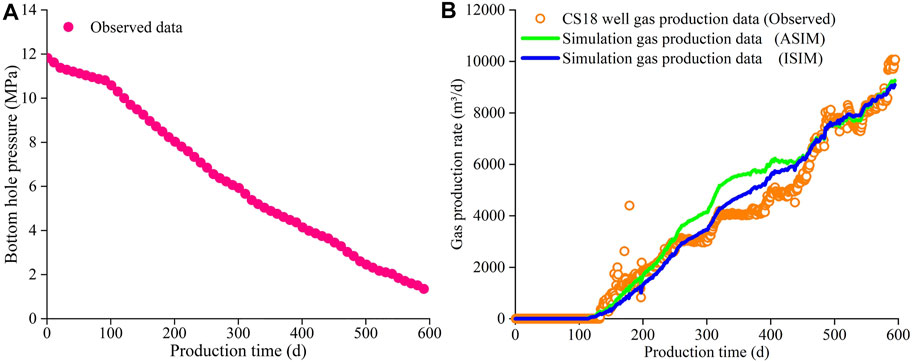
FIGURE 7. (A) Bottomhole pressure of ASIM and ISIM. (B) History matching results of ASIM and ISIM.
5.2 Productivity prediction
Based on the historical matching results, the 10-year gas production characteristics of the CS18 well using ASIM and ISIM were predicted. To prevent stress-sensitive reservoir damage caused by excessive pressure reduction, a constant bottom hole pressure (1.3 MPa) was adopted for 3–10 years. The results show that the first peak value of gas production of ASIM was 9292.95 m³/d, occurring on the 600th day, and the second peak value of gas production was 19120.01 m³/d, occurring on the 3100th day. The 10-year cumulative gas production of ASIM was 3.48×10⁷ m³. For ISIM, the first peak of daily gas production appeared on approximately the 600th day (9116.05 m³/d) and the second peak of daily gas production occurred on the 3300th day (15406.85 m³/d). The 10-year cumulative gas production of ISIM was 3.17×10⁷ m³ (Figure 8A). The first peak of ASIM was maintained for approximately 100 days, and the ISIM was maintained for approximately 400 days. The cumulative gas production of ISIM was higher than the cumulative gas production of ASIM during the first 3000 days and lower than the cumulative gas production of ASIM after 3000 days (Figure 8B).
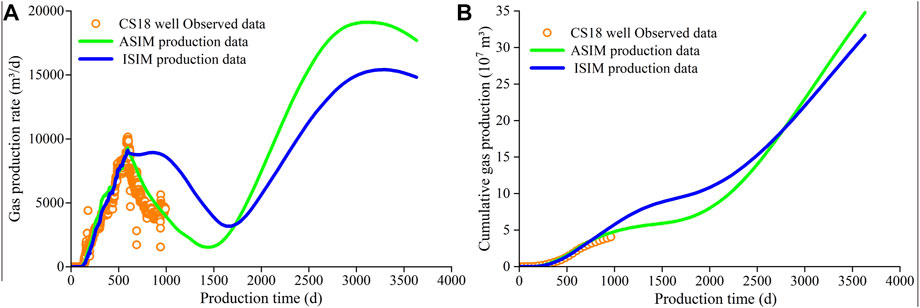
FIGURE 8. (A) Gas production rate of ASIM and ISIM. (B) Cumulative gas production of ASIM and ISIM.
5.3 Reservoir physical property dynamics
5.3.1 Water saturation dynamics
After completion of the simulation, the water saturation spatial distribution maps of the ASIM and ISIM at the initial state and at 1, 2, 3, 4 and 10 years were extracted (Figure 9; Figure 10). In both the ASIM and ISIM, reservoir water saturations in the up-dip direction decrease preferentially. For ASIM, in 0–1 year of drainage, the water saturations were generally high, with only a few grids being reduced to the lowest at this stage (57%) (Figure 9B). In the subsequent 9 years, as drainage proceeded, the water saturation of the up-dip reservoir grid gradually decreased to irreducible water saturation (Figures 9C–F). For ASIM, the decrease rates of water saturation in different grids with varied burial depths changed heterogeneously. For ISIM in 0–1 year of drainage, the water saturation around the wellbore decreased preferentially, reaching a value of 91% (Figure 10B). As the drainage process proceeded, the water saturation basically decreased symmetrically in the center of the wellbore in the strike direction. However, in the dipping direction, the water saturation of the reservoir in the up-dip direction with shallow burial depth first decreased to the critical water saturation (Figures 10C–F). The water saturation of the ASIM decreased by 0.68% in 0–1 year, 3.53% in 1–2 years, 3.55% in 2–3 years, 4.66% in 3–4 years, 23.33% in 4–10 years, and 33.34% in 0–10 years. For ISIM, the overall water saturation decreased by 1.08% in 0–1 year, 3.99% in 1–2 years, 2.92% in 2–3 years, 2.47% in 3–4 years, 22.73% in 4–10 years, and 30.22% in 0–10 years (Table 2).
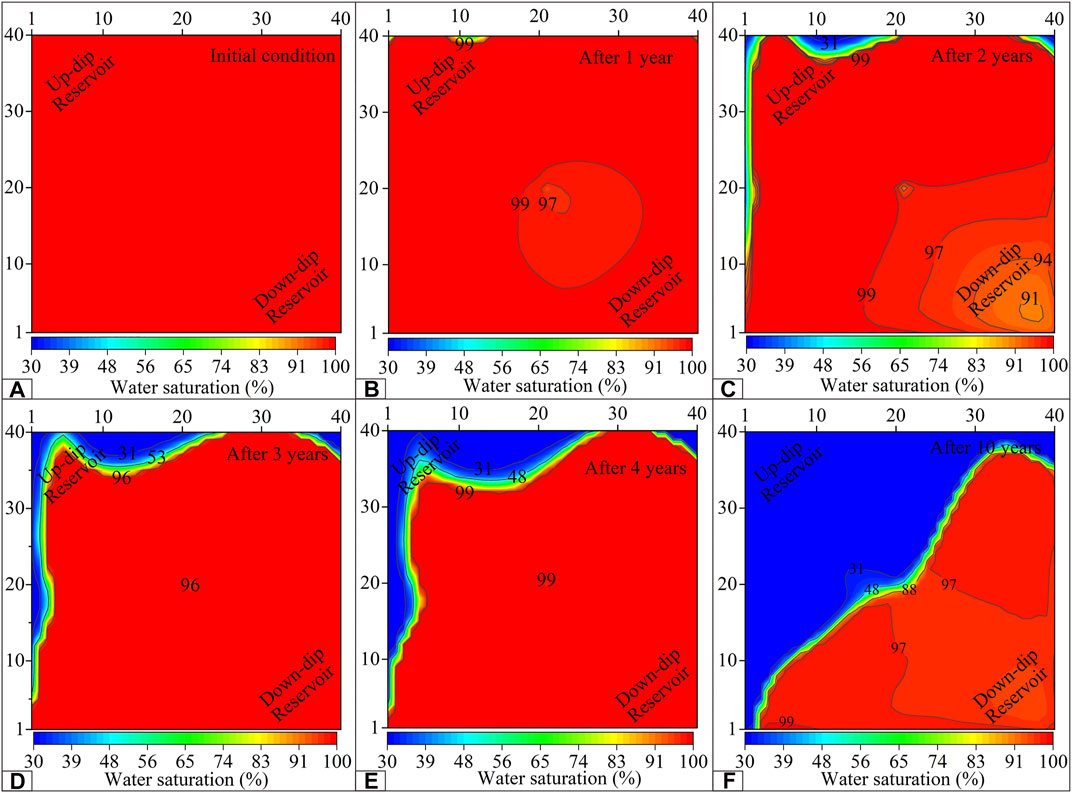
FIGURE 9. (A) Initial water saturation distribution of ASIM. (B) Water saturation distribution after 1 year of drainage in ASIM. (C) Water saturation distribution after 2 years of drainage in ASIM. (D) Water saturation distribution after 3 years of drainage in ASIM. (E) Water saturation distribution after 4 years of drainage in ASIM. (F) Water saturation distribution after 10 years of drainage in ASIM.
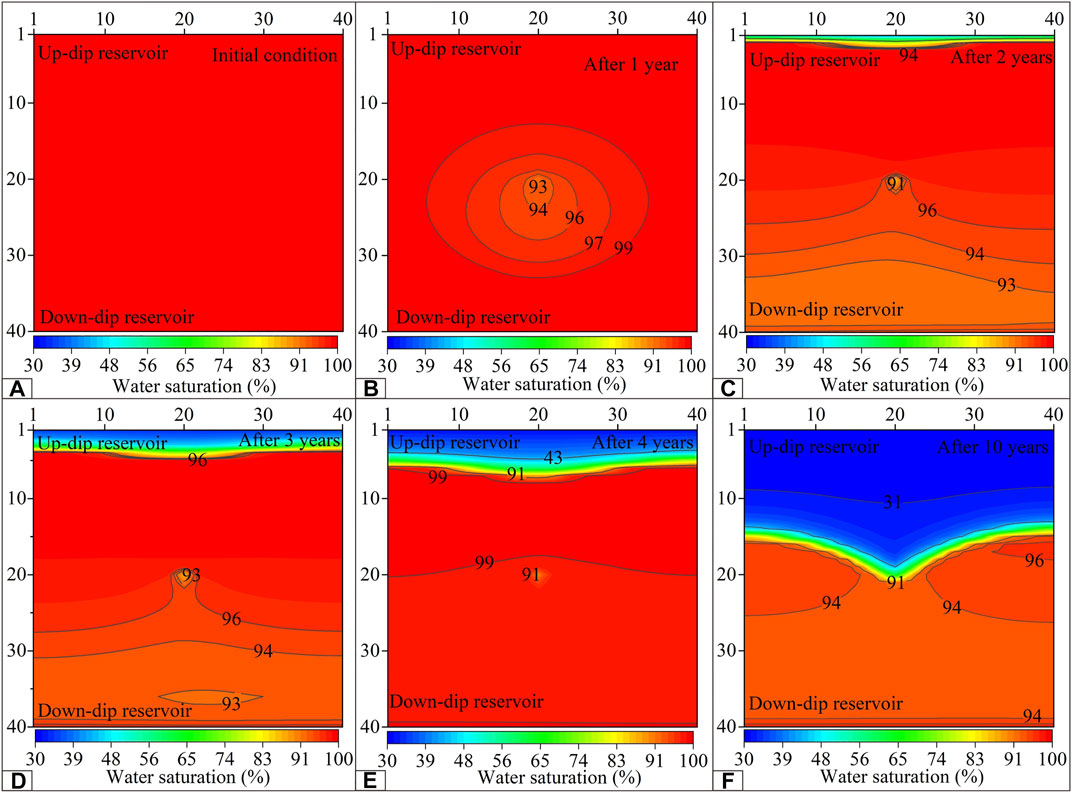
FIGURE 10. (A) Initial water saturation distribution of ISIM. (B) Water saturation distribution after 1 year of drainage in ISIM. (C) Water saturation distribution after 2 years of drainage in ISIM. (D) Water saturation distribution after 3 years of drainage in ISIM. (E) Water saturation distribution after 4 years of drainage in ISIM. (F) Water saturation distribution after 10 years of drainage in ISIM.
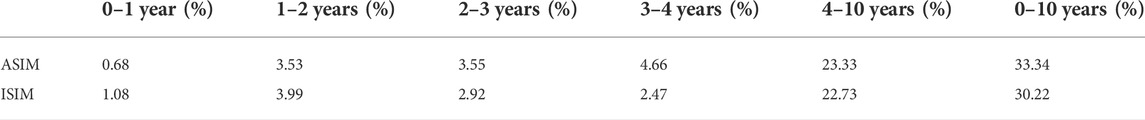
TABLE 2. Water saturation decline rate with ASIM and ISIM.
5.3.2 Reservoir pressure dynamics
For ASIM, the initial reservoir pressure ranged from 8.14 MPa to 17.25 MPa (Figure 11A). With the development of drainage, the reservoir pressure gradually propagated outward from the wellbore. The minimum reservoir pressures of the 1st, 2nd, 3rd, 4th, and 10th years of production were 5.45 MPa, 2.44 MPa, 2.34 MPa, 2.28 MPa, and 1.86 MPa, respectively. The maximum reservoir pressures of the 1st, 2nd, 3rd, 4th, and 10th years of production were 15.13 MPa, 13.95 MPa, 12.68 MPa, 12.80 MPa, and 9.53 MPa, respectively (Figures 11B–F). For ISIM, the initial reservoir pressure ranged from 8.49 MPa to 15.20 MPa (Figure 12A). The pressure drops faster in the wellbore and up-dip direction than in the down-dip direction. The reservoir pressure decreased preferentially in the up-dip reservoir and descended symmetrically in the strike centered on the wellbore. The minimum reservoir pressures of the 1st, 2nd, 3rd, 4th, and 10th years of production were 5.54 MPa, 2.60 MPa, 2.50 MPa, 2.36 MPa and 1.97 MPa, respectively. The maximum reservoir pressures of the 1st, 2nd, 3rd, 4th, and 10th years of production were 13.41 MPa, 12.64 MPa, 10.91 MPa, 10.33 MPa and 7.84 MPa, respectively (Figures 12B–F). The reservoir pressure of the ASIM decreased by 13.88% in years 0–1, 8.38% in years 1–2, 6.31% in years 2–3, 3.76% in years 3–4, 41.75% in years 4–10, and 58.57% in years 0–10. For ISIM, the overall reservoir pressure decreased by 13.71% in 0–1 year, 8.43% in 1–2 years, 8.81% in 2–3 years, 6.21% in 3–4 years, 35.62% in 4–10 years, and 56.60% in 0–10 years (Table 3).
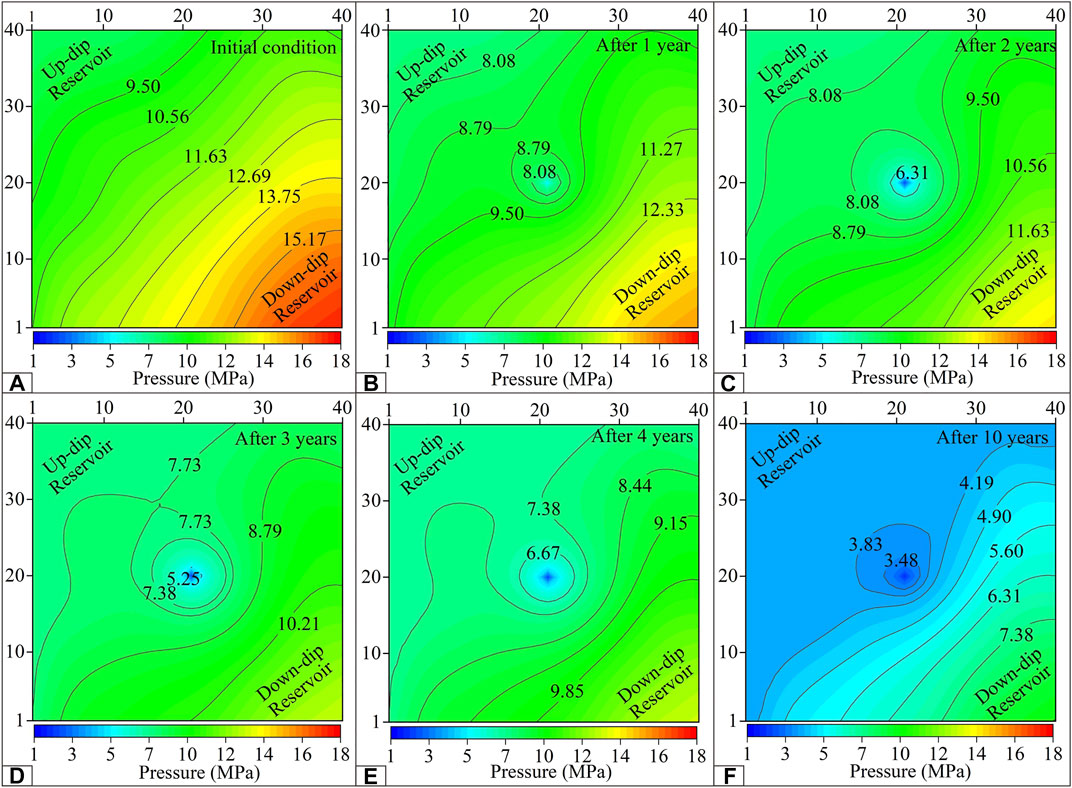
FIGURE 11. (A) Initial reservoir pressure distribution of ASIM. (B) Reservoir pressure distribution after 1 year of drainage in ASIM. (C) Reservoir pressure distribution after 2 years of drainage in ASIM. (D) Reservoir pressure distribution after 3 years of drainage in ASIM. (E) Reservoir pressure distribution after 4 years of drainage in ASIM. (F) Reservoir pressure distribution after 10 years of drainage in ASIM.
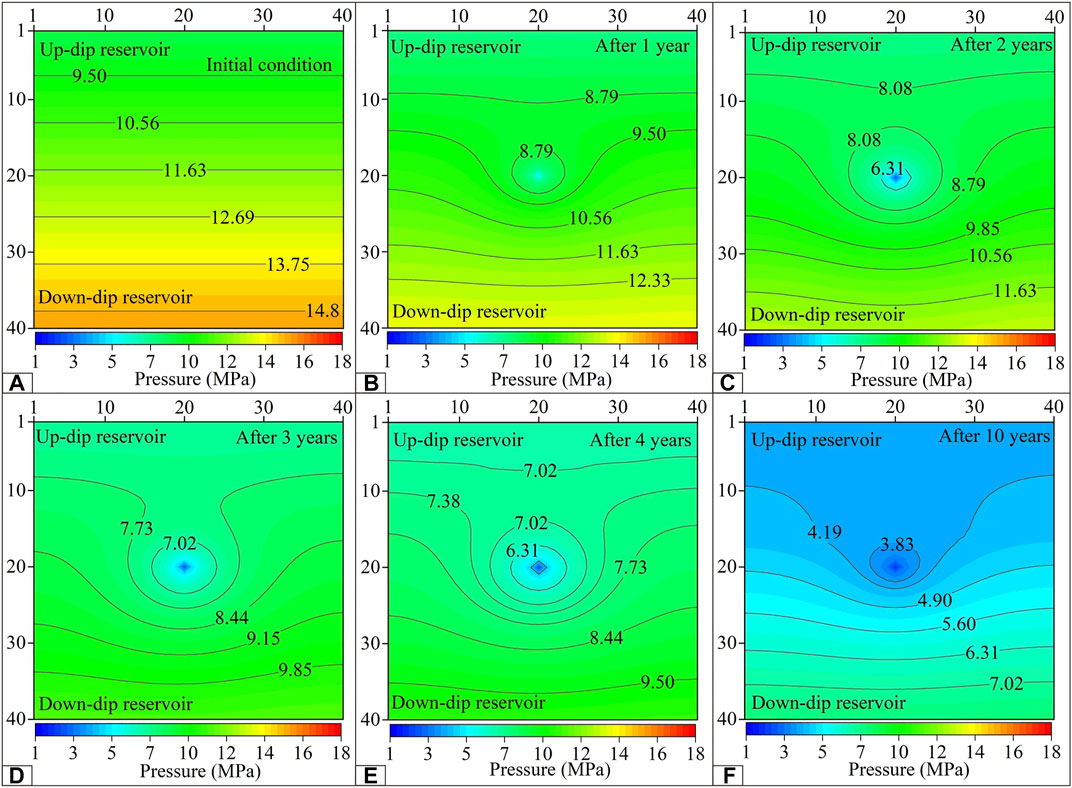
FIGURE 12. (A) Initial reservoir pressure distribution of ISIM. (B) Reservoir pressure distribution after 1 year of drainage in ISIM. (C) Reservoir pressure distribution after 2 years of drainage in ISIM. (D) Reservoir pressure distribution after 3 years of drainage in ISIM. (E) Reservoir pressure distribution after 4 years of drainage in ISIM. (F) Reservoir pressure distribution after 10 years of drainage in ISIM.
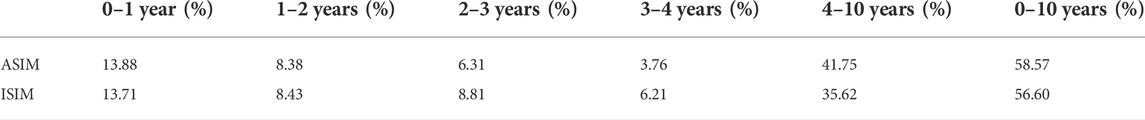
TABLE 3. Reservoir pressure decline rate with ASIM and ISIM.
5.3.3 Gas content dynamics
For ASIM, the initial gas content ranged from 9.08 m3/t to 10.79 m3/t (Figure 13A). The minimum gas content of the 1st, 2nd, 3rd, 4th, and 10th years of production was 8.15 m3/t, 5.50 m3/t, 5.36 m3/t, 5.28 m3/t, and 4.64 m3/t, respectively. The maximum gas content of the 1st, 2nd, 3rd, 4th, and 10th years of production was 10.79 m3/t, 10.70 m3/t, 10.49 m3/t, 10.48 m3/t, and 9.79 m3/t, respectively (Figures 13B–F). For ISIM, the initial gas content ranged from 9.19 m3/t to 10.55 m3/t (Figure 14A). The gas content drops faster in the wellbore and up-dip directions than in the down-dip direction. The gas content decreased preferentially in the up-dip reservoir and descended symmetrically in the strike centered on the wellbore. The minimum gas content of the 1st, 2nd, 3rd, 4th, and 10th years of production was 8.20 m3/t, 5.71 m3/t, 5.58 m3/t, 5.39 m3/t, and 4.82 m3/t, respectively. The maximum gas content of the 1st, 2nd, 3rd, 4th, and 10th years of production was 10.55 m3/t, 10.48 m3/t, 10.13 m3/t, 9.99 m3/t, and 9.25 m3/t, respectively (Figures 14B–F). For ASIM, the reservoir gas content decreased by 0.70% in 0–1 year, 2.25% in 1–2 years, 1.80% in 2–3 years, 1.18% in 3–4 years, 18.04% in 4–10 years, and 22.77% in 0–10 years. For ISIM, the reservoir gas content decreased by 0.64% in 0–1 year, 2.27% in 1–2 years, 2.53% in 2–3 years, 1.92% in 3–4 years, 14.97% in 4–10 years, and 21.05% in 0–10 years (Table 4).
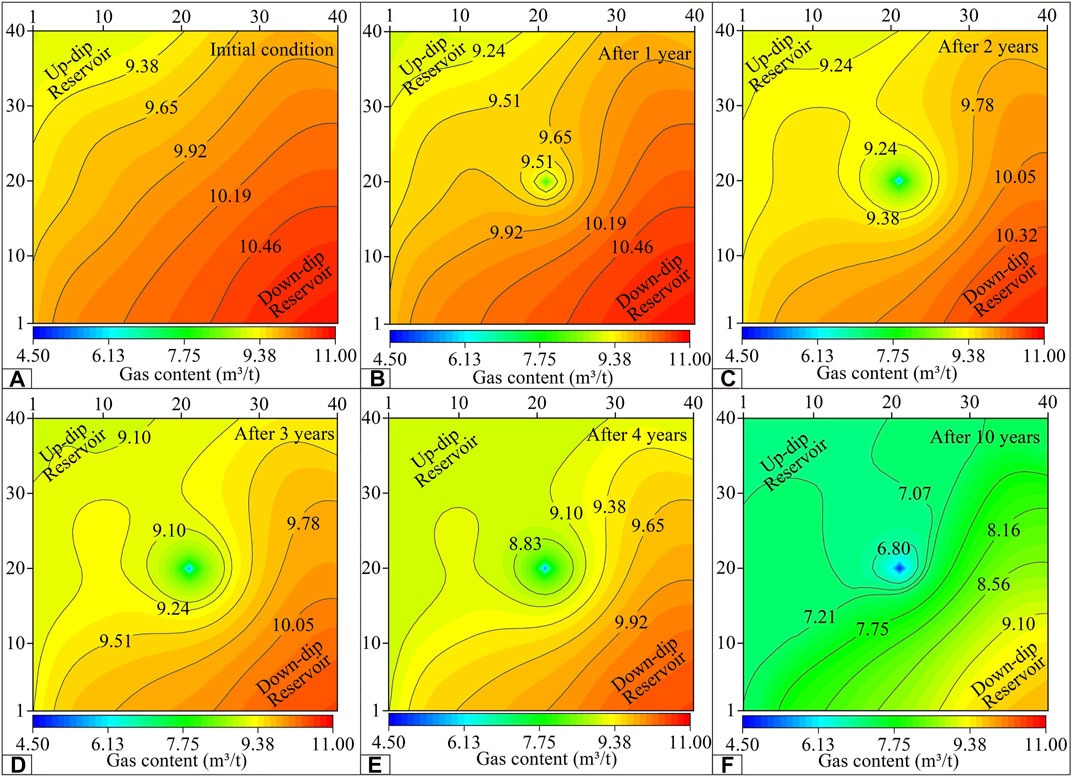
FIGURE 13. (A) Initial reservoir gas content distribution of ASIM. (B) Reservoir gas content distribution after 1 year of drainage in ASIM. (C) Reservoir gas content distribution after 2 years of drainage in ASIM. (D) Reservoir gas content distribution after 3 years of drainage in ASIM. (E) Reservoir gas content distribution after 4 years of drainage in ASIM. (F) Reservoir gas content distribution after 10 years of drainage in ASIM.
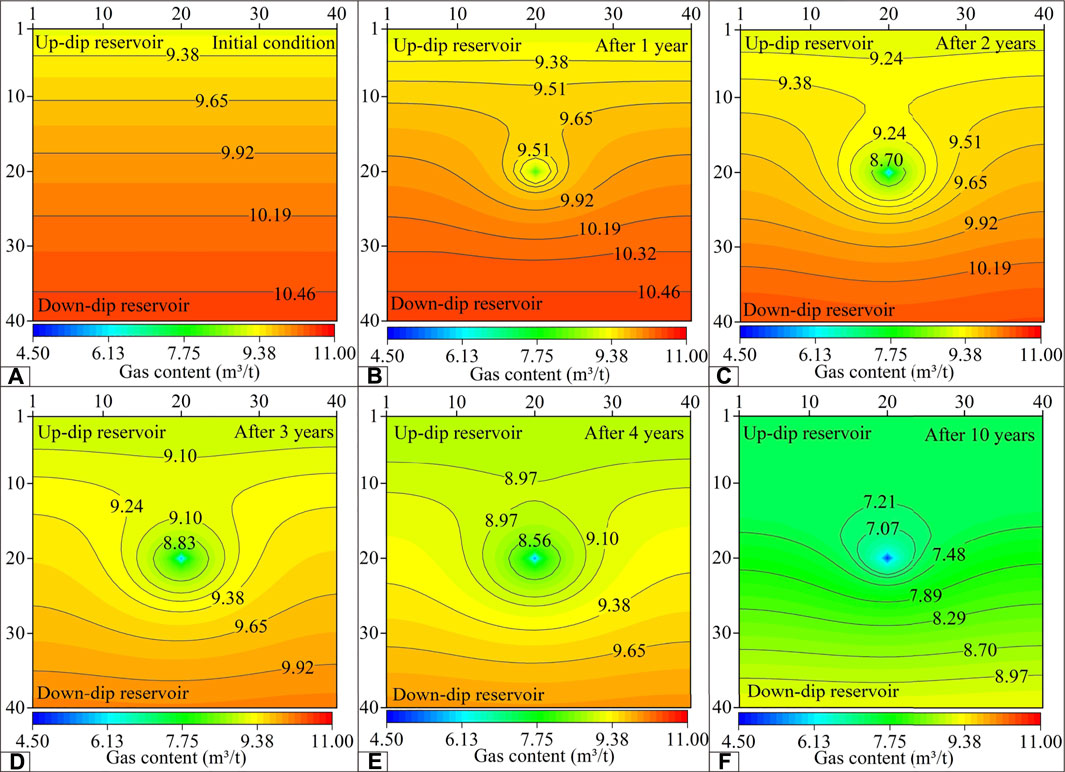
FIGURE 14. (A) Initial reservoir gas content distribution of ISIM. (B) Reservoir gas content distribution after 1 year of drainage in ISIM. (C) Reservoir gas content distribution after 2 years of drainage in ISIM. (D) Reservoir gas content distribution after 3 years of drainage in ISIM. (E) Reservoir gas content distribution after 4 years of drainage in ISIM. (F) Reservoir gas content distribution after 10 years of drainage in ISIM.
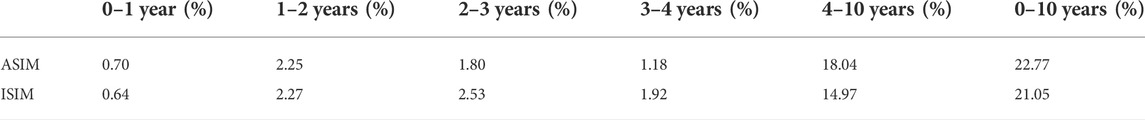
TABLE 4. Reservoir gas content decline rate with ASIM and ISIM.
6 Discussion
6.1 Reservoir physical property dynamic comparisons between the actual steeply inclined model and ideal steeply inclined model
The dynamic change in coal reservoir physical properties is becoming increasingly significant for continuous and steady CBM production (Yan et al., 2020). In recent years, some progress has been achieved in the study of CBM drainage and production dynamics (Wang et al., 2012; Kang et al., 2016; Kang et al., 2017). Based on several previous production practices, concerned scholars have monitored the physical property dynamics in the production process of CBM through passive super-low frequency (SLF) spectrum analysis, drainage analysis, and the transient electromagnetic method, providing guidance for CBM drainage (Li et al., 2009; Jiang et al., 2011; Fu et al., 2014; Wang et al., 2021). In this paper, the reservoir property dynamics of the ASIM and ISIM are manifested, and the gap between the simulation and actual situation is narrowed. According to the dynamic characteristics of drainage, the whole drainage process can be divided into three stages: 0–2 years as the first stage, 2–4 years as the second stage, and 4–10 years as the third stage.
6.1.1 Water saturation
As the medium to promote the decrease in reservoir pressure during CBM exploitation, groundwater drainage can transform CBM from the adsorbed state to the free state. The differences in water drainage can affect the change in reservoir pressure propagation during CBM production, thus affecting gas production (Hu et al., 2019; Ma et al., 2021). In the initial state, the coal seam fracture was usually completely saturated with water, and the water saturation in the reservoir fracture was 100%, providing the necessary pressure for the adsorption of CBM on the coal matrix (Mohamed and Mehana, 2020).
In the ASIM and ISIM, the groundwater in the up-dip reservoir flows to the down-dip reservoir during drainage. Groundwater in the up-dip direction preferentially flows into the wellbore, providing most of the water produced by CBM wells. In the production process, the groundwater of the down-dip reservoir will be replenished from the up-dip reservoir, making the down-dip reservoir water maintain a high saturation state for a long time. In the first stage (0–2 years), the water saturation decrease rate of ASIM was lower than the water saturation decrease rate of ISIM, and the drainage of the former was slower than the drainage of the latter. Due to the lower permeability and gravity hindrance, the water flow resistance is larger, and the water saturation is higher in the down-dip reservoir (Kang et al., 2019). In the second stage (2–4 years), the decrease rate of water saturation in ASIM was higher than the decrease rate of water saturation of ISIM, and the drainage effect of ASIM was better. Compared with ISIM, except for the common heterogeneity of gas content, porosity, permeability, and reservoir pressure, ASIM was characterized by the heterogeneities of reservoir distribution and dip angle, which make the water transport processes of ASIM more complex. In the third stage (4–10 years), since most of the reservoir water was reduced to the critical water saturation and stopped flowing, the ASIM and ISIM water saturation decline rates gradually slowed. In the process of drainage, the variation characteristics of water saturation in ASIM were more consistent with the actual geological conditions, but overall, groundwater migration followed the gravity effect, and the water saturation of the up-dip reservoir decreased quicker than the water saturation of the down-dip reservoir.
6.1.2 Reservoir pressure
Monitoring the pressure dynamics in the process of CBM drainage is of great significance for determining the propagation law of reservoir pressure and guiding CBM drainage (Du et al., 2011). The drainage of CBM wells causes the formation of a pressure drop funnel, but the distribution of reservoir pressure is not uniform in space, and the pressure change also shows a nonlinear curve (Wang et al., 2012). In the process of studying reservoir pressure dynamics through numerical simulation, coal seams are usually assumed to be homogeneous (Yan et al., 2021). However, under special geological conditions, homogeneous coal reservoirs are no longer applicable.
The change in pressure is dominated by the production of water in the coal reservoir. With the production of groundwater, the reservoir pressure decreased gradually. Under ideal conditions, the reservoir pressure propagates radially from the wellbore center and elliptically from the fracture center after fracturing (Xu et al., 2013). Due to the production of a large amount of groundwater in the first stage (0–2 years), the reservoir pressure obviously decreases, and the reservoir pressure decreases in the ASIM and ISIM exhibit little difference. In the second stage (2–4 years) of drainage, the water production rate was relatively slower, and the reservoir pressure of the ASIM and ISIM decreased slightly compared with the first stage (0–2 years). The pressure drop of the ASIM is more difficult than the pressure drop of the ISIM in the down-dip direction. In the third stage (4–10 years), the ASIM pressure drops faster than the ISIM. In this stage, the up-dip pressure drop of ASIM was greater than that of ISIM, providing most of the pressure drop rate for the overall reservoir. The better drainage effect of ASIM (Table 3), which is more conducive to the desorption of CBM, led to a relatively larger decrease in reservoir pressure than the drainage effect of ISIM. Considering the topography distribution of the coal seam, the groundwater migrated to the down-dip reservoir due to the action of gravity and pressure difference. As a result, the up-dip reservoir pressure dropped rapidly, and it was difficult for the down-dip water to overcome its own gravity, so the pressure drop propagation speed and distance were smaller (Wang et al., 2014).
6.1.3 Gas content
For different types of coal reservoirs, the variations in gas content in the process of drainage and production were obviously different. It is of great significance to clarify the dynamic change process of gas content for revealing the dynamic process of CBM well drainage, with the purpose of guiding coal reservoir development optimization (Shao et al., 2017). The reduction rate of the gas content in a coal reservoir determines the production rate of CBM wells (Ma et al., 2021).
In the first stage (0–2 years) of drainage, the reduction rates of gas content in ASIM and ISIM were low because single water phase flow was dominant, and there was no gas-water differentiation phenomenon in ASIM and ISIM. Most of the reservoir did not reach the critical desorption pressure. The CBM near the wellbore was preferentially desorbed. In the second stage (2–4 years), the desorption range gradually expanded outward from the wellbore, and the ASIM expanded more slowly than the ISIM. The CBM reservoir had not reached the large area desorption stage. The desorption capacity of ASIM in the up-dip direction was greater than the desorption capacity of ISIM in the third stage (4–10 years). The decrease rate of gas content in ASIM was greater than the decrease rate of gas content in ISIM. Due to drainage depressurization, the CBM of the up-dip reservoir begins to desorb over a large area, and the CBM of the down-dip reservoir also gradually desorbs. In the third stage (4–10 years) of the drainage process, the gas content decline rate of ASIM was higher than the gas content decline rate of ISIM, indicating that the topography of the coal seam can improve the recovery of CBM to a certain extent. The heterogeneity of the ASIM reservoir distribution is more complex than the heterogeneity of the ISIM reservoir distribution, and the production of gas and water is more complex, thus indirectly affecting the dynamic changes in reservoir physical properties.
6.2 Prediction accuracy between actual steeply inclined model and ideal steeply inclined model
After 595 days, the ASIM was closer to the actual observed gas production data (Figure 8A), possibly because the reservoir physical properties of ISIM were more homogeneous than the reservoir physical properties of ASIM; thus, the ISIM has a period (600th day–1000th day in Figure 8A) of stable gas production stage, in which the data deviated greatly from the actual gas production data.
The distribution of real coal reservoirs is more different from the distribution of real coal reservoirs of ISIM, and the degree of heterogeneity is stronger. ASIM is more representative of the actual coal reservoir distribution than ISIM. Therefore, the variations in water saturation, pressure drop, and gas content are complicated by the heterogeneity of the actual coal seam distribution, resulting in the discontinuity of gas production. The first gas production peak occurs due to preferential desorption of the reservoir near the wellbore. The degree of reservoir heterogeneity in the vicinity of the ASIM and ISIM wells is similar, so the first peak gas production in ASIM is close to the first peak gas production in ISIM. In the later stage of drainage, the gas supply range of ASIM is larger at the same time, resulting in the daily gas production of ASIM being larger than the daily gas production of ISIM. Multiple peaks were formed in the gas production curves (Figure 8A), and different gas production peaks were contributed by different parts of the reservoir. During the horizontal reservoir drainage process, the daily gas will gradually increase to the peak and gradually decrease. With the increase of coal seam inclination angle, the double peak pattern of daily gas production gradually appeared and became more and more obvious (Alireza and Özgen, 2017; Kang et al., 2019). The variations in reservoir size, gas content, permeability, and grid dip angle under different burial depth conditions in the model promote the formation of multiple gas production peak curves. The10-year cumulative gas production of ASIM was approximately 9.94% higher than the 10-year cumulative gas production of ISIM (Figure 8B), and the peak gas production occurred relatively early.
7 Conclusion
In this study, the ASIM and ISIM of CBM drainage and production were constructed. The dynamic variation characteristics of water saturation, reservoir pressure, and gas content in ASIM and ISIM were discussed. The whole CBM extraction process was divided into three stages: the first stage (0–2 years), the second stage (2–4 years), and the third stage (4–10 years). The following conclusions were drawn.
1) The heterogeneity of the reservoir dip angle forms different gas producing regions and affects the change in the production curve. In the third stage (4–10 years) of drainage, the daily gas production and cumulative gas production of the ASIM are larger than the daily gas production and cumulative gas production of the ISIM. The drainage effect of the ASIM is considered to be better in the third stage (4–10 years);
2) In the second stage (2–4 years) and the third stage (4–10 years) of drainage, the ASIM water saturation decreased greatly due to the combination of the reservoir grid distribution and the dip angle of each reservoir grid.
3) In the first stage (0–2 years) and second stage (2–4 years) of drainage, the decrease rate of reservoir pressure in ASIM is smaller than the decrease rate of reservoir pressure in ISIM. However, in the third stage (4–10 years), the decrease rate of reservoir pressure is larger in ASIM than in ISIM because of the better drainage effect of the ASIM;
4) The variation trend of gas content was dominated by gas water differentiation. In the first stage (0–2 years) and second stage (2–4 years) of drainage, the decrease rate of gas content in the ASIM first increased and then decreased. In the third stage (4–10 years) of drainage, the ASIM has a higher recovery efficiency. Due to the heterogeneity of the ASIM reservoir distribution, the production of gas and water is more complex.
Data availability statement
The original contributions presented in the study are included in the article/supplementary material, further inquiries can be directed to the corresponding author.
Author contributions
All authors listed have made a substantial, direct, and intellectual contribution to the work and approved it for publication.
Funding
This study was funded by the National Natural Science Foundation of China (42002188), Natural Science Foundation of Xinjiang Uygur Autonomous Region (2022D01C79), and the National Innovation Training Program for College Students (202110755007).
Acknowledgments
We would like to thank Xinjiang Collingstead New Energy Co., Ltd. for providing data support and Schlumberger company for providing software technical support in this study.
Conflict of interest
The authors declare that the research was conducted in the absence of any commercial or financial relationships that could be construed as a potential conflict of interest.
Publisher’s note
All claims expressed in this article are solely those of the authors and do not necessarily represent those of their affiliated organizations, or those of the publisher, the editors and the reviewers. Any product that may be evaluated in this article, or claim that may be made by its manufacturer, is not guaranteed or endorsed by the publisher.
References
Alireza, S., and Özgen, K. C. (2017). Cross-formational flow of water into coalbed methane reservoirs: Controls on relative permeability curve shape and production profile. Environ. Earth Sci. 76 (5), 200. doi:10.1007/s12665-017-6505-0
Dong, J., Cheng, Y. P., and Pan, Z. J. (2020). Comparison of transient and pseudo-steady diffusion of methane in coal and implications for coalbed methane control. J. Petroleum Sci. Eng. 184, 106543. doi:10.1016/j.petrol.2019.106543
Du, Y. F., Wu, C. F., Zou, M. J., Wang, C., Jiang, W., and Lei, B. (2011). Study on reservoir pressure transmission law during gas mining and drainage process of coal bed methane well. Coal Eng. 1 (7), 87–89. doi:10.3969/j.issn.1671-0959.2011.07.034
Duan, L. J., Qu, L. C., Xia, Z. H., Liu, L. L., and Wang, J. J. (2020). Stochastic modeling for estimating coalbed methane resources. Energy fuels.. 34 (5), 5196–5204. doi:10.1021/acs.energyfuels.9b03549
Fu, X. H., Li, S., Yu, J. C., and Wu, Y. X. (2014). Dynamic monitor on coal reservoir water system during drainage process of coalbed methane well. J. China Coal Soc. 39 (1), 26–31. doi:10.13225/j.cnki.jccs.2013.0919
Fu, H. J., Tang, D. Z., Xu, H., Xu, T., Chen, B. L., Hu, P., et al. (2016). Geological characteristics and CBM exploration potential evaluation: A case study in the middle of the southern Junggar Basin, NW China. J. Nat. Gas. Sci. Eng. 30, 557–570. doi:10.1016/j.jngse.2016.02.024
Fu, X. H., Kang, J. Q., Liang, S., Gao, L., and Chen, X. (2018). Well type optimization and physical property in gas drainage process of steep inclined coal reservoir in Fukang Western Block. Coal Sci. Technol. 46 (6), 9–16. doi:10.13199/j.cnki.cst.2018.06.002
Ge, X., Liu, D. M., Cai, Y. D., and Wang, Y. J. (2018). Gas content evaluation of coalbed methane reservoir in the Fukang area of southern Junggar Basin, northwest China by multiple geophysical logging methods. Energies 11, 1867. doi:10.3390/en11071867
Guo, J. G., Pang, X. Q., Guo, F. T., Wang, X. L., Xiang, C. F., Jiang, F. J., et al. (2014). Petroleum generation and expulsion characteristics of lower and middle jurassic source rocks on the southern margin of Junggar Basin, northwest China: Implications for unconventional gas potential. Can. J. Earth Sci. 51 (6), 537–557. doi:10.1139/cjes-2013-0200
Hu, Z. P. (2019). Study on main controlling factors of coal reservoir permeability in baiyanghe mining area of Fukang. China Coalbed Methane 16 (2), 24–26. CNKI:SUN:ZGMC.0.2019-02-008
Hu, Z. P., Wang, Q., and Wu, H. (2019). Study on water production characteristics of CBM wells in baiyanghe mining area of Fukang in Xinjiang. China Coalbed Methane 16 (3), 7–11. CNKI:SUN:ZGMC.0.2019-03-002
Ibrahim, A. F., and Nasr-El-Din, H. A. (2015). A comprehensive model to history match and predict gas/water production from coal seams. Int. J. Coal Geol. 146, 79–90. doi:10.1016/j.coal.2015.05.004
Jiang, H. B., Qin, Q. M., and Li, B. S. (2011). Passive SLF spectrum analysis for tracing the mining dynamic of CBM. Spectrosc. Spectr. Anal. 31 (7), 1898–1901. doi:10.3964/j.issn.1000-0593(2011)07-1898-04
Kang, Y. S., Wang, J., Jiang, S. Y., Ye, J. P., Zhang, S. R., Zhang, B., et al. (2016). Analysis on controlling geological factors influencing drainage performance of coalbed methane wells. Geol. Rev. 62 (6), 1511–1520. doi:10.16509/j.georeview.2016.06.011
Kang, Y. S., Zhang, B., Yu, X., Yu, X., Wang, J., Jiang, S. Y., et al. (2017). Formation mechanism of well performance and CBM development strategy in Shouyang Block, Qinshui Basin. Nat. Gas. Geosci. 28 (1), 116–126. doi:10.11764/j.issn.1672-1926.2016.11.025
Kang, J. Q., Fu, X. H., Gao, L., and Liang, S. (2018). Production profile characteristics of large dip angle coal reservoir and its impact on coalbed methane production: A case study on the Fukang west block, southern Junggar Basin, China. J. Pet. Sci. Eng. 171, 99–114. doi:10.1016/j.petrol.2018.07.044
Kang, J. Q., Fu, X. H., Liang, S., Li, X., Chen, X., and Wang, Z. Z. (2019). A numerical simulation study on the characteristics of the gas production profile and its formation mechanisms for different dip angles in coal reservoirs. J. Pet. Sci. Eng. 181, 106198. doi:10.1016/j.petrol.2019.106198
Kang, J. Q., Fu, X. H., Elsworth, D., and Liang, S. (2020). Vertical heterogeneity of permeability and gas content of ultra-high-thickness coalbed methane reservoirs in the southern margin of the Junggar Basin and its influence on gas production. J. Nat. Gas. Sci. Eng. 81, 103455. doi:10.1016/j.jngse.2020.103455
Karacan, C. Ö., Drobniak, A., and Mastalerz, M. (2014). Coal bed reservoir simulation with geostatistical property realizations for simultaneous multi-well production history matching: A case study from Illinois basin, Indiana, USA. Int. J. Coal Geol. 131, 71–89. doi:10.1016/j.coal.2014.06.002
Karimpouli, S., Tahmasebi, P., and Ramandi, H. L. (2020). A review of experimental and numerical modeling of digital coalbed methane: Imaging, segmentation, fracture modeling and permeability prediction. Int. J. Coal Geol. 228, 103552. doi:10.1016/j.coal.2020.103552
Li, J. H., Su, X. B., Lin, X. Y., and Guo, H. Y. (2009). Relationship between discharge rate and productivity of coalbed methane wells. J. China Coal Soc. 34 (3), 376–380. doi:10.13225/j.cnki.jccs.2009.03.002
Li, X., Fu, X. H., Yang, X. S., Ge, Y. Y., and Quan, F. K. (2018). Coalbed methane accumulation and dissipation patterns: A case study of the Junggar Basin, NW China. J. Asian Earth Sci. 160, 13–26. doi:10.1016/j.jseaes.2018.04.003
Liang, S., Han, H., Elsworth, D., Fu, X. H., Yao, Q. L., Kang, J. Q., et al. (2020). Evolution of production and transport characteristics of steeply-dipping ultra-thick coalbed methane reservoirs. Energies 13, 5081. doi:10.3390/en13195081
Liu, C. L., Wang, X. H., Liu, K., Wang, J., Guo, H., and Sun, Z. Q. (2014). Occurrence features of coalbed methane in inclined coal seam of Junggar basin, Xinjiang. Adv. Mater. Res. 868, 696–699. doi:10.4028/www.scientific.net/AMR.868.696
Liu, N., Sun, L. L., Qin, B. T., Zhang, S. H., and Du, W. Z. (2021). Evolution of pore and fracture of coal under heating–freezing effects: An experimental study. Fuel 306, 121618. doi:10.1016/j.fuel.2021.121618
Ma, D. M., J, Y. S., Chen, Y., Zhen, C., Teng, J. X., Ma, Z. Y., et al. (2021). CBM well drainage data-based dynamic inversion study of reservoir gas content. Coal Geol. Explor. 49 (6), 67–73. doi:10.3969/j.issn.1001-1986.2021.06.007
Mohamed, T., and Mehana, M. (2020). CoalBed methane characterization and modeling: Review and outlook. Energy Sources Part A Recovery Util. Environ. Eff. 10, 1–23. doi:10.1080/15567036.2020.1845877
Mostaghimi, P., Armstrong, R. T., Gerami, A., Hu, Y. B., Jing, Y., Kamali, F., et al. (2017). Cleat-scale characterisation of coal: An overview. J. Nat. Gas. Sci. Eng. 39, 143–160. doi:10.1016/j.jngse.2017.01.025
Pu, Y. F., Tang, D. Z., Tao, S., Tang, S. L., Zhang, A. B., and Zhang, T. Y. (2021). Evaluation and optimization of development intervals under conditions of multiple coal seam combinations in Fukang area, Xinjiang Province. J. China Coal Soc. 46 (7), 2321–2330. doi:10.13225/j.cnki.jccs.2020.0326
Qin, Y., Moore, T. A., Shen, J., Yang, Z. B., Shen, Y. L., and Wang, G. (2018). Resources and geology of coalbed methane in China: A review. Int. Geol. Rev. 60 (5-6), 777–812. doi:10.1080/00206814.2017.1408034
Qin, Y. P., Xu, H., Liu, W., Liu, J., and Duan, W. P. (2020). Time- and pressure-independent gas transport behavior in a coal matrix: Model development and improvement. Energy fuels.. 34 (8), 9355–9370. doi:10.1021/acs.energyfuels.0c01182
Qin, Y., Shen, J., and Shi, R. (2022). Strategic value and choice on construction of large CMG industry in China. J. China Coal Soc. 47 (1), 371–387. doi:10.13225/j.cnki.jccs.yg21.1616
Quan, F. K., Wei, C. T., Hao, S. Q., Ma, J. S., Song, Y., and Lian, Da. (2022a). Interference analysis of methane Co-production from two coal seams in southern Qinshui Basin. Nat. Resour. Res. 31 (3), 1475–1502. doi:10.1007/s11053-022-10043-w
Quan, F. K., Wei, C. T., Ma, J. S., Hao, S. Q., and Song, Y. (2022b). Modeling analysis of coalbed methane co-production interference: A case study in eastern yunnan basin, China. J. Nat. Gas. Sci. Eng. 103, 104631. doi:10.1016/j.jngse.2022.104631
Sayyafzadeh, M., Keshavarz, A., Alias, A. R. M., Dong, K. A., and Manser, M. (2015). Investigation of varying-composition gas injection for coalbed methane recovery enhancement: A simulation-based study. J. Nat. Gas. Sci. Eng. 27, 1205–1212. doi:10.1016/j.jngse.2015.09.071
Senthamaraikkannan, G., Budwill, K., Gates, I., Mitra, S. K., and Prasad, V. (2016). Kinetic modeling of the biogenic production of coalbed methane. Energy fuels.. 30 (2), 871–883. doi:10.1021/acs.energyfuels.5b02450
Shao, L. Y., Hou, H. H., Tang, Y., Lu, J., Qiu, H. J., Wang, X. T., et al. (2015). Selection of strategic replacement areas for CBM exploration and development in China. Nat. Gas. Ind. B 2 (2-3), 211–221. doi:10.1016/j.ngib.2015.07.013
Shao, C. K., Xue, Y. Y., and Wei, C. T. (2017). Variation research of gas content of three states during coalbed methane drainage process. Coal Technol. 36 (8), 28–31. doi:10.13301/j.cnki.ct.2017.08.011
Shi, Y. X., Chen, X., Zhao, Y. W., Yang, X. S., and Liu, D. G. (2018). Analysis on geological influencing factors of coalbed methane productivity in Fukang Western Mining Area. Coal Eng. 50 (2), 133–136. doi:10.11799/ce201802035
Sun, Z., Li, X. F., Shi, J. T., Yu, P. L., Huang, L., Xia, J., et al. (2017). A semi-analytical model for drainage and desorption area expansion during coal-bed methane production. Fuel 204, 214–226. doi:10.1016/j.fuel.2017.05.047
Tang, Z. Q., Yang, S. Q., Xu, G., Sharifzadeh, M., and Zhai, C. (2018). Evolution law of adsorption and desorption characteristics of CH4 in coal masses during coalbed methane extraction. Energy fuels.. 32 (10), 10540–10548. doi:10.1021/acs.energyfuels.8b02318
Wan, Y. Z., Liu, Y. W., Ouyang, W. P., Liu, W. C., and Han, G. F. (2016). Desorption area and pressure-drop region of wells in a homogeneous coalbed. J. Nat. Gas. Sci. Eng. 28, 1–14. doi:10.1016/j.jngse.2015.11.026
Wang, J. L., Qin, Y., and Fu, X. H. (2012). New insight into the methanism for dynamic coalbed methane drainage. Geol. J. China Univ. 18 (3), 583–588. doi:10.16108/j.issn1006-7493.2012.03.012
Wang, S. W., Wang, F. M., Hou, G. J., Wu, X. M., Zhang, C., Zhang, Y. C., et al. (2014). CBM development well type for steep seam in Fukang Baiyanghe mining area, Xinjiang. J. China Coal Soc. 39 (9), 1914–1918. doi:10.13225/j.cnki.jccs.2014.8018
Wang, H. L., Zhang, S. A., Chen, D., Huang, H. X., and Zhao, Z. P. (2020). Dynamic distribution of remaining gas content in steep and thick coal seams in baiyanghe mining area of Fukang. Xinjiang Pet. Geol. 41 (5), 587–591. doi:10.7657/XJPG20200512
Wang, Z. R., Wen, Z. Y., and Chen, L. X. (2021). Productivity prediction of vertical test well for fractured coal reservoir under hydraulic fracturing. Nat. Gas. Geosci. 32 (4), 465–471. doi:10.11764/j.issn.1672-1926.2020.10.006
Xin, F. D., Xu, H., Tang, D. Z., Yang, J. S., Chen, Y. P., Cao, L. K., et al. (2019). Pore structure evolution of low-rank coal in China. Int. J. Coal Geol. 205, 126–139. doi:10.1016/j.coal.2019.02.013
Xu, B. X., Li, X. F., Haghighi, M., Ren, W. N., Du, X. Y., Chen, D., et al. (2013). Optimization of hydraulically fractured well configuration in anisotropic coal-bed methane reservoirs. Fuel 107, 859–865. doi:10.1016/j.fuel.2013.01.063
Yan, X. L., Zhang, S. H., Tang, S. H., Li, Z. C., Yi, Y. X., Zhang, Q., et al. (2020). A comprehensive coal reservoir classification method base on permeability dynamic change and its application. Energies 13 (3), 644. doi:10.3390/en13030644
Yan, X. L., Zhang, S. H., Tang, S. H., Li, Z. C., Guan, W., Zhang, Q., et al. (2021). A prediction model for pressure propagation and production boundary during coalbed methane development. Energy fuels.. 35 (2), 1219–1233. doi:10.1021/acs.energyfuels.0c03354
Yarmohammadtooski, Z., Salmachi, A., White, A., and Rajabi, M. (2017). Fluid flow characteristics of bandanna coal formation: A case study from the fairview field, eastern Australia. Aust. J. Earth Sci. 64 (3), 319–333. doi:10.1080/08120099.2017.1292316
Zhang, B. X., Deng, Z., Fu, X. H., and Yin, K. (2021). A study on three-phase gas content in coal reservoirs and coalbed methane-water differential distribution in the western Fukang mining area, Xinjiang, China. ACS omega 6 (5), 3999–4012. doi:10.1021/acsomega.0c05930
Zhao, J. L., and Chi, J. W. (2020). Review and prospect of influencing factors and prediction methods of coal bed gas reservoir physical properties. Prog. Geophys. (in Chinese) 35 (1), 0272–0280. doi:10.6038/pg2020CC0542
Keywords: coalbed methane, numerical simulation, reservoir pressure, gas content, dynamic
Citation: Qin Q, Li X, Peng R, Peng S, Liu Y, Zhou X and Yang J (2022) Coalbed methane reservoir dynamic simulation comparisons using the actual steeply inclined model and ideal steeply inclined model. Front. Earth Sci. 10:999516. doi: 10.3389/feart.2022.999516
Received: 21 July 2022; Accepted: 08 August 2022;
Published: 01 September 2022.
Edited by:
Junjian Zhang, Shandong University of Science and Technology, ChinaReviewed by:
Junqiang Kang, China University of Mining and Technology, ChinaFangkai Quan, China University of Mining and Technology, China
Copyright © 2022 Qin, Li, Peng, Peng, Liu, Zhou and Yang. This is an open-access article distributed under the terms of the Creative Commons Attribution License (CC BY). The use, distribution or reproduction in other forums is permitted, provided the original author(s) and the copyright owner(s) are credited and that the original publication in this journal is cited, in accordance with accepted academic practice. No use, distribution or reproduction is permitted which does not comply with these terms.
*Correspondence: Xin Li, bGl4aW53YXhqQHhqdS5lZHUuY24=