 Yu Qu
Yu Qu Lin Sun
 Qing hua Su1,2
- 1College of Surveying and Spatial Information, Shandong University of Science and Technology, Qingdao, China
- 2College of Geography and Tourism, Qu fu Normal University, Qufu, China
- 3College of Earth Science and Technology, China University of Petroleum, Qingdao, China
Traditional sandstorm detection methods use radiation differences among dust, underlying surface, and cloud to distinguish them by setting appropriate thresholds. Owing to the complex structure of the underlying surface, dust, and cloud, it is difficult to set a uniform threshold to achieve high-precision separation. Deep learning (DL) has powerful information mining capabilities and can fully use spectral differences between dust, land surface, and clouds. However, under the limited band information provided by satellite sensors, DL cannot easily distinguish highly heterogeneous land surfaces from multi-modal dust and cloud. This study proposes a sandstorm detection algorithm with DL supported by a land surface reflectance (LSR) dataset. The clear sky LSR dataset was obtained based on the MOD09A1 product. Based on the dataset, the difference between the reflectance observed by the satellite and the corresponding LSR is generated, which is used as a characteristic parameter of sandstorm detection with the deep learning method. The sandstorm detection of MODIS data is realized using multi-band radiation and radiation difference with DL. Results showed that the sandstorm detection algorithm used in this study was consistent with the OMI AI product with a detection accuracy of 84.6%. Compared with the detection results without the LSR dataset, this method effectively improves the accuracy of sandstorm identification.
1 Introduction
Sandstorms are a common natural weather phenomenon with horizontal visibility of less than 1 km owing to special geographical environments and meteorological conditions. Sandstorms play an important role in global climate change and have become a major environmental issue, while also affecting air quality, water energy cycles, and ecosystems. Dust aerosols scatter or absorb solar and ground thermal radiations and change the properties of clouds, thereby influencing earth's radiation budget balance (Garrett and Zhao, 2006; Andreae and Rosenfeld, 2008; Xie et al., 2013; Zhao and Garrett, 2015).
Routine detection of sandstorms are mainly performed by ground stations; however, it is difficult to achieve accurate large-scale sandstorm detection owing to the limited number of ground sites. With the rapid development of satellite remote sensing technology, new types of remote sensing data with high spatial, temporal, and spectral resolution have been developed on a large scale. Therefore, using satellite remote sensing can help overcome several constraints of traditional ground sandstorm detection. Satellite remote sensing enables large-scale, high-frequency detection of dust distribution and intensity, which makes up for the lack of ground observation data, as well as comprehensive utilization, mutual verification, and complementary advantages with ground detection data (Fan et al., 2003; Haiping et al., 2003). At present, sandstorms are mainly detected through empirical physics-based methods and artificial intelligence (AI) methods (Shahrisvand and Akhoondzadeh, 2013). Empirical methods are radiation-based physical methods that depend on the physical properties and spectral characteristics of dust particles in the visible, near-infrared, and thermal infrared bands (Yan et al., 2020).
The physics-based sandstorm detection algorithm is more mature. It utilizes the difference in reflectance between dust and different ground objects, the difference in the reflectance of clouds in the visible and near-infrared bands (Kaufman et al., 2001), and the brightness temperature difference (BTD) in the thermal infrared band (Darmenov and Sokolik, 2005). By setting a single channel or a combination of multiple channels and setting the threshold, the discrimination of dust pixels can be realized. Ackerman (1997) proposed a split window BTD method that used the BTD values of 8, 11, and 12 µm channels of Advanced Very High Resolution Radiometer (AVHRR) and High Resolution Infra Red Radiation Sounder (HIRS)/2) satellites to monitor dust over the Arabian Peninsula and the adjacent Arabian Sea; this method is less effective for dust detecting over land. Qu et al. (2006) proposed a normalized difference dust index (NDDI) based on the spectral reflectance characteristics of dust using reflectance values of 2.13 µm and 0.469 µm. NDDI is generally positive for dust pixels, negative for clouds, and close to zero for clear sky land surfaces, which indicates that NDDI can distinguish dust storms from clouds. However, NDDI is not sensitive to dust density and dust height. Furthermore, under high-density dust storms, the NDDI value is very low, making it difficult for NDDI to distinguish dust above the bright land surface.
To improve the accuracy of sandstorm detection, visible light, near-infrared, and thermal infrared bands of sandstorm detecting algorithms have also been developed. Miller (2003) proposed a logarithmic-scale normalized difference from the reflectance in the 0.645 µm and 0.853 µm bands of the MODIS data and combined it with the BTD between the 11 µm and 12 µm bands to achieve sandstorms detection of land and water bodies in the sky. Su et al. (2017) analyzed the spectral characteristics of dust, clouds, and different ground objects using the reflectance values of the MODIS data in the visible and near-infrared bands of 0.645 µm, 0.469 µm, and 1.64 µm, and the thermal infrared bands of 3.75 µm and 4.465 µm, 11.03 µm, 12.02 µm brightness temperature to build a discriminant model and realize the dynamic detection of sandstorms.
Dust storm detection based on physical thresholds is mainly based on the radiation and spectral absorption differences between dust and normal ground objects and cloud cover areas in different wavelength bands. The threshold method is better for the detection of thick dust over a single land surface type. However, for the complex spatial structure of the land surface, the obvious difference between light and dark, the uncertainty of the LSR, the diversity of cloud and dust forms, and different sensor types, as a result, the threshold method for sandstorm detection has great complexity and uncertainty, and it is difficult to achieve high-precision detection of dust storms. The main limitation of sandstorm detection based on physical thresholds is the determination of thresholds, which have great variability relative to changes in land surface types (Rivas-Perea et al., 2013). This limitation can be overcome by machine learning-based methods, which can well fuse data from different sensor types and have been proven useful for dust storm detection (Shi et al., 2019; Boroughani et al., 2020; Berndt et al., 2021; Lee et al., 2021; Amiri and Soleimani, 2022).
To achieve high-precision detection and perfection of the sandstorm, deep learning in artificial intelligence with strong information mining ability has been introduced (Hou et al., 2020). Deep learning can extract multi-type features of remote sensing data and make full use of the differences between dust and land surface types, as well as the spectrum, color, shape, texture, and other types of clouds, and has good application potential in dust storms detection (Zhang et al., 2016; Liqiang et al., 2020). Chacon-Murguía et al. (2011) proposed an artificial neural network (ANN) to detect dust, which can distinguish backgrounds such as dust, vegetation, and soil with high accuracy. Ma and Gong (2012) used multiple parameters in the Cloud-Aerosol Lidar and Infrared Path under Satellite Observation (CALIPSO) satellite as feature vectors to improve the classification accuracy of thick dust and clouds through a support vector machine (SVM) classifier. Ramasubramanian et al. (2021) use the red, green, and blue (RGB) products in the Geostationary Operational Environmental Satellites-16 (GOES-16) satellite data as the input features of the U-net model and use the band difference of the GOES-16 satellite to detect the dust during the day and night. The results showed that the U-net model has high accuracy in detecting dust and does not require a large amount of training data but only uses the information of three bands, and the detection accuracy of dust above the bright land surface is low. Jiang et al. (2021) employed random forests (RF) and convolutional neural networks (CNN) for 0.47 µm, 0.65 µm, and 0.825 µm channels in the Advanced Geosynchronous Radiation Imager (AGRI) in the FY-4A satellite model to monitor dust in the Tarim Basin. Therefore, deep learning can fully utilize the spectral, spatial, and other information differences between dust, land surface, and cloud, and hence, show good application potential in sandstorm detection. However, the characteristics of clouds and dust are different owing to their different forms. Particularly, when the pixels are covered by thin dust and thin clouds, changes in cloud and dust on the land surface can change the radiation information, leading to complex uncertainties and limiting the band information provided by satellite sensors; owing to this, deep learning technology cannot distinguish between a highly heterogeneous land surface and polymorphic dust and clouds. This can be classified as an unknown land surface information problem.
Therefore, this article proposes priori LSR dataset products to provide a specific information source for deep learning. Based on the original single-phase data spectrum, texture, and other information, we increase the difference information between the image to be detected and the real background of the ground and improve the accuracy of dust storms detection by obtaining the difference between the changes of dust or cloud to the known land surface information. MODIS data exhibit high spatial and spectral resolution, which can provide rich information for sandstorm detection. Therefore, this study uses the MOD09A1 product data to construct the LSR dataset, calculate the difference information between the image to be detected and the real LSR, and use the difference between the radiation values in different bands and the LSR dataset as the source information for deep learning sandstorm detection. MODIS data were collected from different regions and phases to carry out sandstorm detection experiments and evaluate the accuracy of the detection results.
2 Materials and methods
2.1 Data sources
2.1.1 MODIS data
MODIS data has a total of 36 bands, covering visible light, near-infrared, and mid-far infrared bands, including 250 m (band 1–2), 500 m (band 3–7), and 1 km (band 8–36) spatial resolution, the spectral range is 0.4–14.44μm, and the bandwidth is 2330 km. For this experiment, MOD021KM in MODIS L1B data of Terra satellite are used to perform geometric correction and radiometric calibration on the image. It is scaled to reflectance according to the scaling method.
where R is the reflectance and scales and offsets are the calibration gain coefficient and offset coefficient.
This article uses the MODIS/Terra 8-day synthetic global land surface reflectance product MOD09A1 to construct an LSR dataset, MOD09 data are the secondary LSR product obtained from MODIS Level 1B data after strict atmospheric correction and mainly distributed in the visible light and near-infrared bands, including a total of seven bands. MOD09A1 is the estimation of the LSR of each band without the influence of atmospheric scattering or absorption and an 8-day synthetic LSR product, which is obtained through the optimal observation value within 8 days. During the synthesis process of the MOD09A1 product, one must consider the influence of low viewing angle, no cloud and cloud shadow, and low aerosol concentration. Furthermore, through the visual interpretation method, the low-quality sample data containing clouds, fog, etc. are eliminated to effectively reduce the impact of the atmospheric environment (Sun et al., 2016a). The relevant parameters of the MOD09 data are shown in Table 1 (Vermote et al., 2008), and it can be seen that each band has achieved high accuracy.
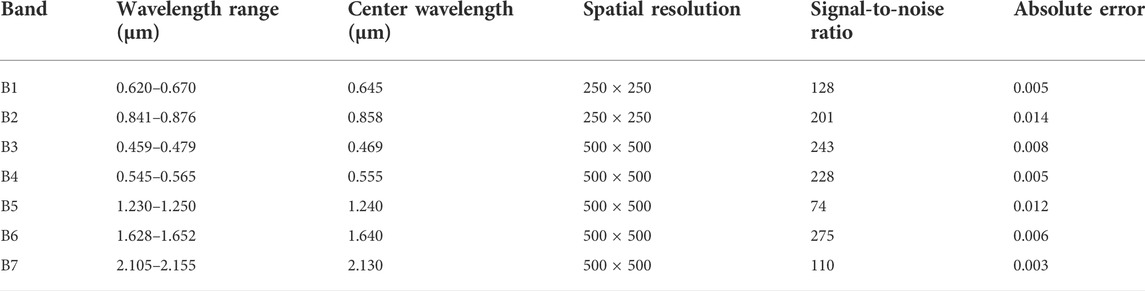
TABLE 1. MOD09 band parameters and theoretical accuracy.
2.1.2 Ozone monitoring instrument aerosol index data products
To verify the results of sandstorm detection by the proposed method, a comparative analysis was conducted using the Ozone Monitoring Instrument Aerosol Index (OMI AI) products (Yang et al., 2017). OMI is one of the important sensors on the Aura satellite with an orbital scanning width of 2600 km and spatial resolution of 13 km × 24 km. The absorbing aerosol index of OMI detection is essential for the detection of dust aerosols, considering it estimates the total content of dust aerosols in the upper air of the global region by comparing the observed upward radiance rates of the two ultraviolet bands (354, 388 nm) and through the radiative transfer model. Generally, the OMI near-UV aerosol algorithm (OMAERUV) assumes that the atmospheric scattering at 388 nm is pure Rayleigh scattering and the atmosphere can be regarded as an opaque Lambertian reflector, using the Lambertian equivalent reflectance
where
For strongly absorbing aerosols such as dust and biomass-burning aerosols, the AI is greater than 0 and increases as the optical thickness or height of the aerosol layer increases. The cloud coverage area AI value is approximately 0, whereas the non-absorbing aerosol AI is negative (Zandkarimi et al., 2020). AI can provide information on the strength and range of absorbing dust aerosols and is positively correlated with the aerosol optical thickness. Therefore, AI can help accurately monitor the occurrence of sandstorms and their trajectory, considering it has a good indication effect on dust (Torres et al., 2007).
2.2 Deep learning model for sandstorm detection
The deep learning model is widely used in remote sensing image segmentation and target recognition and has achieved greater advantages than traditional methods (Liu et al., 2020; Zhu et al., 2020). Compared with traditional methods, it has the ability to perform feature learning in an unsupervised or semi-supervised manner. It also uses the advantages of hierarchical feature extraction instead of manual recognition (Woo et al., 2018). The deep learning model adopts the convolution module to achieve end-to-end semantic segmentation, which provides an effective framework for the automatic detection of sandstorms. The sandstorm detection model includes (1) construction of a land surface reflectance database, (2) training and verification dust sample library, and (3) model training and construction.
2.2.1 Construction of the land surface reflectance database
Construction of a high-quality LSR database can provide accurate land surface prior information for sandstorm detection, provide the difference between the image to be detected and the real background of the land surface, obtain the LSR information of the specified time and space, and effectively eliminate the cloud. It can also provide basic data for the accurate determination of the LSR of clear sky pixels, highlight the reflectance differences between dust and complex forms and clouds, and improve the accuracy of sandstorm detection.
The analysis of the MOD09A1 product synthesized in 8 days in the obtained LSR data showed that there were still small amounts of clouds, haze, smog, and other concerns in some areas, which could significantly impact the accuracy of LSR. Therefore, to reduce the influence of clouds and fog, we obtained high-quality LSR data as priori data to support sandstorm detection and simultaneously reduce the amount of data calculation to improve the efficiency of data processing. Finally, this study is based on the MOD09A1 product synthesized in 8 days, generated using monthly synthetic data, to significantly reduce the impact of clouds during sandstorm detection.
We selected the MOD09A1 product synthesized in four scenes and 8 days in 1 month constructing a land surface reflectance database based on the monthly minimum synthesis method of Sun et al. (2015) and Sun et al. (2016b) expressed as follows:
where
Figure 1 shows the LSR database of northern China and southern Mongolia in April 2014, assembled into a partial standard false-color composite image (band: 2-1-4). The constructed LSR dataset exhibited less cloud cover and high image clarity.
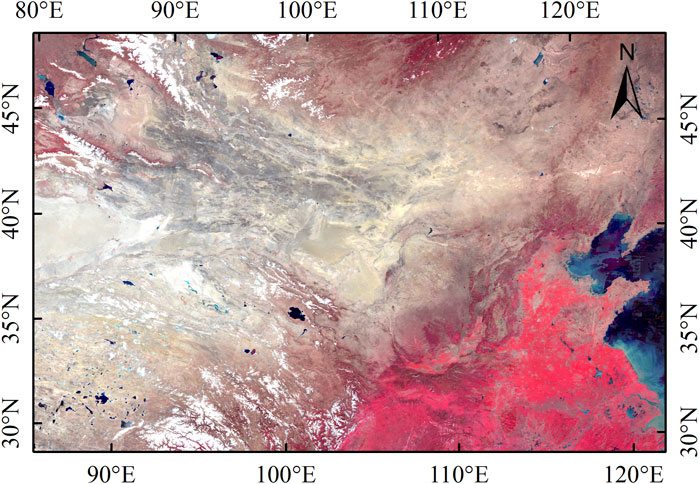
FIGURE 1. Standard false-color composite image of LSR in April 2014 (band:2-1-4).
2.2.2 Construction of the dust training and validation sample library
A large number of high-quality and widely representative sandstorm detection sample data sets are prerequisites for the high-precision detection of dust storms. To reflect the broad representativeness of the sample and enhance the adaptability of the sandstorm detection algorithm in some special cases, the construction of the sample data set comprehensively considers the following information. First, the dust sample data should cover all possible dust intensity ranges, including thick and thin dust, and different intensities of dust are combined with most typical land surface types, especially when selecting thin dust samples should include bright land surface, dark land surface, and thin cloud areas. Second, the existence of clouds with different characteristics should be considered to improve the ability to identify dust and clouds. Third, as many land surface types as possible should be covered when selecting clear sky land surfaces, especially the selection of high-brightness land surface type samples (Wei et al., 2021).
According to Tables 2, 3, 4, this study uses the land surface classification product MCD12Q1 of MODIS data as the coverage data of different land objects and selects thin and thick dust over deserts, buildings, vegetation, and waterbody, and thin clouds and thick clouds over different types. It can be seen that the combination of different forms and dust presents obvious differences in reflectance, which can highlight the differences between different land surface types and different cloud forms, while selecting deserts, buildings, vegetation, water body, etc. Clear sky pixels reduce the random error of dust training and improve the universality of dust storm detection.
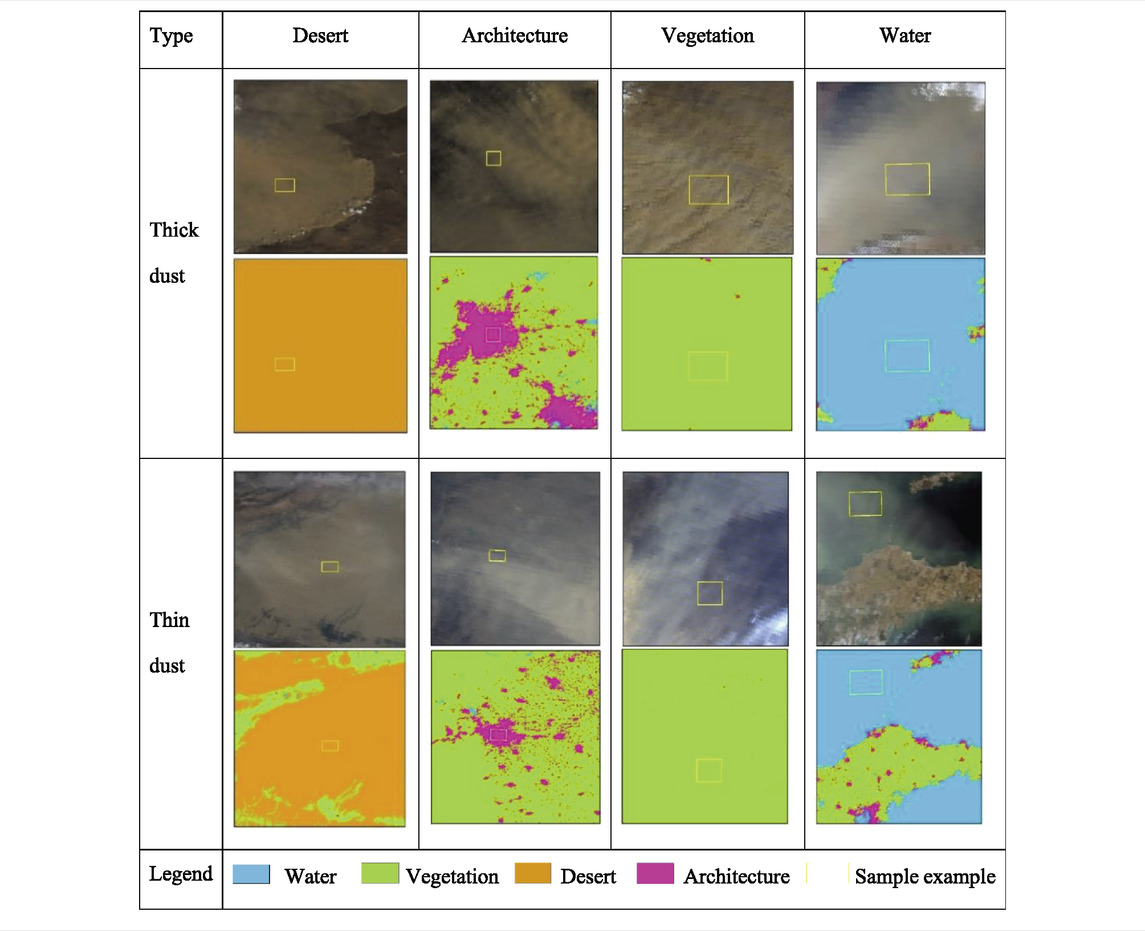
TABLE 2. Example selection of dust samples with different intensities over multiple types of land surfaces.
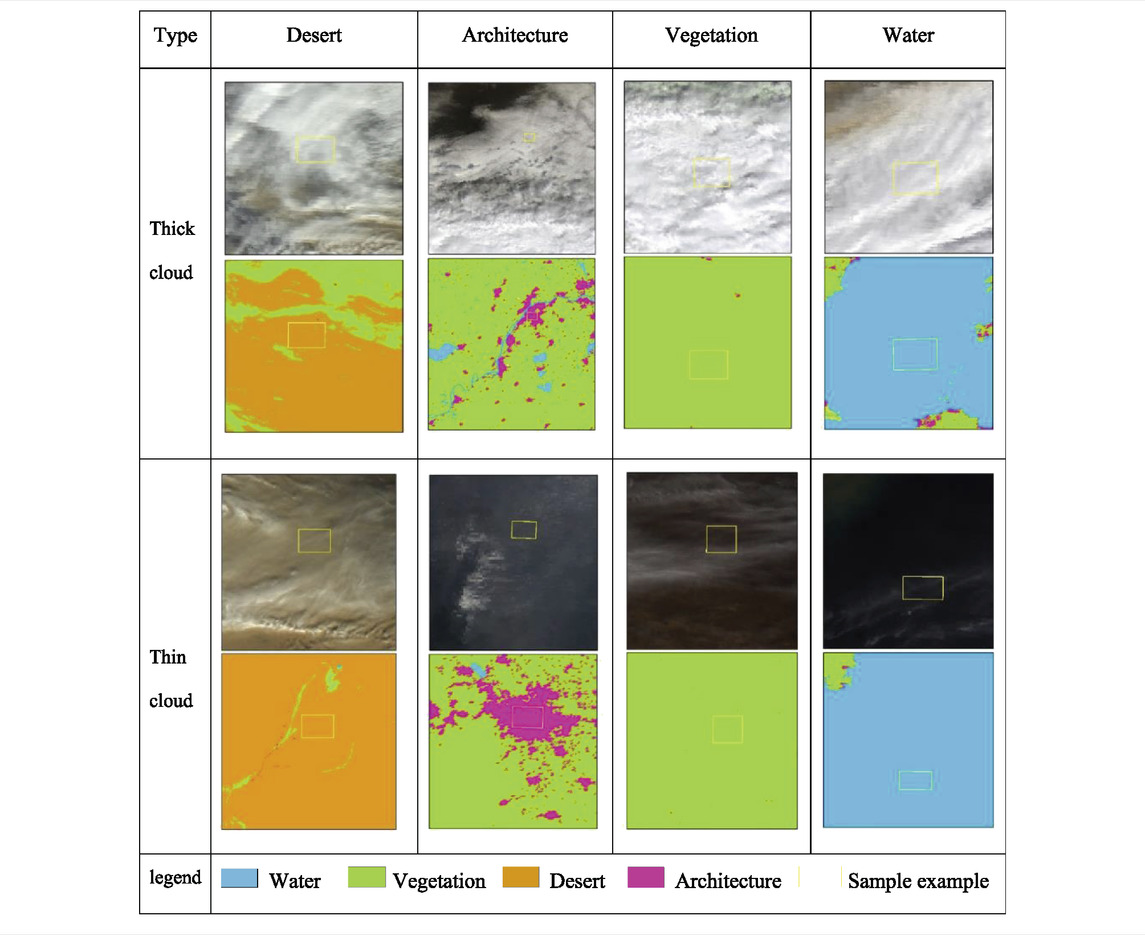
TABLE 3. Example of cloud sample selection over multiple types of land surface.
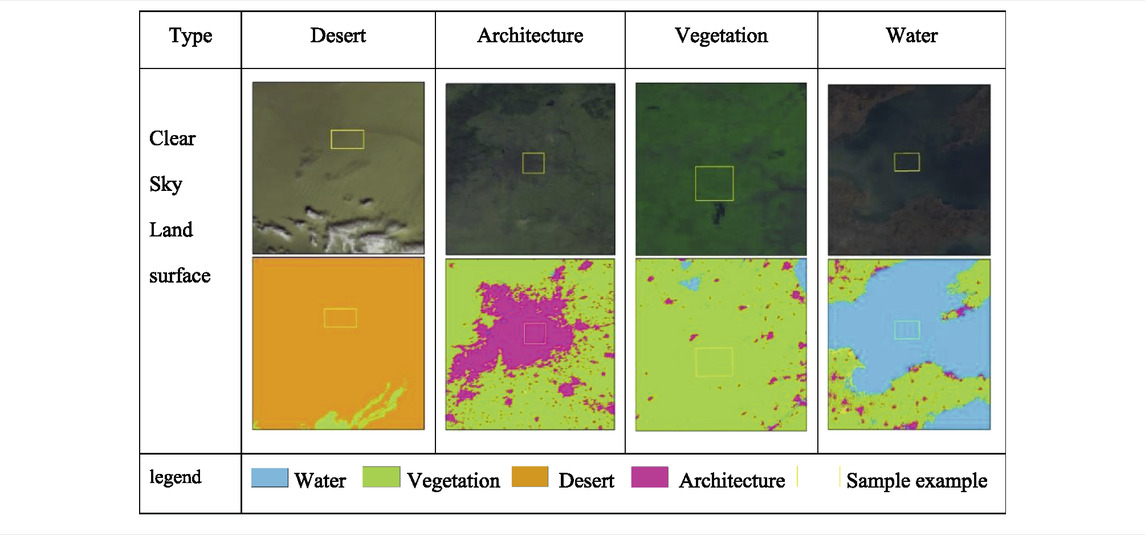
TABLE 4. Examples of multi-type clear sky land surface sample selection.
The input data of the deep learning technology sandstorm detection method proposed in this article is the difference image of the apparent reflectance of MOD021KM and the land surface reflectance data set in the 1, 2, 3, 4, 6, and 7 bands. The difference calculation formula is given as follows:
where
Through visual interpretation, and FY-4Asatellite remote sensing data products, the MODIS data of dust storms in different regions in different phases (2014–2020) were selected, and the sandstorm detection sample data set is obtained through the abovementioned formula with the LSR database. Based on this, a sandstorm detection sample data set was constructed, and a total of 76 images were obtained in the sample set. The sample example set is shown in Table 5, a is the MODIS image (band:1-4-3), and b is the land surface reflectance difference image (band:1-4-3).
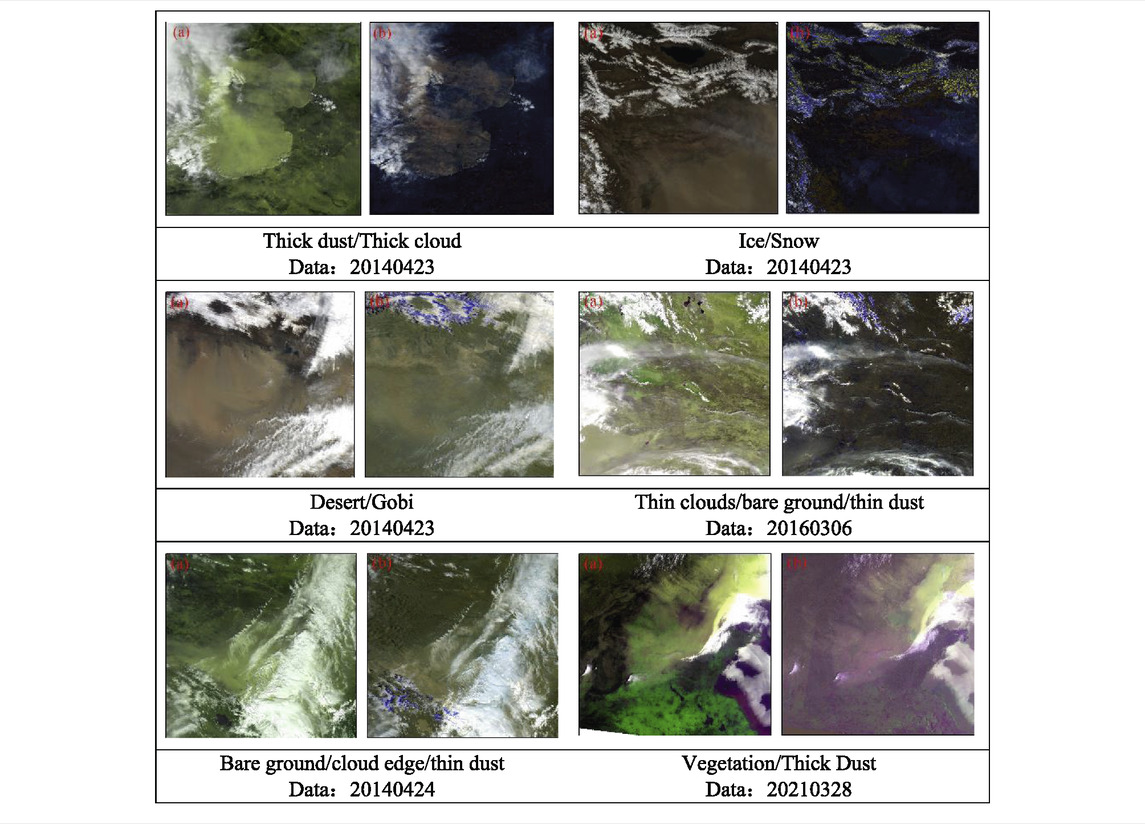
TABLE 5. Sample data of sandstorm detection of different land surface types.
According to the characteristics of selected various types of sample data, the MODIS image and the land surface reflectance difference image are compared and analyzed. The sandstorm detection sample data has a high degree of diversity; the sample data comes from different times, and the regional characteristics are obvious. Therefore, it can clearly reflect the distribution of thick and thin dust over different land surface types, highlight the differences in texture and spatial characteristics between dust and land surface types, and reduce interference of factors such as clouds and bright ground, for land surfaces such as the desert, Gobi, ice and snow, and other high-bright land surfaces in the difference image color. The boundary information characteristics exhibit a certain coherence; snow and ice appear blue in the differential image. Bare ground appears dark grey in the different images. Additionally, the land surface characteristics of vegetated areas change over time. Hence, the selection of multiple land surface types and a sufficient number of each type can help understand the generation of sandstorm detection algorithms on different land surface types, thereby making the sandstorm detection algorithm more comprehensive and reducing misjudgment.
2.2.3 Construction of the sandstorm detection model
During sandstorm detection, similar spectral information and shape characteristics will be encountered; therefore, deserts, Gobi, ice and snow, vegetation, bare ground, clouds, etc., present in the image to be identified will affect the accuracy of sandstorm detection. In the case of maintaining the spatial information characteristics of sandstorms, this study designs a sandstorm detection network model based on DeepLabv3+ (Chen et al., 2018), which is characterized by atrous spatial pyramid pooling (ASPP), also known as dilated convolution. The structure is shown in Figure 5. It uses atrous convolution with different expansion rates (also called sampling rates) to extract multi-scale information from the feature map output by the feature extraction network, as shown in the following:
where x is the input dust difference image, y is the output sandstorm detection result, w is the convolution kernel, k is the size of the convolution kernel, and r is the expansion rate of the convolution kernel. The parameter interval of the convolution kernel w is r-1.
Compared with other models, the advantage of the DeepLabv3+ network structure is that it adds hole convolution, sets different expansion coefficients to obtain multi-scale context information without losing image feature information, and expands the local receptive field. Therefore, each of the convolution outputs contains a wide range of spatial information. DeepLabv3+ inherits the depth-wise separable convolution in the DeepLabv3 version, where the depth-wise separable convolution divides the computation into two steps: channel-wise convolution and point-wise convolution. Channel-wise convolution uses convolution filters to perform independent spatial convolutions on each input channel, while point-wise convolution is used to combine the weighted outputs of channel-wise convolutions (Guo et al., 2019). Compared with the standard convolution, the depth-wise separable convolution considers the image space dimension and the channel dimension, which reduces the number of parameters and the computational cost and effectively improves the model training efficiency while ensuring that only a small amount of accuracy is lost. DeepLabv3+ includes two parts, the structure is shown in Figure 3: An encoder and a decoder. In the encoder, the ASPP module is used to expand the receptive field of dust regions, capture contextual information at multiple scales, highlight dust and targets (clouds, deserts/Gobi, etc.), and dark differential characteristics of the target (vegetation, water, etc.). Using ASPP with different rates for feature extraction, five sets of feature images are obtained. In the decoder, the obtained feature image is remapped to each pixel, and the resulting output by the encoder is subjected to feature learning and bilinear interpolation of the convolution module to obtain the resolution of the input image. The structure is shown in Figure 2.
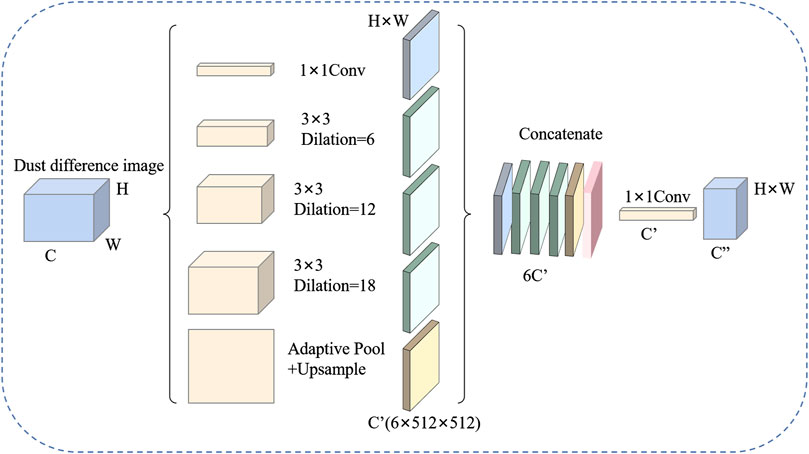
FIGURE 2. Atrous spatial pyramid pooling.
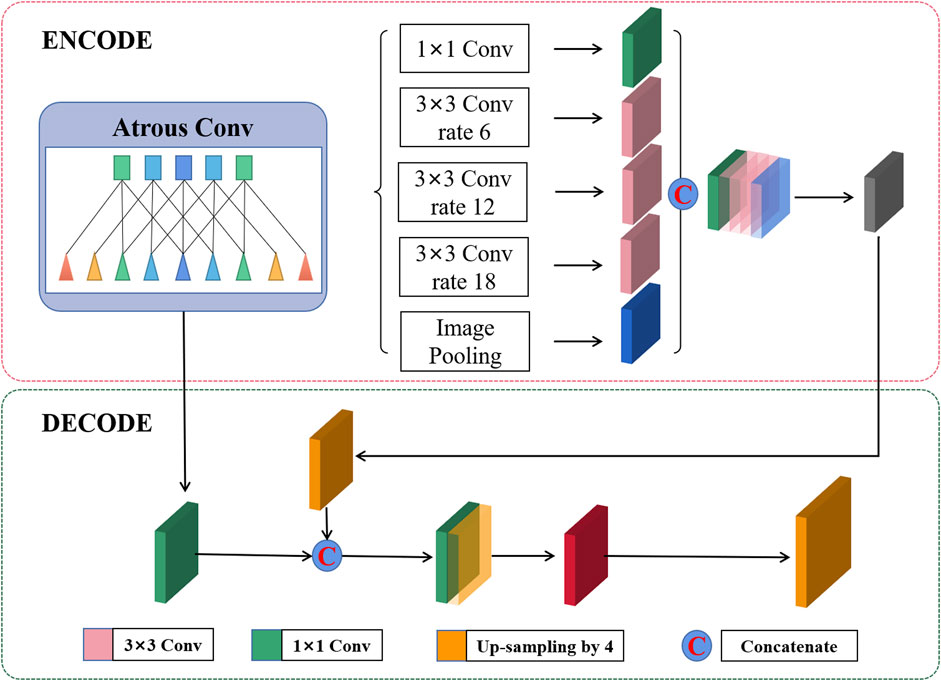
FIGURE 3. DeepLabv3+ structure.
With the deepening of the network and the huge amount of data available, the learning efficiency of DeepLabv3+ becomes lower, the optimization effect becomes worse, the accuracy of test data and training data decreases, and the encoder has a problem due to spatial resolution loss. To this end, the ResNet50 (He et al., 2016) model is coupled based on DeepLabv3+, which avoids the gradient disappearance and degradation problems of the deep network, and normalizes the input data and the data of the intermediate layer, which can ensure that the network adopts randomness in backpropagation. Gradient descent increases the training speed of the model and improves the training effect. Therefore, this study builds a sandstorm detection model based on DeepLabv3+ and ResNet50 networks, as shown in Figure 4.
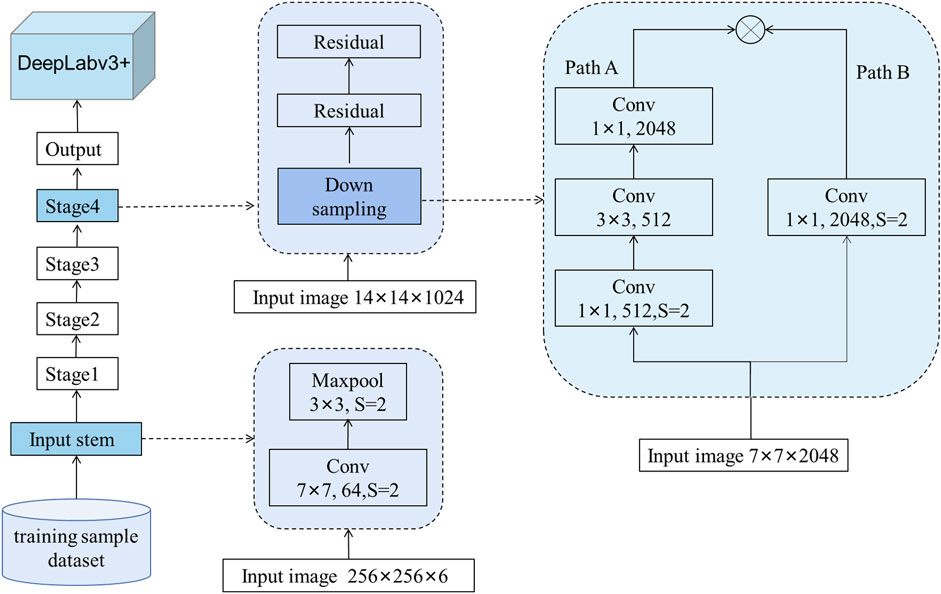
FIGURE 4. Sandstorm detection network model.
Considering the computational efficiency and redundancy of image features, the difference image data are cropped pixel by pixel into 4576 images through a 512 × 512 sliding window. Then, the training data are resampled to 256 × 256 × 6 for training, and the difference image dataset is augmented by various methods such as rotation, normalization, adding noise, horizontal mirror flipping, and random saturation. Randomly assign 80% of the dataset as training data and 20% as test data. Dust training network model parameters as shown Table 6. Under the same environment and parameter conditions, the sand and sandstorm detection models supported by the surface reflectance database and without the support of the surface reflectance database were trained respectively.

TABLE 6. Dust training network model parameters.
2.2.4 Evaluation approach for sandstorm detection
The performance of the model was evaluated in the test area using accuracy, precision, recall, F1-score, and mean pixel accuracy (MPA). Accuracy refers to the percentage of correct predictions in the total sample; MPA refers to the average metric for each category, where the dust and non-dust pixel count class are 1 and 0, respectively; recall indicates that the dust is correctly predicted to account for the number of all marked pixels; precision refers to the percentage of pixels that recognize dust, and F1-score is based on the harmonic average of recall and precision.
where TP and TN are dust and non-dust pixel correctly identified by the sandstorm detection model, respectively. FN and FP are the pixels that are predicted to be non-dust and dust and are recognized by the model as dust and non-dust pixels, respectively. AP is the average of multiple validation data sets and QR is the number of validation sets.
3 Results
3.1 Sandstorm detection results
This article selects three dust storm events from March 15 to March 17 and March 27 to March 28 for detection in 2021. The abovementioned dust events are detected by deep learning techniques with LSR and no LSR as prior data, respectively. The sandstorm detection results were analyzed and verified through visual interpretation and OMI AI data products. See Figures 5–7.
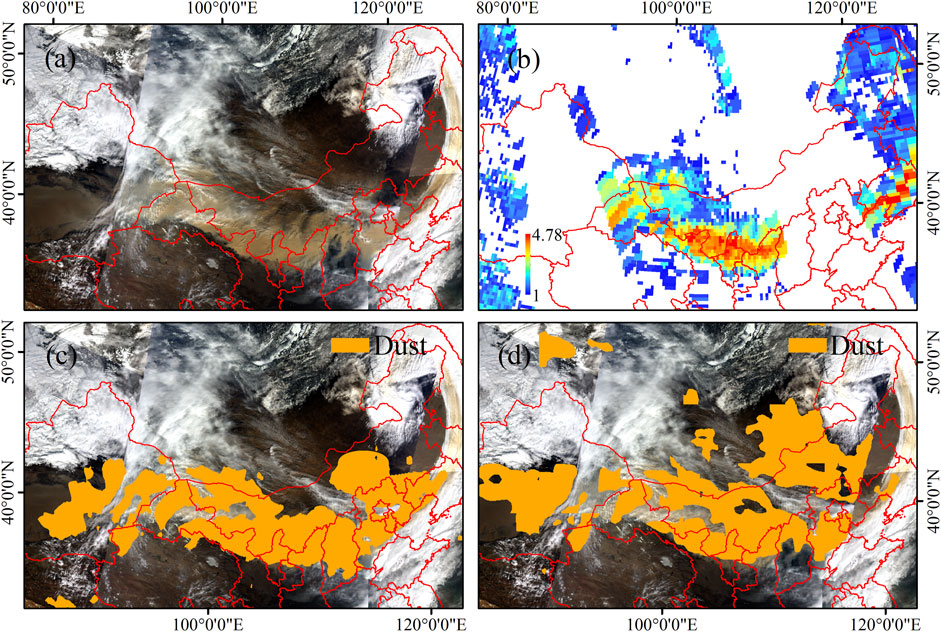
FIGURE 5. Spatial distributions of MODIS RGB image (bands:1-4-3) (A), OMI AI product (B), detection results of space sandstorms in MODIS images with LSR (C), and detection results of space sandstorms in MODIS images without LSR (D) on 15 March 2021.
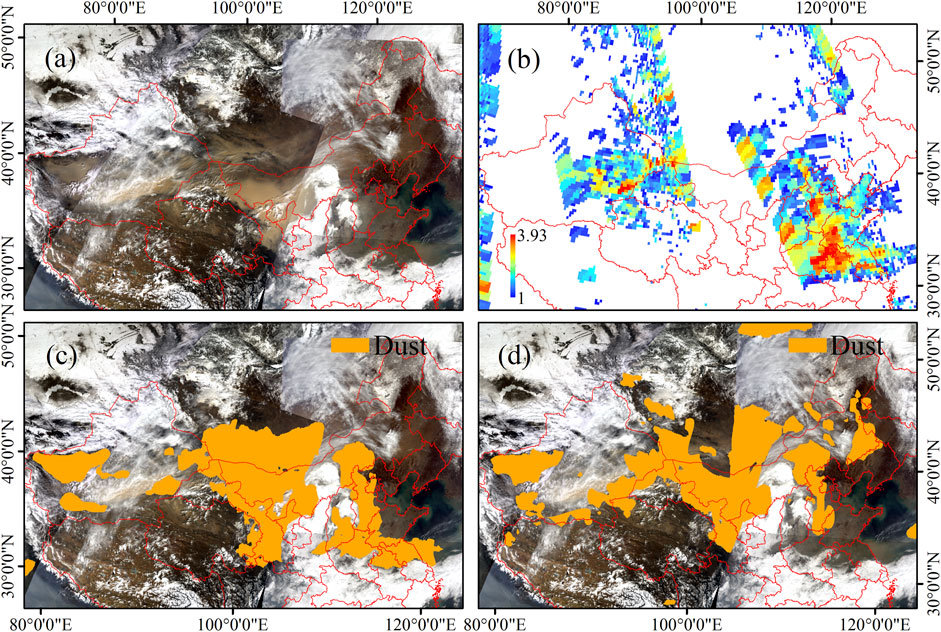
FIGURE 6. Spatial distributions of MODIS RGB image (bands: 1-4-3) (A), OMI AI product (B), detection results of space sandstorms in MODIS images with LSR (C), and detection results of space sandstorms in MODIS images without LSR (D) on 16 March 2021.
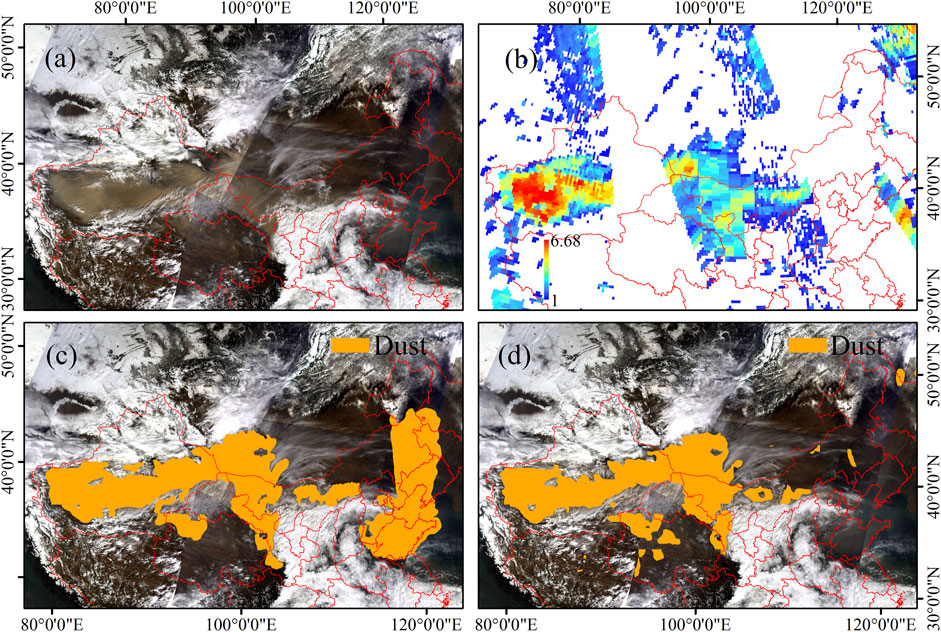
FIGURE 7. Spatial distributions of MODIS RGB image (band:1-4-3) (A), OMI AI product (B), detection results of space sandstorms in MODIS images with LSR (C), and detection results of space sandstorms in MODIS images without LSR (D) on 17 March 2021.
Figures 5–7 show the detection results of a sandstorm from March 15 to 17, 2021. On the morning of 15 March 2021, the sandstorms moved eastward along the Hexi Corridor, and the area of influence expanded eastward; by the morning of the 16th, the area of influence of the sandstorms further expanded, and areas such as central and western Inner Mongolia and southern Mongolia were affected by varying degrees of dust weather. Influence on the morning of the 17th, it continued to move slowly to the northwest, and thin dust appeared in most parts of Northwest and North China.
In Figures 5–7, Figure c is the detection result of the sandstorm supported by the deep learning method based on the LSR data. Thick and thin dust was accurately identified. Particularly, the extraction effect of thin dust above the land surface with high reflectance was better, thin dust shapes and textures were clearly visible, and thin dust over vegetated areas and bare land were easy to identify. On the edge of the cloud and dust, thin dust, thick dust recognition effect with OMI AI products, dust area of the true color composite image was consistent. These factors indicate that the dust aerosol intensity and range were consistent with the sandstorm detection results. Figure d is the sandstorm detection result of the deep learning method without the support of the LSR dataset. It is difficult to identify thin dust in desert areas such as deserts and Gobi, and the detection range of blowing sand weather is small, and it is easy to be confused between thin dust and clouds. The detection effect of thin dust over the bright land surface or the dark land surface is poor, and the detection of a sandstorm in the mixed area of thin clouds and bare ground is misjudged. It is difficult to accurately identify dust in a heterogeneous area composed of a mixture of dust and clouds, bare ground, and ice/snow.
3.2 Accuracy verification
To verify the sandstorm detection results of different land surface types, three sandstorm events that occurred in northern and northwest China in April 2014, May 2016, and March 2021 were selected for detection and research to verify the stability of the LSR product as a priori data to support the deep learning for sandstorm detection. Figures 8–11 shows the detection results of mixed areas of thick dust, thin dust, and clouds over different land surface types (desert, Gobi, bare land, ice and snow, vegetation, etc.).
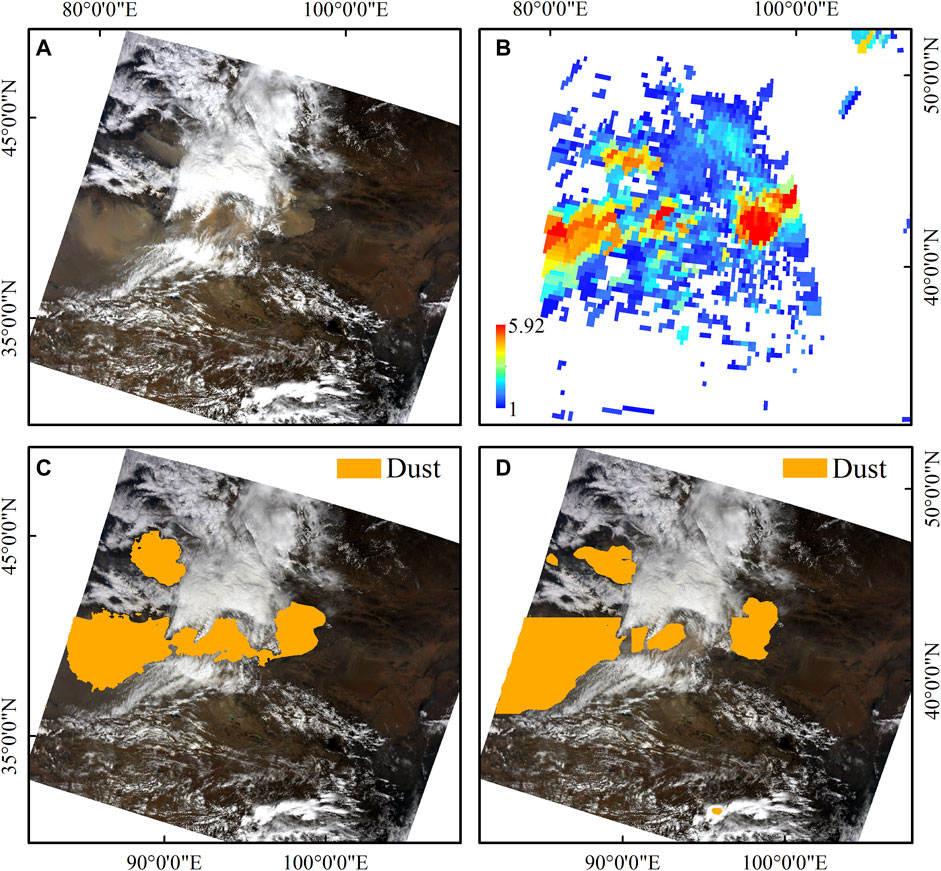
FIGURE 8. Comparison of sandstorm detection results in the desert/Gobi/cloud region on 23 April 2014. Spatial distributions of MODIS image (band:1-4-3) (A), OMI AI product (B), detection results of space sandstorms with LSR (C), and detection results of space sandstorms in MODIS images without LSR (D).
Figure 8 shows a strong dust storm that occurred in Northwest China on 23 April 2014. Occurs in desert/Gobi and bare ground areas, from the comparison of the detection results of the two methods, the deep learning method with the priori LSR dataset is better for desert/Gobi, dust above bare ground, and thick dust around cloud edges. It not only overcomes the problem of sandstorm detection on the bright land surface but also monitors the dust at the edge of the cloud and around the thin cloud, dust edge consistent with visual interpretation; Without using the detection results supported by the LSR dataset, the overall thick dust can be accurately identified, however, the detection results in desert/Gobi, bare ground, cloud, and other areas are discontinuous, the dust boundary is unstable and prone to misidentification, misjudgment of high-brightness land surface sandstorms and omission of thin dust. Figure 9 is a comparison of thin/thick sandstorm detection results in cloud/bare land in the region on 3 March 2016. The deep learning supported by priori LSR dataset for the thin dust above the bare ground, its trajectory can basically be detected. However, the sandstorm detection result without the support of priori LSR, the thin dust above the bare ground and the edge of the thin cloud are wrongly detected as dust, and the detection effect is not ideal. Figure 10 is a comparison of thin sandstorm detection results in cloud/ice and snow in the region on 16 March 2021. The results of using no LSR as prior data show that the edge detection effect of dust and ice/snow/thick cloud/bare ground is poor, and the Gobi and some mixed areas with thin clouds are identified as dust. As shown in Figure 11, for sandstorm detection in the cloud and bare ground areas, using without LSR dataset support MODIS image space dust storm detection will have some areas with similar brightness to dust that are identified as dust. The sandstorm detection boundary around the cloud edge is prone to misjudgment. There is no accurate boundary between dust and cloud, and thin dust is basically not detected. When using the deep learning method supported by LSR to detect MODIS image space dust around clouds and bare ground, it can accurately identify thin dust, and can correctly identify dust on the edges of clouds, deserts, and the Gobi, with good detection accuracy and stability.
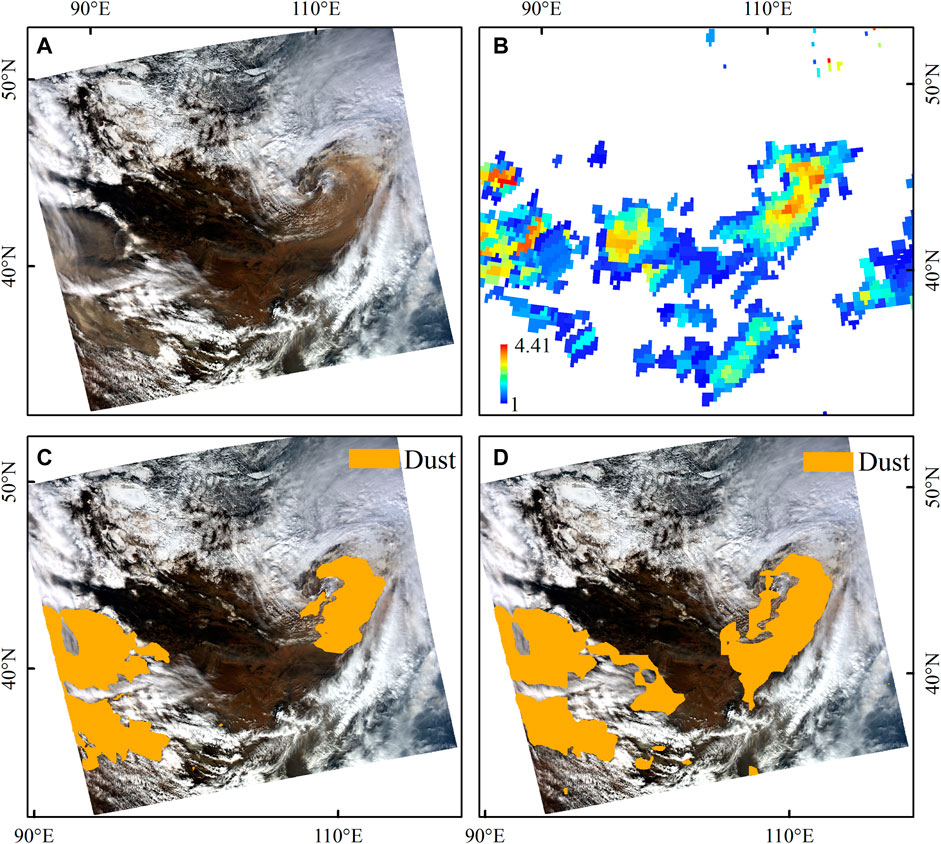
FIGURE 9. Comparison of sandstorm detection results in cloud/bare land the region on 3 March 2016. Spatial distributions of MODIS image (band:1-4-3) (A), OMI AI product (B), detection results of space sandstorms with LSR (C), and detection results of space sandstorms in MODIS images without LSR (D).
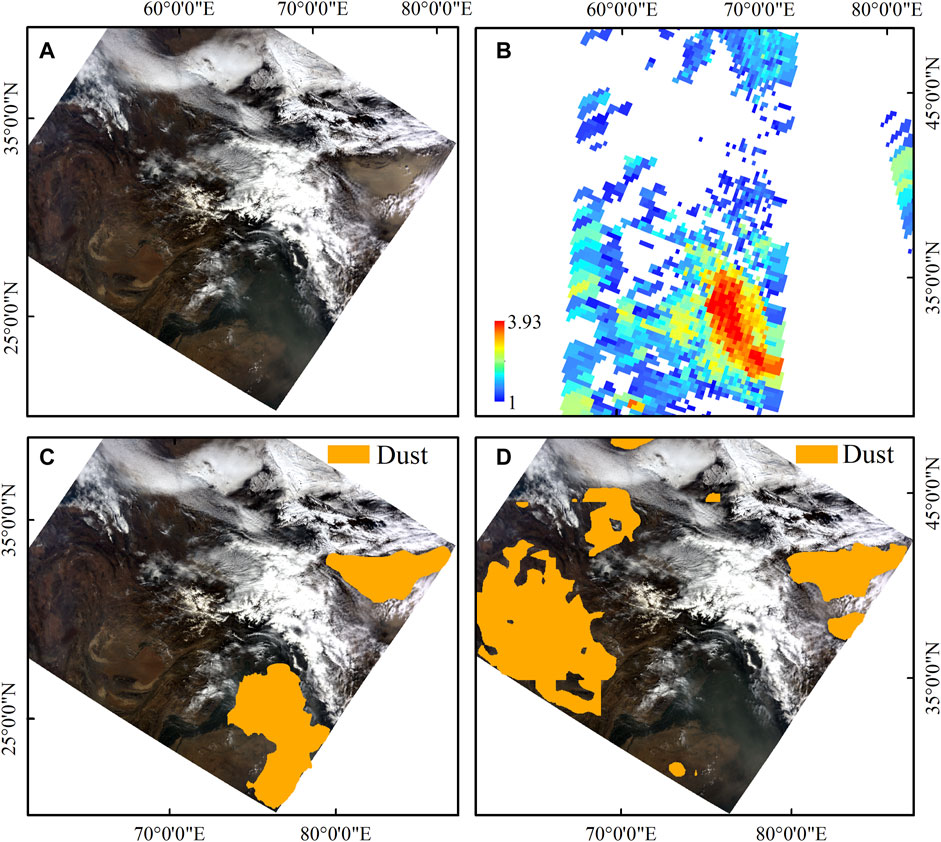
FIGURE 10. Comparison of sandstorm detection results in cloud/ice and snow in the region on 16 March 2021. Spatial distributions of MODIS image (band:1-4-3) (A), OMI AI product (B), detection results of space sandstorms with LSR (C), and detection results of space sandstorms in MODIS images without LSR (D).
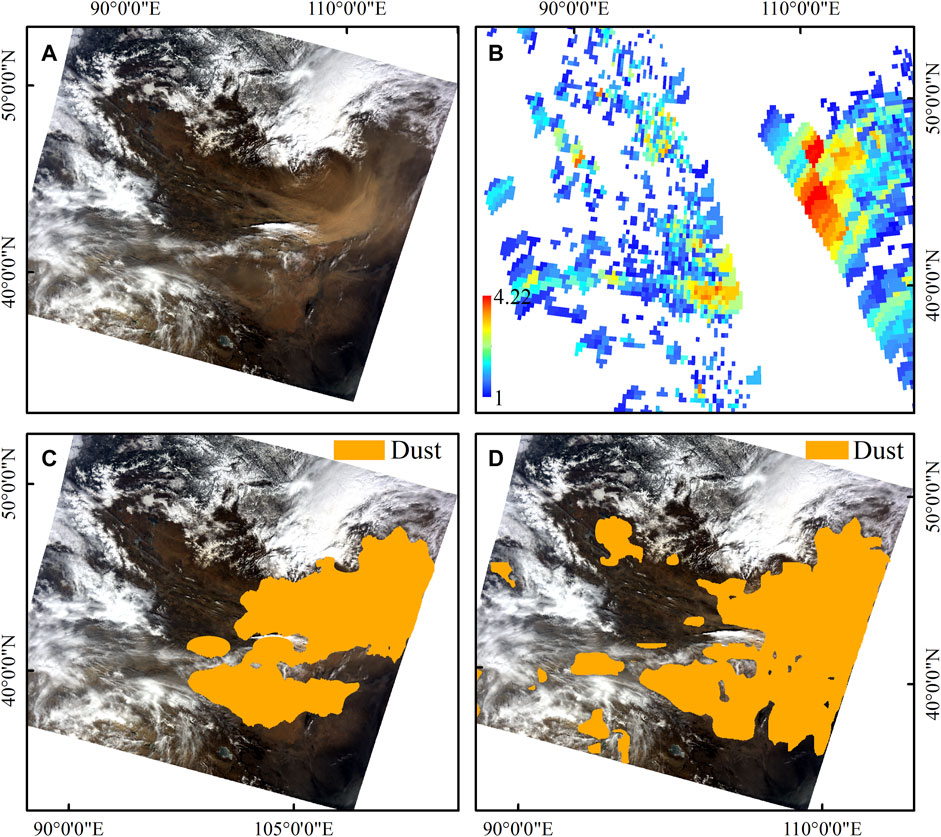
FIGURE 11. Comparison of sandstorm detection results in cloud/bare land the region on 28 March 2021. Spatial distributions of MODIS image (band:1-4-3) (A), OMI AI product (B), detection results of space sandstorms with LSR (C), and detection results of space sandstorms in MODIS images without LSR (D).
Additionally, synthesizing the aforementioned analysis by the deep learning sandstorm detection method supported by LSR products can accurately and stably detect thick dust, thin dust, and dust around cloud edges over different land surface types such as deserts, Gobi, ice and snow, and bare ground. Therefore, the boundary of the mixed zone of cloud edge and dust edge can be clearly identified.
Table 7 shows the results of the dust extraction accuracy. The MPA, accuracy, and recall of the sandstorm detection supported by the LSR database were all found to be above 0.980. The accuracy and F1-score of extracting dust reached 0.846 and 0.874, respectively. The accuracy, recall, and MPA of sandstorm detection without LSR support were all approximately 0.970, whereas the F1-score was only 0.784. Results showed that the deep learning technology method supported by the LSR database exhibited better detection accuracy and stability for the mixed areas of thin dust, thin clouds, low reflectance, etc. Compared to sandstorm detection without the support of the LSR database.
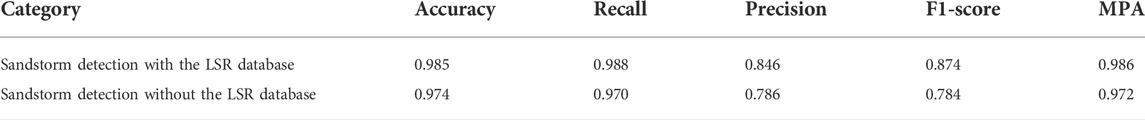
TABLE 7. Evaluation index of the sandstorm detection accuracy.
Figures 12, 13 depict the trained sandstorm detection model accuracy and MPA trends. Epoch indicates that a forward computation and a backward propagation process were completed. Figure 12 is the model trained on the LSR difference image. When the model is trained to 125 Epochs, the training and test data accuracy stabilized and gradually increased. At 200 epochs, the model training and test data accuracy were 0.985 and 0.987. Furthermore, high variability was observed when the test data MPA was trained 25 times. At 85 epochs, the training and test data MPA gradually increased, before reaching 0.987 and 0.991, respectively. Figure 13 is the result of training on MODIS data without LSR support, the test data accuracy and MPA were more variable and continued to increase till 125 epochs. They were less variable and steadily increased after 125 epochs.
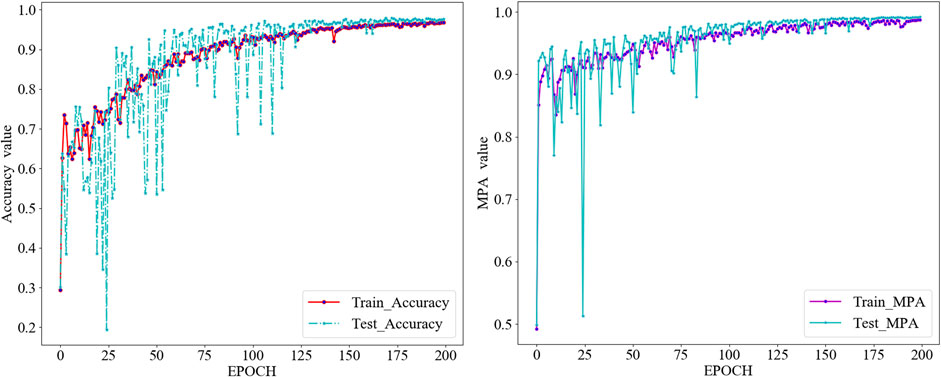
FIGURE 12. Model training land surface reflectance support accuracy and MPA vs. epoch.
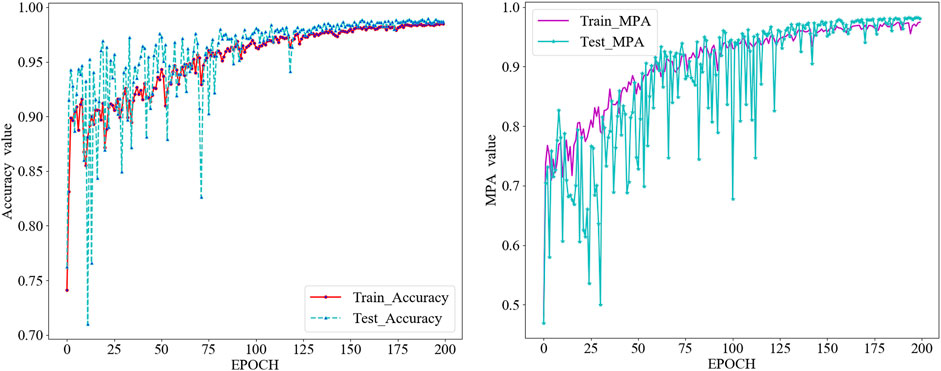
FIGURE 13. Model training without land surface reflectance support accuracy and MPA vs. epoch.
4 Conclusion
Because of the complex spatial structure of the land surface, the obvious difference between light and dark, uncertain land surface reflectance, and various types of dust, the radiation characteristics of thin dust and thick dust are significantly different. Under the limited band information provided by satellite sensors, it is difficult for deep learning technology to distinguish the highly heterogeneous land surface from polymorphic dust and clouds. A method for detecting sandstorms using deep learning technology supported by land surface reflectance products is proposed. The difference between the reflectance data of different bands obtained by satellite and the LSR dataset is used as the input feature of the sandstorm detection model, whereas the sample dataset obtains characteristic images of typical ground object types, such as thin dust, thick dust, clouds, bare land, vegetation, and ice/snow, through visual interpretation from MODIS images of different time series of sandstorms in northern China. Comprehensive use of multi-band radiation information was realized, and the deep learning technology supported by LSR products was used to detect dust. Considering the sandstorm in March 2021 as an example, the sandstorm detection results were verified through OMI AI products. The overall results showed that the sandstorm detection algorithm used in this study was consistent with the OMI AI product with an extraction accuracy of 84.6%. Simultaneously, we compared these results with the recognition results of MODIS images without the support of the LSR database. Results showed that the automatic detection of thin and thick dust above the dark and high-reflectance land surfaces was effectively realized under the conditions supported by the LSR dataset. Areas with thin dust, thin dust at cloud edges, and bright land surface dust areas have obvious advantages when identifying sandstorms.
The LSR dataset-based deep learning method effectively detected sandstorms. However, it experienced certain limitations listed as follows: 1) this study constructed the LSR database in 2014 and used that data to support the sandstorm detection in 2021 and later, 2) the detection of some cloud edges, high-reflectance land surfaces, and dust edge areas require improvement, and 3) the orbital data OMI AI products were affected by the imaging time differences between OMI AI and MODIS, and thereby resulted in image mismatches. The limitations would need further investigations to enhance the accuracy and stability of sandstorm detection. We would like to construct long-time series of LSR datasets, improve dust edge identification by increasing the sandstorm detection sample data diversity, and validate the observations by detecting the dust station data,consider OMPS AI for comparison due to its smaller gaps, in our future studies.
Data availability statement
Publicly available datasets were analyzed in this study. These data can be found at: https://search.earthdata.nasa.gov/search
Author contributions
Conceptualization: LS and YQ; methodology: LS and QS; software: YQ; validation: YQ, NM, and ZW; formal analysis: YQ; investigation: YQ; resources: LS, NM, and ZW; data curation: YQ; writing—original draft preparation: YQ; writing—review and editing: YQ, LS, and NM; visualization: and LS; supervision: LS. All authors have read and agreed to the published version of the manuscript.
Funding
This research was funded by the National Key Research and Development Program (2019YFE0126700) and the Shandong Provincial Natural Science Foundation (ZR2020MD051).
Acknowledgments
The authors thank the National Natural Science Foundation of China (41171408) for funding. They thank NASA for MODIS data.
Conflict of interest
The authors declare that the research was conducted in the absence of any commercial or financial relationships that could be construed as a potential conflict of interest.
The handling editor JW declared a past collaboration with the author LS.
Publisher’s note
All claims expressed in this article are solely those of the authors and do not necessarily represent those of their affiliated organizations, or those of the publisher, the editors, and the reviewers. Any product that may be evaluated in this article, or claim that may be made by its manufacturer, is not guaranteed or endorsed by the publisher.
References
Ackerman, S. A. (1997). Remote sensing aerosols using satellite infrared observa-tions. J. Geophys. Res. 102 (D14), 17069–17079. doi:10.1029/96jd03066
Amiri, M., and Soleimani, S. (2022). A hybrid atmospheric satellite image-processing method for dust and horizontal visibility detection through fea-ture extraction and machine learning techniques[J]. J. Indian Soc. Remote Sens. 50, 523–532. doi:10.1007/s12524-021-01460-0
Andreae, M. O., and Rosenfeld, D. (2008). Aerosol–cloud–precipitation interactions. Part 1. The nature and sources of cloud-active aerosols. Earth. Sci. Rev. 89 (1-2), 13–41. doi:10.1016/j.earscirev.2008.03.001
Berndt, E., Elmer, N. J., Junod, R. A., Fuell, K. K., Harkema, S. S., Burke, A. R., et al. (2021). A machine learning approach to objective identification of dust in satellite imagery. Earth Space Sci. 8, e2021EA001788. doi:10.1029/2021ea001788
Boroughani, M., Pourhashemi, S., Hashemi, H., Salehi, M., Amirahmadi, A., Asadi, M. A. Z., et al. (2020). Application of remote sensing techniques and machine learning algorithms in dust source detection and dust source susceptibility mapping. Ecol. Inf. 56, 101059. doi:10.1016/j.ecoinf.2020.101059
Chacon-Murguía, M. I., Quezada-Holguín, Y., Rivas-Perea, P., and Cabrera, S. (2011). “Dust storm detection using a neural network with uncertainty and ambi-guity output analysis[J],” in Pattern recognition. MCPR 2011. Lecture notes in computer science. Editors J. F. Martínez-Trinidad, J. A. Carrasco-Ochoa, C. Ben-Youssef Brants, and E. R. Hancock (Berlin, Heidelberg: Springer-Verlag), 6718. doi:10.1007/978-3-642-21587-2_33
Chen, L. C., Zhu, Y., Papandreou, G., Schroff, F., and Adam, H. (2018). Encoder-decoder with atrous separable convolution for semantic image segmentation[J]. Cham: Springer.
Darmenov, A., and Sokolik, I. N. (2005). Identifying the regional thermal-IR radiative signature of mineral dust with MODIS. Geophys. Res. Lett. 32 (16), L16803. doi:10.1029/2005gl023092
Fan, D., Pei Jun, S., and Jing ning, L. (2003). Research progress in satellite remote sensing of sandstorm[J]. Adv. Earth Sci. 18 (3), 7). doi:10.13577/j.jnd.2007.0528
Garrett, T. J., and Zhao, C. (2006). Increased Arctic cloud longwave emissivity associated with pollution from mid-latitudes. Nature 440 (7085), 787–789. doi:10.1038/nature04636
Guo, Y., Li, Y., Feris, R., Wang, L., and Rosing, T. (2019). Depthwise convolution is all you need for learning multiple visual domains[J]. doi:10.48550/arXiv.1902.00927
Haiping, L., Liya, X., and Dafang, Z. (2003). Research status and development trend of remote sensing monitoring of sand and dust disasters in China[J]. Adv. Geogr. Sci. 22 (1), 8. 1007-6301(2003)22:1<45:ZGSCZH>2.0TX;2-2
He, K., Zhang, X., Ren, S., and Sun, J. (2016). “Deep residual learning for image recognition[J],” in 2016 IEEE Conference on Computer Vision and Pattern Recognition (CVPR), Las Vegas, NV, USA, June 27 2016 to June 30 2016 (IEEE).
Hou, P., Guo, P., Wu, P., Wang, J., Gangopadhyay, A., and Zhang, Z. (2020). “A deep learning model for detecting dust in Earth's atmosphere from satellite remote sensing data[C],” in 2020 IEEE International Conference on Smart Computing (SMARTCOMP), Bologna, Italy, 14-17 September 2020 (IEEE). doi:10.1109/SMARTCOMP50058.2020.00045
Jiang, H., He, Q., Zeng, X. Q., Tang, Z., Zhao, K. M., Dou, X. Y., et al. (2021). Sand and dust monitoring using FY-4A satellite data based on the random forests and convolutional neural networks[J]. Plateau Meteorol. 40 (3), 680–689. doi:10.7522/j.issn.1000-0534.2020.00060
Kaufman, Y. J., Tanré, D., Dubovik, O., Karnieli, A., and Remer, L. A. (2001). Absorption of sunlight by dust as inferred from satellite and ground-based remote sensing. Geophys. Res. Lett. 28 (8), 1479–1482. doi:10.1029/2000gl012647
Lee, J., Shi, Y. R., Cai, C., Ciren, P., Wang, J., Gangopadhyay, A., et al. (2021). Machine learning based algorithms for global dust aerosol detection from satellite images: Inter-comparisons and evaluation. Remote Sens. 13 (3), 456. doi:10.3390/rs13030456
Liqiang, Z., Yang, L., Zhengyang, H., Xingang, L., Hao, G., Yuebin, W., et al. (2020). Deep learning and remote sensing data analysis[J]. Geomatics Inf. Sci-ence Wuhan Univ. 45 (12), 1857–1864. doi:10.13203/j.whugis20200650
Liu, P., Wei, Y., Wang, Q., Chen, Y., and Xie, J. (2020). Research on post-earthquake landslide extraction algorithm based on improved U-net model. Remote Sens. 12 (5), 894. doi:10.3390/rs12050894
Ma, Y., and Gong, W. (2012). Evaluating the performance of SVM in dust aerosol discrimination and testing its ability in an extended area. IEEE J. Sel. Top. Appl. Earth Obs. Remote Sens. 5 (6), 1849–1858. doi:10.1109/jstars.2012.2206572
Miller, S. D. (2003). A consolidated technique for enhancing desert dust storms with MODIS. Geophys. Res. Lett. 30 (20), 2003GL018279. doi:10.1029/2003gl018279
Qu, J. J., Hao, X., Kafatos, M., and Wang, L. (2006). Asian dust storm monitoring combining Terra and aqua MODIS SRB measurements. IEEE Geosci. Remote Sens. Lett. 3 (4), 484–486. doi:10.1109/lgrs.2006.877752
Ramasubramanian, M., Gurung, I., Khan, T., Kaulfus, A., Maskey, M., Ramachandran, R., et al. (2021). “Day time and nighttime dust event segmentation using deep convolutional neural networks,” in SoutheastCon 2021, Atlanta, GA, USA, 10-13 March 2021, 1–5. IEEE Journal of Selected Topics in Applied Earth Observations and Remote Sensing.
Rivas-Perea, P., Rosiles, J. G., and Cota-Ruiz, J. (2013). Statistical and neural pattern recognition methods for dust aerosol detection. Int. J. Remote Sens. 34 (21-22), 7648–7670. doi:10.1080/01431161.2013.822660
Shahrisvand, M., and Akhoondzadeh, M. (2013). “A comparison of empirical and inteligent methods for dust detection using MODIS satellite data[J],” in The international archives of the photogrammetry, remote sensing and spatial information sciences. Tehran, Iran: Conference, SMPR, XL-1/W3, 371–375. doi:10.5194/isprsarchives-XL-1-W3-371-2013
Shi, L., Zhang, J., Zhang, D., Igbawua, T., and Liu, Y. (2019). Developing a dust storm detection method combining Support Vector Machine and satellite data in Typical dust regions of Asia[J]. Adv. Space Res. 65 (4), 1263–1278. doi:10.1016/j.asr.2019.11.027
Su, Q., Sun, L., Yang, Y., Zhou, X., Li, R., and Jia, S. (2017). Dynamic monitoring of the strong sandstorm migration in northern and northwestern China via satellite data [J]. Aerosol Air Qual. Res. 17, 3244–3252. doi:10.4209/aaqr.2016.12.0600
Sun, L., Wei, J., Bilal, M., Tian, X., Jia, C., Guo, Y., et al. (2015). Aerosol optical depth retrieval over Bright areas using landsat 8 OLI images. Remote Sens. (Basel). 8, 23. doi:10.3390/rs8010023
Sun, L., Wei, J., Wang, J., Mi, X., Guo, Y., Lv, Y., et al. (2016a). A universal dynamic threshold cloud detection algorithm (UDTCDA) supported by a prior surface reflectance database. J. Geophys. Res. Atmos. 121, 7172–7196. doi:10.1002/2015jd024722
Sun, L., Yu, H., Fu, Q., Wang, J., Tian, X., and Mi, X. (2016b). Aerosol optical depth retrieval and atmospheric correction application for GF-1 PMS supported by land surface reflectance data. J. Remote Sens. 20, 216–228. doi:10.11834/jrs.20165052
Torres, O., Tanskanen, A., Veihelmann, B., Ahn, C., Braak, R., Bhartia, P. K., et al. (2007). Aerosols and surface UV products from Ozone Monitoring Instrument observations: An overview. J. Geophys. Res. 112, D24S47–14. doi:10.1029/2007jd008809
Vermote, E. F., Kotchenova, S. Y., and Ray, J. P. (2008). MODIS surface reflectance user's guide. Tehran, Iran: Conference, SMPR.
Wei, J., Li, Z., Lyapustin, A., Sun, L., Peng, Y., Xue, W., et al. “Reconstructing 1-km-resolution high-quality PM2.5 data records from 2000 to 2018 in China: spatiotemporal variations and policy implications. Remote Sensing of Environment, 2021, 252, 112136. doi:10.1016/j.rse.2020.112136
Woo, S., Park, J., Lee, J. Y., and Kweon, I. S. (2018). “CBAM: Convolutional block Attention module[C],” in European conference on computer vision (Cham: Springer).
Xie, S., Liu, X., Zhao, C., and Zhang, Y. (2013). Sensitivity of CAM5-simulated arctic clouds and radiation to ice nucleation parameterization. J. Clim. 26 (16), 5981–5999. doi:10.1175/jcli-d-12-00517.1
Yan, X., Luo, N., Liang, C., Zang, Z., Zhao, W., and Shi, W. (2020). Simplified and FastAtmospheric Radiative transfer model for satellite-based aerosol optical depth retrieval. Atmos. Environ. X. 224, 117362. doi:10.1016/j.atmosenv.2020.117362
Yang, Y., Sun, L., Zhu, J., Wei, J., Su, Q., Sun, W., et al. (2017). A simplified Suomi NPP VIIRS dust detection algorithm. J. Atmos. Solar-Terrestrial Phys. 164, 314–323. doi:10.1016/j.jastp.2017.08.010
Zandkarimi, A., Fatehi, P., and Shah-Hoseini, R. (2020). An improved dust identification index (IDII) based on MODIS observation. Int. J. Remote Sens. 41 (20), 8048–8068. doi:10.1080/01431161.2020.1770366
Zhang, L., Zhang, L., and Bo, D. (2016). Deep learning for remote sensing data: A technical tutorial on the state of the art[J]. IEEE Geoscience Re-mote Sens. Mag. 4 (2), 22–40. doi:10.1109/MGRS.2016.2540798
Zhao, C., and Garrett, T. J. (2015). Effects of Arctic haze on surface cloud radiative forcing. Geophys. Res. Lett. 42 (2), 557–564. doi:10.1002/2014gl062015
Keywords: sandstorm detection, deep learning, MOD09A1, multi-band radiation, land surface reflectance
Citation: Qu Y, Sun L, Su Qh, Ma N, Wang Zh and Liu Xr (2022) Prior land surface reflectance-based sandstorm detection from space using deep learning. Front. Earth Sci. 10:999427. doi: 10.3389/feart.2022.999427
Received: 21 July 2022; Accepted: 15 August 2022;
Published: 13 September 2022.
Edited by:
Jing Wei, University of Maryland, United StatesReviewed by:
Yikun Yang, Peking University, ChinaBin Chen, Lanzhou University, China
Minghui Tao, China University of Geosciences, China
Copyright © 2022 Qu, Sun, Su, Ma, Wang and Liu. This is an open-access article distributed under the terms of the Creative Commons Attribution License (CC BY). The use, distribution or reproduction in other forums is permitted, provided the original author(s) and the copyright owner(s) are credited and that the original publication in this journal is cited, in accordance with accepted academic practice. No use, distribution or reproduction is permitted which does not comply with these terms.
*Correspondence: Lin Sun, c3VubGluNkAxMjYuY29t