 Tao Wang
 Fenghua Tian4
- 1School of Geosciences, Yangtze University, Wuhan, China
- 2PetroChina Research Institute of Petroleum Exploration and Development, Beijing, China
- 3National Energy Shale Gas Research and Development (Experiment) Center, Beijing, China
- 4Exploration and Development Division of PetroChina Coalbed Methane Company Limited, Beijing, China
- 5School of Resource and Environment, Yangtze University, Wuhan, China
In this study, the microscopic pore characteristics of shale in marine strata are evaluated. Based on field emission scanning electron microscopy (FE-SEM), low-temperature N2 adsorption (LT-N2GA), low-pressure CO2 adsorption (LP-CO2GA) and high-pressure methane adsorption (HPMA) experiments, the pore characteristics of 12 shales from the Wufeng–Longmaxi Formations in northern Yunnan and Guizhou are characterized qualitatively and quantitatively. Fractal Frenkel–Halsey–Hill (FHH) theory is used to analyse the fractal characteristics, and the adsorption pore characteristics of shale are discussed. The correlation between the fractal dimension and pore structure and adsorption performance is determined. The results show that the total organic carbon (TOC) contents of the 12 shales are in the middle–low level, ranging from 0.43% to 5.42%, and the shales are generally in the highly mature to overmaturity stage (vitrinite reflectance (Ro) values between 1.80% and 2.51%). The mineral composition is mainly quartz and clay minerals. The average clay mineral content is 40.98% (ranging from 24.7% to 63.3%), and the average quartz content is 29.03% (ranging from 16.8% to 39.6%), which are consistent with those of marine shale in the Sichuan Basin. FE-SEM and LT-N2GA isotherms reveal a complex shale pore structure and open pore style, mainly ink bottle-shaped and parallel plate-like pores. The total pore volumes (PVs) range from 0.012–0.052 cm3/g, and the specific surface area (SSA) values range from 18.112–38.466 m2/g. All shale samples have abundant micropores and mesopores, accounting for >90% of the total SSA. The fractal dimensions, D1 and D2, were obtained from N2 adsorption data, with different adsorption characteristics at 0–0.5 and 0.5–1.0 relative pressures. The fractal dimensions increase with increasing BJH PV and BET SSA and decrease with decreasing average pore diameter (APD). The fractal dimensions are positively correlated with the TOC and clay mineral contents and negatively correlated with the quartz content. The fractal dimension can be used to evaluate the methane adsorption capacity; the larger the fractal dimension is, the larger the methane adsorption capacity is. Fractal analysis is helpful to better understand the pore structure and adsorption capacity of shale gas reservoirs.
1 Introduction
As China’s energy structure continues to develop towards cleaner energy, the demand for natural gas is growing rapidly, and China’s dependence on foreign natural gas continues to increase. Industrial breakthroughs have been made in marine shale represented by Jiaoshiba, Weiyuan, Changning-Zhaotong and other areas in the Sichuan Basin, and the annual output of shale gas in 2020 exceeded 20 billion metric cubic metres (Zou et al., 2015, Zou et al., 2018; Guo, 2013; Li X. et al., 2022). In recent years, domestic conventional gas has had few new high-quality large-scale reserves, and new production is far from meeting consumer demand. The shale gas revolution in the United States has basically resulted in energy independence in the United States and provided experience for the development of shale gas in China (Zou et al., 2013; Jiao et al., 2021; Li X. et al., 2022). There are three types of organic-rich shales in China, namely, marine facies, marine-to-continental transitional facies, and terrestrial coal measure and lacustrine facies, which are rich in shale gas resources (Yang et al., 2014; Nie et al., 2015; Wang et al., 2015; Ji et al., 2016; Peng et al., 2019; Xi et al., 2019). Many scholars believe that China’s future increase in natural gas production will mainly come from shale gas (Zou et al., 2018; Li J. et al., 2022).
Shale, as a highly heterogeneous porous medium, has been widely studied for its complex pore structure (Sing, 2001; Curtis, 2002; Zou et al., 2013). Pores can be divided into micro, meso- and macropores based on their sizes (reference of IUPAC). The research targets of the shale pore structure mainly include the pore size, shape, SSA, PV and connectivity of shale, which are closely related to the enrichment of shale gas (Tian et al., 2013; Yang et al., 2014; Li H. et al., 2019; Vishal et al., 2019; Wang et al., 2019). There are various methods for characterizing the pore structure characteristics of shale (Chalmers et al., 2012; Jiao et al., 2014). Microobservation techniques, such as scanning electron microscopy and atomic force microscopy, are used to identify and analyse pores in coal by visualizing the shape, size and distribution of pores (Loucks et al., 2009; Jiao et al., 2014; Ji et al., 2016; Chandra et al., 2020a). Nondestructive testing of CT scanning and dual ion beam (FIB-SEM) combined with energy dispersive spectroscopy (EDS) can yield three-dimensional distribution images of shale pores and mineral components and then carry out qualitative observations and descriptions of the shale pore origin, connectivity and pore density (Chalmers et al., 2012; Li et al., 2017; Zhou et al., 2017; Chandra and Vishal, 2020b; Sun et al., 2020; Li H. et al., 2022). The PSD, SSA, PV and pore structure of shale were quantitatively characterized by mercury injection and gas adsorption (Chalmers et al., 2012; 2013; Chen et al., 2017; Lia et al., 2018; Wang et al., 2019; Han et al., 2020). Among them, LT-N2GA and LP-CO2GA are the most effective methods to characterize the pore structure. Since LT-N2GA cannot measure pores smaller than 2 nm, and the measurement accuracy of LT-N2GA in the range of 2–300 nm is the highest, the combination of LP-CO2GA and LT-N2GA experiments is an effective method for the characterization of micropore, mesopore and macropore scales (Hu et al., 2016; Ji et al., 2016; Peng et al., 2019; Chandra et al., 2020c; Li X. et al., 2022; Zhang et al., 2022). The experimental data of LT-N2GA and LP-CO2GA can also be used to calculate the fractal dimension of pores in coal and shale. In recent years, the fractal dimension based on LT-N2GA data has become a popular method to evaluate the pore structure and surface irregularity in shale and coal (Mastalerz et al., 2012; Chen et al., 2017; Vishal et al., 2019; Li J. et al., 2022). The fractal characteristics of marine shale in the Sichuan Basin and marine-to-continental transitional shale in the Ordos Basin and their influence on the pore structure and CH4 adsorption capacity are discussed (Tian et al., 2013; Nie et al., 2015; Jiang et al., 2016; Li Y. et al., 2019; Peng et al., 2019; Wang et al., 2019). At present, few studies have focused on the fractal characteristics of marine shale pores in northern Yunnan and Guizhou.
As a transition region from the Sichuan Basin to the middle Guizhou uplift, the northern Yunnan–Guizhou region has experienced multiple periods of tectonic movement uplift and denudation (Zhao et al., 2017; Li H. et al., 2019; Liang et al., 2020). Compared with the basin, the sedimentary water of the Wufeng–Longmaxi Formation is shallower, the target shale gas interval is thinner, and the geological conditions are more complex (Zhu et al., 2018; Liang et al., 2020; Li J. et al., 2022). Previous studies have shown that the marine shale gas of the Wufeng–Longmaxi Formations in the northern Yunnan–Guizhou area has good development potential (Zhao et al., 2017; Zhu et al., 2018; Liang et al., 2020). In this paper, the Wufeng Formation and Longmaxi Formation shales, which have the most exploration potential in northern Yunnan and Guizhou, were taken as the main research objects. Based on FE-SEM, LT-N2GA and LP-CO2GA experiments, the pore structure of the Wufeng–Longmaxi Formation shale in northern Yunnan and Guizhou was analysed, and the fractal dimension of shale adsorption pores was calculated by the FHH model combined with HPMA experiments, X-ray diffraction (XRD) and related geochemical experiments. The relationship between the TOC, mineral composition, pore structure parameters and fractal dimension was discussed to provide research methods and evaluation bases for gas-bearing shale reservoir capacity and exploration evaluation in northern Yunnan and Guizhou and to make positive contributions to improving shale gas exploration and development.
2 Geological setting
The northern Yunnan–Guizhou provinces are located at the intersection of Yunnan, Guizhou and Sichuan Provinces (Liang et al., 2020). The research area is located at the junction of Yunnan, Guizhou and Sichuan Provinces. The main body is located in the central and western regions of the Weixin sag in the northern Yunnan-Guizhou depression on the southwest edge of the Yangtze block tectonic domain, adjacent to the Sichuan Basin in the north, the central Guizhou Uplift in the south, and the northeast Guizhou Depression in the west (Figure 1). The Weixin sag can be further divided into several secondary structural units, and the internal structural strike lines are distributed along the NE-SW and E-W directions. The study area is a typical trough fold belt with a wide and gentle anticline and closed syncline, with strong tectonic extrusion, high uplift and strong stratum deformation (Zhao et al., 2017; Zhu et al., 2018; Liang et al., 2020).
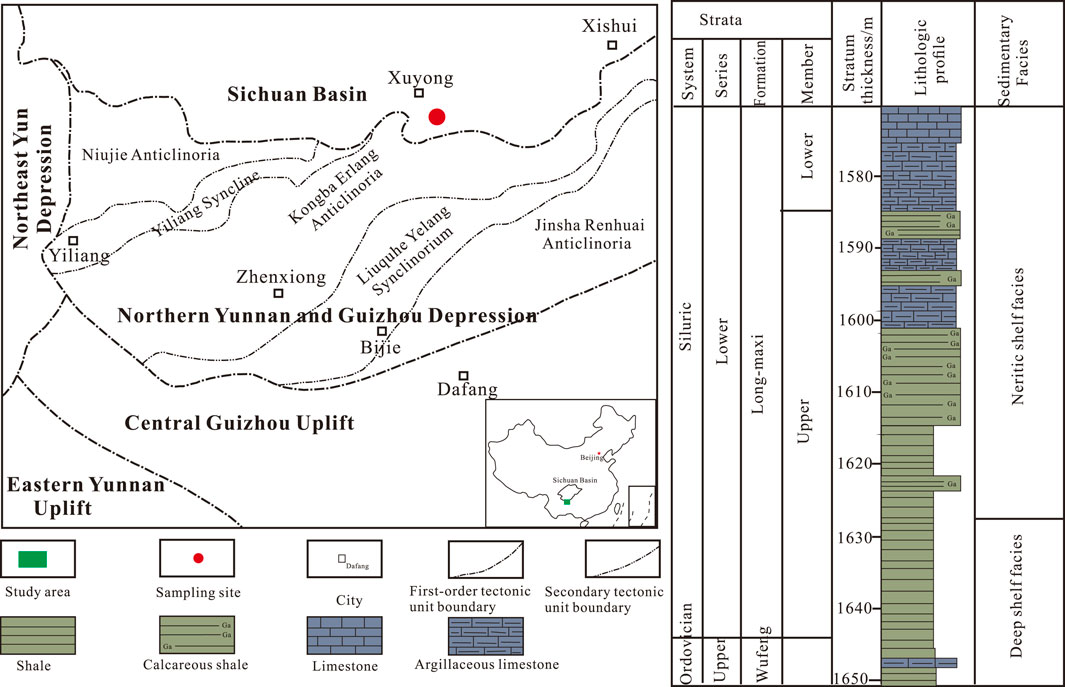
FIGURE 1. Structural map and stratigraphic column of the study area.
The northern Yunnan–Guizhou region experienced the tectonic and sedimentary evolution of the southern continental margin of the Yangtze shelf from the late Proterozoic to the early Paleozoic, the rift epicontinental sea from the late Paleozoic to the Middle Triassic, and the foreland basin in the Mesozoic (Liang et al., 2020). The two sedimentary assemblages include the marine Sinian–Middle Triassic and continental Upper Triassic–Lower Cretaceous complete strata, which have large stratigraphic thicknesses and wide distributions. The Lower Cambrian, Silurian and Upper Triassic–Jurassic strata are clastic rocks, and the other strata are mainly carbonate rocks. Various layers on the surface are exposed to different degrees, and most of the Lower Paleozoic are buried in the belly of the earth. Influenced by central Guizhou uplift, shale gas target interval five mountains–the dragon stream group deposit in the south of the study area is missing, the rest of the continuous distribution, for a closed set of deposits were stranded anoxic still water environment, the main lithology is black siliceous mudstone, carbonaceous mudstone, rich in petrochemical stone, upwards gradient for grey black–grey silty mudstone, argillaceous siltstone marl, calcium Shale is thick and thickens gradually from south to north.
3 Samples and methods
3.1 Shale samples
In this study, 12 shale samples of the Wufeng–Longmaxi Formations in northern Yunnan and Guizhou were collected. To systematically analyse the micropore structural characteristics and factors influencing the Wufeng–Longmaxi Formation shale, a relatively complete experimental scheme was carried out, including the determination of the TOC content and vitrinite reflectance (Ro), XRD analysis, FE-SEM, LT-N2GA, LP-CO2GA and HPMA experiments.
3.2 Organic petrography and mineralogy
The TOC content analysis used a LECO CS-230 carbon and sulfur analyser to measure the TOC contents of 12 samples. The samples were crushed into powders with particle sizes larger than 200 mesh and treated with dilute hydrochloric acid to remove carbonate. The standard GB/T19145-2003 was followed. Vitrinite reflectivity is the most commonly used optical method and is achieved by microscopic examination of kerogen and photomultiplier analysis of particle reflectivity (Petersen et al., 2013), according to the standard SY/T 5124-2012. XRD quantitative analysis was performed using a Bruker X-ray diffractometer to determine the whole-rock and clay mineral compositions of the 12 samples. Shale samples were crushed into powder with a particle size of 150 mm (Whittig, 1965). The mineral composition and relative mineral percentage of shale samples were estimated according to the standard SY/T 5163-2018.
3.3 Gas adsorption measurements
The LT-N2GA and LP-CO2GA experiments were conducted by using a Quantachrome Autosorb-IQ specific surface area and micropore analyser, according to the standards GB/T 21650.3-2011 and GB/T 21650.2-2008. The shale samples were screened to the same size of 60–80 mesh (0.18–0.25 mm). Before the LT-N2GA experiment, to remove the residual adsorbed water and volatile substances in the shale samples, all samples were dried in a vacuum oven at 105°C for 8 h, and the LT-N2GA experiment was carried out at 77 K. N2 was more than 99.999% pure. The BET (Brunauer et al., 1938; Barrett et al., 1951) method was used to obtain the SSA, and the BJH model was used to calculate the PV and pore size distribution (PSD). The LP-CO2GA experiment was carried out at 273 K under different partial pressures. A more suitable DFT model was used to calculate the volume and pore size distribution of micropores.
3.4 FE-sem observation
The FE-SEM experiment was carried out by using a Gatan 697 Ilion ⅱ polishing instrument and a Zeiss SIGMA scanning electron microscope (Chalmers et al., 2012). The samples were polished by an argon ion polishing instrument, and then a gold film of approximately 10 nm was coated on the surfaces of the samples. After preparation, the microscopic pore morphology and structural characteristics of the samples were observed by a Zeiss SIGMA scanning electron microscope (Jiao et al., 2019; Yin et al., 2019).
3.5 HMIP experiment
The HPMA experiment was carried out by a Gravimetric Isotherm Rig 3 adsorption instrument. The experimental standard and test method were based on the standard GB/T 1956–2008. The shale samples were screened to the same sizes of 60–80 mesh, and the samples were weighed to approximately 80–120 g. The methane adsorption isotherms of water equilibrium samples were measured at 50°C and 20 MPa under constant pressure.
3.6 Fractal method
The methods for calculating the fractal dimension based on LT-N2GA data include the thermodynamic method, fractal Langmuir model, fractal BET model and fractal FHH model (Li Y. et al., 2019). Among them, the FHH model is proven to be more concise, effective and reliable and is widely used to analyse the surface roughness and spatial structure of porous media (Wang et al., 2015; Li Y. et al., 2019; Li H. et al., 2022). The FHH calculation formula based on LT-N2GA data is as follows:
where
where D is the fractal dimension and the D value is between 2 and 3. When the value is 2, it represents a completely smooth surface and highly homogeneous pore structure. When the value is 3, it indicates an extremely rough pore surface and an extremely complex pore structure (Li Y. et al., 2019; Shi et al., 2022).
4 Results
4.1 TOC, Ro and mineral constituents
The TOC contents of the 12 shale samples range from 0.43% to 5.42% (Table 1). The Ro values of shale samples range from 1.80% to 2.51%, indicating that the organic matter of samples is in the late maturity to early overmaturity stage. XRD analyses of all shale samples are shown in Table 1, showing a wide range of mineral compositions. The main minerals are quartz and clay minerals, and the quartz contents are 24.70%–63.30%. The clay mineral contents range from 16.79% to 39.62%. The shale is similar to the marine shale in the Sichuan Basin and has a much lower clay mineral content than the shale in the transitional zone of the Ordos Basin (Tian et al., 2013; Li et al., 2018; Yang et al., 2014; Li Y. et al., 2019; Peng et al., 2019; He et al., 2021). The clay minerals are mainly illite, an I/S mixed layer, chlorite, and a small amount of kaolinite. The feldspar (potassium feldspar and plagioclase) contents range from 2.29% to 16.80%. The average carbonate mineral content (calcite and dolomite) is 21.16%, ranging from 8.80% to 35.78%. The pyrite content in shale samples is low, with a mean of 1.28%. Pyrite was detected in all shale samples, indicating a reducing environment (Tian et al., 2015; Li Y. et al., 2019).
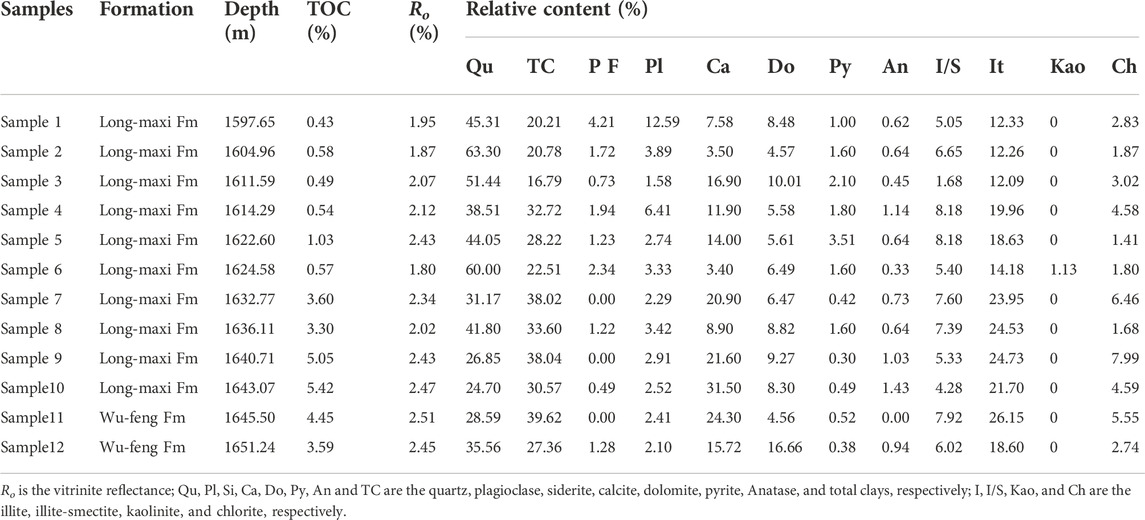
TABLE 1. Geochemical characteristics and mineral composition of shale samples.
4.2 Pore morphology characteristics
According to a previous study by Loucks et al. (2012) the microscopic pores of shale can be divided into four types: intraparticle (intraP) pores, interparticle (interP) pores, microcracks and organic matter (OM) pores. After a detailed petrographic and FE-SEM study of the 12 samples. Typical shale samples with a TOC content of 0.58% (Figure 2) and a TOC content of 5.05% (Figure 3) were selected. Shale samples with low organic matter content mainly developed angular grain pores of brittle minerals (Figure 2B). Although OM pores are also present in the OM, OM pores do not occupy the majority due to the low TOC content. In addition to angular grain pores, irregular OM pores with dense and small pore sizes are generally developed in migrating OM (Figure 2B). Polygonal pyrite in the shale sample is developed, gathered and symbiotic with OM, forming a large amount of complex organic matter-pyrite. The internal development mould hole in pyrite may fall off, and pyrite particles may form, which is the symbiosis with organic matter in the development of a large number of OM pores (Figure 2A). Many previous studies have shown that pyrite pores with organic matter play a role in promoting the formation of pyrite pores (Chalmers et al., 2012; Jiao et al., 2014). Late diagenesis makes it easy to form microcracks at the edges of mineral grains (Figure 2C). Shale samples with high TOC contents mainly develop OM pores (Figures 3A–C), and pores in OM are generally more developed than those in clay minerals (Figure 3C). OM pores are irregular, pit-like, nearly spherical, elliptical, honeycomb-shaped and other shapes and are not evenly distributed, showing local enrichment in OM (Figure 3). In addition, strawberry pyrite is prevalent in shale and forms organic–pyrite complexes with OM (Figure 3C), and the pores of OM are abundant (Jiao et al., 2021). The edge fractures of brittle minerals are common. The edge fractures of brittle minerals may be formed by the extension of the length caused by the mutual connection of slat-like intergranular pores, and the cutting fractures that cut through the whole mineral particles are visible in some minerals (Nie et al., 2015; Li et al., 2017).
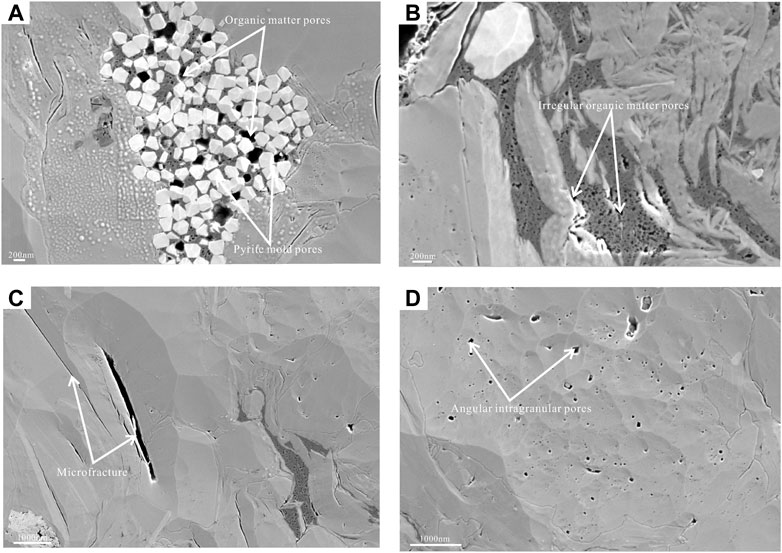
FIGURE 2. FE-SEM images of a shale from the Longmaxi Formation (TOC =0.58%, sample 2) [(A) mould pores and organic pores between pyrite particles; (B) irregular organic pores; (C) microcracks with different openings; (D) angular granular endopore].
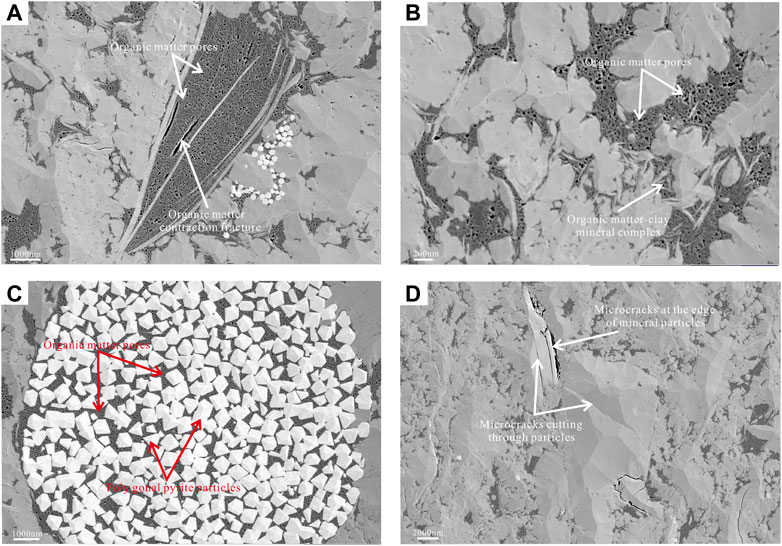
FIGURE 3. FE-SEM images of a shale from the Longmaxi Formation (TOC =5.05%, Sample 9) [(A) organic shrinkage cracks and organic pores; (B) organic-clay mineral complexes and organic pores; (C) organic–pyrite complex and organic pores; (D) mineral grain edge seams and microcracks that cut through minerals].
4.3 Quantitative analyses of the pore structure
4.3.1 LT-N2GA
The adsorption and desorption isotherms of shale samples were obtained by LT-N2GA experiments, and the morphologies of adsorption and desorption isotherms can better characterize the pore structure characteristics of shale (Liu et al., 2015; Hu et al., 2016; Li Y. et al., 2019; Vishal et al., 2019). According to the IUPAC, the isotherms of gas are divided into six basic types, and the isotherms of 12 samples all have typical Type IV isotherms, while the shapes of adsorption isotherms of each sample are slightly different, which is mainly related to the strong heterogeneity of shale (Hu et al., 2016; Peng et al., 2019). According to the shape of the LT-N2GA isotherm under different pressures, the adsorption isotherm curve can be divided into three sections. At low relative pressure (p/p0=0–0.1), the adsorption curve rises rapidly, and nitrogen molecules adsorb in a single layer onto the pore surface and fill in the micropores. With increasing relative pressure, under relative pressures of p/p0=0.1–0.8, the adsorption curve is smooth and gradually increases. Nitrogen molecules have multilayered adsorption in mesopores and macropores, and the more mesopores that have developed, the smoother and more stable the rise is in this stage. With a further increase in pressure, when the relative pressure (p/p0) is in the range of 0.8–1.0, the adsorption amount of N2 increases sharply. Nitrogen molecules fill the macropores, multilayer adsorption occurs, and capillary agglomeration occurs in the macropores (Li Y. et al., 2019; Li H. et al., 2022).
The IUPAC divides the hysteresis loop into four characteristic types. Shale samples can be divided into H3 and H4 types (Figure 4). The adsorption branch of the H3 hysteresis ring rises slowly with increasing relative pressure in the middle- and low-pressure sections and then rises suddenly and rapidly in the high-pressure section. The desorption branch drops rapidly in the high-pressure section and then slows down and coincides with the adsorption branch, representing parallel plate-like pores. Samples one to six hysteresis loops are the H3 type, indicating that parallel plate-like or slate-like pores play a dominant role in the formation. The shape of the hysteresis loops of samples 7–12 is the H4 type, indicating that the pores are dominated by the slit type, and the openness of parallel plate-like pores and slit pores is good, which is conducive to shale gas seepage (Li Y. et al., 2019; Li H. et al., 2022). In addition, the lag loop width of shale samples with high TOC contents is larger than that of shale samples with low TOC contents, indicating that organic matter content has a certain promoting effect on shale pore volume development. The pore structure system of shale may be more complex, which was confirmed by the previous FE-SEM experiment.
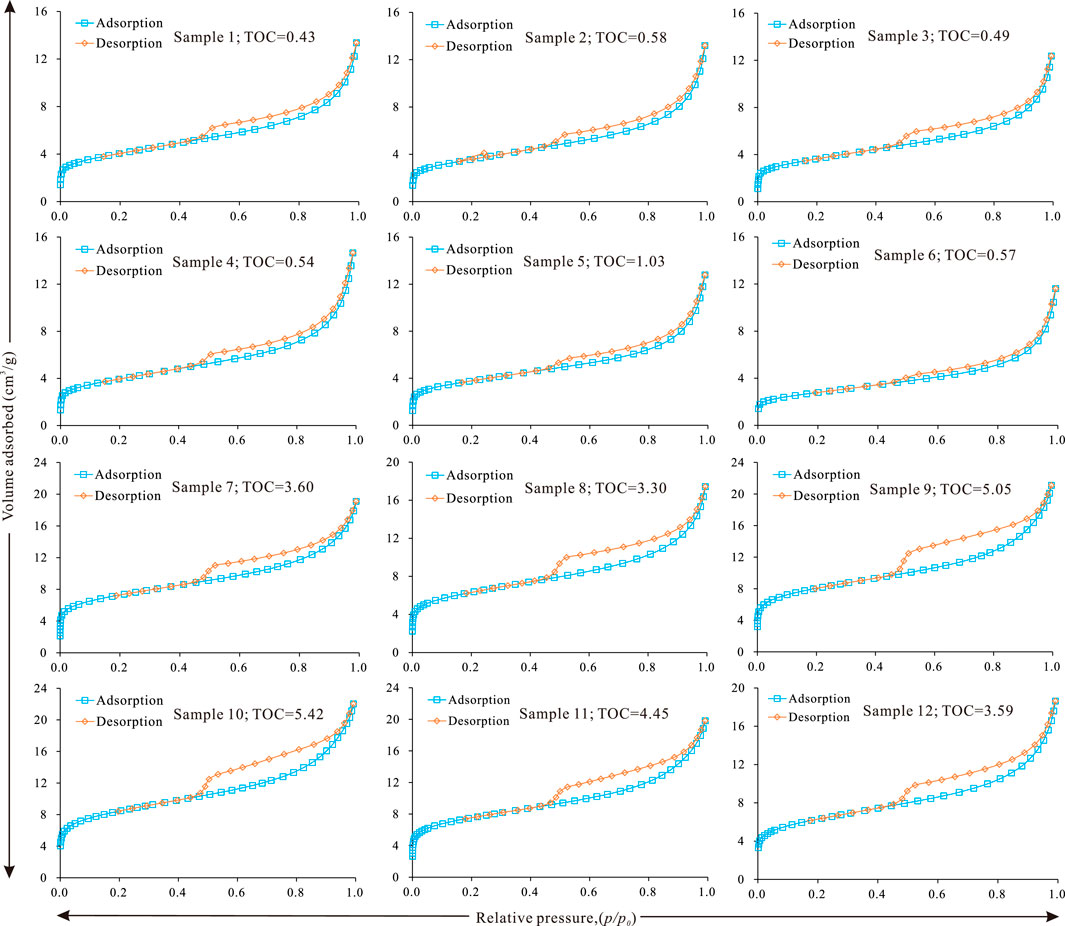
FIGURE 4. N2 adsorption–desorption isotherms of shale samples.
The results of LT-N2GA analysis are shown in Table 2, indicating that pore structure parameters (BET SSA, BJH PV, and APD) show a wide range of variation. The BET SSA values calculated based on LT-N2GA data range from 9.667–28.210 m2/g (mean 18.536 m2/g). The LT-N2GA data-calculated BJH PV values are 0.017–0.029 cm3/g (mean 0.022 cm3/g), and the APD values are 4.644–7.158 nm. The PSD curves of the 12 shale samples are shown in Figure 5. The pore sizes of shale samples range from 2.0 nm to 300 nm. Among them, Sample 1, Sample 3, Sample 7 and Sample 8 are unimodal, and the main peak is approximately 2–4 nm. Other samples showed bimodal characteristics, with the main peak at approximately 2–4 nm and the other peak at approximately 20–60 nm. The BET SSA and BJH PV of shale samples are close to those of marine shale in the Sichuan Basin; however, they are significantly higher than those of transitional shale in the Ordos Basin (Tian et al., 2013; Li et al., 2018; Yang et al., 2014; Li Y. et al., 2019; Peng et al., 2019; He et al., 2021). The microscopic pore structure of shale reflects that there are a large number of nanoscale pores in shale, and the shale has a large BET SSA and BJH PV, which can provide abundant storage space for hydrocarbon gas.
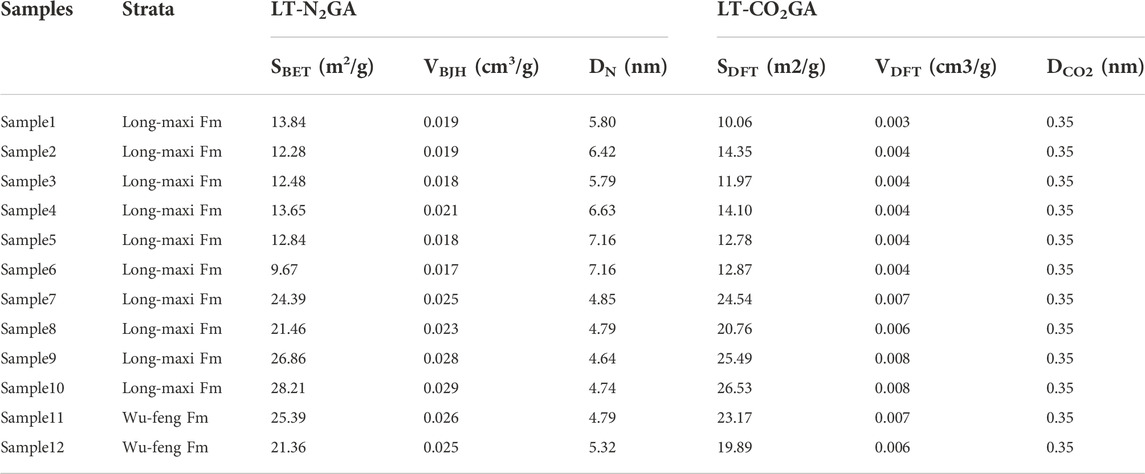
TABLE 2. Pore structural parameters of all samples.
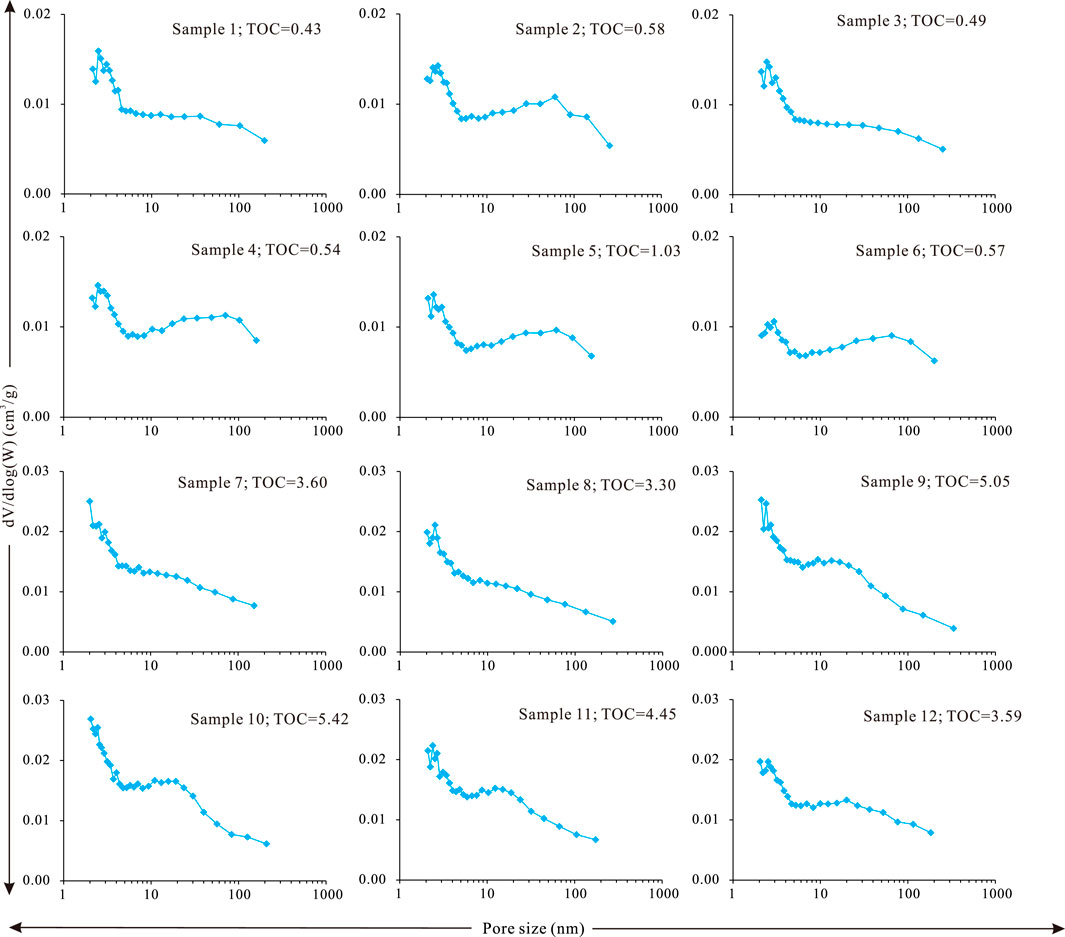
FIGURE 5. Pore size distributions obtained from LT-N2GA isotherms.
4.3.2 LP-CO2GA
Due to the strong energy and fast equilibrium of CO2 molecules in high-temperature analysis (273 K), CO2 molecules can enter smaller pores, especially those with diameters <2 nm, providing most of the storage space for the absorbed gas (Chen et al., 2017; Li Y. et al., 2019). The LP-CO2GA isotherms of 12 shale samples are shown in Figure 6A. According to the IUPAC classification, these isotherms have the characteristics of type I isotherms. The adsorbed CO2 of sample 10 is the highest, reaching 2.58 cm3/g, indicating that the sample contains more micropores. Sample 1 adsorbs the least amount of CO2, only 1.00 cm3/g, indicating that relatively few micropores are present in the sample.
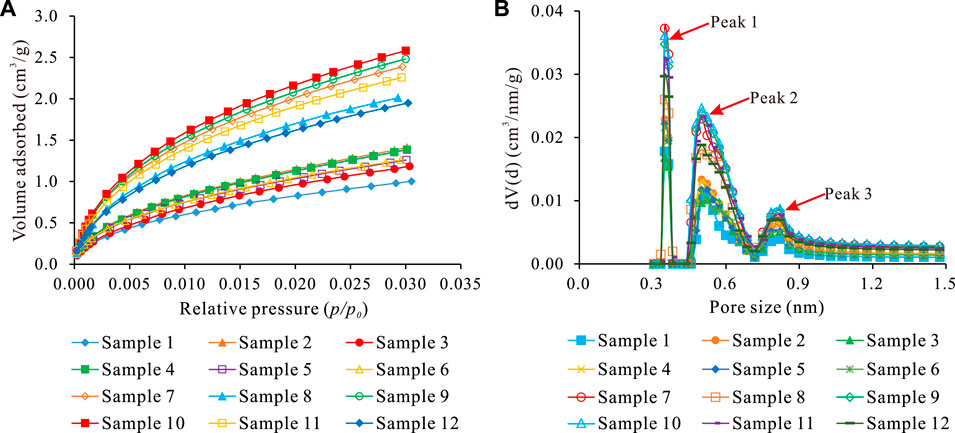
FIGURE 6. (A) CO2 adsorption isotherms of shale samples and (B) pore size distributions obtained from LP-CO2GA.
Table 2 shows the pore parameters of all samples calculated by the NLDFT method. The SSA values of micropores range from 10.061 m2/g to 26.526 m2/g (mean 18.043 m2/g). The volumes of micropores obtained by CO2 adsorption isotherms range from 0.003 to 0.008 cm3/g (mean 0.005 cm3/g). The average pore diameter (ADP) width of all samples is 0.349 nm. Based on the distribution characteristics of the pore size of CO2 isothermal adsorption (Figure 6B), the micropore development of the sample generally presents a multipeak type, with main peaks of 0.3–0.4 nm, 0.4–0.7 nm, and 0.7–0.9 nm, indicating a wide distribution range of micropores in shale samples. In the range of 0.3–0.9 nm, the pore diameters corresponding to the main peaks are 0.35 nm, 0.5 nm and 0.8 nm.
LT-N2GA is the low-temperature N2 adsorption; LT-CO2GA is the low-pressure CO2 adsorption; SBET is the BET specific surface area, m2/g; VBJH is the BJH pore volume, cm3/g; DN is the average pore width by LT-N2GA, nm; SDFT is the DFT specific surface area, m2/g; VDFT is the DFT pore volume, cm3/g; DCO2 is the average pore width by LT-CO2GA, nm.
4.4 Pore fractal characteristics
The D is widely used to characterize the surface roughness and spatial structure complexity of porous media (Yang et al., 2014; Li et al., 2018; Peng et al., 2019). D is a quantitative index used to characterize the roughness or complexity of a solid surface. D varies from 2 to 3, and the closer it is to 3, the rougher the pore surface and the more complex the pore structure (Tian et al., 2013; Hu et al., 2016). As D increases, the pore structure of the materials changes from regular pores to complex pores. D can be applied to the complexity of the pore structure of shale and coal rock (Wang et al., 2015; Li Y. et al., 2019; Peng et al., 2019). Table 3 lists the D of shale samples from different regions.
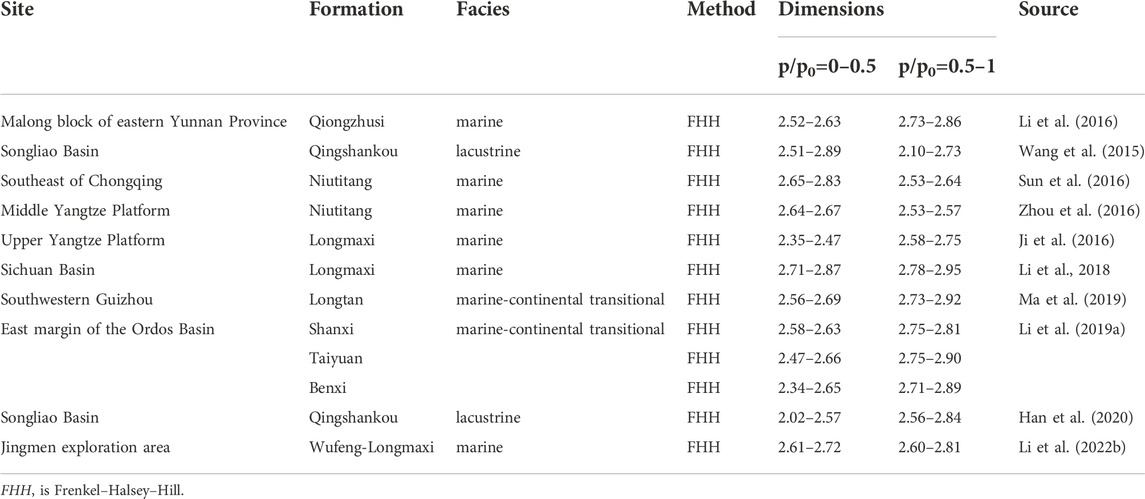
TABLE 3. Comparisons of the fractal dimensions of shale samples in different areas.
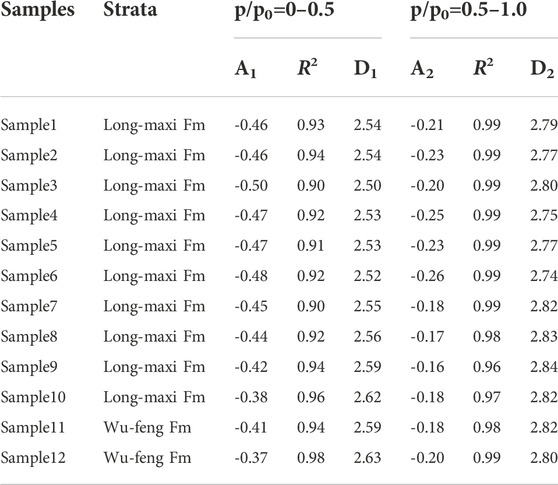
TABLE 4. Fractal dimensions derived from the FHH model.
D were calculated on the basis of LT-N2GA isotherm data and the fractal FHH model. Figure 7 shows the FHH curves of
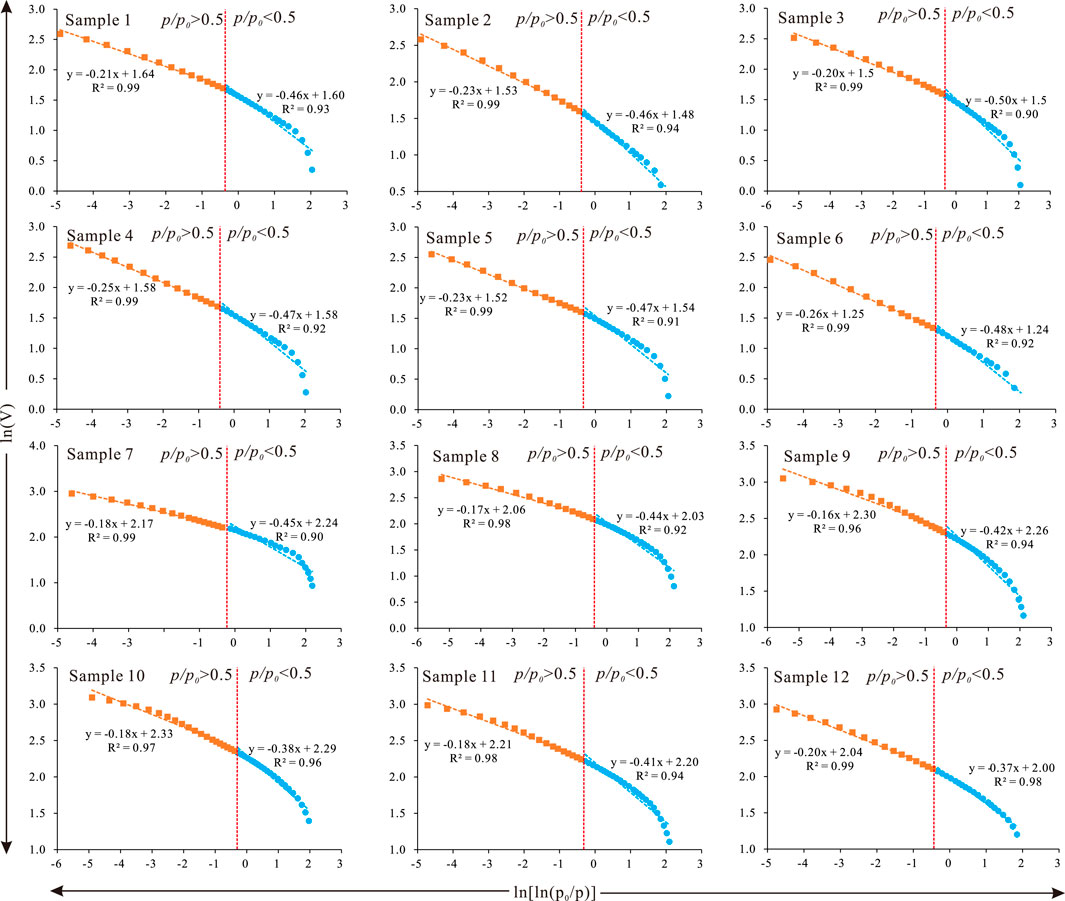
FIGURE 7. Fractal calculation results.
4.5 Methane adsorption characteristics
The methane gas adsorption capacity is the most important factor for evaluating shale reservoir characteristics and is a key index for shale gas resource development (Chalmers and Bustin, 2007; Guo, 2013; Wang et al., 2016; Chen et al., 2017). Figure 8A shows significant differences in the Langmuir volume (VL) of shale. The VL of shale samples ranges from 1.16 to 3.81 m3/t (mean 2.28 m3/t). The VL values of samples 10 and four are 3.81 and 1.16 m3/t, respectively, corresponding to TOC contents of 5.42% and 0.54%, respectively. The VL of shale tends to increase with increasing TOC content (Figure 8B), and the correlation coefficient is as high as 0.52, indicating that organic carbon content is the main factor affecting the development of nanoscale pores in shale (Wang et al., 2016; Sun and Guo, 2018; Zhang et al., 2022). With the increase in TOC content, the VL of shale also increases, which is consistent with previous research results (Sun et al., 2016; Chen et al., 2017; Sun and Guo, 2018). The reason may be that the increase in shale thermal evolution causes kerogen to generate hydrocarbons and form more organic pores. In addition, OM pores have a greater internal pore SSA than other types of pores (Chen et al., 2017; Sun and Guo, 2018). As a consequence, the increase in TOC content provides a large amount of storage space for shale gas, thus increasing the overall shale gas content.
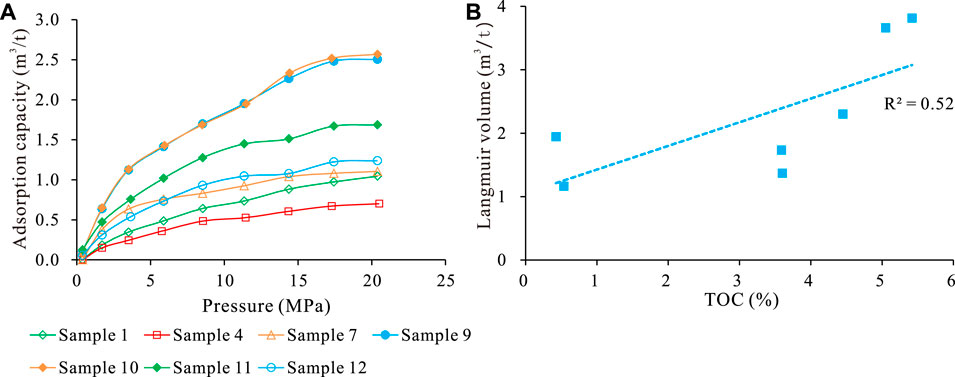
FIGURE 8. (A) Isothermal adsorption curves of shale samples and (B) relationships between the TOC and VL of shale samples.
5 Discussion
5.1 Pore structure distribution characteristics
LT-N2GA and LP-CO2GA experiments were used to obtain the micropore, mesopore and macropore PV and SSA values of shale samples (Jiao et al., 2014; Li X. et al., 2022). The contributions of different scales to PV are shown in Figure 9A. The PV of shale micropores is 0.008 cm3/g on average, accounting for approximately 25% of the total PV. The PV of mesopores accounts for the largest proportion, approximately 53%, with a mean value of 0.017 cm3/g. The PV of macropores is relatively small, namely, 0.006 cm3/g, accounting for approximately 22% of the total PV. Therefore, micropores (<2 nm) and mesopores (2–50 nm) have the largest contribution to PV, while macropores (50–300 nm) have a low contribution to PV. The contribution of the comparative SSA at different scales is shown in Figure 9B. The average SSA of shale micropores is 19.08 m2/g, accounting for approximately 71% of the total specific surface area. The average SSA of mesopores is 7.29 m2/g, while that of macropores is only 0.26 m2/g. Thus, the contribution of micropores is followed by mesopores and macropores. This result shows the importance of micropores and mesopores in shale reservoirs. LT-N2GA and LP-CO2GA experiments are of special significance for shale microscopic pore analysis (Jiang et al., 2016; Zhou et al., 2019).
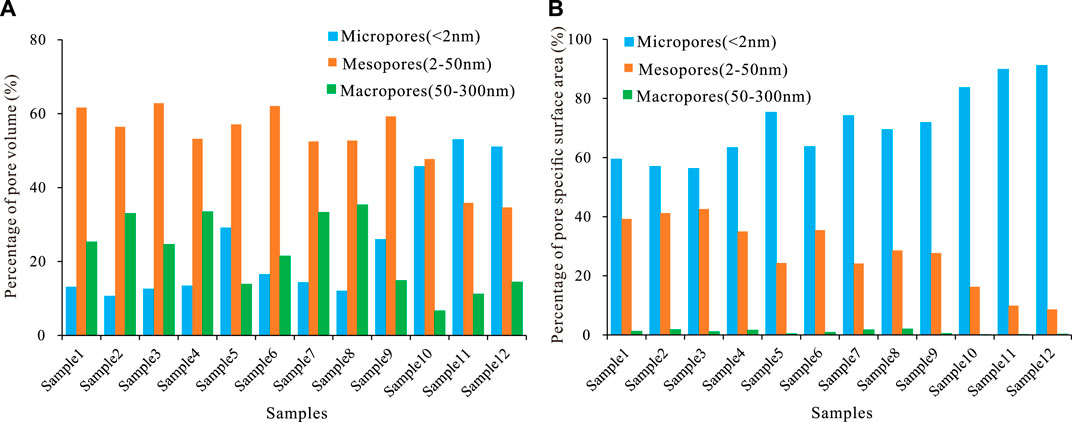
FIGURE 9. Distributions of different scales of pores acquired from LT-N2GA and LP-CO2GA [(A) percentage of the PV; (B) percentage of the pore SSA].
The relationship between the BET SSA, BJH PV and APD is shown in Figure 10. As shown in Figure 10A, the BET SSA is positively correlated with the BJH PV (R2=0.95). In addition, the APD is negatively correlated with the BET SSA and BJH PV (R2=0.82 in Figure 10B and R2=0.72 in Figure 10C), indicating that the SSA and PV of shale increase as the APD decreases. This relationship has previously been observed in shales from marine facies in the Sichuan Basin (Yang et al., 2014; Li et al., 2018; Wang et al., 2019), marine continental transitional facies in the Ordos Basin (Sun and Guo, 2018; Li Y. et al., 2019; He et al., 2021) and lacustrine facies in the Songliao Basin (Wang et al., 2015; Han et al., 2020). Figure 9 shows that micropores and mesopores contribute significantly to the SSA and PV of shale samples. Shale with smaller APD has more micropores and mesopores, and the SSA and total PV are relatively higher.
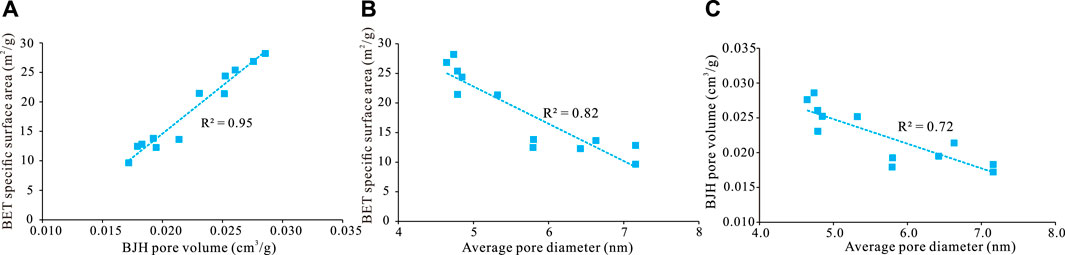
FIGURE 10. Correlation between pore structure parameters. [(A) BET SSA vs BJH PV, (B) BET SSA vs APD; (C) BJH PV vs APD].
5.2 Correlation between pore structure and the shale composition
Previous studies have shown that the microscopic pore structure of shale is closely related to its material composition, and TOC, quartz and clay minerals greatly affect the pore structure distribution of shale (Yang et al., 2014; Li Y. et al., 2019; Han et al., 2020; He et al., 2021). The influence of the TOC, quartz and clay mineral contents on pore structure parameters (BET SSA, BJH PV and APD) is shown in Figure 11. As shown by the figure, the mineral composition and TOC have obvious effects on the pore structure parameters. The BET SSA and BJH PV of shale samples show a significant positive correlation with the TOC content (R2=0.96 in Figure 11A and R2=0.92 in Figure 11B). The BJH PV and BET SSA of shale samples with higher TOC contents are larger, which is completely consistent with previous studies on marine shale (Yang et al., 2014; Ji et al., 2016; Li et al., 2018; Sun et al., 2016; Zhou et al., 2016; Wang et al., 2019; Li X. et al., 2022), marine continental transitional shale (Sun and Guo, 2018; Li Y. et al., 2019; He et al., 2021) and lacustrine shale (Wang et al., 2015; Han et al., 2020). This is due to the porous structure of OM itself and the development of a large number of nanoscale pores during the thermal evolution of OM. A complex three-dimensional pore network of inner and outer pores provides more SSA and adsorption space for the gas molecules. Figure 11 shows the relationship between the BET SSA, BJH PV and mineral composition of shale samples. The quartz content is negatively correlated with the BET SSA and BJH PV (R2=0.80 in Figure 11C and R2=0.79 in Figure 11D, respectively). The clay mineral content is positively correlated with the BET SSA and BJH PV (R2=0.59 in Figure 11E and R2=0.58 in Figure 11F, respectively). Due to the high SSA of illite and illite/smectite mixed layers in clay minerals, the BET SSA is 30.8 m2/g and 7.1 m2/g, respectively (Li et al., 2016). However, the smooth surface of quartz has fewer pores, and the SSA and total PV of quartz are smaller. In conclusion, TOC and clay minerals increase porosity together and have a positive effect on the PV and SSA of shale, while quartz has a negative effect on the total PV and SSA of shale.
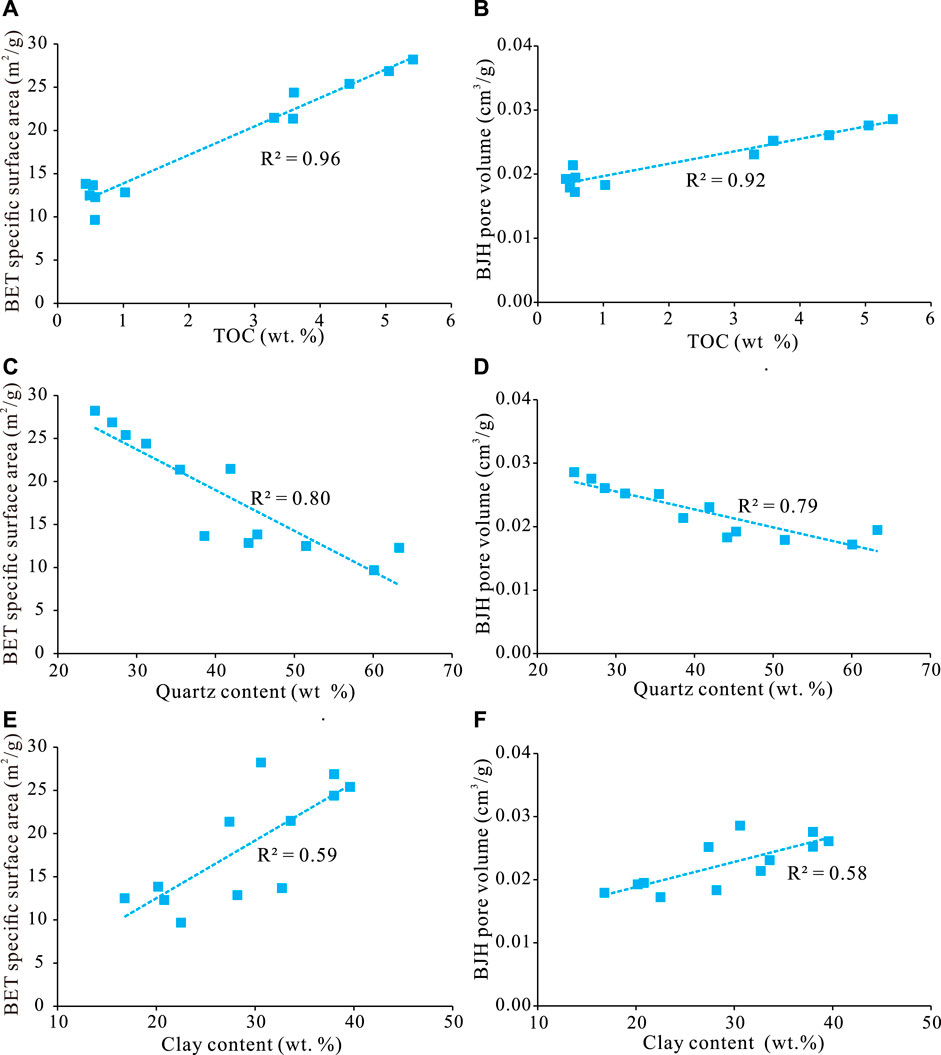
FIGURE 11. Relationships between pore structure parameters and shale composition [(A) TOC vs BET SSA, (B) TOC vs BJH PV; (C) quartz content vs BET SSA; (D) quartz content vs BJH PV; (E) clay content vs BET SSA, (F) clay content vs BJH PV].
5.3 Factors that influence fractal dimensions
To study the influence of the TOC content and major minerals (quartz and clay minerals) on the D of shale pores, Figure 12 shows the influence of the TOC, quartz and clay mineral contents on the D of shale pores. As shown in Figure 12A, the D1 and D2 are positively correlated with the TOC content. Previous studies have found that the D of shale pores has a positive correlation with TOC content or a parabolic relationship. When the TOC content is greater than 6.0%, the D tends to level or decrease with increasing TOC content (Wang et al., 2015; Li et al., 2016; Ma et al., 2019). This is because the shale samples with high TOC contents are affected by the hydrocarbon generation effect, and the TOC content of shale in the study area is between 0.43% and 5.42%. Therefore, the complexity and heterogeneity of the pore structure of shale samples are not affected by the hydrocarbon generation effect. As the quartz content increases, the D1 and D2 values show an obvious trend of change (Figure 12B), The smooth surface of quartz indicates that quartz in shale weakens the development of pores and reduces the heterogeneity and irregularity of shale microstructure. The D2 value increases with increasing clay mineral content (Figure 12C), indicating that clay minerals have a positive effect on the D. Shale clays containing clay minerals have different pore types, with irregular pore structures and higher D (Li Y. et al., 2019). The influence of clay minerals and the TOC content on the D of shale pores is not obvious compared with that of marine shale of the Wufeng Formation (Liang et al., 2015; Li X. et al., 2022) and Niutitang Formation (Sun et al., 2016; Zhou et al., 2016) in the Sichuan Basin, indicating that the factors controlling the D of shale pores in northern Yunnan and Guizhou are more complex. This complexity may be affected by a combination of factors. The factors controlling the D of shale pores in the northern Yunnan and Guizhou areas need to be studied in more detail in the future.
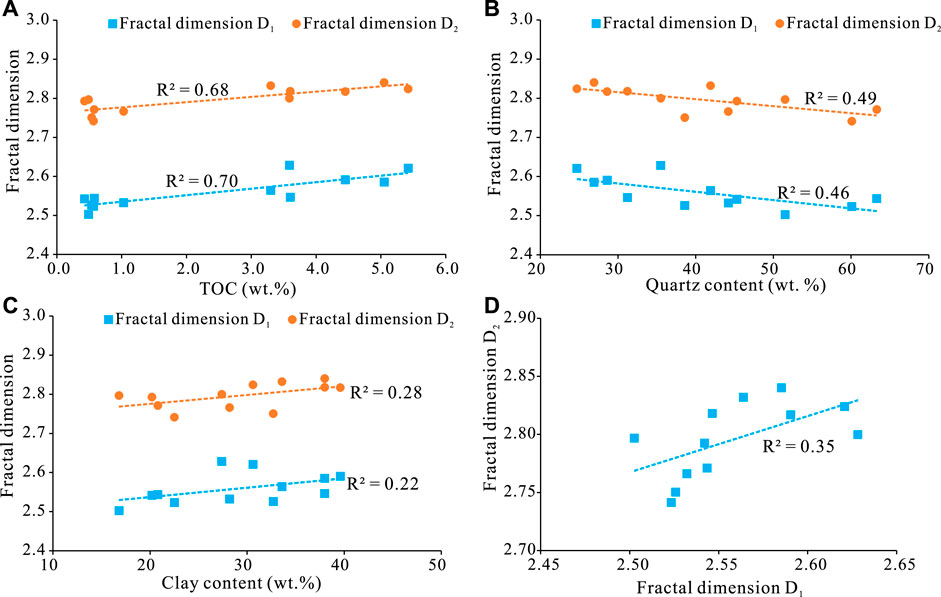
FIGURE 12. Relationships between the shale composition and fractal dimensions (D1 and D2) [(A): TOC vs D1 and D2; (B): quartz content vs D1 and D2; (C): clay content vs D1 and D2; (D): D1 vs D2].
The correlation analysis between microscopic pore structure parameters and D1 and D2 can be seen (Figure 13). BET SSA was positively correlated with D1 and D2 (R2=0.63 and R2=0.64 in Figure 13A). There was a positive correlation between BJH PV and D1, D2 (R2=0.71 and R2=0.60 in Figure 13B). The larger BET SSA and BJH PV were, the larger D1 and D2 were. The APD has a good negative correlation with D2 (R2=0.92 in Figure 13C), while APD has an insignificant negative correlation with D1 (R2=0.43 in Figure 13C), indicating that D2 may be a good parameter for representing the irregularity of the pore space structure. The smaller the APD is, the more micropores there are, the more complex the micropore structure, the rougher the pore surface, and the higher the SSA and fractal dimension of the shale. In addition, the increase in PV provides more adsorption space and adsorption sites for gas, which increases the D. The relationships between the pore structure parameters and D in the northern Yunnan–Guizhou marine shale are consistent with those in the Sichuan Basin marine shale, marine–continental transitional shale and lacustrine shale discussed by Li et al. (2018), Li H. et al. (2019) and Han et al. (2020).
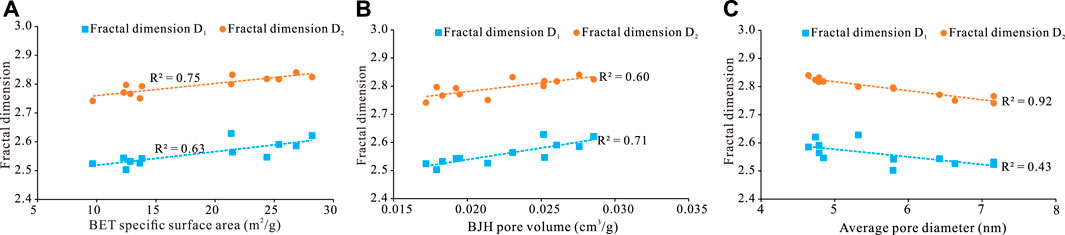
FIGURE 13. Relationships between the fractal dimensions (D1 and D2) and pore structure parameters [(A) D1 and D2 vs BET SSA; (B) D1 and D2 vs BJH PV; (C) D1 and D2 vs APD].
5.4 Discrepancies in fractal dimensions and their contributions to ch4 adsorption capacity
The relationship between the D1 and D2 and CH4 adsorption performance is shown in Figure 14A. The Langmuir volume (VL) of shale samples is positively correlated with the D, and the observed changing trend is consistent with previous studies on shale in the Sichuan Basin (Guo, 2013; Yang et al., 2014; Wang et al., 2016; Li et al., 2018). The higher the D is, the more irregular the shale sample surface, the more adsorption sites can occur, and the greater the force between shale and gas molecules (Chen et al., 2017). The correlation between D1 and VL is more obvious. The molecular monolayer adsorption theory holds that the adsorption of methane gas molecules on shale microporous surfaces is monolayer adsorption, which is controlled by two factors: adsorption energy and SSA (Wang et al., 2016; Chen et al., 2017). The larger the adsorption energy and SSA between methane gas molecules and the solid surface are, the larger the adsorption amount of methane gas. As shown in Figure 14B, the APD is negatively correlated with the SSA, and the SSA increases with APD (Chen et al., 2017). The smaller the APD is, the larger the SSA and the more favourable the adsorption of methane gas molecules.
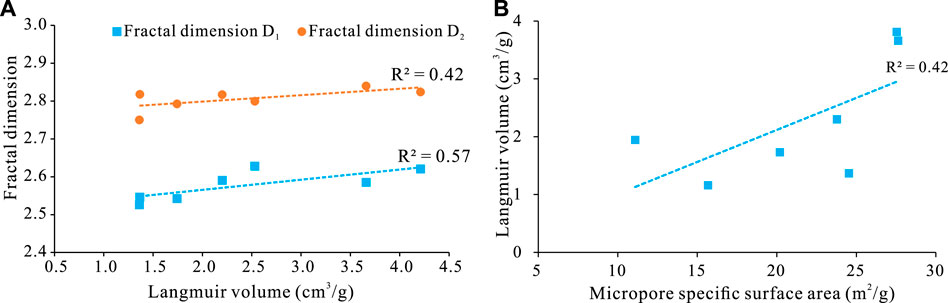
FIGURE 14. (A) Relationships between the VL and fractal dimensions (D1 and D2) and (B) relationships between the VL and micropore SSA.
The adsorption process of nitrogen onto shale can be divided into two stages: single molecule adsorption in micropores or on the surfaces of larger pores and multimolecule adsorption in larger pores (Zhou et al., 2017). D1 reflects the adsorption stage of a single molecule with a relative pressure less than 0.5, and the adsorption capacity comes from the van der Waals forces of molecules between the gas and liquid phases, that is, the early stage of nitrogen adsorption, which is dominated by pore surface adsorption; fractal dimension D1 is dominant (Figure 15A). Because of the different pore distributions, the adsorption capacity of different organic shale pores is obviously different, and the adsorption capacity of sample 10 is larger. As the adsorption pressure increases, multilayered adsorption of micropores in shale begins to occur, and fractal dimension D2 is dominant (Figure 15B). The adsorption capacity comes from the surface tension between the gas and liquid phases. This process is greatly affected by the irregularity of the pore structure; finally, a condensed liquid is formed, and the adsorption process is completed (Wang et al., 2016; Zhou et al., 2017; Sun and Guo, 2018).
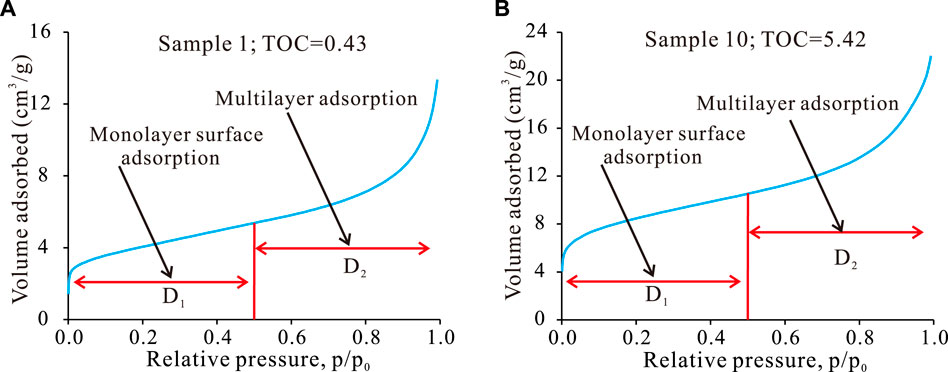
FIGURE 15. Chart showing the adsorption process and the major fractal dimension in (A) sample 1 and (B) sample 10.
6 Conclusion
1) The pores developed in the Wufeng–Longmaxi shales are mainly OM pores and intraP pores. According to the adsorption-desorption curve of LT-N2GA, mainly parallel plate-like pores and slit pores are observed.
2) Most of the pores are in the 0.3–0.9 nm and 2–4 nm range, with some pores between 20 and 60 nm, as acquired by LT-N2GA and LP-CO2GA.
3) The mineralogical compositions and TOC of the Wufeng–Longmaxi shales have different impacts on the pore structure parameters. The TOC content has a positive effect on the BET SSA and BJH PV. The BET SSA and BJH PV are positively correlated with the clay mineral content but negatively linearly correlated with the quartz content.
4) The pore structure parameters in turn exert different effects on the fractal dimensions D1 and D2. D1 and D2 increase with increasing total PV and SSA and decrease with APD. D1 and D2 have a significant positive correlation with the TOC and clay mineral content and a significant negative correlation with the quartz content. In addition, the higher the D is, the greater the adsorption capacity of shale.
Data availability statement
The original contributions presented in the study are included in the article/supplementary material, further inquiries can be directed to the corresponding authors.
Author contributions
WT designed and performed the experiments, wrote the manuscript. ZD analyzed the experimental data. FT collected the data and shale samples. HH modified the manuscript. TW designed and performed the experiments, wrote the manuscript. All authors contributed to the article and approved the submitted version.
Funding
This research was jointly supported by the National Natural Science Foundation of China (Grant No. 41472122) and Innovative Team Project of Education Department of Hubei Province (Grant No. T201905). We thank PetroChina Exploration and Development Research Institute for picking up the samples.
Conflict of interest
Author FT was employed by PetroChina Coalbed Methane Company.
The remaining authors declare that the research was conducted in the absence of any commercial or financial relationships that could be construed as a potential conflict of interest.
Publisher’s note
All claims expressed in this article are solely those of the authors and do not necessarily represent those of their affiliated organizations, or those of the publisher, the editors and the reviewers. Any product that may be evaluated in this article, or claim that may be made by its manufacturer, is not guaranteed or endorsed by the publisher.
References
Barrett, E. P., Joyner, L. G., and Halenda, P. P. (1951). The determination of pore volume and area distributions in porous substances. II. Comparison between nitrogen isotherm and mercury porosimeter methods. J. Am. Chem. Soc. 73, 3155–3158. doi:10.1021/JA01151A046
Brunauer, S., Emmett, P. H., and Teller, E. (1938). Adsorption of gases in multimolecular layers. J. Am. Chem. Soc. 60, 309–319. doi:10.1021/JA01269A023
Chalmers, G. R., Bustin, R. M., and Power, I. M. (2012). Characterization of gas shale pore systems by porosimetry, pycnometry, surface area, and field emission scanning electron microscopy/transmission electron microscopy image analyses: Examples from the barnett, woodford, haynesville, marcellus, and doig units. Bulletin 96 (6), 1099–1119. doi:10.1306/10171111052
Chalmers, G. R. L., and Bustin, R. M. (2007). The organic matter distribution and methane capacity of the lower cretaceous strata of northeastern British columbia, Canada. Int. J. Coal Geol. 70, 223–239. doi:10.1016/j.coal.2006.05.001
Chandra, D., and Vishal, V. (2020). A comparison of nano-scale pore attributes of Barakar Formation gas shales from Raniganj and Wardha Basin, India using low pressure sorption and FEG-SEM analysis. J. Nat. Gas Sci. Eng. 81, 103453. doi:10.1016/j.jngse.2020.103453
Chandra, D., Vishal, V., Bahadur, J., and Sen, D. (2020a). A novel approach to identify accessible and inaccessible pores in gas shales using combined low-pressure sorption and SAXS/SANS analysis. Int. J. Coal Geol. 228, 103556. doi:10.1016/j.coal.2020.103556
Chandra, D., Vishal, V., Debbarma, A., Banerjee, S., Pradhan, S. P., and Mishra, M. K. (2020c). Role of composition and depth on pore attributes of barakar formation gas shales of ib valley, India, using a combination of low-pressure sorption and image analysis. Energy fuels. 34 (7), 8085–8098. doi:10.1021/acs.energyfuels.0c00746
Chen, S., Tao, S., Tang, D., Xu, H., Li, S., Zhao, J., et al. (2017). Pore structure characterization of different rank coals using N2 and CO2 adsorption and its effect on CH4 adsorption capacity: A case in panguan syncline, western Guizhou, China. Energy fuels. 31 (6), 6034–6044. doi:10.1021/acs.energyfuels.7b00675
Clarkson, C. R., Freeman, M., He, L., Agamalian, M., Melnichenko, Y. B., Mastalerz, M., et al. (2012). Characterization of tight gas reservoir pore structure using USANS/SANS and gas adsorption analysis. Fuel 95, 371–385. doi:10.1016/j.fuel.2011.12.010
Clarkson, C. R., Solano, N., Bustin, R. M., Bustin, A., Chalmers, G., He, L., et al. (2013). Pore structure characterization of North American shale gas reservoirs using USANS/SANS, gas adsorption, and mercury intrusion. Fuel 103, 606–616. doi:10.1016/j.fuel.2012.06.119
Guo, S. (2013). Experimental study on isothermal adsorption of methane gas on three shale samples from upper paleozoic strata of the Ordos Basin. J. Pet. Sci. Eng. 110, 132–138. doi:10.1016/j.petrol.2013.08.048
Han, H., Guo, C., Zhong, N., Pang, P., and Gao, Y. (2020). A study on fractal characteristics of lacustrine shales of Qingshankou Formation in the Songliao Basin, northeast China using nitrogen adsorption and mercury injection methods. J. Petroleum Sci. Eng. 193, 107378. doi:10.1016/j.petrol.2020.107378
He, H., Liu, P., Xu, L., Hao, S., Qiu, X., Shan, C., et al. (2021). Pore structure representations based on nitrogen adsorption experiments and an FHH fractal model: Case study of the block Z shales in the Ordos Basin, China. J. Petroleum Sci. Eng. 203, 108661. doi:10.1016/j.petrol.2021.108661
Hou, J., Wang, B., Zhang, Y., and Zhang, J. (2017). Evolution characteristics of micropore and mesopore of different rank coal and cause of their formation. Coal Geol. Explor. 45 (5), 75–81.
Hu, J., Tang, S., and Zhang, S. (2016). Investigation of pore structure and fractal characteristics of the lower silurian Longmaxi shales in Western hunan and Hubei provinces in China. J. Nat. Gas Sci. Eng. 28, 522–535. doi:10.1016/j.jngse.2015.12.024
IUPAC (International Union of Pure and Applied Chemistry) (1994). Physical chemistry division commission on colloid and surface chemistry, subcommittee on characterization of porous solids: Recommendations for the characterization of porous solids (technical report). Pure Appl. Chem. 66, 1739–1758.
Ji, W., Song, Y., Jiang, Z., Meng, M., Liu, Q., Chen, L., et al. (2016). Fractal characteristics of nano-pores in the lower silurian Longmaxi shales from the upper Yangtze platform, south China. Mar. Pet. Geol. 78, 88–98. doi:10.1016/j.marpetgeo.2016.08.023
Jiang, Z. X., Tang, X. L., Li, Z., Huang, H. X., Yang, P. P., Yang, X., et al. (2016). The whole-aperture pore structure characteristics and its effect on gas content of the Longmaxi Formation shale in the Sichuan basin. Earth Sci. Front. 23 (2), 127–134. doi:10.13745/j.esf.2016.02.013
Jiao, K., Yao, S., Liu, C., Gao, Y., Wu, H., Li, M., et al. (2014). The characterization and quantitative analysis of nanopores in unconventional gas reservoirs utilizing FESEM–FIB and image processing: An example from the lower Silurian Longmaxi Shale, upper Yangtze region, China. Int. J. Coal Geol. 128, 1–11. doi:10.1016/j.coal.2014.03.004
Jiao, P. F., Yao, G. S., Zhou, S. W., Yu, Z., and Wang, S. L. (2021). A comparative study of the micropore structure between the transitional and marine shales in China. Geofluids 1, 14. doi:10.1155/2021/5562532
Li, A., Ding, W., He, J., Dai, P., Yin, S., and Xie, F. (2016). Investigation of pore structure and fractal characteristics of organicrich shale reservoirs: A case study of lower cambrian qiongzhusi formation in malong block of eastern yunnan province, south China. Mar. Petroleum Geol. 70, 46–57. doi:10.1016/j.marpetgeo.2015.11.004
Li, H., Tang, H. M., Qin, Q. R., Zhou, J. L., Qin, Z. J., Fan, C. H., et al. (2019b). Characteristics, formation periods and genetic mechanisms of tectonic fractures in the tight gas sandstones reservoir: A case study of xujiahe formation in YB area, Sichuan Basin, China. J. Pet. Sci. Eng. 178, 723–735. doi:10.1016/j.petrol.2019.04.007
Li, H., Zhou, J. L., Mou, X. Y., Guo, H. X., Wang, X. X., An, H. Y., et al. (2022c). Pore structure and fractal characteristics of the marine shale of the Longmaxi formation in the changning area, southern Sichuan Basin, China. Front. Earth Sci. 10, 1018274. doi:10.3389/feart.2022.1018274
Li, J., Li, H., Yang, C., Wu, Y. J., Gao, Z., and Jiang, S. L. (2022a). Geological characteristics and controlling factors of deep shale gas enrichment of the Wufeng-Longmaxi formation in the southern Sichuan Basin, China. Lithosphere 2022. doi:10.2113/2022/4737801
Li, X., Wang, Y., Lin, W., Ma, L., Liu, D., Liu, J., et al. (2022b). Micro-pore structure and fractal characteristics of deep shale from Wufeng Formation to Longmaxi formation in jingmen exploration area, Hubei province, China. J. Nat. Gas Geoscience 22 (3), 121–132. doi:10.1016/j.jnggs.2022.06.001
Li, Y., Wang, Z., Pan, Z., Niu, X., Yu, Y., and Meng, S. (2019a). Pore structure and its fractal dimensions of transitional shale: A cross-section from east margin of the Ordos Basin, China. Fuel 241, 417–431. doi:10.1016/j.fuel.2018.12.066
Li, Z., Liu, D., Cai, Y., Ranjith, P. G., and Yao, Y. (2017). Multi-scale quantitative characterization of 3-D pore-fracture networks in bituminous and anthracite coals using FIB-SEM tomography and X-ray μ-CT. Fuel 209, 43–53. doi:10.1016/j.fuel.2017.07.088
Lia, Z., Shen, X., Qia, Z., and Hua, R. (2018). Study on the pore structure and fractal characteristics of marine and continental shale based on mercury porosimetry, N2 adsorption and NMR methods. J. Nat. Gas. Sci. Eng. 53, 12–21. doi:10.1016/j.jngse.2018.02.027
Liang, L., Xiong, J., and Liu, X. (2015). An investigation of the fractal characteristics of the Upper Ordovician Wufeng Formation shale using nitrogen adsorption analysis. J. Nat. Gas. Sci. Eng. 27 (2), 402–409. doi:10.1016/j.jngse.2015.07.023
Liang, X., Zhang, T. S., Shu, H. L., Min, H. J., Zhang, Z., and Zhang, L. (2020). Evaluation of shale gas resource potential of Longmaxi formation in zhaotong national shale gas demonstration area in the northern yunnan-guizhou. Geol. China 47 (1), 72–87.
Liu, X., Xiong, J., and Liang, L. (2015). Investigation of pore structure and fractal characteristics of organicrich Yanchang formation shale in central China by nitrogen adsorption/desorption analysis. J. Nat. Gas Sci. Eng. 22, 62–72. doi:10.1016/j.jngse.2014.11.020
Loucks, R. G., Reed, R. M., Ruppel, S. C., and Hammes, U. (2012). Spectrum of pore types and networks in mudrocks and a descriptive classification for matrix-related mudrock pores. Am. Assoc. Pet. Geol. Bull. 96, 1071–1098. doi:10.1306/08171111061
Loucks, R. G., Reed, R. M., Ruppel, S. C., and Jarvie, D. M. (2009). Morphology, genesis, and distribution of nanometer-scale pores in siliceous mudstones of the mississippian barnett shale. J. Sediment. Res. 79, 848–861. doi:10.2110/jsr.2009.092
Ma, X., Guo, S., Shi, D., Zhou, Z., and Liu, G. (2019). Investigation of pore structure and fractal characteristics of marine continental transitional shales from Longtan Formation using MICP, gas adsorption, and NMR (Guizhou, China). Mar. Pet. Geol. 107, 555–571. doi:10.1016/j.marpetgeo.2019.05.018
Mastalerz, M., He, L., Melnichenko, Y. B., and Rupp, J. A. (2012). Porosity of coal and shale: Insights from gas adsorption and SANS/USANS techniques. Energy fuels. 26 (8), 5109–5120. doi:10.1021/ef300735t
Nie, B., Liu, X., Yang, L., Meng, J., and Li, X. (2015). Pore structure characterization of different rank coals using gas adsorption and scanning electron microscopy. Fuel 158, 908–917. doi:10.1016/j.fuel.2015.06.050
Peng, N., He, S., Hu, H., Zhang, B., He, X., Zhai, G., et al. (2019). Organic nanopore structure and fractal characteristics of Wufeng and lower member of Longmaxi shales in southeastern Sichuan, China. Mar. Pet. Geol. 103, 456–472. doi:10.1016/j.marpetgeo.2019.03.017
Petersen, H. I., Schovsbo, N. H., and Nielsen, A. T. (2013). Reflectance measurements of zooclasts and solid bitumen in lower paleozoic shales, southern scandinavia: Correlation to vitrinite reflectance. Int. J. Coal Geol. 114, 1–18. doi:10.1016/j.coal.2013.03.013
Ross, D., and Bustin, R. M. (2008). Characterizing the shale gas resource potential of devonian-mississippian strata in the western Canada sedimentary basin: Application of an integrated formation evaluation. Am. Assoc. Pet. Geol. Bull. 92, 87–125. doi:10.1306/09040707048
Shi, S., He, J., Zhang, X., Wu, H., Yu, Z., Wang, J., et al. (2022). Fractal analysis of pore structures in transitional shale gas reservoirs in the Linxing area, Ordos Basin. Front. Earth Sci. 10, 979039. doi:10.3389/feart.2022.979039
Sing, K. (2001). The use of nitrogen adsorption for the characterisation of porous materials. Colloids Surfaces A Physicochem. Eng. Aspects 187-188, 3–9. doi:10.1016/S0927-7757(01)00612-4
Sun, M., Yua, B., Hu, Q., Chen, S., Xia, W., and Ye, R. (2016). Nanoscale pore characteristics of the lower cambrian Niutitang Formation shale: A case study from well yuke #1 in the southeast of chongqing, China. Int. J. Coal Geol. 154, 16–29. doi:10.1016/j.coal.2015.11.015
Sun, M., Zhang, L., Hu, Q., Pan, Z., Yu, B., Sun, L., et al. (2020). Multiscale connectivity characterization of marine shales in southern China by fluid intrusion, small-angle neutron scattering (SANS), and FIB-sem. Mar. Pet. Geol. 112, 104101. doi:10.1016/j.marpetgeo.2019.104101
Sun, Y. S., and Guo, S. B. (2018). Characterization of whole-aperture pore structure and its effect on methane adsorption capacity for transitional shales. Energy fuels. 32 (3), 3176–3188. doi:10.1021/acs.energyfuels.7b03807
Tian, H., Li, T., Zhang, T., and Xiao, X. (2016). Characterization of methane adsorption on overmature lower silurian-upper ordovician shales in Sichuan Basin, southwest China: Experimental results and geological implications. Int. J. Coal Geol. 156, 36–49. doi:10.1016/j.coal.2016.01.013
Tian, H., Pan, L., Xiao, X., Wilkins, R., Meng, Z., and Huang, B. (2013). A preliminary study on the pore characterization of Lower Silurian black shales in the Chuandong Thrust Fold Belt, southwestern China using low pressure N2 adsorption and FE-SEM methods. Mar. Pet. Geol. 48, 8–19. doi:10.1016/j.marpetgeo.2013.07.008
Tian, H., Pan, L., Zhang, T., Xiao, X., Meng, Z., and Huang, B. (2015). Pore characterization of organic-rich lower cambrian shales in qiannan depression of Guizhou province, southwestern China. Mar. Pet. Geol. 62, 28–43. doi:10.1016/j.marpetgeo.2015.01.004
Vishal, V., Chandra, D., Bahadur, J., Sen, D., Hazra, B., Mahanta, B., et al. (2019). Interpreting pore dimensions in gas shales using a combination of SEM imaging, small-angle neutron scattering, and low-pressure gas adsorption. Energy fuels. 33 (6), 4835–4848. doi:10.1021/acs.energyfuels.9b00442
Wang, M., Xue, H., Tian, S., Wilkins, R. W. T., and Wang, Z. (2015). Fractal characteristics of upper cretaceous lacustrine shale from the Songliao Basin, NE China. Mar. Pet. Geol. 67, 144–153. doi:10.1016/j.marpetgeo.2015.05.011
Wang, X., Jiang, Z., Shu, S., Chang, J., Zhu, L., Li, X., et al. (2019). Full-scale pore structure and fractal dimension of the Longmaxi shale from the southern Sichuan Basin: Investigations using FE-SEM, gas adsorption and mercury intrusion porosimetry. Minerals 9, 543. doi:10.3390/min9090543
Wang, X., Zhu, Y., and Wang, Y. (2020). Fractal characteristics of micro- and mesopores in the Longmaxi shale. energies 13, 1349. doi:10.3390/en13061349
Wang, Y., Zhu, Y., Liu, S., and Zhang, R. (2016). Pore characterization and its impact on methane adsorption capacity for organic-rich marine shales. Fuel 181 (10), 227–237. doi:10.1016/j.fuel.2016.04.082
Whittig, L. D. (1965). X-ray diffraction techniques for mineral identification and mineralogical composition. Methods Soil Analysis Part 1 Phys. Mineralogica Prop. Incl. Statistics Meas. Sampl. 9, 671–698.
Xi, Z., Tang, S., Li, J., Zhang, Z., and Xiao, H. (2019). Pore characterization and the controls of organic matter and quartz on pore structure: Case study of the Niutitang Formation of northern Guizhou province, south China. J. Nat. Gas. Sci. Eng. 61, 18–31. doi:10.1016/j.jngse.2018.11.001
Yang, F., Ning, Z. F., and Liu, H. Q. (2014). Fractal characteristics of shales from a shale gas reservoir in the Sichuan Basin, China. Fuel 115, 378–384. doi:10.1016/j.fuel.2013.07.040
Yin, T., Liu, D., Cai, Y., and Zhou, Y. (2019). Methane adsorption constrained by pore structure in high-rank coals using FESEM, CO2 adsorption, and NMRC techniques. Energy Sci. Eng. 00, 255–271. doi:10.1002/ese3.275
Zhang, B., Fu, X., Yu, K., Tian, F., and Deng, Z. (2022). Geochemical composition and microstructure of coal measure shale in the upper permian, western Guizhou, China: Implications for methane generation and storage. Energy fuels. 36 (17), 10143–10154. doi:10.1021/acs.energyfuels.2c01975
Zhao, J., Xu, H., Tang, D., Mathews, J. P., Li, S., and Tao, S. (2016). A comparative evaluation of coal specific surface area by CO2 and N2 adsorption and its influence on CH4 adsorption capacity at different pore sizes. Fuel 183, 420–431. doi:10.1016/j.fuel.2016.06.076
Zhao, Y., Sun, Y., Liu, S., Chen, Z., and Yuan, L. (2018). Pore structure characterization of coal by synchrotron radiation nano-CT. Fuel 215, 102–110. doi:10.1016/j.fuel.2017.11.014
Zhao, Z., Li, R., Feng, W., Yu, Q., Yang, H., and Zhu, L. (2017). Enrichment conditions and favorable zone prediction of Wufeng–Longmaxi shale gas reservoirs in the northern Yunnan–Guizhou provinces, China. Nat. Gas. Ind. 37 (12), 26–34. doi:10.3787/j.issn.1000-0976.2017.12.004
Zhou, S., Liu, D., Cai, Y., Yao, Y., and Li, Z. (2017). 3D characterization and quantitative evaluation of pore-fracture networks of two Chinese coals using FIB-SEM tomography. Int. J. Coal Geol. 174, 41–54. doi:10.1016/j.coal.2017.03.008
Zhou, S., Liu, H., Chen, H., Wang, H., Guo, W., Liu, D., et al. (2019). A comparative study of the nanopore structure characteristics of coals and Longmaxi shales in China. Energy Sci. Eng. 00, 2768–2781. doi:10.1002/ese3.458
Zhou, S., Yan, G., Xue, H., Guo, W., and Li, X. (2016). 2D and 3D nanopore characterization of gas shale in Longmaxi formation based on FIB-SEM. Mar. Pet. Geol. 73, 174–180. doi:10.1016/j.marpetgeo.2016.02.033
Zhu, H., Wei, Y., Jia, C., Jin, Y., and Yuan, H. (2018). Characteristics of nanoscale pore structure of organic-rich Longmaxi shale in northern Yunnan and Guizhou province. Complex Hydrocarb. Reserv. 11 (1), 12–17. (in Chinese with English Abstract).
Zou, C., Dong, D., Wang, Y., Li, X., Huang, J., Wang, S., et al. (2015). Shale gas in China: Characteristics, challenges and prospects (II). Petroleum Explor. Dev. 42 (6), 182–196. doi:10.1016/S1876-3804(16)30022-2
Zou, C. N., Yang, Z., He, Y. B., Wei, Y. S., Li, J., Jia, A. L., et al. (2018). Theory, Technology and prospects of conventional and unconventional natural gas. Petroleum Explor. Dev. 45, 604–618. doi:10.1016/S1876-3804(18)30066-1
Zou, C., Zhang, G., and Yang, Z. (2013). Geological concepts, characteristics, resource potential and key techniques of unconventional hydrocarbon: On unconventional petroleum geology. Pet. Expl Dev. 40 (4), 385–399. doi:10.11698/PED.2013.04.01
Nomenclature
APD average pore diameter
BET Brunauer–Emmett–Teller
BJH Barret-Joyner-Halenda
D fractal dimension
DFT density functional theory
FHH Frenkel–Halsey–Hill
FE-SEM Field emission scanning electron microscope
HPMA high-pressure methane adsorption
LT-N2GA Low-temperature N2 adsorption
LP-CO2GA Low-pressure CO2 adsorption
PV pore volume
PSD pore size distribution
SSA specific surface area
XRD X-ray diffraction
Keywords: shale gas, Wufeng-Longmaxi shale, N2 adsorption, pore structure, fractal dimension
Citation: Wang T, Tian F, Deng Z and Hu H (2023) Pore structure and fractal characteristics of Wufeng–Longmaxi formation shale in northern Yunnan–Guizhou, China. Front. Earth Sci. 10:998958. doi: 10.3389/feart.2022.998958
Received: 20 July 2022; Accepted: 26 September 2022;
Published: 06 January 2023.
Edited by:
Zheng Sun, China University of Mining and Technology, ChinaReviewed by:
Debanjan Chandra, Delft University of Technology, NetherlandsHu Li, Southwest Petroleum University, China
Copyright © 2023 Wang, Tian, Deng and Hu. This is an open-access article distributed under the terms of the Creative Commons Attribution License (CC BY). The use, distribution or reproduction in other forums is permitted, provided the original author(s) and the copyright owner(s) are credited and that the original publication in this journal is cited, in accordance with accepted academic practice. No use, distribution or reproduction is permitted which does not comply with these terms.
*Correspondence: Ze Deng, ZGVuZ3plQHBldHJvY2hpbmEuY29tLmNu; Haiyan Hu, MTA2NDA2OTMzNEBxcS5jb20=