 Jingjing Duan
 Zifeng Yu
 Bo Hu2
 Kevin K. W. Cheung
 Yubin Li
- 1Key Laboratory of Numerical Modeling for Tropical Cyclone of China Meteorological Administration, Shanghai Typhoon Institute, Shanghai, China
- 2Ningbo Meteorological Bureau of Zhejiang Province, Ningbo, China
- 3Ningbo Zhenhai Meteorological Bureau of Zhejiang Province, Ningbo, China
- 4E3-Complexity Consulting, Eastwood, NSW, Australia
- 5Key Laboratory for Aerosol-Cloud-Precipitation of China Meteorological Administration, Collaborative Innovation Center on Forecast and Evaluation of Meteorological Disasters, School of Atmospheric Physics, Nanjing University of Information Science and Technology, Nanjing, China
- 6Southern Marine Science and Engineering Guangdong Laboratory (Zhuhai), Zhuhai, China
A group of control (CTL) plus ten sensitivity numerical experiments have been conducted to investigate the sensitivity of planetary boundary layer (PBL) schemes in simulating the asymmetric precipitation distribution of typhoon Lekima (2019) during landfall. The simulated track and intensity are quite sensitive to the choice of the PBL scheme. In CTL that applies the Mellor–Yamada Nakanishi and Niino (MYNN) PBL and the surface layer scheme, the observed eyewall replacement 6 h prior to landfall and the asymmetric precipitation during landfall have been simulated well. However, in the PBL1 experiment that applies the Yonsei University (YSU) PBL scheme and the Revised Mesoscale Model version 5 (MM5) Monin–Obukhov surface layer scheme, no double eyewall is simulated. PBL1 and the other sensitivity experiments also simulate more axisymmetric precipitation distribution. PBL1 simulates intensification just before landfall, sustains intensity longer after landfall, but then dissipates quite rapidly. Such differences from CTL are due to larger enthalpy flux, higher PBL height (which is almost unchanged in CTL), and eddy diffusivity extending more into the free atmosphere in PBL1. These factors lead to outward expansion of the radius of maximum wind, larger radial inflow, larger axisymmetric tangential wind in the boundary layer, and larger updrafts in the eyewall. After landfall, larger momentum flux and larger friction velocity in PBL1 enable the more rapid dissipation. The intensification before landfall in PBL1 makes the axisymmetric component stronger. Asymmetry developed in the outer eyewall, and PBL1 was less successful in simulating the eyewall replacement that affects the degree of rainfall asymmetry. These results indicate that the model PBL schemes largely influence the simulated tropical cyclone (TC) intensity and structure including asymmetric rainfall distribution during landfall.
1 Introduction
China experiences the most landfalling tropical cyclones (TCs) in the world, with an average of seven to eight such events per year (Zhang et al., 2011). Most TC damage occurs during the landfall. Strong wind, torrential rain, and storm surges caused by TCs may lead to heavy casualties and property damages. Despite the considerably improved accuracy of TC track forecasts over the last decades (Emanuel, 2000; DeMaria et al., 2007), the accuracy of precipitation forecasts during TC landfalls remains low (Yu et al., 2013, 2020). When the 24 h accumulated precipitation reaches 100 mm, the equitable threat score for the current operational numerical model forecasts is approximately 0.2, while the precipitation is 250 mm or higher, the score drops below 0.1 or even lower (Yu et al., 2020).
With the rapid advancement of modern weather observing systems such as satellites and radars (Yu et al., 2009), the analysis of precipitation distribution characteristics in TCs has greatly improved. Environmental vertical wind shear (VWS) is regarded as a crucial factor affecting the precipitation distribution in TCs over the ocean (Lonfat et al., 2004; Chen et al., 2006; Reasor et al., 2013). When VWS is greater than 5 m s−1, the asymmetry of precipitation distribution in TCs is noticeable (Chen et al., 2006). Such asymmetry is more noticeable in an environment with strong westerly wind shear than one with strong easterly wind shear (Wingo and Cecil, 2010). These observational results indicate that the radial precipitation differences in a TC are predominantly dependent on the intensity of TC itself, whereas the azimuthal precipitation differences are mainly affected by VWS (Hence and Houze, 2012). The asymmetric precipitation distribution is attributable to the asymmetric vertical air motion, specifically the relative updraft and downdraft in downshear and upshear locations, respectively. The convective precipitation mainly occurs in the downshear-right quadrant in the eyewall region (Hence and Houze, 2011), and thus heavy precipitation generally concentrates in the downshear-left quadrant when advected by the TC cyclonic circulation (Hence and Houze, 2011; Yu et al., 2017).
Compared with TCs over the ocean, landfalling TCs exhibit a complex precipitation process (Ren and Xiang 2017). The large-scale environmental field, TC intensity, land–sea contrast, forcing of complex underlying surfaces such as water body and topography, and mesoscale convective activities all can cause TC structural change substantially, resulting in the asymmetric distribution of precipitation (Chan and Liang 2003; Chen and Yau 2003; Yu et al., 2010; Li et al., 2014, Li et al., 2015; Yu et al., 2022). Based on satellite precipitation estimates, the asymmetric distribution of TC precipitation (wavenumber-1) is mostly associated with VWS, whereas the axisymmetric distribution of precipitation (wavenumber-0) is closely related to the intensity of TC. When the environmental VWS is less than 5 m s−1, heavy rain often concentrates on the onshore side (Yu et al., 2017). Nevertheless, under internal vortex dynamics (i.e., no environmental factor for asymmetry such as vertical wind shear) rainfall maximum over the offshore side is also possible (Li et al., 2014, Li et al., 2015).
In addition, high-resolution numerical models have been used to investigate precipitation processes in TCs. Tao et al. (2011) compared the effects of microphysical and planetary boundary layer (PBL) parameterization schemes through a high-resolution numerical simulation of extreme precipitation of TC Morakot (2009) and found that forecasts were more sensitive to microphysical schemes than to PBL schemes. However, some studies applying numerical simulations have concluded equal importance of PBL and cloud microphysical schemes in TC precipitation simulations (Li and Pu, 2008). Some other studies have revealed the importance of PBL parameterization in the numerical simulations of TCs (Davis and Bosart, 2002; Li and Pu, 2008; Hill and Lackmann, 2009). For example, the simulation performance for the track and intensity of TCs depends on whether PBL parameterization is used, and performances in terms of the structure, intensity change, and track of TCs differ with various PBL parameterization schemes. Xu et al. (2017) selected a variety of microphysical and boundary layer schemes to simulate nine typhoons affecting Zhejiang province. They found that typhoon track and intensity closer to the observations were simulated with the MYNN2 and Boulac boundary layer schemes, and the Boulac scheme was also better for precipitation simulation. Wang and Zhao (2020) used seven boundary layer parameterization schemes in the WRF model to simulate typhoon Meranti (2016). It was found that the PBL schemes had a significant influence on the TC track and intensity in the weakening phase of landfall, accompanied by significantly different latent heat flux and sensible heat flux in the surface layer.
TC Lekima (2019) was a super typhoon when it made the landfall and became the third most intense landfall typhoon in the Zhejiang province of China according to China meteorological records. Many recent studies have investigated typhoon Lekima. Shi et al. (2020) and Shi and Chen (2021) studied the rapid intensification (RI) of typhoon Lekima, focusing on its kinetic energy and double warm-core structure during the RI period. Xu and Liang (2021) identified an eyewall replacement in typhoon Lekima on 8 August and 9 August over the ocean. Xiang et al. (2021) found that before typhoon Lekima made the landfall, there was an obvious concentric eyewall structure. The extreme rainfall distribution prior to, during, and post-landfall associated with typhoon Lekima presented significant features of asymmetry. Dai et al. (2021) used radar observations to show the substantial contribution of vortex Rossby waves to the asymmetric structure of the typhoon’s outer eyewall. He et al. (2021) examined the operational rainfall forecast errors in the different stages of typhoon Lekima after landfall. They concluded that the asymmetric rainfall distribution of Lekima can hardly be predicted, resulting in weak or even totally missed rainfall forecasts in northern Zhejiang. This study aims to discuss the influence of different PBL schemes on the asymmetric precipitation distribution of typhoon Lekima (2019) prior to and during landfall by using multiple sources of observation and high-resolution numerical simulation.
2 Data and methods
Intensities and locations of typhoon Lekima were extracted from the 3-hourly best track data officially released by the Shanghai Typhoon Institute of China Meteorological Administration (Ying et al., 2014). The hourly Global Precipitation Measurement (GPM) precipitation data with a spatial resolution of 0.1° was obtained from the National Aeronautics and Space Administration (NASA) (https://pmm.nasa.gov/data-access) were used in this study. The structure associated with typhoon Lekima was examined by using the brightness temperature from Feng-Yuan FY-3B polar orbit satellite’s Micro Wave Radiation Imager (MWRI) 89-GHz channel vertical and horizontal polarization detection (http://satellite.nsmc.org.cn), and the 6-minute radar reflectivity from the S-band Doppler radar at Wenzhou, Zhejiang Province, China.
Numerical experiments (one control and ten sensitivity tests) were conducted with the Advanced Research Weather Research and Forecasting (WRF) model Version 4.1. These simulations all had three two-way interactive, nested domains with horizontal resolutions of 27, 9, and 3 km, and grid numbers of 211 × 241, 355 × 355, and 319 × 319, respectively. The innermost domain was designed to move with the typhoon center. Thirty-four vertical levels were set with a top at 50 hPa. The initial and lateral boundary conditions were from the (0.5° × 0.5°) Global Forecast System of National Center for Environmental Prediction (https://nomads.ncep.noaa.gov/). The Kain–Fritch convective scheme (Kain and Fritch 1993) was used in the outermost (27 km) domain, but without convective parameterization for the other two domains. The Lin microphysical scheme (Lin et al., 1983), Dudhia shortwave scheme (Dudhia 1989), and Rapid Radiative Transfer Model (RRTM) longwave parameterization (Mlawer et al., 1997) were used in the three domains.
To investigate the possible effects of different boundary layer schemes on the typhoon asymmetric precipitation simulation during landfall, the MYNN 2.5 level turbulent kinetic energy (TKE) PBL scheme was used in the control (CTL) run. In addition, ten sensitivity experiments (PBL1 to PBL10) are successively carried out by using the other ten PBL schemes (Table 1). Here, YSU (Hong et al., 2006), Asymmetrical Convective Model version 2 (ACM2) (Pleim, 2007), Bougeault and Lacarrere (BouLac) (Bougeault and Lacarrere, 1989), University Washington (UW) Moist Turbulence (Bretherton and Park, 2009), Shin-Hong “scale-aware” (SH) (Shin and Hong, 2011), and Grenier-Bretherton-McCaa (GBM) schemes (Grenier and Bretherton, 2001) were coupled with the Revised MM5 Monin–Obukhov surface layer scheme (Jimenez et al., 2012). Mellor-Yamada-Janjic (MYJ) (Janjić, 1994) scheme was coupled with the Monin–Obukhov surface layer scheme (Janjic, 1994). The quasi-normal scale (QNSE) (Sukoriansky et al., 2005) scheme was coupled with the QNSE surface layer scheme (Sukoriansky et al., 2005), while MYNN2.5 and MYNN third (MYNN3)-level TKE PBL schemes (Nakanishi and Niino, 2006; Nakanishi and Niino, 2009) were coupled with the MYNN surface layer scheme (Nakanishi and Niino, 2006) and the total energy mass flux (TEMF) (Angevine et al., 2010) scheme used the TEMF surface layer scheme (Angevine et al., 2010). The numerical simulations cover an 84 h period from 00:00 UTC on 8 August to 12:00 UTC on 11 August 2019.
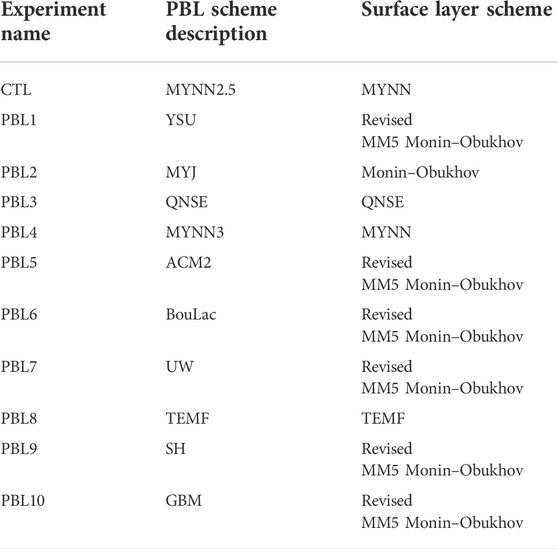
TABLE 1. Numerical experiment design.
3 Overview of typhoon lekima
Typhoon Lekima (2019) formed over the north-western Pacific at 09:00 UTC on 4 August 2019. It reached its maximum wind speed (MWS) of 62 m s−1 and minimum central sea level pressure (MSLP) of 915 hPa at 15:00 UTC on August 8. At 17:45 UTC on August 9, Lekima made landfall in Wenling city of Zhejiang province of China, with MWS of 52 m s−1 and MSLP of 930 hPa. After landing, MWS further rapidly decreased to 23 m s−1. At about 13:00 UTC on August 10, Lekima made a northward deflection (Huang et al., 2022) and moved further into Jiangsu province, with its intensity further weakening (Figure 1).
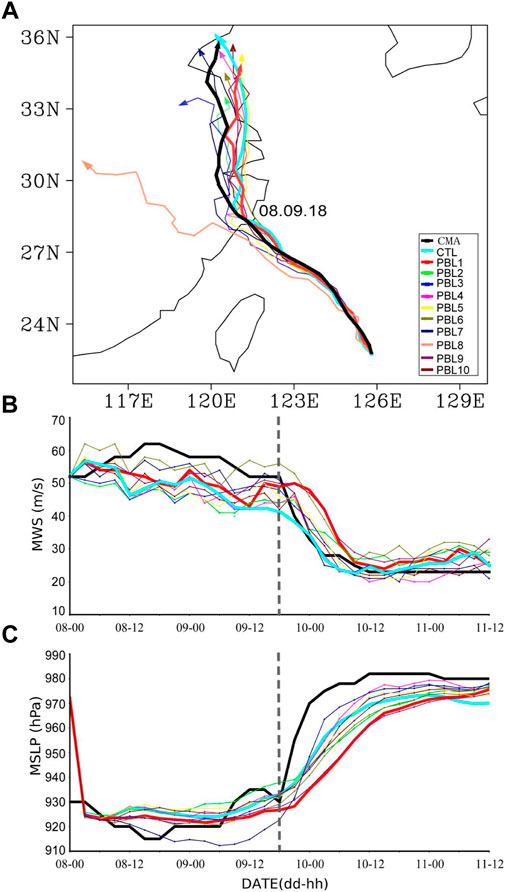
FIGURE 1. Observed and simulated (A) tracks, (B) MWS (unit: m/s), and (C) MSLP (unit: hPa) of typhoon Lekima. Dotted line denotes the observed landing time.
Figure 2 shows GPM 6 h accumulated precipitation and the 200–850-hPa VWS just before and after the landfall. As early as 6-7 August, typhoon Lekima underwent a rapid intensification under an environment with easterly VWS and rainfall asymmetry emerged (Huang et al., 2021). From 8 August, rainfall was clearly distributed asymmetrically, with heavy rainfall located on the downshear side at 18:00 UTC on 8 August (Figure 2A). VWS showed a counterclockwise rotation and its magnitude decreased during the landfall (Figures 2A–C). At 06:00 UTC on 9 August, the heavy precipitation region was located on the right of shear (Figure 2B). Six hours later, the heavy precipitation was distributed mainly on the left of shear (Figure 2C). At 12:00 UTC on 9 August, the shear was orientated toward the northeast while the maximum rainfall occurred on the left of shear in the coastal area (Figure 2D). VWS continued decreasing to 2.6 m s−1. During and after the landfall (Figures 2E,F), VWS remained low and further rotated counterclockwise. However, the asymmetric rainfall maximum did not rotate and is still on the downshear and offshore side.
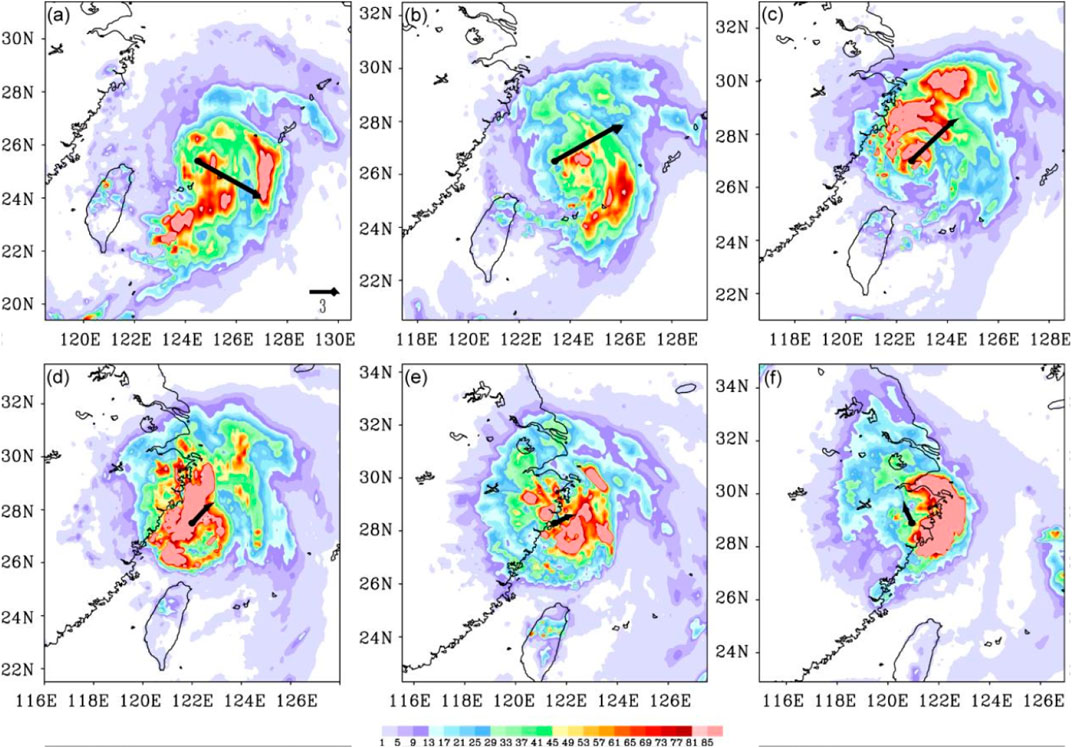
FIGURE 2. Six-hour accumulated precipitation of GPM (unit: mm) at (A) 18:00 UTC on 8 August 2019, (B) 00:00 UTC on 9 August 2019, (C) 06:00 UTC on 9 August 2019, (D) 12:00 UTC on 9 August 2019, (E) 18:00 UTC on 9 August 2019, and (F) 00:00 UTC on 10 August 2019. The black arrow denotes VWS between 200 and 850 hPa (reference magnitude in a), with black dots indicating the center of typhoon.
According to the radar observation (Figures 3A,B), concentric eyewalls developed before the landfall, accompanied by an eyewall replacement, which is also identified by the satellite TBB analysis (Figures 3C,D). It can be seen that along the shear at these times, the major convection in the second concentric eyewall as well as the outer spiral rainbands concentrated on the north/northwest side of the typhoon center, which has seriously impacted the coastal areas of Zhejiang (He et al., 2021; Ao et al., 2022).
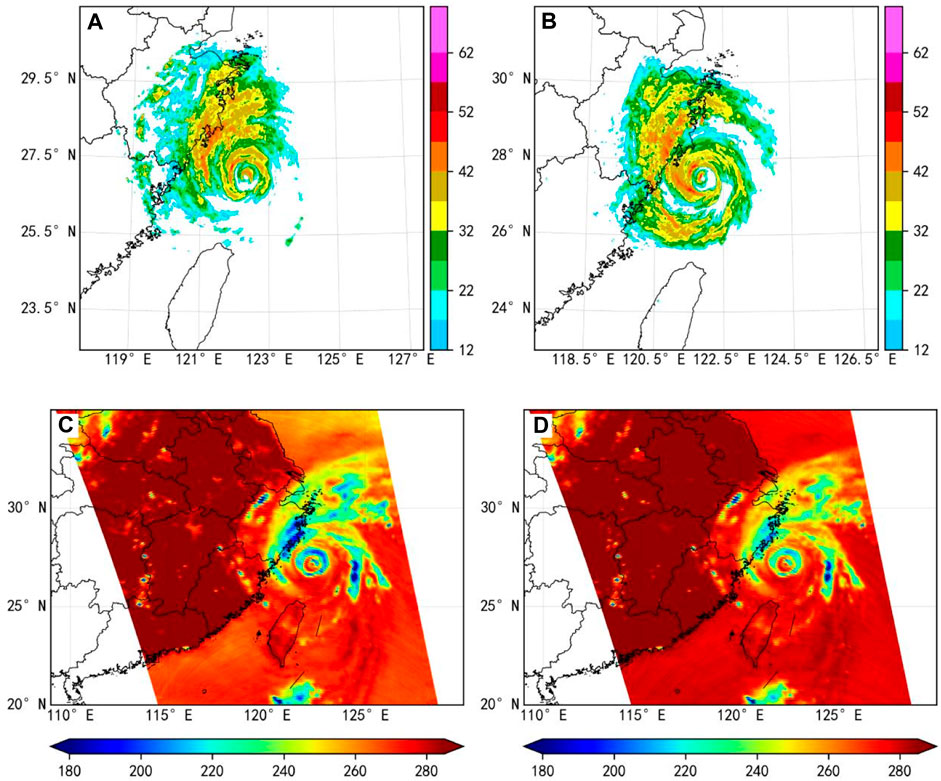
FIGURE 3. Horizontal distribution of reflectivity (unit: dBz) at 0.5° elevation at (A) 06:00, (B) 12:00 UTC on 9 August 2019. FY-3B polar orbit satellite MWRI 89 GHz channel (C) vertical and (D) horizontal polarization detection brightness temperature (unit: K) at 15:00 on 9 August.
4 Analysis of simulation results
4.1 Tracks and intensities
Figure 1 shows that the tracks of typhoon Lekima simulated by CTL and the sensitivity experiments are relatively consistent with each other before 06:00 UTC on 9 August (Figure 1A). After that, the different influences of subgrid-scale turbulence under the PBL parameterization schemes, together with their interaction with the free atmosphere, on the typhoon motion gradually accumulated. Since 06:00 UTC on 9 August, the divergence of typhoon tracks gradually increase which is apparent by the time of the landfall. As the track simulated by PBL8 differs greatly from the observation, only the results from CTL and other nine sensitivity experiments are analyzed here. The simulated landfall locations by CTL, PBL1, PBL2, PBL4, PBL9, and PBL10 are relatively close to the observation. The landing locations in PBL3, PBL5, and PBL7 are more southward, while those in PBL6 are more northward. At the moment of the typhoon landfall, the maximum distance error is 110.5 km in PBL3, while the minimum is 17.8 km in CTL.
After the landfall, the track errors in simulations are more evident, which shows that the track over land is also sensitive to the PBL parameterization scheme. The typhoon makes landfall at 18:00 UTC on 9 August in CTL that is close to the observation. It is to be noted that in PBL1, PBL4, PBL5, PBL6, PBL7, and PBL10, the typhoon makes landfall at 21:00 UTC on 9 August which is 3 h later the observation, while the landfall time in the other four experiments is about 6 h later than that observed.
All the numerical simulations capture quite well the variation trends of MWS and MSLP (Figures 1B,C). The maximum 10-m wind speed is used to define MWS in the simulations. The exception is MWS and MSLP simulated by PBL8 that reaches 132 m s−1 and 676 hPa, which is thus not shown in the figure. The tangential wind speed of the local scheme UW is much larger than the other schemes, and the larger tangential wind continues to strengthen the energy of the typhoon, so the intensity of the typhoon simulated by PBL8 is too strong. Moreover, the low-level convergence and high-level divergence of typhoon simulated by PBL8 are the most significant, and vertical ascent velocities is the largest, so typhoon intensity is stronger than those of other experiments. We noticed that although MWS in the PBL1 experiment is quite close to the observation during the landfall, the simulated typhoon intensifies by about 8 m s−1 from 12:00 UTC to 21:00 UTC on 9 August just before the landfall time in the experiment, while the observed MWS was almost unchanged. In addition, the intensity of typhoon in PBL1 slowly intensify after the landfall and maintains an MWS of about 50 m s−1 6 h after the landfall. In general, the simulated track and intensity in CTL are the closest to the observation although this experiment underestimates the intensity before the landfall.
4.2 Typhoon precipitation
The 6-h accumulated precipitation processes just before and after landfall in the CTL experiment are shown in Figure 4. The simulated precipitation distribution is close to that observed (Figures 4A–C). At 12:00 UTC on 9 August just before the landfall over Zhejiang, VWS in both simulation and observation are orientated toward the northeast. However, VWS has weakened to 2.6 m s−1 in the observation, while it is maintained at about 6.2 m s−1 in the simulation (Figure 4D). During the landfall, VWS remains at 6.3 m s−1 in CTL (Figure 4E) but further decreases to 1.4 m s−1 in the observation. In addition, unlike observation, VWS in CTL remains orientated toward the northeast after landfall with a magnitude of about 4.3 m s−1 Figure 4F). In other words, while the simulated VWS is too strong in CTL, the asymmetric distribution of rainfall maximum agrees well with the observation.
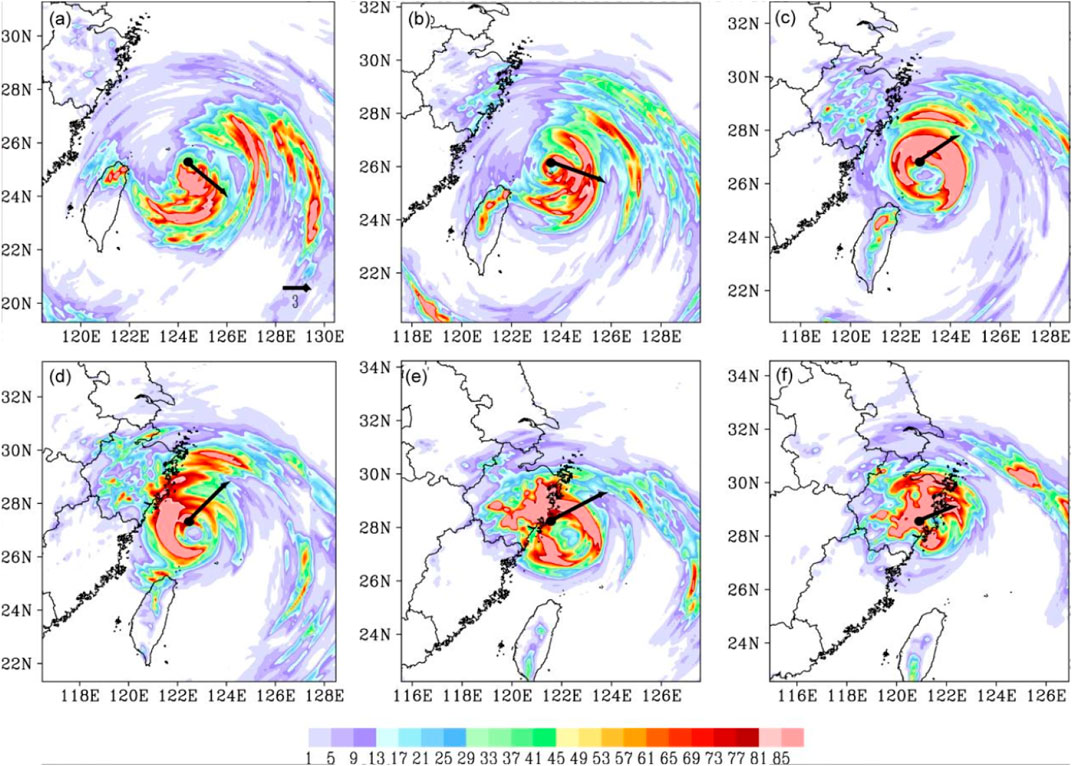
FIGURE 4. Simulated 6-h accumulated precipitation (unit: mm) at (A) 18:00 UTC on 8 August, (B) 00:00 UTC on 9 August, (C) 06:00 UTC on 9 August, (D) 12:00 UTC on 9 August, (E) 18:00 UTC on 9 August, and (F) 00:00 UTC on 10 August 2019 in the CTL experiment. The black arrow denotes VWS between 200 and 850 hPa, with black dots indicating the center of typhoon.
Figure 5 shows the distribution of 6 h accumulated precipitation simulated by the ten sensitivity experiments during the typhoon landfall. The precipitation area simulated by PBL8 (Figure 5H) is much larger than that observed and the other nine sensitivity experiments (Figure 2E, Figures 5A–G, I–J), presenting a more axisymmetrical distribution. The latent heat flux simulated by PBL8 is much larger than that simulated by other experiments, and the simulated typhoon intensity and precipitation are the largest. In addition, the landfall time in PBL8 is 9 h earlier than the observation. It can also be seen that generally the precipitation distributions simulated in the sensitivity experiments all display remarkable axisymmetry, which differs largely from the observation.
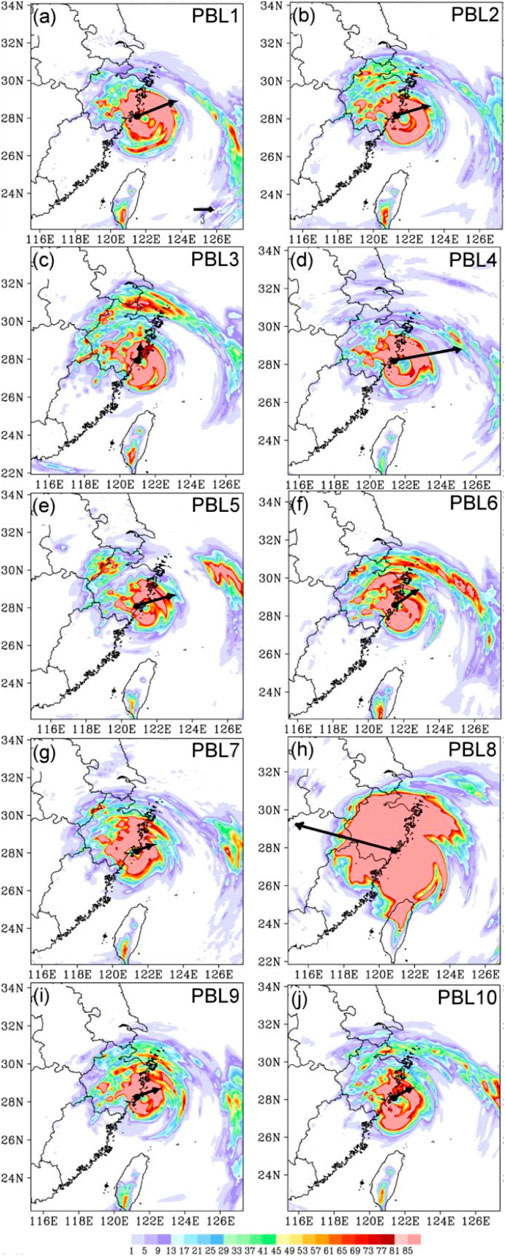
FIGURE 5. Simulated 6-h accumulated precipitation (unit: mm) at the TC landfall time in experiment (A) PBL1, (B) PBL2, (C) PBL3, (D) PBL4, (E) PBL5, (F) PBL6, (G) PBL7, (H) PBL8, (I) PBL9, and (J) PBL10. The black arrow denotes the VWS between 200 and 850 hPa, with black dots indicating the center of typhoon.
The sensitivity experiment PBL1 adopts the YSU boundary layer scheme, which is a common scheme in typhoon simulation (Kepert, 2012). The 6 h accumulated precipitation processes just before and after landfall in PBL1 experiments are further compared (Figure 6). Before 06:00 UTC on 9 August, rainfall distribution in PBL is similar to the CTL experiment, showing an asymmetric distribution (Figures 6A–C). After that, the distribution of precipitation in CTL maintains asymmetry until the typhoon makes landfall (Figures 5D–F). Compared to CTL, the precipitation in PBL1 turned more symmetric even after the landfall (Figures 6D–F).
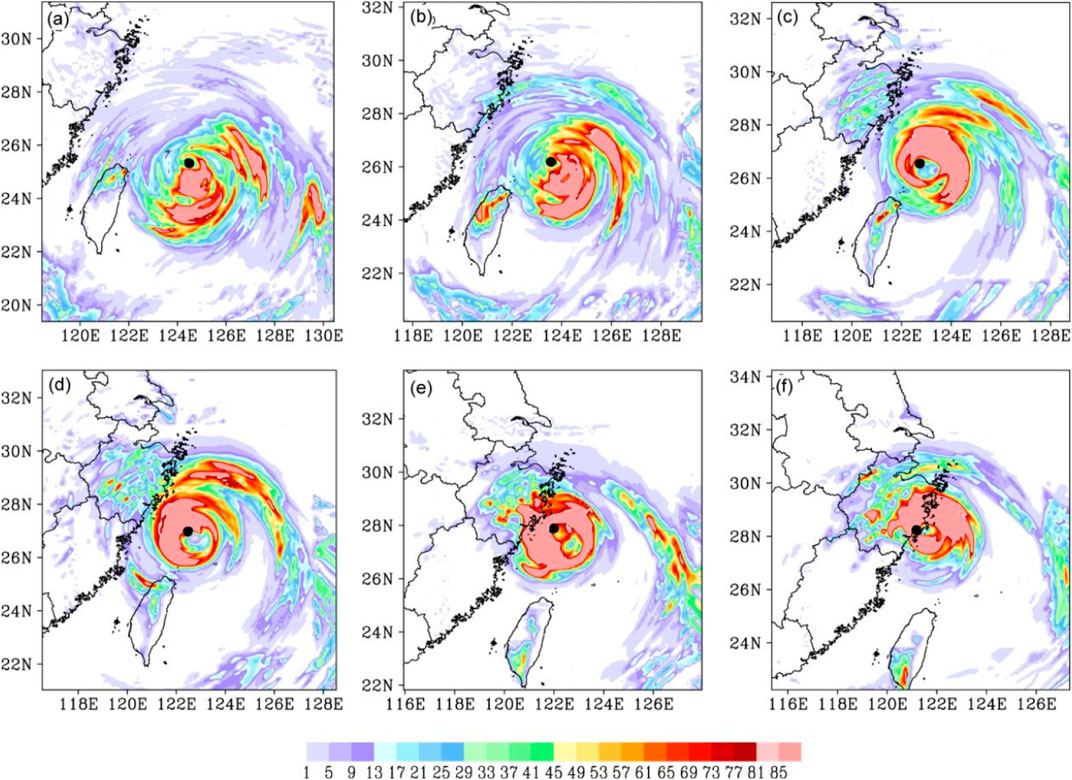
FIGURE 6. Simulated 6 h accumulated precipitation (unit: mm) at (A) 18:00 UTC on 8 August, (B) 00:00 UTC on 9 August, (C) 06:00 UTC on 9 August, (D) 12:00 UTC on 9 August, (E) 18:00 UTC on 9 August, and (F) 00:00 UTC on 10 August 2019 in the PBL1 experiment. The black dots indicating the center of typhoon.
4.3 Further analysis of the CTL and PBL1 experiments
4.3.1 Typhoon structure
Figure 7 shows the distributions of azimuthally averaged tangential wind and radial wind near the top of the boundary layer simulated by CTL and PBL1. In CTL, the average tangential wind reaches 60 m s−1 before 09:00 UTC on 8 August, which then weakens to about 55 m s−1 and remains 30–60 km from the typhoon center. A double-eyewall structure appears from 06:00 UTC on 9 August (Figures 7A, 8A,C), which has been observed (Figure 3; Xu and Liang 2021; Dai et al., 2021). The outer eyewall is 70–100 km from the typhoon center, with a wind speed of about 55 m s−1 (Figures 7A, 8C). At about 12:00 UTC on 9 August, the inner eyewall is replaced by the outer one. After landfall, the eyewall convection begins to weaken (Figure 7A). On the other hand, the maximum average tangential wind in PBL1 maintains at 60 m s−1 until about 15:00 UTC on 8 August and then weakens to 55 m s−1, and resides stably about 30–60 km from the typhoon center (Figure 7B). At 06:00 UTC on 9 August, the eyewall had already expanded outward to 60–90 km from the typhoon center (Figure 8D), and after 6 h, the average tangential wind strengthens to 60 m s−1 and begins to shrink inward. The simulated typhoon makes landfall at around 21:00 UTC on 9 August, during which the eyewall contracts to about 40–60 km from the typhoon center (Figure 7B). In summary, the major difference between the two experiments is that there is no double eyewall and eyewall replacement simulated in PBL1, however, the single eyewall goes through the process of expansion, strengthening, contraction, and weakening after the landfall (Figures 7B, 8B,D,F).
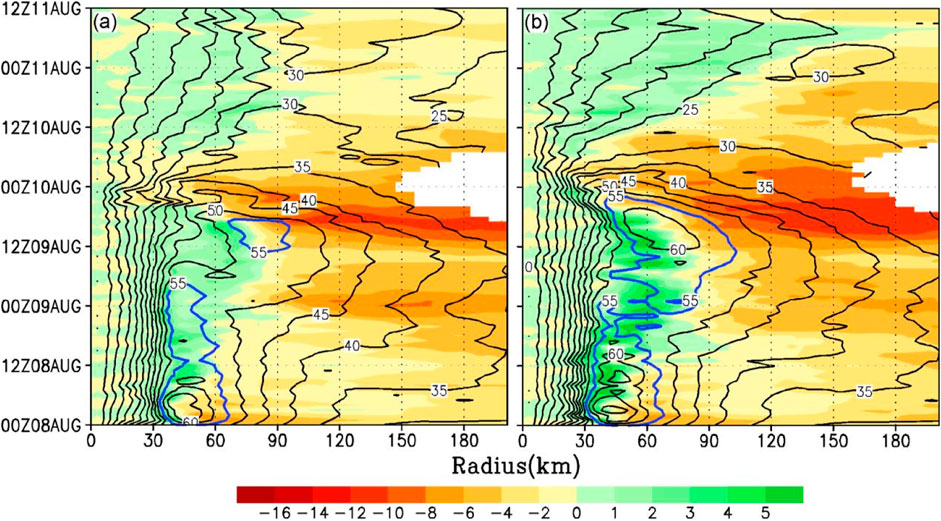
FIGURE 7. Radius–time evolution of the azimuthal-mean radial wind (shaded, unit: m s−1) and tangential wind (contour, unit: m s−1) at 1 km altitude in the (A) CTL and (B) PBL1 experiment. The white areas denote missing data.
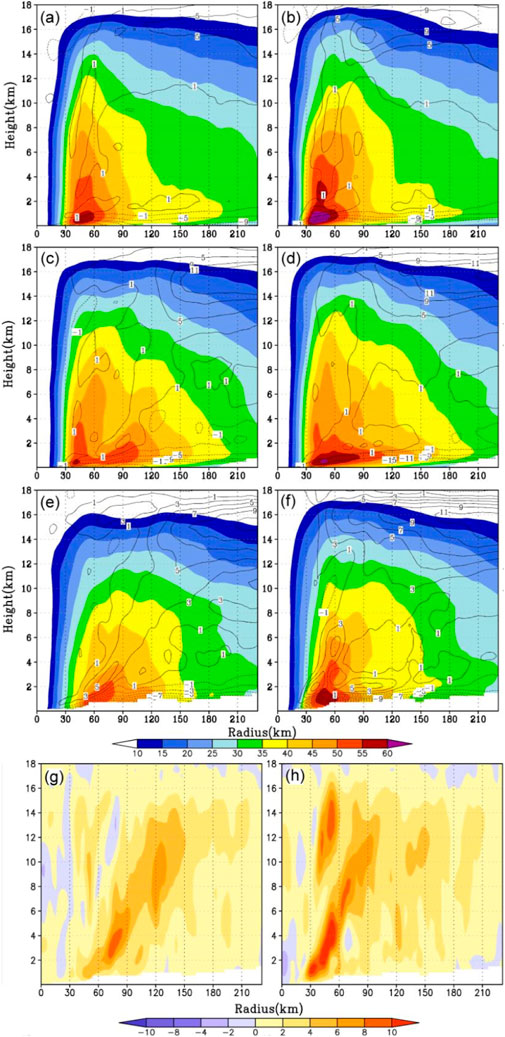
FIGURE 8. Radius–height distribution of the azimuthal-mean tangential wind (shaded, unit: m s−1) and radial wind (contour, unit: m s−1) at (A,B) 12:00 UTC on 8 August 2019, (C,D) 06:00 UTC on 9 August 2019, and (E,F) at the landing time in the (A,C,E) CTL and (B,D,F) PBL1 experiment. (G,H) as in (E,F) but for vertical velocity (shaded, unit: 10–1 m s−1).
Focusing on the secondary circulation, the maximum inflow in CTL is about 60 km away from the typhoon center and begins to weaken from 03:00 UTC on 8 August. With the inflow (beyond 100 km from the typhoon center) beginning to strengthen, the outer eyewall appears. During the typhoon making the landfall, the maximum inflow reaches 10 m s−1 (Figure 7A). In PBL1, the maximum inflow is also located on the outer side of the eyewall and begins to decrease. When the inflow beyond 100 km strengthens, the eyewall expands outward to 60–90 km from the typhoon center. After that, the inflow further strengthens, reaching 12 m s−1 during the landfall. During landfall, the inflow simulated in PBL1 is larger than that in CTL (Figure 7B).
At the moment of landfall, the azimuthally average tangential wind in the lower layer increases with height and reaches the maximum near the top of the boundary layer (Figures 8E,F). After that, the wind speed further decreased with the increase in height. The maximum tangential wind in PBL1 is slightly larger than that in CTL (60 m s−1 vs. 55 m s−1), and the location is also closer to the typhoon center (40–60 km vs. 50–80 km). In addition, the maximum tangential wind in the PBL1 over 50 m s−1 extends to a height as high as 4 km, while that in CTL is below 2 km. In both experiments, the maximum outflow near the eyewall is about 5 m s−1. It can be seen that the outflow in PBL1 is much stronger and tilted outward, and thus strong outflow speed extends outside 90 km from the center.
During the landfall, the eyewall in both CTL and PBL1 tilts outward (Figures 8G,H). The maximum vertical velocity in CTL (about 9 × 10⁻¹ m s−1) appears at the height of 2–4 km around 60–90 km from the typhoon center. However, in PBL1, the eye size is smaller about 30–60 km from the typhoon center, a nd the maximum vertical speed exceeding 10 × 10−1 m s−1 extends up to a height of 6 km.
4.3.2 Thermodynamic and water vapor factors
Figures 9A,B show the time evolution of diabatic heating within a radius of 200 km from the typhoon center for the two experiments CTL and PBL1. When typhoon Lekima reaches its maximum intensity, the diabatic heating is also the highest that is located at the height of 8 km. In CTL, the diabatic heating decreases when the double-eyewall structure appears, however, it increases again during the period from the replacement of the eyewall to the landfall time. It is obvious that the diabatic heating in PBL1 changes intermittently, similar to that in CTL. However, the diabatic heating in PBL1 is higher than that in CTL during the landfall (Figures 9C,D), which indicates enhanced convection and is consistent with the intensification right before landfall in this experiment (Figure 1).
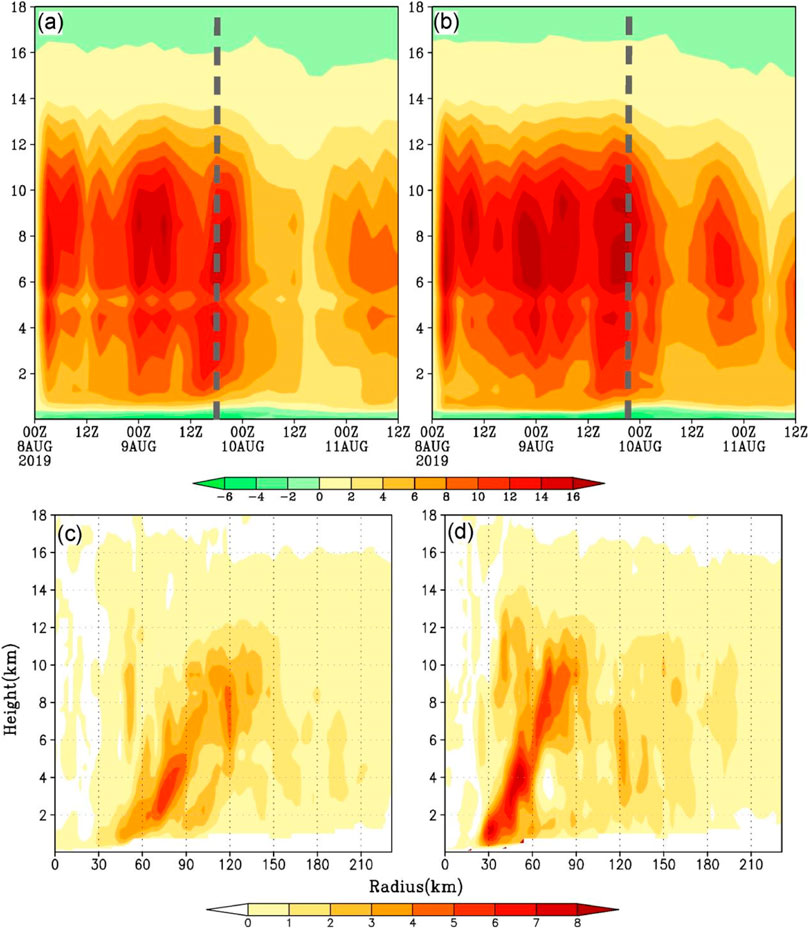
FIGURE 9. Time evolution of the vertical distribution of the azimuthal-mean diabatic heating (shaded, unit: K s−1) averaged within 200 km from the typhoon center in (A) CTL and (B) PBL1. Radius–height distribution of the azimuthal-mean diabatic heating (shaded, unit: K s−1) at the landing time in (C) CTL and (D) PBL1. The grey dotted line indicates the landing time.
During the landfall, the water vapor flux in CTL is mainly in the northwest and southeast quadrant of the typhoon, with maximum up to 12 × 10−4 kg m−2 s−1 (Figure 10A). The water vapor flux in the coastal area north of Zhejiang is also relatively larger, which is generally above 8 × 10⁻⁴ kg m−2 s−1. It is indicated that the outer spiral rainbands concentrated on the north side of the typhoon center simulated in CTL agree well with the observation (Figure 3; Ao et al., 2022; He et al., 2021). While in PBL1, the water vapor flux is axisymmetrically distributed. Although the landing location is close to that in CTL, the water vapor flux in the coastal area north of Zhejiang is relatively smaller (Figure 10B).
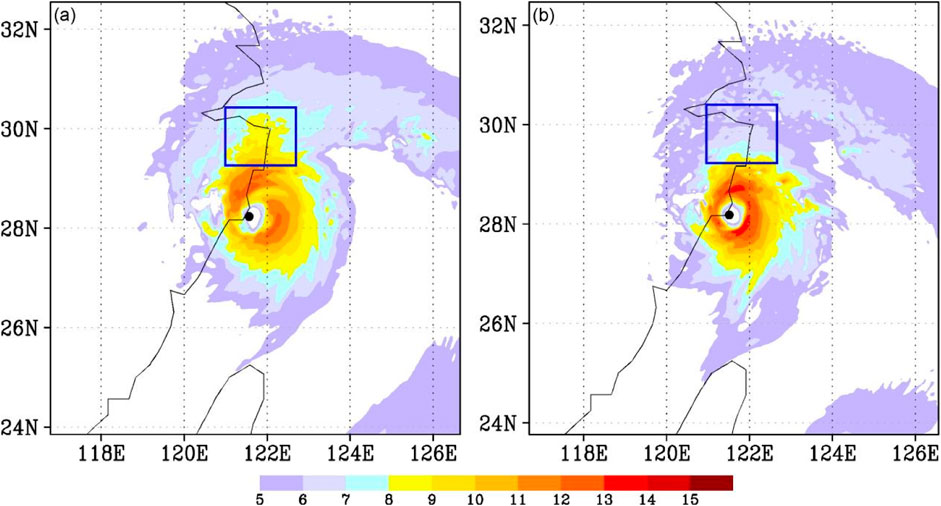
FIGURE 10. 850 hPa water vapor flux (shaded, unit: 10 g hPa−1 cm−1 s−1) at the landing time in (A) CTL and (B) PBL1. Black dots indicate the center of typhoon. The blue box represents the coastal area north of Zhejiang.
4.3.3 Surface layer fluxes
Surface latent and sensible heat fluxes are the sources of energy for TC intensification and are the primary physical processes in the boundary layer (Li and Chen, 2005). Surface momentum flux, on the other hand, is the sink of energy for TC to weaken. Since the magnitude of sensible heat flux is much smaller than latent heat flux, surface sensible heat flux distribution is not analyzed here. Figures 11, 12 show the surface latent heat and momentum fluxes from 12:00 UTC on 9 August to 00:00 UTC on 10 August 2019. It can be seen that the Revised MM5 Monin–Obukhov surface layer scheme used in the PBL1 experiment tends to generate larger latent heat and momentum fluxes than CTL using the MYNN surface layer scheme, especially southeast of the typhoon center. The higher latent heat flux in PBL1 is conducive to intensification near landfall and sustaining the intensity longer after landfall, which has not been simulated in CTL. On the contrary, it can be seen that the momentum flux in PBL1 over land is also larger than that in CTL. Such larger momentum flux enables rapid dissipation on 10 August.
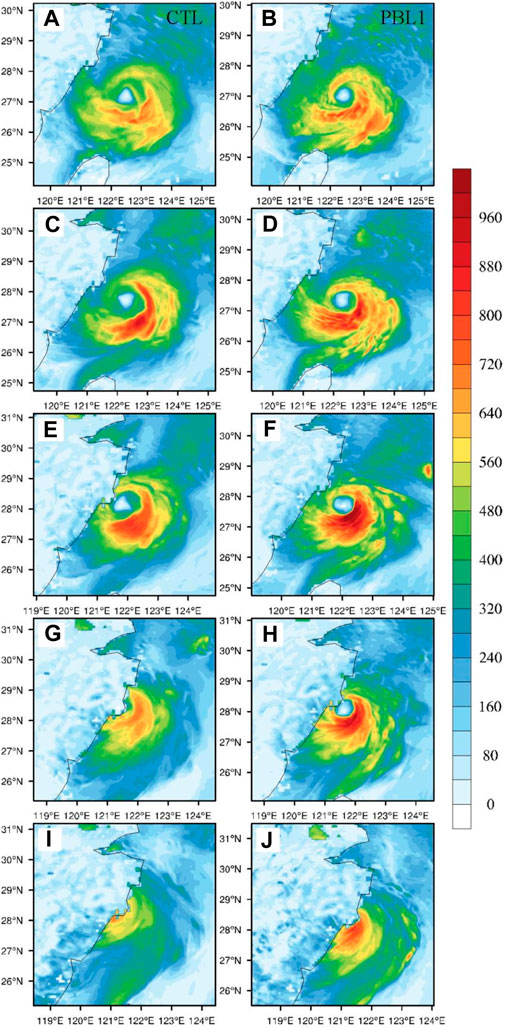
FIGURE 11. Surface latent heat flux (unit: W m−2) during 12:00 UTC on 9 August 2019 to 00:00 UTC on 10 August 2019 from (A,C,E,G,I) CTL, and (B,D,F,H,J) PBL1, at (A,B) 12:00 UTC on 9 August, (C,D) 15:00 UTC on 9 August, (E,F) 18:00 UTC on 9 August, (G,H) 21:00 UTC on 9 August, and (I,J) 00:00 UTC on 10 August 2019.
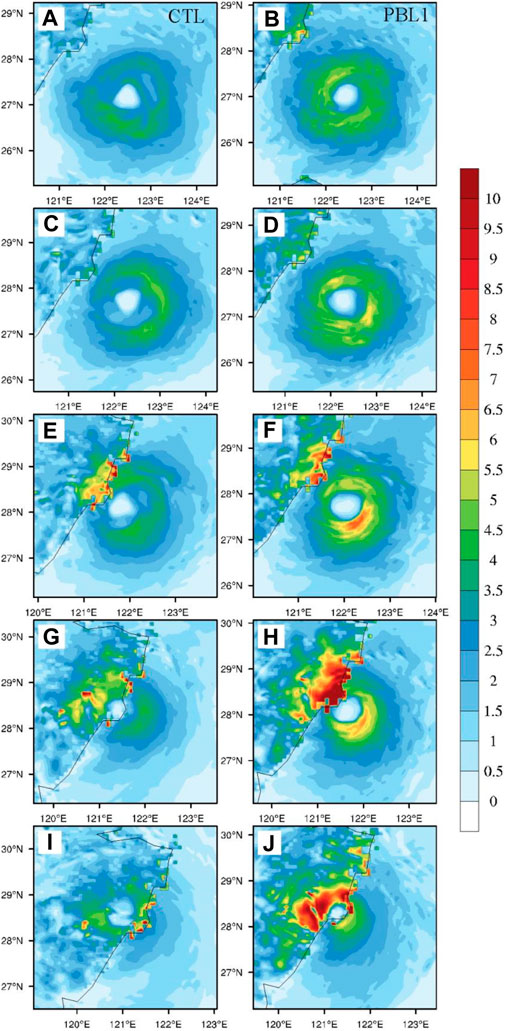
FIGURE 12. Surface momentum flux [unit:kg/(m s2)].during 12:00 UTC on 9 August 2019 to 00:00 UTC on 10 August 2019 from (A,C,E,G,I) CTL, and (B,D,F,H,J) PBL1, at (A,B) 12:00 UTC on 9 August, (C,D) 15:00 UTC on 9 August, (E,F) 18:00 UTC on 9 August, (G,H) 21:00 UTC on 9 August, and (I,J) 00:00 UTC on 10 August 2019.
Figure 13A shows the time evolution of surface latent flux within a radius of 200 km centered on the typhoon in the CTL and PBL1 experiments, where a positive value indicates that the surface flux is upward. In the first 3 h of the simulation, the latent heat flux increases significantly. From then until the typhoon makes landfall, although the simulated latent flux varies with different PBL schemes, they all maintain relatively large values. After the typhoon landfall, the latent flux decreases significantly. The latent heat flux is positive over both sea and land. The values of latent heat in PBL1 are larger than those in CTL, which is consistent with the simulated intensity (Figure 1). Also, the Revised MM5 Monin–Obukhov in PBL1 promotes a faster intensification rate before landfall, and produced the largest momentum flux (3.06 kg m−1 s−2) at 21:00 UTC on 9 August, followed by the MYNN2.5 (2.32 kg m−1 s−2) at 18:00 UTC on 9 August in CTL (Figure 13B). After the typhoon makes landfall, the momentum flux decreases substantially.
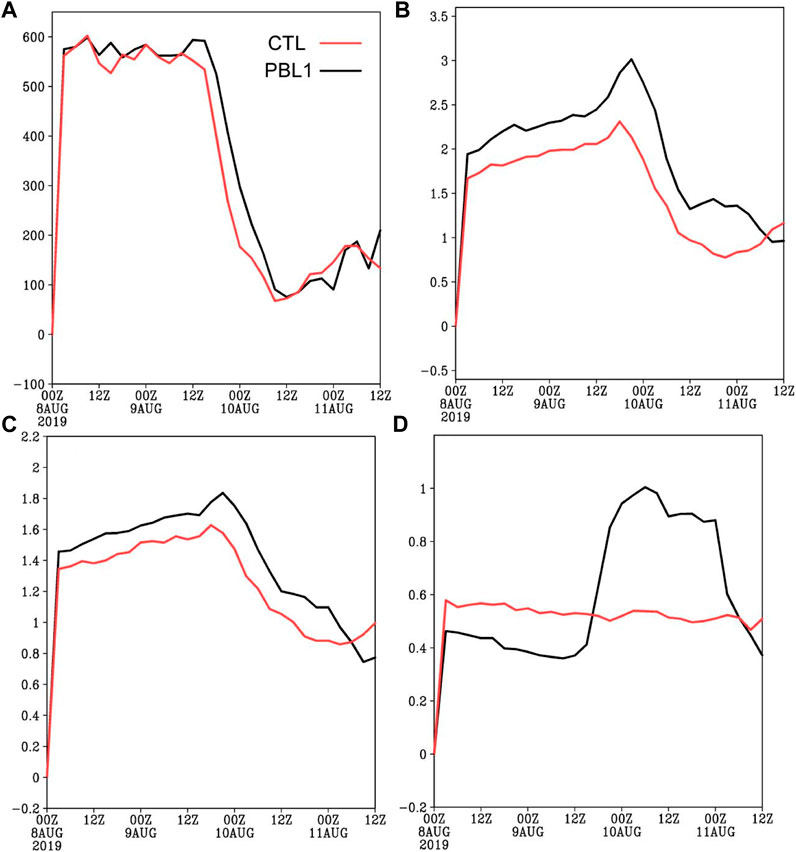
FIGURE 13. Time series of (A) surface latent heat flux (unit: W m−2), (B) momentum flux (unit: kg m−1 s−2), (C) friction velocity (unit: m s−1), and (D) boundary layer height (unit: km) within 200 km from the typhoon center.
4.3.4 PBL eddy diffusivity
Eddy diffusivity is a key parameter in PBL parameterization schemes (Zhu, 2014; Zhu, 2019), which is related to turbulent mixing. Some different behaviors of the PBL schemes can be explained by the distribution of the eddy diffusivity (Smith et al., 2014). PBL eddy diffusivity includes eddy diffusivity for momentum (Km) and heat (Kh), and Kh was computed from Km using the relationship of the Prandtl number (Gopalakrishnan et al., 2013). This subsection investigates the PBL eddy diffusivity during the typhoon landfall period.
The distributions of Kh and Km are similar, thus, only that of Km is examined here. Figure 14 shows the height–radius distribution of azimuthally averaged Km from the CTL and PBL1 experiments from 12:00 UTC on 9 August 2019 to 00:00 UTC on 10 August 2019. Km mainly concentrates below 6 km in CTL, however, Km from the YSU scheme extends into the free atmosphere in PBL1. In CTL, Km increases until the typhoon makes landfall and weakens afterward. In PBL1, Km is generally smaller in magnitude than that in CTL but has been increasing even after the typhoon made landfall. The spatial distribution of Km in PBL1 is likely related to the more extensive outflow circulation shown in Figure 8.
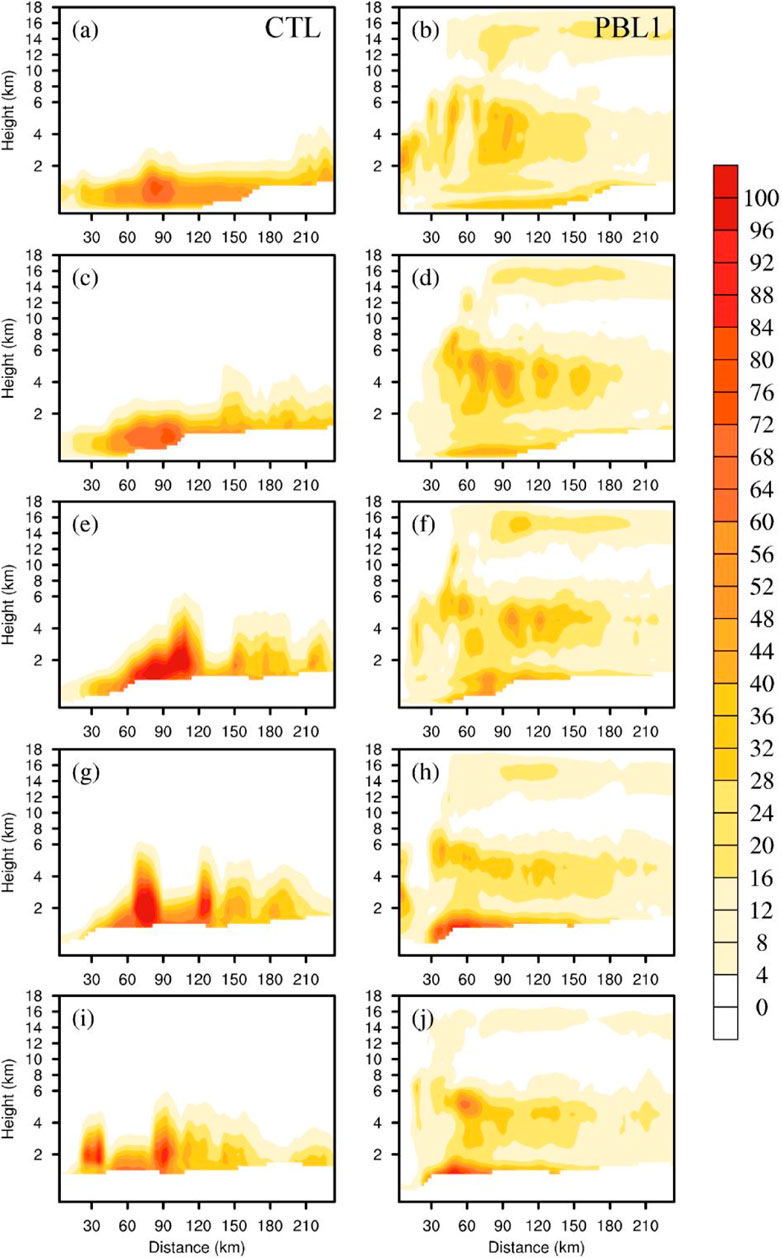
FIGURE 14. Height–radius distribution of azimuthal-mean eddy diffusivity for momentum (unit: m2/s) from (A,C,E,G,I) CTL and (B,D,F,H,J) PBL1 at (A,B) 12:00 UTC on 9 August, (C,D) 15:00 UTC on 9 August, (E,F) 18:00 UTC on 9 August, (G,H) 21:00 UTC on 9 August, and (I,J) 00:00 UTC on 10 August 2019. The y-axis is for height above ground (0 m). The white areas below the height of 2 km denote missing data.
4.3.5 PBL structure
The friction velocity increases before landfall and decreases afterward, indicating that the turbulence intensity changes from strong to weak (Figure 13C). The friction velocity in PBL1 is larger than that in CTL, especially, during the typhoon making landfall. Larger friction velocity leads to stronger vertical momentum flux, which is consistent with the variation of typhoon intensity. Different PBL schemes correspond to different vertical diffusion processes, which have different effects on the dynamic, thermal structure, and intensity evolutions of the typhoon. PBL heights simulated in the two experiments of CTL and PBL1 are quite different (Figure 13D). In this study, the PBL height is defined as the radial velocity being 10% of the peak inflow (Zhang et al., 2011). The PBL height reaches over 500 m in the CTL after 6 h of simulation and remains at this height until typhoon landfall. However, the PBL height reaches about 400 m in PBL1 after 6 h of simulation and remains until 12:00 UTC on 9 August. From 12:00 UTC on 9 August, the PBL height in PBL1 increases rapidly, approaching 700 m at the time of landfall, which exceeds in CTL. After the landfall, the PBL height in PBL1 is much higher than that in CTL, reaching about 1 km, and gradually decreases 24 h after landfall. A higher boundary layer corresponds to stronger vertical mixing that can transport the surface flux to a larger height, which provides energy for the development of typhoons. This is likely related to the longer sustained intensity during landfall in PBL1.
5 Conclusion and discussion
Typhoon Lekima’s precipitation distribution possessed asymmetry both over the sea and after the landfall. Moreover, typhoon Lekima had a concentric eyewall structure before landfall and showed evident asymmetric precipitation distribution. Numerical experiments are conducted to investigate the sensitivity of boundary layer schemes in simulating the asymmetric precipitation distribution of typhoon Lekima. To a moderate degree, the simulated track and intensity are sensitive to the choice of the PBL scheme. The CTL simulation (with model configurations in Table 1) well captures the development and asymmetric distribution of precipitation, while the group of ten sensitivity experiments has shown much more axisymmetric precipitation distribution near landfall. Thus, in terms of asymmetry, the simulated precipitation distribution seems to be less sensitive to the different PBL schemes (albeit with quite different spatial extent), however, the physics in CTL has captured the appropriate processes for asymmetric precipitation development.
The CTL and PBL1 experiments, which apply two of the most popular PBL and surface layer schemes, simulate the general trend in intensity change before landfall and similarly show the different intensity and structural changes during landfall. Therefore, these two experiments are further compared in detail. It is found that the simulated typhoon has experienced different evolutions before and during landfall. In CTL, the double-eyewall structure is simulated well as observed 12 h prior to landfall. The eyewall replacement is completed 6 h prior to landfall, accompanied by the weakening of the typhoon. After that and until the typhoon makes landfall, MWS, and PBL height remain unchanged. The asymmetric precipitation associated with outer spiral rainbands concentrated on the north side of the typhoon center during landfall is simulated reasonably.
Comparatively, no double eyewall occurs in the PBL1 experiment, while the radius of maximum wind expands outward from 00:00 UTC on 9 August (21 h prior to landfall), accompanied by the weakening of the typhoon. After 12 h, the average tangential wind strengthens to 60 m s−1 and begins to shrink inward. Until the typhoon makes landfall, MWS and PBL height increase rapidly, which is very different from CTL. The precipitation distribution turned more symmetric even as approaching landfall, which may be due to the re-intensification before landfall in PBL1. The stronger axisymmetric component associated with higher intensity before landfall would be more resistant to vertical wind shear. In addition, Dai et al. (2021) have analyzed the mechanism for the asymmetry that developed in the outer eyewall. Since there was no eyewall replacement simulated in PBL1, the process of vortex Rossby wave propagation analyzed by Dai et al. (2021) likely was not simulated well in the experiment, which would affect the degree of precipitation asymmetry too. Nevertheless, these processes must be further studied to clarify. During landfall, the simulated spatial scale of the typhoon core in PBL1 (eyewall at 40–60 km) is smaller than in CTL (70–100 km). It might affect the TC rainfall distribution, as newly concluded in an observational study by Yu et al. (2022) that small inner-core TCs have higher intensity with higher rainfall axisymmetry. After landfall, the precipitation distribution becomes asymmetric while dissipating, which is similar for CTL.
Diagnosis of boundary layer processes has been performed to reveal the differences between CTL and PBL1. Surface layer parameterization adopted by the PBL scheme determines the surface exchange coefficient and surface flux, and a larger enthalpy flux leads to larger typhoon intensity. The Revised MM5 Monin–Obukhov surface layer scheme used in the PBL1 experiment tends to generate larger enthalpy fluxes than CTL that uses the MYNN surface layer scheme. The YSU PBL scheme in PBL1, having smaller eddy diffusivity, larger friction velocity, and higher PBL height, simulates larger radial inflow and tangential wind in the boundary and larger updraft in the eyewall and thus higher typhoon intensity, especially, noticeable before landfall. On the other hand, the momentum fluxes in PBL1 are also higher, especially, over land during landfall, enabling rapid dissipation in the model. These results indicate that the model boundary layer schemes may largely influence the typhoon intensity and structure including the asymmetric rainfall distribution during landfall. However, majority of the sensitivity experiments here do not simulate the asymmetric precipitation properly and would affect the quality of impact forecast such as in the case of typhoon Lekima. Therefore, the complexity of the impacts of PBL processes makes it necessary to study the influences of PBL parameterization schemes on typhoon structural changes based on more cases in the future.
In addition, since both microphysical and boundary layer schemes could largely affect the precipitation processes in simulation, six additional sensitivity experiments by six microphysical schemes and a YSU scheme are also carried out to investigate the possible effects of different microphysical schemes on the typhoon asymmetric precipitation simulation during landfall. The results of the preliminary analysis indicate that microphysical schemes also affect the simulated typhoon asymmetric rainfall distribution during landfall. While the current study focuses on the PBL schemes, the in-depth analyses of the microphysics schemes will be continued in the second part of the study.
Data availability statement
The datasets presented in this study can be found in online repositories. The names of the repository/repositories and accession number(s) can be found in the article/Supplementary Material.
Author contributions
JD and ZY conceived the study and wrote the manuscript. BH, YZ, and ZC helped with the data analysis. KC and YL provided critical feedback and helped shape the research and manuscript. All authors contributed to the manuscript and approved the submitted version.
Funding
The work was supported in part by the National Key Research and Development Program of China (2021YFC3000804), the National Natural Science Foundation of China (U2142206, 41875080), the Natural Science Foundation of Shanghai (22ZR1482000), the Program of Shanghai Academic/Technology Research Leader (21XD1404500), and the Typhoon Scientific and Technological Innovation group of Shanghai Meteorological Service.
Acknowledgments
The authors thank two reviewers for their careful review of the manuscript and constructive suggestions.
Conflict of interest
Author KC was employed by E3-Complexity Consulting, Eastwood, NSW, Australia.
The remaining authors declare that the research was conducted in the absence of any commercial or financial relationships that could be construed as a potential conflict of interest.
Publisher’s note
All claims expressed in this article are solely those of the authors and do not necessarily represent those of their affiliated organizations, or those of the publisher, the editors, and the reviewers. Any product that may be evaluated in this article, or claim that may be made by its manufacturer, is not guaranteed or endorsed by the publisher.
References
Angevine, W. M., Jiang, H., and Mauritsen, T. (2010). Performance of an eddy diffusivity-mass flux scheme for shallow cumulus boundary layers. Mon. Weather Rev. 138 (7), 2895–2912. doi:10.1175/2010mwr3142.1
Ao, X., Yue, C., Yang, X., Deng, L., and Huang, W. (2022). Urbanization effects on rainfall processes induced by landfalling typhoon Lekima (2019) over the Shanghai metropolitan area. J. Hydrometeorol. 23, 1075–1093. doi:10.1175/JHM-D-21-0170.1
Bougeault, P., and Lacarrere, P. (1989). Parameterization of orography-induced turbulence in a mesobeta-scale model. Mon. Weather Rev. 117 (8), 1872–1890. doi:10.1175/1520-0493(1989)117<1872:POOITI>2.0.CO;2
Bretherton, C. S., and Park, S. (2009). A new moist turbulence parameterization in the community atmosphere model. J. Clim. 22 (12), 3422–3448. doi:10.1175/2008JCLI2556.1
Chan, J. C. L., and Liang, X. (2003). Convective asymmetries associated with tropical cyclone landfall. Part I: F-Plane simulations. J. Atmos. Sci. 60, 1560–1576. doi:10.1175/1520-0469(2003)60<1560:caawtc>2.0.co;2
Chen, S., Knaff, J. A., and Marks, F. D. (2006). Effects of vertical wind shear and storm motion on tropical cyclone rainfall asymmetries deduced from TRMM. Mon. Weather Rev. 134 (11), 3190–3208. doi:10.1175/mwr3245.1
Chen, Y., and Yau, M. K. (2003). Asymmetric structures in a simulated landfalling hurricane. J. Atmos. Sci. 60, 2294–2312. doi:10.1175/1520-0469(2003)060<2294:asiasl>2.0.co;2
Dai, H., Zhao, K., Li, Q., Lee, W. C., Ming, J., Zhou, A., et al. (2021). Quasiperiodic intensification of convective asymmetries in the outer eyewall of Typhoon Lekima (2019). Geophys. Res. Lett. 48, e2020GL091633. doi:10.1029/2020GL091633
Davis, C., and Bosart, L. F. (2002). Numerical simulations of the Genesis of Hurricane Diana (1984). Part II: Sensitivity of track and intensity prediction. Mon. Weather Rev. 130 (5), 1100–1124. doi:10.1175/1520-0493(2002)130<1100:nsotgo>2.0.co;2
DeMaria, M., Knaff, J. A., and Sampson, C. R. (2007). Evaluation of long-term trends in tropical cyclone intensity forecasts. Meteorol. Atmos. Phys. 59, 19–28. doi:10.1007/s00703-006-0241-4
Dudhia, J. (1989). Numerical study of convection observed during the winter monsoon experiment using a mesoscale two-dimensional model. J. Atmos. Sci. 46, 3077–3107. doi:10.1175/1520-0469(1989)046<3077:nsocod>2.0.co;2
Emanuel, K. A. (2000). A statistical analysis of tropical cyclone intensity. Mon. Weather Rev. 128, 1139–1152. doi:10.1175/1520-0493(2000)128<1139:asaotc>2.0.co;2
Gopalakrishnan, S. G., Marks, F., Zing, J. A., Zhang, X., Bao, J. W., and Tallapragada, V. (2013). A study of the impacts of vertical diffusion on the structure and intensity of the tropical cyclones using the high-resolution HWRF system. J. Atmos. Sci. 70, 524–541. doi:10.1175/jas-d-11-0340.1
Grenier, H., and Bretherton, C. S. (2001). A moist PBL parameterization for large-scale models and its application to subtropical cloud-topped marine boundary layers. Mon. Weather Rev. 129 (3), 357–377. doi:10.1175/1520-0493(2001)129<0357:AMPPFL>2.0.CO;2
He, B., Yu, Z., Tan, Y., Shen, Y., and Chen, Y. (2021). Rainfall forecast errors in different landfall stages of Super Typhoon Lekima (2019). Front. Earth Sci. 16, 34–51. doi:10.1007/s11707-021-0894–9
Hence, D. A., and Houze, R. A. (2011). Vertical structure of hurricane eyewalls as seen by the TRMM Precipitation Radar. J. Atmos. Sci. 68 (8), 1637–1652. doi:10.1175/2011jas3578.1
Hence, D. A., and Houze, R. A. (2012). Vertical structure of tropical cyclone rainbands as seen by the TRMM Precipitation Radar. J. Atmos. Sci. 69 (9), 2644–2661. doi:10.1175/jas-d-11-0323.1
Hill, K. A., and Lackmann, G. M. (2009). Analysis of idealized tropical cyclone simulations using the weather research and forecasting model: Sensitivity to turbulence parameterization and grid spacing. Mon. Weather Rev. 137 (2), 745–765. doi:10.1175/2008mwr2220.1
Hong, S. Y., Noh, Y., and Duchies, J. (2006). A new vertical diffusion package with an explicit treatment of entrainment processes. Mon. Weather Rev. 134 (9), 2318–2341. doi:10.1175/mwr3199.1
Huang, C., Sha, S., and Kuo, H. (2022). A modeling study of typhoon Lekima (2019) with the topographic influence of taiwan. Mon. Weather Rev. 150, 1993–2011. doi:10.1175/MWR-D-21-0183.1
Huang, Q., Ge, X., and Peng, M. (2021). Simulation of rapid intensification of Super Typhoon Lekima (2019). Part I: Evolution characteristics of asymmetric convection under upper-level vertical wind shear. Front. Earth Sci. (Lausanne). 9, 739507. doi:10.3389/feart.2021.739507
Janjić, Z. I. (1994). The step-mountain eta coordinate model: Further developments of the convection, viscous sublayer, and turbulence closure schemes. Mon. Weather Rev. 122 (5), 927–945. doi:10.1175/1520-0493(1994)122<0927:TSMECM>2.0.CO;2
Jiménez, P. A., Dudhia, J., Gonzalez–Rouco, J. F., Navarro, J., Montavez, J. P., and Garci–Bustamante, E. (2012). A revised scheme for the WRF surface layer formulation. Mon. Weather Rev. 140, 898–918. doi:10.1175/MWR-D-11-00056.1
Kain, J. S., and Fritch, J. M. (1993). Convective parameterization for mesoscale models: The kain-fritch scheme. The representation of cumulus convection in numerical models. Meteor Monogr. 46, 165–170. doi:10.1007/978-1-935704-13-3_16
Kepert, J. D. (2012). Choosing a boundary layer parameterization for tropical cyclone modeling. Mon. Weather Rev. 140 (5), 1 427–1445. doi:10.1175/mwr-d-11-00217.1
Li, X. L., and Pu, Z. X. (2008). Sensitivity of numerical simulation of early rapid intensification of Hurricane Emily (2005) to cloud microphysical and planetary boundary layer parameterizations. Mon. Weather Rev. 136 (12), 4819–4838. doi:10.1175/2008mwr2366.1
Li, Y., and Chen, L. S. (2005). Numerical study of impacts of boundary layer fluxes over wetland on sustention and rainfall of landfalling tropical cyclone. J. Meteor Res. 63 (5), 683–693.
Li, Y., Cheung, K. K. W., and Chan, J. C. L. (2015). Modelling the effects of land-sea contrast on tropical cyclone precipitation under environmental vertical wind shear. Q. J. R. Meteorol. Soc. 141, 396–412. doi:10.1002/qj.2359
Li, Y., Cheung, K. K. W., and Chan, J. C. L. (2014). Numerical study on the development of asymmetric convection and vertical wind shear during tropical cyclone landfall. Q. J. R. Meteorol. Soc. 140, 1866–1877. doi:10.1002/qj.2259
Lin, Y. L., Farley, R. D., and Orville, H. D. (1983). Bulk parameterization of the snow field in a cloud model. J. Clim. Appl. Meteor. 22, 1065–1092. doi:10.1175/1520-0450(1983)022<1065:bpotsf>2.0.co;2
Mlawer, E. J., Taubman, S. J., BrownP, D., Iacono, M. J., and Clough, S. A. (1997). Radiative transfer for inhomogeneous atmospheres: RRTM, a validated correlated-k model for the longwave. J. Geophys. Res. 102 (D14), 16663–16682. doi:10.1029/97jd00237
Nakanishi, M., and Niino, H. (2006). An improved mellor–Yamada level-3 model: Its numerical stability and application to a regional prediction of advection fog. Bound. Layer. Meteorol. 119, 397–407. doi:10.1007/s10546-005-9030-8
Nakanishi, M., and Niino, H. (2009). Development of an improved turbulence closure model for the atmospheric boundary layer. J. Meteorological Soc. Jpn. 87, 895–912. doi:10.2151/jmsj.87.895
Pleim, J. E. (2007). A combined local and nonlocal closure model for the atmospheric boundary layer. Part II: Application and evaluation in a mesoscale meteorological model. J. Appl. Meteorol. Climatol. 46 (9), 1396–1409. doi:10.1175/jam2534.1
Reasor, P. D., Rogers, R., and Lorsolo, S. (2013). Environmental flow impacts on tropical cyclone structure diagnosed from airborne Doppler radar composites. Mon. Weather Rev. 141 (9), 2949–2969. doi:10.1175/mwr-d-12-00334.1
Ren, F., and Xiang, C. (2017). Review and prospect of researches on the prediction of precipitation associated with landfalling tropical cyclones. J. Mar. Meteorology (in Chinese) 37 (4), 8–18. doi:10.19513/j.cnki.issn2096-3599.2017.04.002
Shi, D., Chen, G., Wang, K., Bi, X., and Chen, K. (2020). Evaluation of two initialization schemes for simulating the rapid intensification of Typhoon Lekima (2019). Adv. Atmos. Sci. 37 (9), 987–1006. doi:10.1007/s00376-020-2038-7
Shi, D. L., and Chen, H. (2021). Double warm-core structure and potential vorticity diagnosis during the rapid intensification of supertyphoon Lekima (2019). J Atmos Sci 78, 2471–2492. doi:10.1175/JAS-D-20-0383.1
Shin, H. H., and Hong, S. Y. (2011). Intercomparison of planetary boundary-layer parametrizations in the WRF model for a single day from CASES-99. Boundary. Layer. Meteorol. 139 (2), 261–281. doi:10.1007/s10546-010-9583-z
Smith, R. K., Montgomery, M. T., and Thomsen, G. L. (2014). Sensitivity of tropical-cyclone models to the surface drag coefficient in different boundary-layer schemes. Q. J. R. Meteorol. Soc. 140 (680), 792–804. doi:10.1002/qj.2057
Sukoriansky, S., Galperin, B., and Perov, V. (2005). Application of a new spectral theory of stably stratified turbulence to the atmospheric boundary layer over sea ice. Boundary. Layer. Meteorol. 117 (2), 231–257. doi:10.1007/s10546-004-6848-4
Tao, W. K., Shi, J. J., Lin, P. L., Chen, J., Lang, S., Chang, M. Y., et al. (2011). Highresolution numerical simulation of the extreme rainfall associated with Typhoon Morakot. Part I: Comparing the impact of microphysics and PBL parameterizations with observations. Terr. Atmos. Ocean. Sci. 22, 673–696. doi:10.3319/tao.2011.08.26.01(tm)
Wang, Y., and Zhao, Y. (2020). Numerical investigation of the effects of boundary layer parameterization schemes on typhoon Meranti (1614) landing process. Chinese Journal of Atmospheric Sciences (in Chinese) 44 (5), 935–995. doi:10.3878/j.issn.1006-9895.2004.19135
Xiang, C., Wu, L., and Qin, N. (2021). Characteristics of extreme rainfall and rainbands evolution of Super Typhoon Lekima (2019) during its landfall. Front. Earth Sci. 1, 64–74. doi:10.1007/s11707-021-0871–3
Xu, F., and Liang, X. (2021). Drastic change in dynamics as Typhoon Lekima experiences an eyewall replacement cycle. Front. Earth Sci. 16, 121–131. doi:10.1007/s11707–020–0865–6
Xu, Y., Zhai, G., Li, G., Yu, Z., and Yan, H. (2017). Optimization experiment for microphysical and boundary layer parameterization of high-impact Zhejiang typhoons by WRF model. Journal of Tropical Meteorology (in Chinese) 33 (2), 201–211.
Ying, M., Zhang, W., Yu, H., Lu, X., Feng, J., Fan, Y., et al. (2014). An overview of the China Meteorological Administration tropical cyclone database. J. Atmos. Ocean. Technol. 31, 287–301. doi:10.1175/JTECH-D-12-00119.1
Yu, H., Chen, P., Li, Q., and Tang, B. (2013). Current capability of operational numerical models in predicting tropical cyclone intensity in the western north pacific. Weather Forecast. 28 (2), 353–367. doi:10.1175/waf-d-11-00100.1
Yu, Z., Chen, J. Y., Ebert, B., Davidson, N., Xiao, Y., Yu, H., et al. (2020). Benchmark rainfall verification of landfall tropical cyclone forecasts by operational ACCESS-TC over China. Meteorol. Appl. 27 (1), 1–18. doi:10.1002/met.1842
Yu, Z., Liang, X., Yu, H., and Chan, J. C. L. (2010). Mesoscale vortex generation and merging process: A case study associated with a post-landfall tropical depression. Adv. Atmos. Sci. 27 (2), 356–370. doi:10.1007/s00376-009-8091-x
Yu, Z., Wang, Y., Xu, H., Davidson, N., Chen, Y., Chen, Y., et al. (2017). On the relationship between intensity and rainfall distribution in tropical cyclones making landfall over China. J. Appl. Meteorol. Climatol. 56 (10), 2883–2901. doi:10.1175/jamc-d-16-0334.1
Yu, Z., Wang, Y., Yu, H., and Duan, Y. (2022). The relationship between the inner-core size and the rainfall distribution in landfalling tropical cyclones over China. Geophys. Res. Lett. 49, e2021GL097576. doi:10.1029/2021gl097576
Yu, Z., Yu, H., Chen, P., Qian, C., and Yue, C. (2009). Verification of tropical cyclone–related satellite precipitation estimates in mainland China. J. Appl. Meteorol. Climatol. 48 (11), 2227–2241. doi:10.1175/2009jamc2143.1
Zhang, J. A., Rogers, R. F., Nolan, D. S., and Marks, F. D. (2011). On the characteristic height scales of the hurricane boundary layer. Mon. Weather Rev. 139, 2523–2535. doi:10.1175/mwr-d-10-05017.1
Zhu, P., Menelaou, K., and Zhu, Z. (2014). Impact of subgrid-scale vertical turbulent mixing on eyewall asymmetric structures and mesovortices of hurricanes. Q. J. R. Meteorol. Soc. 140 (679), 416–438. doi:10.1002/qj.2147
Keywords: planetary boundary layer, PBL parameterization, landfall typhoon, asymmetric precipitation, tropical cyclone (TC)
Citation: Duan J, Yu Z, Hu B, Zhen Y, Cheung KKW, Li Y and Cai Z (2022) Sensitivity of boundary layer schemes in simulating the asymmetric rainfall of landfalling typhoon Lekima (2019). Front. Earth Sci. 10:997925. doi: 10.3389/feart.2022.997925
Received: 19 July 2022; Accepted: 22 August 2022;
Published: 15 September 2022.
Edited by:
Liguang Wu, Fudan University, ChinaReviewed by:
Dajun Zhao, Chinese Academy of Meteorological Sciences, ChinaYuanlong Li, Nanjing University, China
Copyright © 2022 Duan, Yu, Hu, Zhen, Cheung, Li and Cai. This is an open-access article distributed under the terms of the Creative Commons Attribution License (CC BY). The use, distribution or reproduction in other forums is permitted, provided the original author(s) and the copyright owner(s) are credited and that the original publication in this journal is cited, in accordance with accepted academic practice. No use, distribution or reproduction is permitted which does not comply with these terms.
*Correspondence: Zifeng Yu, eXV6ZkB0eXBob29uLm9yZy5jbg==