 Ana L. Lordi
 Maria C. Neves
 Susana Custódio
 Stéphanie Dumont
94% of researchers rate our articles as excellent or good
Learn more about the work of our research integrity team to safeguard the quality of each article we publish.
Find out more
ORIGINAL RESEARCH article
Front. Earth Sci., 08 December 2022
Sec. Solid Earth Geophysics
Volume 10 - 2022 | https://doi.org/10.3389/feart.2022.995401
This article is part of the Research TopicEarthquake Swarms and Complex Seismic Sequences in Tectonic and Volcanic AreasView all 6 articles
The analysis of an 11-year (2008–2018) seismic catalogue of the Azores suggests the existence of secondary cyclic influences on the seismicity rate of the oceanic region, with more earthquakes observed during the summer months, from May to August, than in winter. Statistical testing based on Monte-Carlo simulations and a Jack-Knife methodology indicate that the seasonal modulation affects earthquakes with magnitudes M3.3–4.5, well above the magnitude of completeness. Here, we investigate the seasonal variations of earthquake rate considering both the whole Azores oceanic domain and four separate sub-regions, corresponding to four regional clusters identified by previous authors. The analysis shows that the seasonal modulation is particularly observed near the Triple Junction region between the Faial Island and the Mid-Atlantic Ridge. To identify possible mechanisms driving the seasonal modulation, we apply Singular Spectral Analysis to the seismicity rate and to time-series of plausible external triggers, in order to investigate possible common periodicities. We find significant correlations between the earthquake rate, sea level anomaly rate, GRACE satellite anomalies and ocean bottom pressure, suggesting that water load may modulate the Azores oceanic seismicity.
Cyclical patterns in the seismicity rate of continental regions have been observed in several active tectonic sites, often modulated by annual and semi-annual variations in water masses, such as precipitation, groundwater, snow and tides. In such regions, the crustal loading caused by hydrologic variations contributes to strain and stress transients, the latter of the order of few kPa, which may trigger small earthquake swarms at faults already near failure. Examples have been well documented in the Himalayas (Bollinger et al., 2007), New Madrid Seismic Zone, United States (Craig et al., 2017) and Japan (Ueda and Kato, 2019), among others. Water loads may trigger failure by two principal mechanisms: either by exerting a direct load on fault systems (e.g., New Madrid Seismic Zone) or via fault strength reduction due to an increase in pore-fluid pressure (e.g., Himalayas and Japan).
Unlike the continents, which are under the influence of seasonal water loads (e.g., groundwater, rivers, rainfall), oceanic faults are permanently in contact with the water layer. Still, the pressure of the water column varies in time due to the dynamics of the ocean, including storms, tides and currents. The stresses induced by tides on the oceanic crust are an order of magnitude larger than in continental settings, where only solid Earth tides are at work (Scholz et al., 2019).
Periodic fluctuations of the seismicity are not easily observed in the ocean, especially in locations where earthquake rates are low, in part due to our limited capability to observe the oceans. However, modulations of seismicity have been reported in magmatic areas in fast and intermediate spreading ridges in the Pacific Ocean (Wilcock, 2001, 2009; Tolstoy et al., 2002; Stroup et al., 2009; Scholz et al., 2019). Although fewer works focused specifically on the Mid-Atlantic Ridge (MAR), there is evidence of tidally-induced stresses capable of modulating the annual microseismicity in the Equatorial MAR (Leptokaropoulos et al., 2021). Tides have also been shown to exert a long-term influence on large earthquakes in Japan (Tanaka et al., 2002; 2014). In the Azores, few studies on the modulation of seismicity have been conducted before. However, one study evidenced that the occurrence of earthquakes in the island of São Miguel showed a seasonal pattern, with a good correlation with rainfall (Martini et al., 2009).
Earthquakes of small magnitude may indicate the activation or approach of criticality of fault systems. Therefore understanding the processes that influence the background seismicity in active tectonic sites can help us to better assess seismic hazard. Our initial spatio-temporal analysis of the seismicity rate in the Azores included both the islands and the oceanic region of the archipelago (Dias, 2021; Lordi et al., 2022). In that study, we found no evidence that earthquakes on the islands showed a seasonal pattern, however we did find evidence of seasonality in the oceanic regions.
Here, we focus our analysis on the oceanic region of the Azores and further investigate the spatial distribution of the detected seasonality. In addition, we investigate the role of possible loads linked to pressure variations in the ocean water column, which may act as modulators of the oceanic seismicity. We considered mass variation within the ocean, which produce fluctuations in Ocean Bottom Pressure (OBP), that show similar periodicities to the ones that we find in the seismicity rate. Because in-situ OBP measurements are not available in the Azores during the time-span of our study, we use other indicators of ocean water mass changes, such as sea level anomalies, estimates of OBP provided by global ocean circulation models and GRACE (Gravity Recovery and Climate Experiment) satellite data.
The Azores is a volcanic archipelago that lies in the triple junction between the North American, African and Eurasian lithospheric plates, with islands spreading across the Mid-Atlantic Ridge (MAR) and the Terceira Ridge (TR). It comprises nine islands that rise from a depth of more than 2000 to over 2000 m above sea level (Figure 1A). The region is characterized by a bathymetric high called the Azores Plateau, a shallow and triangular-shaped structure formed 10 to 4 Ma ago (Luis et al., 1994; Cannat et al., 1999). The Azores plateau is underlain by thickened oceanic crust, with Moho depths estimated at 12 km (Luis and Neves, 2006). Some geochemistry studies suggested the existence of a mantle plume under the Plateau and attributed its formation to a hotspot (Morgan, 1971; Schilling, 1975). Other authors (Bonatti, 1990; Sartori et al., 1994) argued against this model, rather assigning the origin of the plateau to plate boundary forces. Although the origin of the Plateau remains a matter of debate, it is clear that both tectonic and magmatic processes related to the triple-junction and its dynamics have affected the development and evolution of the plateau, with consequences in terms of surface morphology, volcanism, and seismicity.
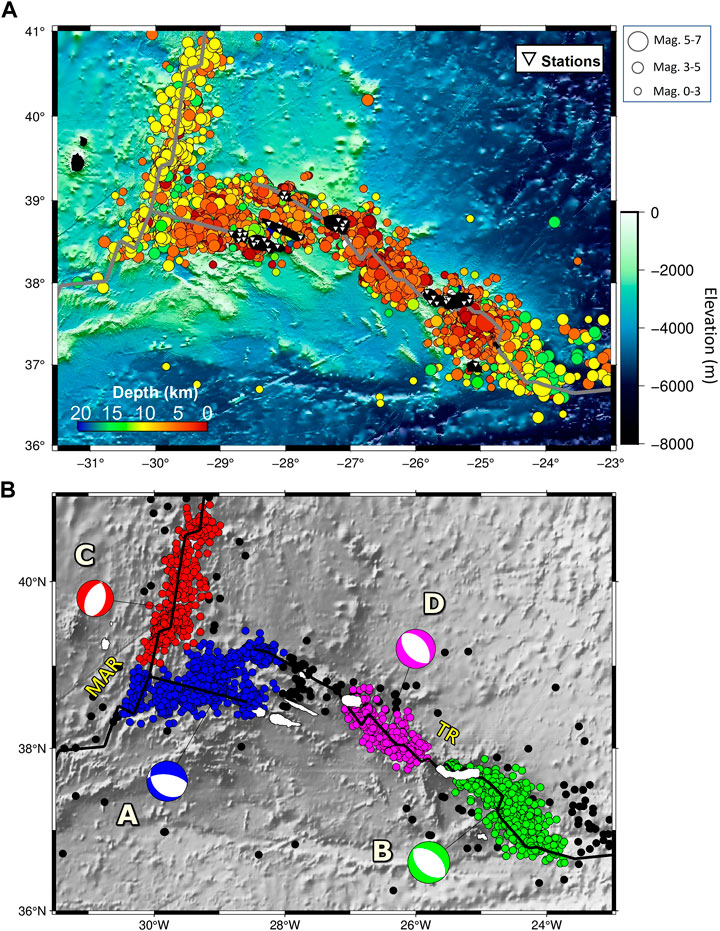
FIGURE 1. Maps of the Azores archipelago. (A) Ocean earthquake catalogue from 2008 to 2018 (data from Instituto Português do Mar e da Atmosfera, IPMA; earthquakes on islands were removed). The depth of earthquakes is shown by colors and the magnitude by the size of the circles. MAR and TR are the Mid-Atlantic Ridge and Terceira Rift, respectively. The 35 permanent IPMA seismic stations located on the islands are shown by the white triangles. (B) Focal mechanisms representative of earthquake clusters (A-D) identified by Custódio et al. (2016).
Some of the seismic activity of the Azores shows a tectonic character, associated with the triple junction, and other is related to volcanic activity. Earthquakes occur both along MAR and the TR, in clusters aligned with the islands (Figure 1A). The earthquakes are mainly shallow, with focal depths less than 20 km (Instituto Português do Mar e da Atmosfera, I.P., 2006). Most of the strongest earthquakes (M > 6) were recorded in the central group of islands (Faial, Graciosa, Terceira, São Jorge, Pico).
The Azores are dominated by a transtensional tectonic regime, with earthquakes displaying mainly normal and strike-slip focal mechanisms (Luis et al., 1994; Lourenço et al., 1998; Custódio et al., 2016). Custódio et al. (2016) analyzed focal mechanism in the Azores region based on regional and global data and identified 4 regional clusters (A-D) (Figure 1B). The clusters were identified based on the spatial proximity of earthquakes, and representative focal mechanisms were computed for earthquakes within each cluster. In spite of the existing strike-slip earthquakes, the representative focal mechanisms of the 4 clusters are all normal, locally striking parallel to the ridges. The pressure axes of all clusters are vertical, in good agreement with the horizontal extension that is dominant in the region.
Our study uses the Azores seismic catalogue of the Instituto Português do Mar e da Atmosfera (Instituto Português do Mar e da Atmosfera, I.P., 2006), the national earthquake monitoring agency, which operates a seismic network in the archipelago (Figure 1). We analyze the earthquake catalogue between 1 January 2008 and 31 December 2018, an 11-year period during which the seismic network and catalogue are fairly homogeneous and high-quality. For this time interval, the catalogue contains a total of 13.492 events.
The seismicity of the Azores is primarily controlled by magmatic-tectonic activity at the plate boundaries. Still, other processes such as ocean loading, rainfall or variations in hydrological cycle may modulate the earthquake rate (Wilcock, 2001; Matthews et al., 2002; Petrosino et al., 2018). These modulating processes are expected to differ for seismic activity on the seafloor and on islands. For instance, the islands may be affected by local water runoff, river loads and rainfall, whereas the oceanic domain may be affected by the pressure of the overlying water column, which may change with tides, storms, etc. In fact, Martini et al. (2009) found that small magnitude (Mb < 3) earthquakes recorded between 2003 and 2004 in the island of São Miguel were more numerous during the wet season or close to episodes of abundant rainfall. Thus, we divided the earthquake catalogue into insular and oceanic regions. The complete data set (including islands and ocean earthquakes) is mostly dominated by oceanic earthquakes, which amount to 87% of the events (11.719 earthquakes). In this study we only investigate the results for the oceanic catalogue given that the insular catalogue shows no evidence of seasonality in the 2008–2018 period (see Supplementary Figures S1–3, Lordi et al., 2022).
Previous studies have suggested that ocean loading and its seasonal variations can modulate the seismic and volcanic eruptive activity in coastal and submarine regions (Mcnutt and Beaven, 1987; Mason et al., 2004; Christiansen et al., 2005; Tolstoy, 2015; Ueda and Kato, 2019). Thus, we investigate the relationship between the earthquake rate and: 1) sea level anomaly rate, 2) GRACE equivalent water thickness and 3) OBP estimates from a global ocean circulation model.
Sea-level anomaly (SLA) was obtained from altimeter satellite gridded data provided by the Copernicus Marine Service (CMEMS, accessed in November 2021). More specifically, we used the mean global ocean gridded sea surface heights computed with respect to a 20-year mean. The SLA is estimated by optimal interpolation, merging the measurement from the different altimeter missions. We checked that this data set provides a better representation of the regional SLA than the tide gauge data, which is scarce in the study region. We considered here the rate of SLA change rather than the SLA change itself, for reasons that we will explain later in the Discussion section.
The GRACE satellite mission was designed to measure changes in the Earth’s gravity field caused by vertically integrated oceanic and atmospheric mass and enabled the capability to observe large-scale OBP signals at monthly intervals (Tapley et al., 2004). The data used in this study (accessed in November 2021, and available at http://grace.jpl.nasa.gov) is the normalized bottom pressure expressed in equivalent centimeters of water obtained from the GRC Tellus - JPL MASCON gridded dataset version RL06M (Wiese et al., 2018). Although the data is provided with a spatial sampling of 0.5° in both latitude and longitude, the JPL MASCON grid has a native resolution of only 3° x 3° in size. Early studies showed a good match between the GRACE estimates, large-scale OBP and global mean sea level from altimetry (Chambers et al., 2004), however subsequent studies showed that the link between sea level and OBP derived from GRACE is broken by baroclinic processes, depending on spatial and temporal scales as well as on the geographic region (Ponte et al., 2007; Bingham and Hughes, 2008; Chambers and Schroter, 2011; Zhang et al., 2018, Chen et al., 2021). Recent research also indicates that the comparison between GRACE and in-situ OBP measurements is often not satisfactory not only because of GRACE’s low spatial and temporal resolution, but also due to a chaotic intrinsic variability resulting from the non-linear interactions between oceanic and atmospheric processes (Zhao et al., 2021).
The ocean bottom pressure (OBP) is obtained from NASA Advanced Supercomputing ECCO (Estimating the Circulation and Climate of the Ocean) data portal (accessed in November 2021). OBP is given as equivalent sea level height (m) and includes the spatial mean atmospheric pressure variations over the global ocean. Although we use the ECCO Version 4 release 4 (V4r4) which represents ECCO’s latest ocean state estimate (ECCO Consortium et al., 2021), the ability of current general ocean circulation models like ECCO to capture OBP on time scales in excess of 30 days is known to be low in regions of strong baroclinicity (Androsov et al., 2020). In particular, in the Azores the oceanographic conditions are characterized by significant mesoscale eddy activity linked to baroclinic instabilities and topographic effects, which are not fully captured by ECCO (Caldeira and Reis, 2017).
We investigated the variability of earthquake frequency in the Azores using the methodology presented in Figure 2, proposed by Craig et al. (2017). We first benchmarked the method using the New Madrid Seismic Zone catalogue, as in the original work of Craig et al. (2017) (see the Supplementary Figure S4). We then applied the methodology to the Azores catalogue. The first step was to decluster the catalogue, which aims to prevent foreshock/aftershock clusters from biasing the temporal distribution of seismicity. We declustered the catalogue using the Reasenberg (1985) method as implemented in the ZMAP software (Wiemer, 2001).
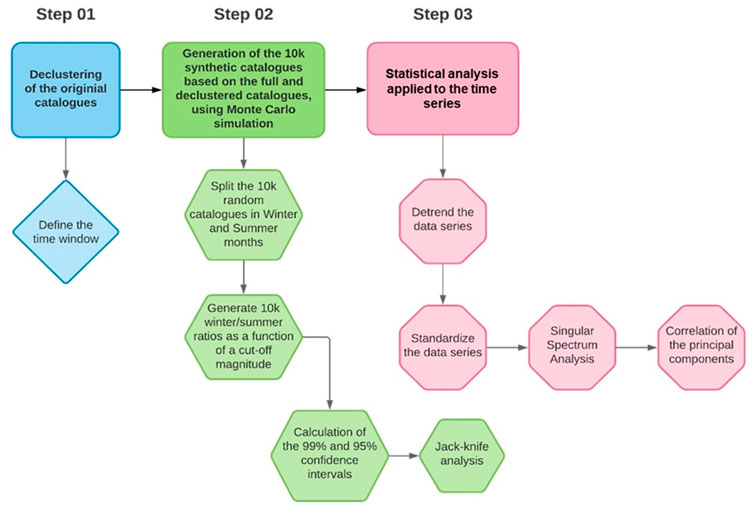
FIGURE 2. Fluxogram showing the steps of the data processing.
To test whether the apparent seasonality of seismicity in the Azores oceanic catalogue is genuine, we followed the approach of Bollinger et al. (2007) and ran a Monte Carlo simulation to generate 10.000 random seismic catalogues with the same general characteristics of the Azores catalogue, namely same number of events, magnitude of completeness, range of longitude, latitude, magnitude and depth, and same frequency-magnitude distribution, as given by the Gutenberg-Richter power-law (Eq. 1) (Gutenberg and Richter, 1944).
Where N is the number of events with magnitude M larger or equal to magnitude
By Monte Carlo simulation, we generated 10.000 random catalogues for both the full and declustered oceanic catalogues, separately. Each one of the random catalogues was divided into winter (November to February, NDJF) and summer (May to August, MJJA) months. Although other month groups were tested, this is the option that best represents the observed seasonality. Then, we calculated the ratio of the number of earthquakes in winter vs. summer months (ratio NDJF/MJJA), considering only earthquakes above a varying threshold magnitude. From the ratios obtained from the 10.000 random catalogues, we calculated 99% and 95% confidence limits that were used to assess the significance of the observed NDJF/MJJA ratios.
We further used a Jack-Knife approach to assess whether the observed seasonality could be due to abnormal seismic activity in a given season in one of the years. Jack-Knife is a resampling technique used to estimate variability using subsamples of a dataset (Quenouille, 1956; Tukey, 1958; Sinharay, 2010). It uses a leave-one-out strategy, in which an observation is omitted in a dataset of N observations. We applied the Jack-Knife technique to the Monte Carlo simulation, carrying out the same analysis described above, but now removing one calendar year at a time from the original seismic catalogue. We obtained as residuals the difference between the observed NDJF/MJJA ratio and the 95% confidence interval. This approach allowed us to identify whether a specific year of observation biased the inferred seasonality (Craig et al., 2017). Additionally, we further applied a Kuiper test (Kuiper, 1960) to the Julian days of the Azores earthquakes. The Kuiper test is an adaptation of the Kolmogorov-Smirnov test, and it is used to assess the uniformity of a dataset, and hence the likelihood of cyclic variations. A very high probability (P = 1- α) returned by the test indicates that the data is not uniformly distributed and therefore time variability can be inferred.
In the last step of our methodology, we used Singular Spectrum Analysis (SSA) to identify the main periodic components in the observed seismicity rate. We computed a time-series of seismicity rate (number of earthquakes per month) for each of the regions corresponding to the four clusters in Figure 1B (clusters A to D). The SSA is a form of frequency analysis applied to decompose time-series into trend, periodic or quasi-periodic components and noise. This study follows the methodology described by Hanson et al. (2004) to extract the reconstructed components (RCs), which take the form of almost-sinusoidal oscillations, and which contribute the most to the total variance of the time-series. The SSA was applied on the lagged-covariance matrix based on Vautard et al. (1992) using a 13 months window length, which is approximately 1/10 of the time-series length (132 points), as recommended by Vautard et al. (1992).
We also applied the SSA analysis to the ocean load time series to check if their main periodic components matched the seasonal modulation of the seismicity rate. To obtain a single time-series representative of the whole region, the gridded datasets of sea level anomaly, GRACE and OBP were limited and spatially averaged over the study region presented in Figure 1. All time series were detrended and standardized to a normal distribution, for comparisons across data types, prior to SSA analysis.
After computing the main RCs of the seismicity rate, we computed their Pearson’s correlations with the main RC of the sea level anomaly rate, GRACE and OBP. Finally, a t-student test was used to confirm the significance of the correlation, considering a two-tailed significance test at 95% confidence.
Considering the Gutenberg-Richter magnitude-frequency distribution, both the full and declustered catalogues (Figures 3A,B) for the ocean are overall complete down to magnitude M2.0. Figures 4A,B show the number of earthquakes recorded throughout time, binned in 1-month intervals, both for the full and declustered ocean catalogues. A visual inspection of the figure suggests a cyclic variability in the occurrence rate of ocean earthquakes over the 11 years analyzed, which is clearer in the declustered catalogue. Times of increased seismic activity can be seen as peaks in the linearly detrended time series of the cumulative number of earthquakes (Figure 4C).
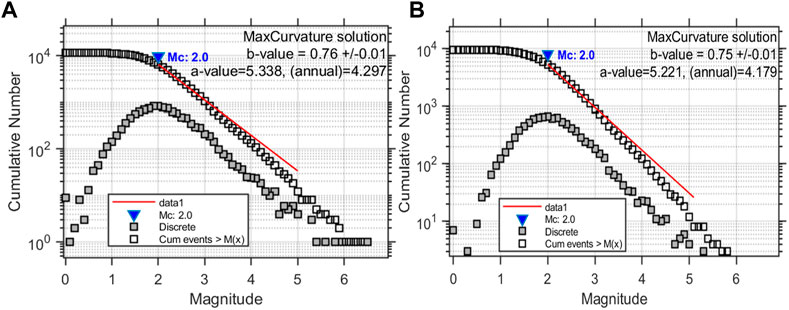
FIGURE 3. Gutenberg-Richter magnitude-frequency distribution for the full (A) and declustered (B) catalogues. The magnitude of completeness is estimated by maximum curvature, while the b-value is given by weighted least square method.
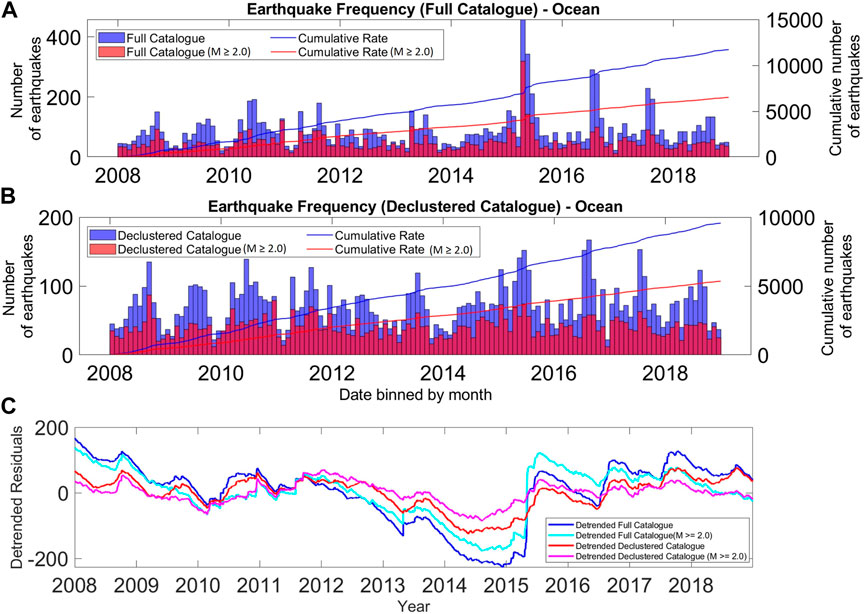
FIGURE 4. Histogram of the earthquake frequency for (A) full and (B) declustered Azores ocean catalogues. Blue bars show the monthly number of earthquakes in the full catalogue, while red bars consider only earthquakes above the completeness magnitude, M ≥ 2.0. The superimposed lines in the histograms show the cumulative earthquake rates. (C) Cumulative number of earthquakes after removal of the linear trend, both for the full (cyan, blue) and declustered catalogues (red, pink), showing clear periodic peaks.
To assess variations in the completeness of the earthquakes catalogue, we performed a spatio-temporal analysis of the magnitude of completeness (Mc) for the oceanic catalogue using the ZMAP software (Wiemer, 2001) (Figures 5A,B). The magnitude of completeness was estimated from the maximum of the derivative of the frequency magnitude distribution and the b-value was found by weighted least-squares fit. To investigate the spatial variation of Mc, we used a grid of 38.8 x 38.8 (km) with a total of 1.763 grid points (Figure 5B). We considered events within a radius of 100 km from the center of each grid cell and computed Mc for cells with at least 20 events with M>Mc. To investigate the temporal variation of Mc, we computed Mc considering moving time windows of the catalogue with a sample size of 500 earthquakes, minimum number of earthquakes = 20, and a window overlap of 4%.
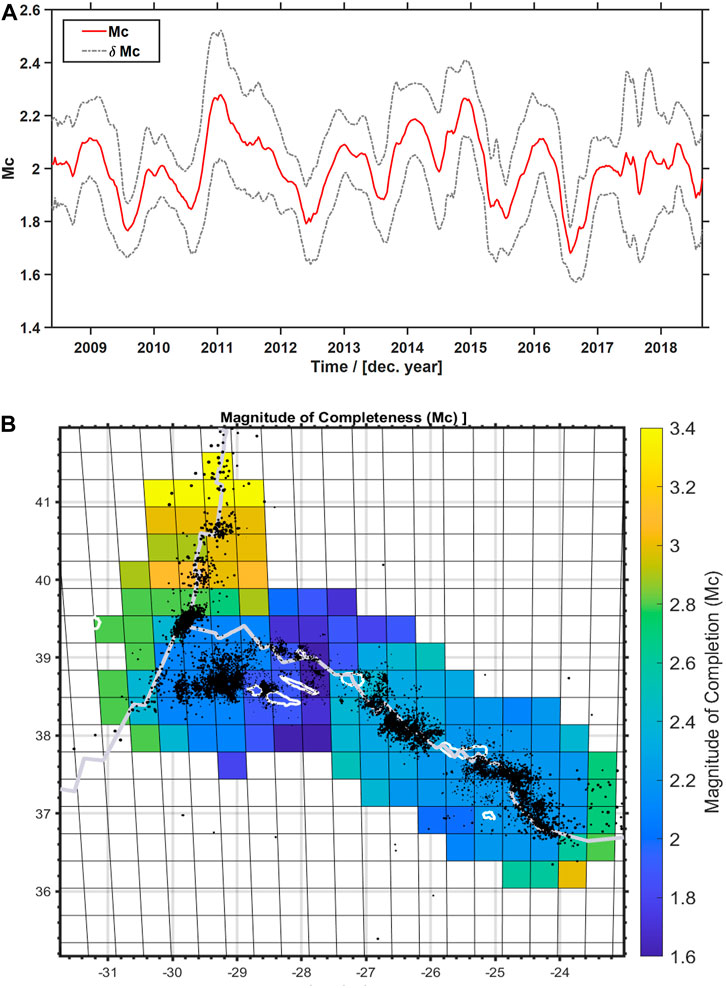
FIGURE 5. (A) Temporal variation of the magnitude of completeness for the oceanic catalogue and (B) Spatial analysis of the magnitude of completeness for the oceanic catalogue.
The temporal variability of Mc between 2008 and 2018 (Figure 5A) shows seasonal variations (summer minimums and winter maximums) within the range M1.8 - M2.3. After 2017, the variability is smoother probably due to improvements in the seismic network. We computed Mc considering all wither vs. all summer months. We obtained that overall Mc=1.9 for summer (May, Jun, Jul, Aug) and Mc=2.1 for winter (Nov, Dec, Jan, Feb) months. This variation in the magnitude of completeness reflects the detection capability of the seismic network, which is lower in the winter than in the summer due to the seismic noise generated by storms in the ocean.
Because the stations are located on the islands (see Figure 1A), it is also important to assess the spatial variation of the magnitude of completeness. As expected, Mc presents lower values close to the islands, varying from M1.4 – M2.0 (blue region in Figure 5B), and increases towards the Mid-Atlantic Ridge north of the triple junction, where fewer earthquakes are recorded and Mc > 2.5 (yellowish-green region).
Figures 6A,D show histograms of the bi-monthly number of earthquakes in the Azores ocean catalogue, both for the full and declustered catalogues. Both catalogues show a tendency for more earthquakes in the summer, mainly from May to August. Figures 6B,E show the ratio winter/summer (NDJF/MJJA), as obtained when considering only earthquakes above a given cut-off magnitude, displayed in the x-axis. It also shows the 95% and 99% confidence limits obtained from the Monte Carlo analysis of the 10.000 random catalogues. The ratios NDJF/MJJA, both for the full and declustered catalogues, remain lower than 1 for all cut-off magnitudes, indicating that more events occur in summer (MJJA) than in winter (NDJF). Considering the declustered catalogue, this difference is significant above the 99% level for low-magnitude earthquakes (M2.0 – M2.5), but also for earthquakes with magnitudes M3.3 - M4.5. Only for earthquakes with magnitudes in between these two ranges (M2.5 - M3.3) the significance of the seasonality is not confirmed as it lays inside the confidence limits, which means it may happen by chance. Below the magnitude of completeness (M < 2.0, grey region) the observed seasonality is likely related to the detection capability of the network. For M > 5, the number of earthquakes is not sufficient to provide statistically significant results.
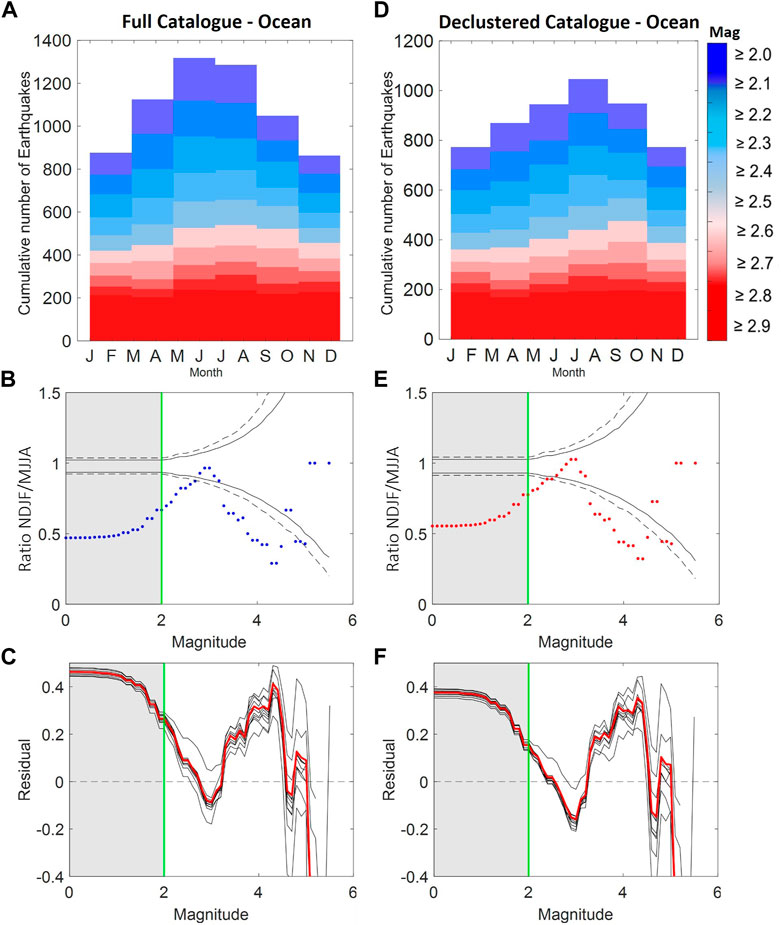
FIGURE 6. (A) Histogram of the Azores ocean seismicity (full catalogue), stacked on an annual timescale, divided into 2-month bins, considering earthquakes that occurred between 1 January 2008 and 31 December 2018. The colors of the histograms show the cut-off magnitude used in each case. (B) Observed ratio between the number of earthquakes occurring in November, December, January, February (NDJF) and those occurring in May, June, July, August (MJJA), as a function of cut-off magnitude, that is, considering only earthquakes above a given threshold magnitude. Grey shaded areas identify the region below the magnitude of completeness Mc=2.0. Solid and dashed black lines indicate the 95% and 99% confidence limits, respectively, inferred from the Monte Carlo simulation. (C) Residuals of the Jack-Knife analysis showing the difference between the 95% confidence limit and the observed NDJF/MJJA ratios. Each black line corresponds to a Jack-Knife run, obtained by removing 1 year of data from the analysis. The red line represents the residual using the whole data set. A significant seasonal variation in the number of earthquakes exists for events with magnitudes M2.0-M2.5 and mainly 3.3<M<4.5, with more earthquakes occurring in the summer (MJJA). (D–F) are like (A–C), but for the declustered ocean catalogue.
Bursts of earthquake activity may affect the seismic catalogue despite the declustering process, and so the inferred seasonal modulation may be influenced by a small number of unusual events, associated for instance to hydro-magmatic processes, which may not be effectively removed by declustering. Figure 7 shows the results of the Jack-Knife analysis performed to exclude this possibility and hence confirm that the seasonality of the catalogue is genuine. Here, we exclude one calendar year of data at a time from the full time series and repeat the analysis. The results still yield a statistically significant NDJF/MJJA seasonal variation. The results of this Jack-Knife analysis are summarized in Figures 6C,F, which display the residual between the calculated NDJF/MJJA ratio (blue and red dots in Figures 6B,E) and the 95% confidence limit.

FIGURE 7. Results of the complete Jack-Knife analysis for the declustered Azores ocean catalogue. Blue dots are the observed ratios of the number of earthquakes occurring in the period NDJF (November, December, January, February) to those occurring in MJJA (May, June, July, August) as a function of cut-off magnitude. The grey rectangle indicates magnitudes below the magnitude of completeness 2.0. Solid and dashed lines represent the 95% and 99% confidence limits estimated independently for each test. The number in the lower left corner of each panel indicates the year of data removed from the overall time interval from January 2008 to December 2018.
Following the work of Kossobokov and Panza (2022), we further investigated the existence of cyclic variations in the seismicity rate using the Kuiper test (Kuiper, 1960). We applied the Kuiper test both to the benchmark region, the New Madrid Seismic Zone (NMSZ), and to the Azores. The results are presented in Supplementary Figure S5. When the test was applied to the NMSZ, which has a bigger sample size, the statistics (V = 0.033; K=1.66 α=0.99) indicated no presence of seasonal variations with an excellent fit to the uniform distribution (high probability of 99%). This result indicates that earthquakes do not occur at preferred times, in spite of previous evidence supporting the existence of seasonal variations driven by hydrological loads (Craig et al., 2017). The results for the Azores (V=0.058; K=1.23; α=0.64) are inconclusive regarding the fit of the data to the uniform distribution, and therefore the hypothesis of periodicity cannot be accepted nor discarded. Given that for the Azores catalogue the Craig et al. (2017) methodology suggests seasonality and the Kuiper test is inconclusive, we further investigate the characteristics of the suggested seasonality in an attempt to better understand it.
In mid-latitude ocean islands, such as the Azores, the seismic noise level increases strongly in the winter due to storm waves. This noise interferes with earthquake signals, and contributes to conceal earthquakes during the winter, as documented by the temporal variability of the completeness magnitude (Figure 5A). Thus, the seasonality observed for earthquakes with magnitudes close to the magnitude of completeness (M2.0-M2.5) can be simply due to observational limitations. However, variations in the amplitude of seismic noise do not affect the detection of earthquakes with magnitudes M3.3 - M4.5 (Figure 8), which are well above the detection limit, and which are not affected by the summer/winter oscillations of the magnitude of completeness.
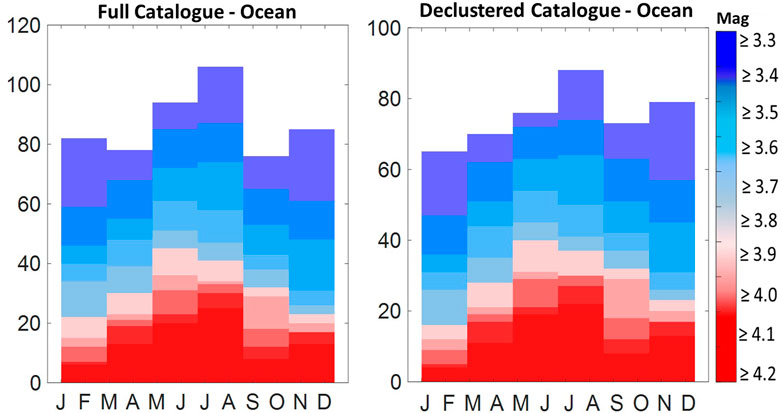
FIGURE 8. Histogram of the Azores ocean seismicity for the full and declustered catalogue, stacked on an annual timescale, divided into 2-month bins. Note that for all cut-off magnitudes in the scale bar, most of the events occur in summer (MJJA).
The seasonality observed in the seismic events is also reflected in the cumulative seismic moment, in which the seismic energy release reaches its maximum during summer months (see Supplementary Figure S6). Therefore, we conclude that the observed seasonality in the range M3.3 - M4.5 is genuine.
The same analysis, repeated for the catalogue containing only earthquakes located in the islands, shows that no significant seasonality is observed in the islands since the NDJF/MJJA ratio falls within the confidence interval limits (Supplementary Figures S2,3).
Next, we investigate whether the inferred seasonality is equally observed across all the archipelago or on the contrary whether it is particularly observed in specific sub-regions. To this end, we repeated the previous analysis, but now considering four subsets of the oceanic catalogue, which corresponded to the four earthquake clusters identified by Custódio et al. (2016) based on spatial proximity (Figure 1B).
Figure 9 shows the resulting earthquake histograms and Monte-Carlo simulations computed for each of the four clusters (A to D). The results show that the seasonality is mainly observed in clusters A and B, in which the annual component contributes the most to the total variance (see Table 1).
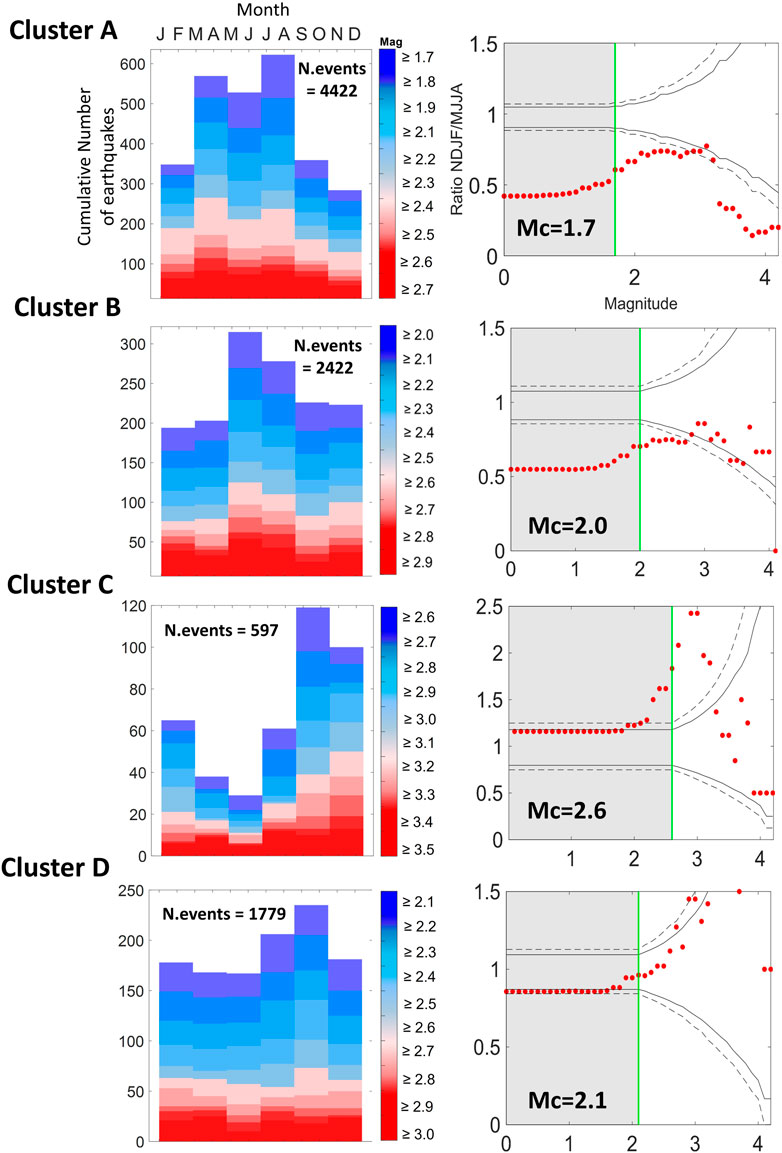
FIGURE 9. Seasonality analysis for the four clusters in the study area (A–D). The first and second columns are similar to Figures 5A,B.
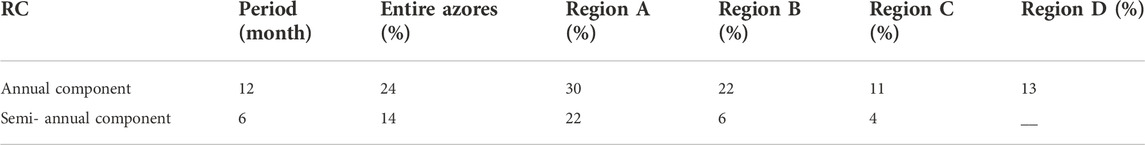
TABLE 1. Contribution of the leading RCs to the total variance of the seismicity rate.
Cluster A is located between the central Faial/Pico Islands and the Mid-Atlantic Ridge. It is the cluster with the highest number of events (4.422). The ratio NDJF/MJJA for this region is lower than 1 and above the confidence limits for all magnitudes (Mc > 1.7), suggesting a genuine seasonality of the seismicity, with more events happening in the summer. Unlike Cluster A, Cluster B (located close to the island of São Miguel) shows a significant seasonality only for magnitudes in the range M2.0 - M2.9, close to the completeness magnitude (Mc=2.0). Interestingly, Clusters A and B are the ones with more earthquakes. Cluster C (MAR) shows a reversed seasonality (more earthquakes in the winter) and cluster D (extending from Terceira to the SE) shows no seasonality. However, given the discrete seasonality of cluster B and the limited number of earthquakes in clusters C and D, we do not interpret them further in this study. A more careful inspection of these regions should wait for improved datasets.
To better understand the suspected seasonality, we analyzed the seismicity rate using Singular Spectrum Analysis (SSA), which allows us to identify periodic and quasi-periodic components. The oscillatory modes derived from the SSA corresponding to the principal components of the declustered seismicity rates (above their Mc) are listed in Table 1 for the entire Azores Ocean domain and for each one of the four clusters. The reconstructed components (RCs) corresponding to oscillations associated to a period of 12 months are the ones that contribute the most to the total variance of the time series. Clusters A and B, where the seasonality is significant, are the regions where the annual signal has the highest contribution to the total variance. For the correlation with the potential drivers, we considered Cluster A, both because it shows a better annual and semi-annual response than cluster B and because its seasonality is significant above Mc, even when considering its spatial and temporal variability.
Figure 10 shows the monthly time series of the potential external drivers considered here (SLA rate, GRACE, and OBP), the results of the SSA decomposition showing the annual and/or semi-annual components of these series, and their histograms (times series stacked in 1-month bin).
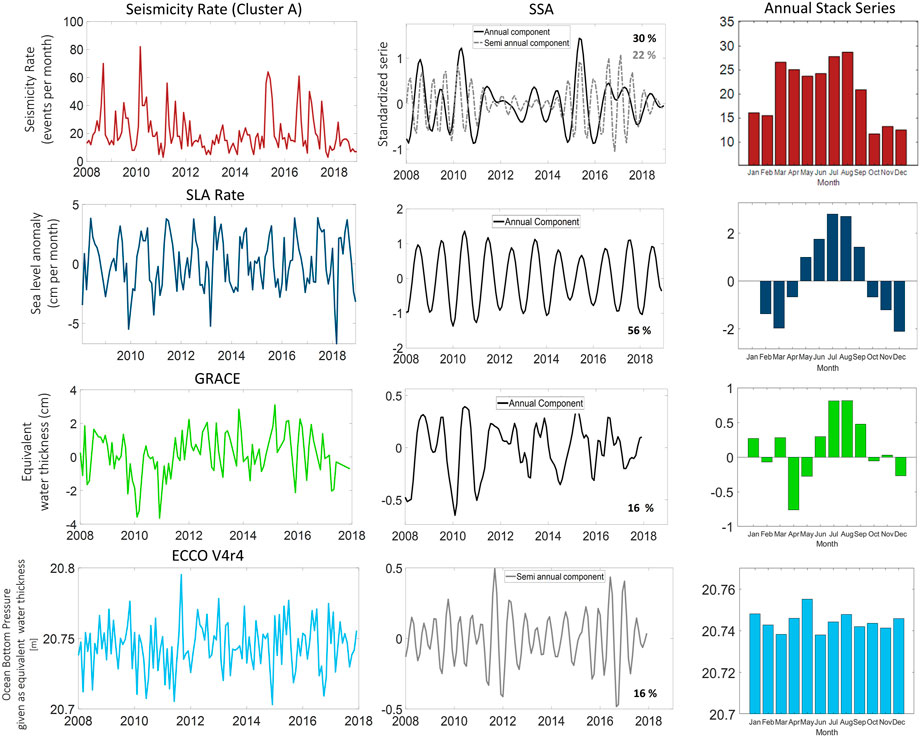
FIGURE 10. The first column shows the time-series considered: ocean seismicity rate of the cluster A (red line), sea level anomaly rate (marine blue line), GRACE (green line), and ocean bottom pressure (light blue line). The second column shows the time-series reconstruction based on the main component of the time-series revealed by SSA, namely the annual component (black lines) or semi-annual (grey line), and their contribution to the total variance in percentage. The ocean bottom pressure does not show a significant annual variability. The time-series stacked on an annual time scale are represented by the histograms.
This analysis shows that the leading mode of variability in the SLA rate and GRACE is the annual component, which contributes to 56% and 16% of their total variance, respectively. The ocean bottom pressure is the only external driver considered in the present study that shows no annual periodicity. A similar response was obtained by Gennerich and Villinger (2012). For this reason, the correlation between the seismicity rate and OBP is only computed for the semi-annual component. We attribute this result to the intrinsic variability of the OBP dataset.
The reconstructed ocean seismicity rate appears to be in phase with the SLA rate with a good correlation coefficient (Rp) of 0.64 and 1-month lag. GRACE is also in phase with the seismicity rate, exhibiting Rp=0.54 and 1-month lag.
The correlation between the seismicity rate and the OBP is low (Rp = 0.22) when considering the 11 years time length, however the time series present similarities. Repeating the analysis for time windows of approximately 3 years results in correlation coefficients of 0.37 (3 months lag), 0.41 (3 months lag), and 0.69 (1 month lag), for time windows of 2008–2011, 2012–2014 and 2015–2017, respectively. Thus, it appears that the seismicity rate and the OBP are affected in different ways by non-stationary processes that are not necessarily correlated.
All the correlation coefficients computed here were confirmed to be significant by the t-student test. The comparison between the seismicity rate, OBP and Grace is summarized in Figures 11A,B.
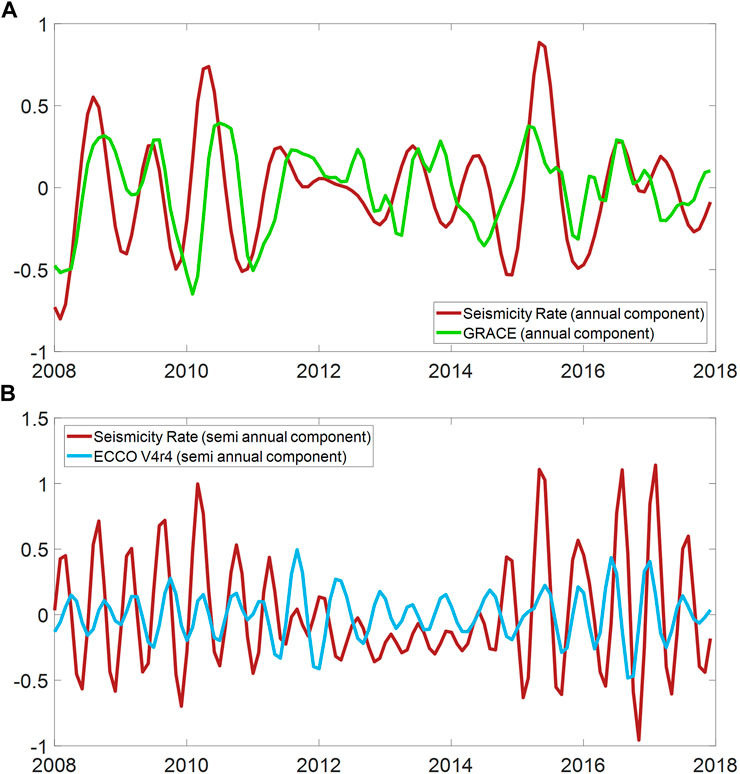
FIGURE 11. Comparison between the (A) annual components of seismicity rate and GRACE, and (B) semi-annual components of seismicity rate and OBP from ECCO V4r4 model.
Our analysis suggests a seasonality of the seismic activity in the oceanic domain of the Azores, with dominant annual and semi-annual periodicities, and a higher earthquake rate recorded during the summer months (MJJA). To explain this observation, we investigated possible drivers of the inferred earthquake seasonality. Seasonal hydrological loads commonly invoked to explain the seasonality of earthquakes in continental regions (e.g., rainfall, snow) are not plausible in the ocean. Hence, we considered water loads potentially capable of inducing seasonal oscillations in the gravitational load and ocean bottom pressure.
Transient oscillations of the gravitational load may act as seismic triggers when fault systems are near the threshold of critical stress. These oscillations originate the short-term tidal earthquake triggering that is observed at mid-ocean ridges. In these settings, enhanced seismicity is observed during low tide, at both fast and slow spreading ridges (Tanaka et al., 2002; Tan et al., 2018; Leptokarapoulos, et al., 2021). These observations have been explained by a decrease in the water overburden pressure, which causes either fault unclamping (Stroup et al., 2009; Wilcock, 2009) or magma chamber inflation and subsequent Coulomb stresses that favour slip on steeply dipping normal faults (Scholz et al., 2019). The similar tectonic framework of mid-ocean ridges and the Azores triple junction (including an extensional tectonic regime, the presence of volcanic systems and a relatively shallow bathymetry) leads us to pose the hypothesis that seismicity rate in the Azores may also be related to fluctuations in ocean mass load. It is important to note that the bathymetry in the Azores is anomalously shallow due to the presence of the Azores mantle anomaly (Luis and Neves, 2006; Silveira et al., 2006). Therefore, the dynamics of surface ocean processes causing changes in water overburden pressure is more likely to reach the seafloor than in deeper ocean. Seasonal changes in gravitational loads at the seafloor are extremely small (∼kPa) when compared to tectonic stresses (∼MPa) and therefore the fault systems that can be influenced by such small perturbations are necessarily shallow and on the verge of rupture (Neves et al., 2015; Johnson et al., 2017; Scholz et al., 2019). On the other hand, if the sensitivity of earthquakes to solid Earth tides decreases with increasing earthquake magnitude, as other studies suggest (Zaccagnino et al., 2022), it may be possible that the sensitivity to seasonal variations is more pronounced for small magnitude earthquakes. Thus, in order to better assess seasonal variations in oceanic seismicity rates we need long-term time-series of small magnitude earthquakes, which are difficult to obtain in the open ocean. The Azores archipelago, with its nine islands spread across an oceanic triple junction, provides a unique window into these processes. However, even the Azores catalogue is still affected by observational limitations related to the seismic network geometry and winter seismic noise.
Due to the lack of continuous direct observations of OBP in the Azores, we analyzed several datasets that might be considered as proxies for OBP. From the indicators considered in this study, SLA is the one that presents the strongest annual cycle. SLA variations are usually related to thermosteric effects, where the higher sea level in the summer is compensated by the lower density of the warmer water close to the surface. Ocean circulation models that rely on Boussinesq approximations predict that these variations may not reach the ocean bottom as pressure perturbations (Ponte et al., 2007; Bingham and Hughes, 2008). However, these models can only simulate consistent patterns of bottom pressure variability on monthly and longer time scales away from areas with high mesoscale eddy activity (Androsov et al., 2020). Mass conservation models indicate that wind forcing dominates regional OBP variations (Cheng et al., 2021; Niu et al., 2022), and OBP change is known to contribute to approximately 60% of the global mean sea level rise (Chambers et al., 2017). An open question that remains to be investigated is how the strong wind forcing and mesoscale eddy activity observed in the Azores is reflected into OBP variations.
We found a lag of 90° (3 months, considering the annual period of 12 months) in the correlation between the sea level anomaly and the seismicity rate, suggesting that the seismicity rate may be proportional to the SLA rate and not to its amplitude. The fact that the seismicity rate correlates well with the rate of the SLA, rather than its amplitude may be linked to different modes of response of faults when subjected to harmonic stress perturbations, as predicted by experimental and theoretical rate-and-state friction models (Beeler and Lockner, 2003; Ader et al., 2014; Heimisson and Avouac, 2019). According to these models, the period of the forcing perturbations (t) should be compared to the time over which fluctuations in seismicity rate return to the background seismicity level (
GRACE and OBP time series also show good correlations with the Azores seismicity rate (Figures 11A,B), although the relationships are not stationary and involve transient couplings and time-varying lags. Because the lags are not constant, it is still not clear if the seismicity rate is proportional to the stress rate or to the stress amplitude associated with GRACE or OBP. OBP variations at mid-high latitudes on sub-seasonal to interannual timescales are mainly affected by wind forcing (Niu et al., 2022), the hydrological cycle (Chambers et al., 2004), atmospheric pressure (Cheng et al., 2021) and baroclinic processes (Vinogradova et al., 2007). In addition to this forced variability, the OBP may have chaotic intrinsic variability in eddy-active regions, arising from non-linear ocean processes ()Zhao et al., 2021. The importance of this intrinsic variability on GRACE interpretations at different spatiotemporal scales is only now starting to be realized. Understanding the impact of this chaotic OBP variability on seafloor deformation and subsequently on ocean seismicity represents a major challenge for the knowledge of earthquake physics and remains a matter of future investigation.
This work provides an assessment of the seasonal variation of oceanic seismic rate and its relationship with existing proxies of ocean load in the Azores Triple Junction. The investigated proxies of OBP show dominant annual and semi-annual periodicities, in agreement with the inferred seasonality of the seismicity rate. However, the strong regional ocean dynamics in the Azores limits the quality of the proxies as detailed indicators of OBP. Further understanding the variation of OBP in the Azores is critical to clarify the drivers of the suggested seasonality of seismicity. Our study contributes to improving our understanding of earthquake triggering mechanisms, which in turn will contribute to better monitoring the seismicity in volcano-tectonic active systems such as the Azores. Future studies that model the solid Earth response to OBP will allow to test the hypotheses presented here to explain the observed modulation of the seismicity by seasonal oscillatory stresses.
All data used in this work are publicly available and were accessed in 2021. The Azores seismic catalogue is released as daily bulletins maintained by the Instituto Português do Mar e Atmosfera (IPMA) and can be accessed at https://www.ipma.pt/pt/publicacoes/boletins.jsp?cmbDep=sis&cmbTema=bsi&idDep=sis&idTema=510bsi&curAno=-1. Sea level anomaly data was obtained from the altimeter satellite gridded data provided by the Copernicus Marine Service (CMEMS), available at https://doi.org/10.48670/moi-00148. GRACE data is available at http://grace.jpl.nasa.gov. OBP data (ECCO Consortium et al., 2021) is hosted by the Physical Oceanography Distributed Active Archive Center (PO.DAAC), a NASA Earth Observing System Data, and can be accessed at https://doi.org/10.5067/ECG5M-OBP44.
AL, MN, and SC conceived the initial idea of the relationship between seismicity in the Azores and seasonal cycles. SC provided the seismic data. AL and MN performed the data analysis. All the authors cooperated in writing the text and preparing figures.
This work received funding from Fundação para a Ciência e a Tecnologia (FCT) under Grant Agreement No. PTDC/CTA-GEF/6674/2020.
The authors would like to acknowledge the financial support of Fundação para a Ciência e Tecnologia (FCT), the Portuguese public agency under the responsibility of the Ministry for Science, Technology and Higher Education (MCTES), through project UIDB/50019/2020–IDL. This is a contribution to the RESTLESS project PTDC/CTA-GEF/6674/2020. SD acknowledges the FCT and the European Union for their support through the fellowship SFRH/BPD/117714/2016 co-financed by the MCTES, Fundo Social Europeu (FSE), and Programa Operacional Regional Centro (Centro 2020) as well as her FCT-funded contract 2021.00876.CEECIND.
The authors declare that the research was conducted in the absence of any commercial or financial relationships that could be construed as a potential conflict of interest.
All claims expressed in this article are solely those of the authors and do not necessarily represent those of their affiliated organizations, or those of the publisher, the editors and the reviewers. Any product that may be evaluated in this article, or claim that may be made by its manufacturer, is not guaranteed or endorsed by the publisher.
The Supplementary Material for this article can be found online at: https://www.frontiersin.org/articles/10.3389/feart.2022.995401/full#supplementary-material
Ader, T. J., Lapusta, N., Avouac, J. P., and Ampuero, J. P. (2014). Response of rate-and-state seismogenic faults to harmonic shear-stress perturbations. Geophys. J. Int. 198, 385–413. doi:10.1093/gji/ggu144
Androsov, A., Boebel, O., Schröter, J., Danilov, S., Macrander, A., and Ivanciu, I. (2020). Ocean Bottom pressure variability: Can it Be reliably modeled? JGR. Oceans 125. doi:10.1029/2019JC015469
Beeler, N. M., and Lockner, D. A. (2003). Why earthquakes correlate weakly with the solid Earth tides: Effects of periodic stress on the rate and probability of earthquake occurrence. J. Geophys. Res. 108, 2391. doi:10.1029/2001jb001518
Bingham, R. J., and Hughes, C. W. (2008). The relationship between sea-level and bottom pressure variability in an eddy permitting ocean model. Geophys. Res. Lett. 35, L03602. doi:10.1029/2007GL032662
Bollinger, L., Perrier, F., Avouac, J. P., Sapkota, S., Gautam, U., and Tiwari, D. R. (2007). Seasonal modulation of seismicity in the Himalaya of Nepal. Geophys. Res. Lett. 34. doi:10.1029/2006GL029192
Bonatti, E. (1990). Not so hot "hot spots" in the oceanic mantle. Science 250 (4977), 107–111. doi:10.1126/science.250.4977.107
Caldeira, R. M. A., and Reis, J. C. (2017). The Azores confluence zone. Front. Mar. Sci. 4. doi:10.3389/fmars.2017.00037
Cannat, M., Briais, A., Deplus, C., Escartín, J., Georgen, J., Lin, J., et al. (1999). Mid-Atlantic Ridge-azores hotspot interactions: along-axis migration of a hotspot-derived event of enhanced magmatism 10 to 4 Ma ago. Earth Planet. Sci. Lett. 173, 257–269. doi:10.1016/S0012-821X(99)00234-4
Chambers, D. P., Cazenave, A., Champollion, N., Dieng, H., Llovel, W., Forsberg, R., et al. (2017). Evaluation of the global mean sea level budget between 1993 and 2014. Surv. Geophys. 38, 309–327. doi:10.1007/s10712-016-9381-3
Chambers, D. P., and Schröter, J. (2011). Measuring ocean mass variability from satellite gravimetry. J. Geodyn. 52, 333–343. doi:10.1016/j.jog.2011.04.004
Chambers, D. P., Wahr, J., and Nerem, R. S. (2004). Preliminary observations of global ocean mass variations with GRACE. Geophys. Res. Lett. 31. doi:10.1029/2004GL020461
Cheng, X., Ou, N., Chen, J., and Huang, R. X. (2021). On the seasonal variations of ocean bottom pressure in the world oceans. Geosci. Lett. 8, 29. doi:10.1186/s40562-021-00199-3
Christiansen, L. B., Hurwitz, S., Saar, M. O., Ingebritsen, S. E., and Hsieh, P. A. (2005). Seasonal seismicity at Western United States volcanic centers. Earth Planet. Sci. Lett. 240 (2), 307–321. doi:10.1016/j.epsl.2005.09.012
CMEMS. Global (1993). Ocean gridded L4 sea surface heights and derived variables reprocessed. doi:10.48670/moi-00148
Craig, T. J., Chanard, K., and Calais, E. (2017). Hydrologically-driven crustal stresses and seismicity in the new Madrid seismic zone. Nat. Commun. 8, 2143. doi:10.1038/s41467-017-01696-w
Custódio, S., Lima, V., Vales, D., Cesca, S., and Carrilho, F. (2016). Imaging active faulting in a region of distributed deformation from the joint clustering of focal mechanisms and hypocentres: Application to the Azores-Western Mediterranean region. Tectonophysics 676, 70–89. doi:10.1016/j.tecto.2016.03.013
Dias, A. (2021). Seismic sequences induced by water loads in Azores. Faro, Portugal: Universidade do Algarve. [dissertation/master's thesis] Available at: http://hdl.handle.net/10400.1/17794.
ECCO Consortium Fukumori, I., Wang, O., Fenty, I., Forget, G., Heimbach, P., and Ponte, R. M. (2021). ECCO Ocean Bottom pressure - monthly mean 0.5 degree (version 4 release 4). USA. Ver. V4r4. PO.DAAC, CA. doi:10.5067/ECG5M-OBP44
Gennerich, H. H., and Villinger, H. (2012). Deciphering the ocean bottom pressure variation in the Logatchev hydrothermal field at the eastern flank of the Mid-Atlantic Ridge. Geochem. Geophys. Geosyst. 12. doi:10.1029/2010GC003441
Gutenberg, B., and Richter, C. F. (1944). Frequency of earthquakes in California. Bull. Seismol. Soc. Am. 34, 185–188. doi:10.1785/BSSA0340040185
Hanson, R. T., Newhouse, M. W., and Dettinger, M. D. (2004). A methodology to asess relations between climatic variability and variations in hydrologic time series in the southwestern United States. J. Hydrology 287, 252–269. doi:10.1016/j.jhydrol.2003.10.006
Heimisson, E. R., and Avouac, J-P. (2019). Analytical prediction of seismicity rate due to tides andOther oscillating stresses. Geophys. Res. Lett. 47, 6333–6340. doi:10.1029/2020GL090827
Instituto Português Do Mar E Da Atmosfera, I.P (2006). Portuguese national seismic network [Data set]. International Federation of Digital Seismograph Networks. doi:10.7914/SN/PM
Johnson, C. W., Fu, Y., and Bürgmann, R. (2017). Stress models of the annual hydrospheric, atmospheric, thermal, and tidal loading cycles on California faults: Perturbation of background stress and changes in seismicity. J. Geophys. Res. Solid Earth 122, 10, 605–610, 625. doi:10.1002/2017JB014778
Kossobokov, V. G., and Panza, G. F. (2022). A myth of preferred days of strong earthquakes? Seismol. Res. Lett. XX, 948–955. doi:10.1785/0220190157
Kuiper, N. H. (1960). Tests concerning random points on a circle. Indag. Math. 63, 38–47. doi:10.1016/s1385-7258(60)50006-0
Leptokaropoulos, K., Harmon, N., Hicks, S. P., Rychert, C. A., Schlaphorst, D., and Kendall, J. M. (2021). Tidal triggering of microseismicity at the equatorial mid-Atlantic Ridge, inferred from the PI-lab experiment. JGR. Solid Earth 126. doi:10.1029/2021JB022251
Lordi, A. L., Neves, M. C., Custódio, S., and Dumont, S. (2022). Evidence of earthquake seasonality in the Azores triple junction. Universidade de Lisboa: Instituto Dom Luiz. [Manuscript submitted for publication].
Lourenço, N., Miranda, J. M., Luis, J. F., Ribeiro, A., Mendes Victor, L. A., Madeira, J., et al. (1998). Morpho-tectonic analysis of the Azores Volcanic Plateau from a new bathymetric compilation of the area. Mar. Geophys. Res. (Dordr). 20, 141–156. doi:10.1023/A:1004505401547
Luis, J. F., Miranda, J., Galdeano, A., Rossignol, J., and Mendes Victor, L. (1994). The Azores triple junction evolution since 10 Ma from an aeromagnetic survey of the Mid-Atlantic Ridge. Earth Planet. Sci. Lett. 125, 439–459. doi:10.1016/0012-821X(94)90231-3
Luis, J. F., and Neves, M. C. (2006). The isostatic compensation of the Azores Plateau: A 3D admittance and coherence analysis. J. Volcanol. Geotherm. Res. 156, 10–22. doi:10.1016/j.jvolgeores.2006.03.010
Martini, F., Bean, C. J., Saccorotti, G., Viveiros, F., and Wallenstein, N. (2009). Seasonal cycles of seismic velocity variations detected using coda wave interferometry at Fogo volcano, São Miguel, Azores, during 2003-2004. J. Volcanol. Geotherm. Res. 181, 231–246. doi:10.1016/j.jvolgeores.2009.01.015
Mason, B. G., Pyle, D. M., Dade, W. B., and Jupp, T. (2004). Seasonality of volcanic eruptions. J. Geophys. Res. 109. doi:10.1029/2002JB002293
Matthews, A. J., Barclay, J., Carn, S., Thompson, G., Alexander, J., Herd, R., et al. (2002). Rainfall-induced volcanic activity on Montserrat. Geophys. Res. Lett. 29 (13), 22-1–22-4. doi:10.1029/2002GL014863
Mcnutt, S. R., and Beavan, R. J ( (1987). Eruptions of pavlof volcano and their possible modulation by ocean load and tectonic stresses. J. Geophys. Res. 92, 11509–11523. doi:10.1029/jb092ib11p11509
Morgan, W. J. (1971). Convection plumes in the lower mantle. Nature 230, 42–43. doi:10.1038/230042a0
Neves, M. C., Cabral, J., Luttrell, K., Figueiredo, P., Rockwell, T., and Sandwell, D. (2015). The effect of sea level changes on fault reactivation potential in Portugal. Tectonophysics 658, 206–220. doi:10.1016/j.tecto.2015.07.023
Niu, Y., Cheng, X., Qin, J., Ou, N., Yang, C., and Huang, D. (2022). Mechanisms of interannual variability of Ocean Bottom pressure in the southern Indian ocean. Front. Mar. Sci. 9, 916592. doi:10.3389/fmars.2022.916592
Petrosino, S., Cusano, P., and Madonia, P. (2018). Tidal and hydrological periodicities of seismicity reveal new risk scenarios at Campi Flegrei caldera. Sci. Rep. 8, 13808. doi:10.1038/s41598-018-31760-4
Ponte, R. M., Quinn, K. J., Wunsch, C., and Heimbach, P. (2007). A comparison of model and GRACE estimates of the large-scale seasonal cycle in ocean bottom pressure. Geophys. Res. Lett. 34. doi:10.1029/2007GL029599
Quenouille, Maurice H. (1956). Notes on bias in estimation. Biometrika 43 (3–4), 353–360. doi:10.1093/biomet/43.3-4.353
Reasenberg, P. (1985). Second-order moment of central California seismicity, 1969-1982. J. Geophys. Res. 90, 5479–5495. doi:10.1029/jb090ib07p05479
Sartori, R., Torelli, L., Zitellini, N., Peis, D., and Lodolo, E. (1994). Eastern segment of the Azores-Gibraltar line (central-eastern atlantic): An oceanic plate boundary with diffuse compressional deformation. Geol. 22, 555–558. doi:10.1130/0091-7613(1994)022<0555:esotag>2.3.co;2
Schilling, J. G. (1975). Azores mantle blob: Rare-Earth evidence. Earth Planet. Sci. Lett. 25, 103–115. doi:10.1016/0012-821X(75)90186-7
Scholz, C. H., Tan, Y. J., and Albino, F. (2019). The mechanism of tidal triggering of earthquakes at mid-ocean ridges. Nat. Commun. 10, 2526. doi:10.1038/s41467-019-10605-2
Silveira, G., Stutzmann, E., Davaille, A., Montagner, J.-P., Mendes-Victor, L., and Sebai, A. (2006). Azores hotspot signature in the upper mantle. J. Volcanol. Geotherm. Res. 156, 23–34. doi:10.1016/j.jvolgeores.2006.03.022
Simão, N., Escartín, J., Goslin, J., Haxel, J., Cannat, M., and Dziak, R. (2010). Regional seismicity of the Mid-Atlantic Ridge: Observations from autonomous hydrophone arrays. Geophys. J. Int. 183, 1559–1578. doi:10.1111/j.1365-246X.2010.04815.x
Sinharay, S. (2010). “An overview of statistics in education,” in International encyclopedia of education. Editor P. Peterson. 3rd Edition (Amsterdam: Elsevier), 1–11. doi:10.1016/B978-0-08-044894-7.01719-X
Stroup, D. F., Tolstoy, M., Crone, T. J., Malinverno, A., Bohnenstiehl, D. R., and Waldhauser, F. (2009). Systematic along-axis tidal triggering of microearthquakes observed at 9°50′N East Pacific Rise. Geophys. Res. Lett. 36, L18302. doi:10.1029/2009GL039493
Tan, Y. J., Tolstoy, M., Waldhauser, F., and Bohnenstiehl, D. W. R. (2018). Tidal triggering of microearthquakes over an eruption cycle at 9°50’N east pacific rise. Geophys. Res. Lett. 45, 1825–1831. doi:10.1002/2017GL076497
Tanaka, S., Ohtake, M., and Sato, H. (2002). Spatio-temporal variation of the tidal triggering effect on earthquake occurrence associated with the 1982 South Tonga earthquake of Mw 7.5. Geophys. Res. Lett. 29, 3-13–3-44. doi:10.1029/2002gl015386
Tapley, B. D., Bettadpur, S., Watkins, M., and Reigber, C. (2004). Time-variable gravity from GRACE: First results. Geophys. Res. Lett. 31. doi:10.1029/2004GL019779
Tolstoy, M. (2015). Mid-ocean ridge eruptions as a climate valve. Geophys. Res. Lett. 42, 1346–1351. doi:10.1002/2014GL063015
Tolstoy, M., Vernon, F. L., Orcutt, J. A., and Wyatt, F. K. (2002). Breathing of the seafloor: Tidal correlations of seismicity at Axial volcano. Geol. 30 (6), 503–506. doi:10.1130/0091-7613(2002)030<0503:botstc>2.0.co;2
Tukey, J. W. (1958). A smooth invertibility theorem. Ann. Math. Stat. 29, 581–584. doi:10.1214/aoms/1177706635
Ueda, T., and Kato, A. (2019). Seasonal variations in crustal seismicity in san-in district, southwest Japan. Geophys. Res. Lett. 46, 3172–3179. doi:10.1029/2018GL081789
Vautard, R., Yiou, P., and Ghil, M. (1992). Singular-spectrum analysis: A toolkit for short, noisy chaotic signals regional climate change over China view project geophysical turbulence view project physicai singular-spectrum analysis: A toolkit for short, noisy chaotic signals. Available at: https://www.researchgate.net/publication/220049096.
Vinogradova, N. T., Ponte, R. M., and Stammer, D. (2007). Relation between sea level and bottom pressure and the vertical dependence of oceanic variability. Geophys. Res. Lett. 34, L03608. doi:10.1029/2006GL028588
Wiemer, S. (2001). A software package to analyze seismicity: Zmap. Seismol. Res. Lett. 72 (3), 373–382. doi:10.1785/gssrl.72.3.373
Wiese, D. N., Yuan, D.-N., Boening, C., Landerer, F. W., and Watkins, M. M. (2018). JPL GRACE mascon ocean, ice, and hydrology equivalent water height release 06 coastal resolution improvement (CRI) filtered version 1.0. Ver. 1.0. CA, USA: PO.DAAC. doi:10.5067/TEMSC-3MJC6
Wilcock, W. S. D. (2009). Tidal triggering of earthquakes in the northeast Pacific ocean. Geophys. J. Int. 179, 1055–1070. doi:10.1111/j.1365-246X.2009.04319.x
Wilcock, W. S. D. (2001). Tidal triggering of microearthquakes on the Juan de Fuca ridge. Geophys. Res. Lett. 28, 3999–4002. doi:10.1029/2001GL013370
Zaccagnino, D., Telesca, L., and Doglioni, C. (2022). Correlation between seismic activity and tidal stress perturbations highlights growing instability within the brittle crust. Sci. Rep. 12, 7109. doi:10.1038/s41598-022-11328-z
Zhang, K., Zhu, X. H., and Zhao, R. (2018). Near 7-day response of ocean bottom pressure to atmospheric surface pressure and winds in the northern South China Sea. Deep Sea Res. Part I Oceanogr. Res. Pap. 132, 6–15. doi:10.1016/j.dsr.2017.12.004
Keywords: oceanic seismicity, seasonal modulation, azores, volcano-tectonic systems, mid-atlantic ridge
Citation: Lordi AL, Neves MC, Custódio S and Dumont S (2022) Seasonal modulation of oceanic seismicity in the azores. Front. Earth Sci. 10:995401. doi: 10.3389/feart.2022.995401
Received: 15 July 2022; Accepted: 22 November 2022;
Published: 08 December 2022.
Edited by:
Maria Mesimeri, ETH Zurich, SwitzerlandReviewed by:
Georgios Michas, National and Kapodistrian University of Athens, GreeceCopyright © 2022 Lordi, Neves, Custódio and Dumont. This is an open-access article distributed under the terms of the Creative Commons Attribution License (CC BY). The use, distribution or reproduction in other forums is permitted, provided the original author(s) and the copyright owner(s) are credited and that the original publication in this journal is cited, in accordance with accepted academic practice. No use, distribution or reproduction is permitted which does not comply with these terms.
*Correspondence: Ana L. Lordi, YTY2NjI3QHVhbGcucHQ=
Disclaimer: All claims expressed in this article are solely those of the authors and do not necessarily represent those of their affiliated organizations, or those of the publisher, the editors and the reviewers. Any product that may be evaluated in this article or claim that may be made by its manufacturer is not guaranteed or endorsed by the publisher.
Research integrity at Frontiers
Learn more about the work of our research integrity team to safeguard the quality of each article we publish.