 Dong Hu
 Jingzhi Guo*
95% of researchers rate our articles as excellent or good
Learn more about the work of our research integrity team to safeguard the quality of each article we publish.
Find out more
ORIGINAL RESEARCH article
Front. Earth Sci. , 26 September 2022
Sec. Environmental Informatics and Remote Sensing
Volume 10 - 2022 | https://doi.org/10.3389/feart.2022.993782
This article is part of the Research Topic Advances and Applications of Non-Explosive Rock Fracturing in Exploitation of Geological Resources View all 5 articles
There are many factors that affect an airlift pump for dredging. In actual applications, if these factors cannot be fully considered, the performance of the airlift pump will be reduced. In view of this, based on the critical model of the water–solid two-phase flow and the gas holding model, a critical model of the gas–water–solid three-phase flow is proposed. The research results show that, compared with the two-phase flow, the critical water flow rate for lifting solids in the three-phase flow is always smaller. Therefore, it is necessary to consider the static chip retention force so that the critical model in the two-phase flow can be modified. It shows that the static chip retention effect is opposite to the “start” of the particle. Not only that, but also discussed are the critical conditions of solid particles or vertical lifting water from a practical point of view. The results show that solid particles will not affect the critical air flow rate of pumping water. However, the size and location of the solid particles affect the critical air flow rate.
According to relevant research, it is clear that for a traditional mud pump, there will be blockage and wear during the dredging process because the flow cross-section of the blade is so large that its concentration is limited. Compressed air serves as the power source for air transportation, which can pump and transport liquid or mud through the combination of buoyancy, friction, and vacuum effects (Fu and Yan, 2004; Pei and Liao, 2010). To the best of our knowledge, the airlift system has many advantages, such as low cost, easy operation, simple configuration, no pollution to the environment, and less blockage (Chen et al., 2009; Pei and Tang, 2015). Therefore, it can be considered that the air transportation system has great potential for river and lake dredging.
Many scholars have carried out research, such as numerical simulation of the mixed fluid in the airlift system and analysis of the relationship between the injection parameter and the performance so that it has a higher matching, and thus, the performance of mud airlift is improved. Huang et al. (2017) performed a numerical simulation to study the effect of the nozzle type, injection depth, and injection hole diameter on the airlift pump, thereby improving the performance of the airlift pump. Alasadi and Habeeb (2017) then performed a numerical simulation study on the airlift pump with traditional and improved air injection devices under different intake flow rates, and the results show that the airlift pump with an improved air injection device can improve performance at higher intake flow rates. In actual operation, sufficient attention should be paid to the critical point of the solid particles carried in the bottom layer. If this is not given, it will cause blockage in the pump which will affect the performance and cause safety accidents in severe cases. When researchers study critical characteristics, they are mainly conducted from the perspective of experiments and rarely involve theoretical models. Taleb and Al-Jarrah (2017) performed an experiment to study the effect of the submergence ratio and air injection hole diameter on the performance of the airlift pump. The results showed that the performance of the airlift pump increased as the submergence ratio increased, while an injection hole diameter of 4 mm gave the highest performance. Oueslati A performed an experiment under many operating conditions, and proposed a theoretical model taking into account the air humidification and liquid temperature. The results showed that the proposed model is in good agreement with the experimental results. Fujimoto and Murakami studied the critical conditions of a mud airlift pump and obtained a model of the critical water flow rate for lifting solid particles at the bottom of the pump. By using this model, results that are consistent with reality can be obtained (Fujimoto et al., 2004). On this basis, our research team expanded the suction distance and obtained the rule of critical particle detonation. It needs to be clear that the aforementioned studies are only for water–solid two-phase flow (Tang et al., 2012). Fujimoto and Nagatani then used the aforementioned working conditions to analyze the critical conditions of particles transported in the three-phase flow. The research results show that in the three-phase flow, the starting of particles is easier, but the corresponding theoretical model is not proved (Fujimoto et al., 2005). In application, because of the constraint pressure (Pei et al., 2010; Hu et al., 2013), the particles are often compressed when they are deposited at the bottom, which makes it difficult to start the particles. At the same time, the airlift is caused to fail, but scholars rarely conduct research on this aspect.
In this study, the research is carried out. The interface selects the inlet of the airlift pump to divide the mixed water into two fluid phases, one is a water–solid two-phase flow, and the other is a gas–water–solid three-phase flow. To satisfy the actual dredging, the medium used in this study is round river sand. Based on this, the critical conditions of the three-phase flow and two-phase flow are analyzed, and the relationship between the key condition and chip compaction is analyzed. For discussion, the research result of this study can provide a reference for other researchers to study related theories.
Since the particles have different forms of force in liquid–solid two-phase flow and in gas–liquid–solid three-phase flow, the critical models are investigated separately.
Figure 1 shows the position and force of the particles in the water–solid two-phase flow. Assuming that the particle is spherical and its initial velocity is zero, according to Newton’s second law, there are
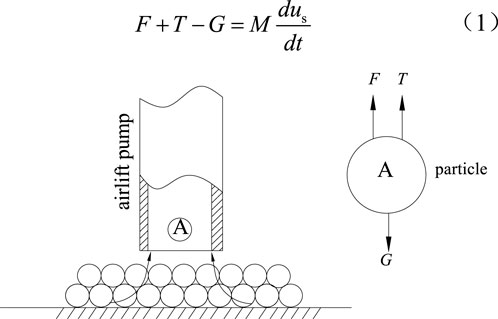
FIGURE 1. Position and force of particles in the water–solid two-phase flow.
and
where F,T, and G are buoyancy, drag, and gravity of the particle, respectively, N; M is the mass of the particle, kg; dS is the diameter of particle, m; and CD is the resistance coefficient.
Substituting Eqs 2–5 into Eq. 1 leads to
Since the instantaneous speed of the particle at the moment is zero, we can obtain uS=0 and duS/dt=0. Then the critical water flow rate can be calculated by the following equation.
Here, uL,LS,cri is the critical water flow rate for rising particles in the water–solid two-phase flow, m/s.
It is assumed that the volume of a single particle in the water–solid two-phase flow is negligible because of its very small size, then βS,LS≈0 and βL,LS≈1, we have,
Therefore,
In Eq. 9, JL,LS,cri is the critical volumetric flux of the water flow for rising particles in the water–solid flow, m/s.
The particle is located in the center of the tube in the gas–water–solid three-phase flow (Figure 2), and the distance from the gas port is 2 mm. When force is applied to the particle, there are
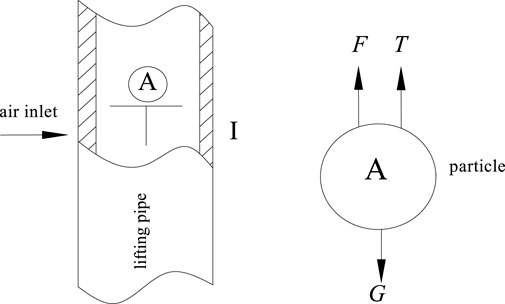
FIGURE 2. Position and force of particles in the air–water–solid three-phase flow.
and
and
where uGL is the rate of the gas–water flow, m/s; and ρGL is the density of the gas–water flow, kg/m3.
In the gas–liquid–solid three-phase flow, due to the small size of the single particle, the volume fraction of the solid flow can also be ignored, so we can obtain
Because the volume fraction of the solid flow cannot be calculated in the calculation, the mixed water can be regarded as a gas–water two-phase flow. On the basis of full research and analysis of the research results of Tang et al. (2012), the volume fraction of airflow can be clarified.
In Eq. 14
and
therefore,
Considering duS/dt = 0, the critical volumetric flux of water flow for rising particles is written as follows.
Therefore, it is clear that for the particles to start smoothly, the following requirements need to be met,
Substituting Eqs 12–16 into Eq. 18, the critical water flow rate for rising particles in the three-phase flow can be obtained. The parameters for calculating the critical model are shown in Table 1.

TABLE 1. Parameters used in the calculation of the critical model.
Figure 3 shows the calculation results of the key model, where calculated JG is equal to JG,cri. It is clear that in the water–solid two-phase flow, the critical water flow rate does not change. Therefore, JL,LS,cri ≥ JL,3,cri can be obtained. Based on this, it is possible to clarify that the condition under which the particles are lifted smoothly from the beginning of the entire flow is JL ≥ JL,LS,cri, and it will affect the critical starting condition of the particles. Based on the existence of air expansion, the mixed fluid in the gas–water–solid three-phase flow has a lower density, so JL,3,cri is smaller than JL,LS,cri, compared with the water–solid two-phase flow. Therefore, it is clear that to make the start of the particles easier, the length of the two-phase flow should be reduced. This conclusion is consistent with that of other researchers, that is, the performance of air transport can be improved by moving the intake position downward (Hattaa et al., 1998; Mahrous, 2013).
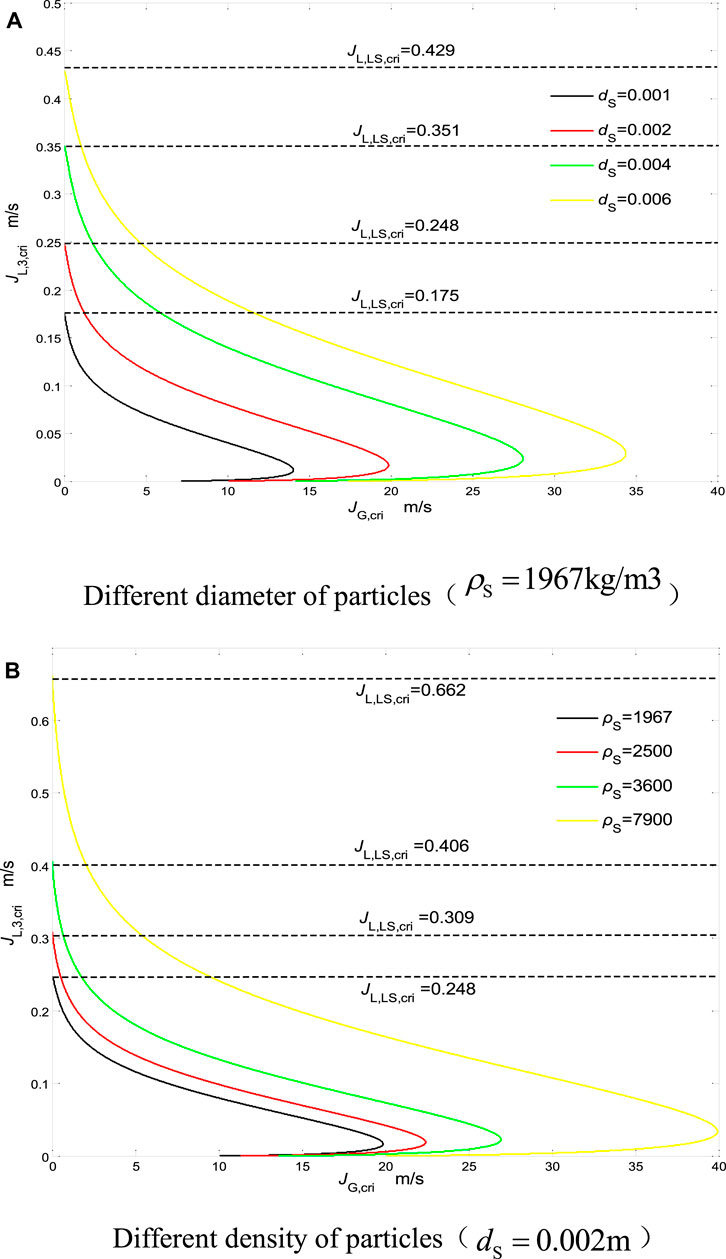
FIGURE 3. Calculated results of critical model (A) different diameter of particles; (B) different density of particles.
Analyzing Figure 3, it is clear that when JG,cri is increased, JL,3,cri will be reduced. After reaching the inflection point, JL,3,cri will decrease as JG,cri decreases. Therefore, by increasing JG,cri, the density of the mixed fluid can be reduced, so that the start of the particles becomes easier. Near the inflection point, because the gas value is large, the movement of the particles is mainly controlled by the water phase. From this, it can be clear that the performance of the airlift will be affected by working conditions, and it is necessary to reduce the air mass and then change the flow pattern in the tube, so that it can change from circular flow to elastic flow. It needs to be clear that this change is irreversible, that is, after reaching the inflection point, JL,3,cri will decrease with the decrease of JG,cri. According to the related research results (Hanafizadeh et al., 2011; Tang et al., 2016), the critical airlift of mud is opposite to the existence of the inflection point. In engineering applications, the inflection point needs to be moved down as much as possible. Comparing and analyzing the critical strength of particles with different diameters can be clear (Figure 3A). When the particle diameter is increased, JL,LS,cri and JL,3,cri will rise accordingly. The reason for this phenomenon is that increasing the particle diameter will increase the solid phase slip. In Figure 3B, it is clear that when the particle density increases, JL,LS,cri and JL,3,cri will rise accordingly. The reason for this phenomenon is that increasing the average density of the mixed water will reduce buoyancy. In addition, when increasing the particle density and diameter, the inflection point will move to the right (Kassab et al., 2007).
In the aforementioned model, particles need to be placed in the tube. However, in practical application, the particles will first deposit at the bottom of the water, and then they will be affected by the static chip retention effect. Obviously, the working conditions are different from those assumed by previous research. To be consistent with the practical situation, the research object selected in this study is particle B which is closest to the bottom of the pump. Figure 4 shows the force acting on particle B.
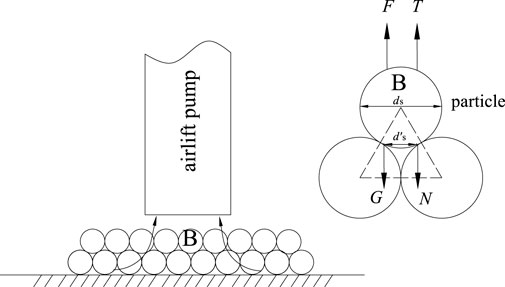
FIGURE 4. Force of the particle in the case of static chip retention effect.
Suppose the particles are regular balls of equal diameter by ignoring surface defects, which are arranged in close order. Then Eq. 20 is derived by analyzing the force acting on particle B.
where N is the static chip retention force of the particle, and it is defined as
where L2 and L3 are the distance from the air inlet to the bottom of the pump and from the air inlet to the horizontal plane, respectively, m.
Substituting Eqs 2–5 and Eq. 21 into Eq. 20 gives
where
The instantaneous rate, at the moment when the particle is lifted, can still be regarded as zero. We get
Since only single particle movement is considered during lifting, the volume fraction of the solid in the tube can be ignored, and the immersion ratio γ = L3/L1 is introduced, then Eq. 23 leads to
where L1 is the distance from the air inlet to the exit of tube, m.
Compared with the critical water flow model[30] we constructed, it is clear that in this model, we only consider the static chip retention force (static chip retention effect) of the particles, which is in line with the actual engineering. Using the relevant parameters shown in Table 2 to calculate, the results of the model can be clarified (Figure 5). It is clear that with the increase of particle diameter dS and density ρS, the JL,LS,cri only shows a slight upward. On the contrary, when the immersion rate γ is continuously increased, JL,LS,cri will be significantly increased. If the particle density and size are smaller, then the immersion rate γ will control the start of the particle. Analyzing Figure 5, it can be clear that if the static chip retention effect is maintained, JL,LS,cri will be increased quickly. It is concluded that for small and medium particles, the airlift performance will be affected by the static chip retention effect.
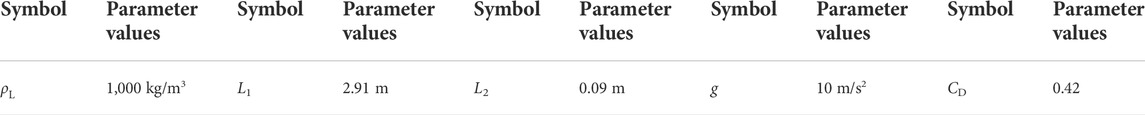
TABLE 2. Parameters used in the calculation of the critical model by considering the static chip retention effect.
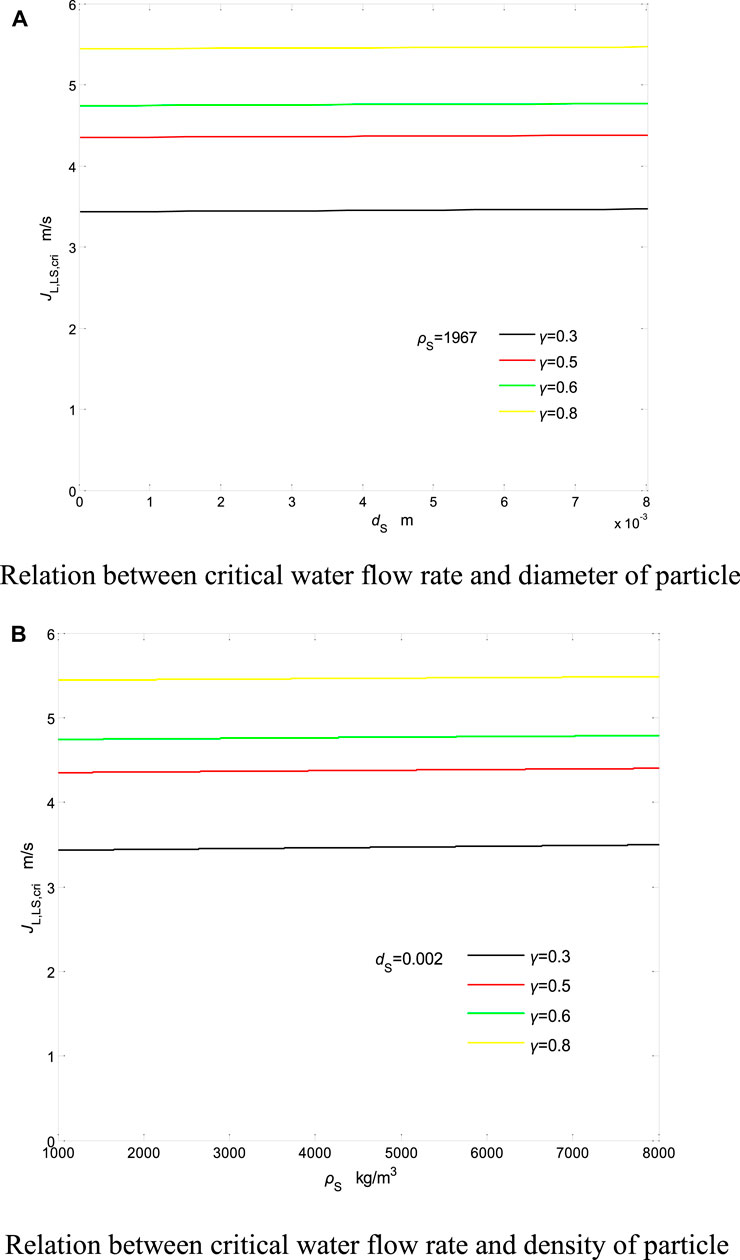
FIGURE 5. Calculated result of critical model in the case of static chip retention effect (A) relation between critical water flow rate and diameter of particle; (B) relation between critical water flow rate and density of particle.
It can be considered that in areas such as oceans and lakes, because of their greater depth, the particles have a larger static chip retention force, which causes the start to fail. If the particles are compacted, then it will prevent airlift dredging. Therefore, it is necessary to impact the sand layer before airlift, so that the static chip retention effect can be reduced.
Through the aforementioned theoretical model analysis, it can be concluded that particles are easier to start in the gas–liquid–solid three-phase flow than in the liquid–solid two-phase flow. To verify this theory, critical experiments are carried out in two-phase flow tubes and three-phase flow tubes with river sand particles as the lifting medium, as shown in Figure 6.
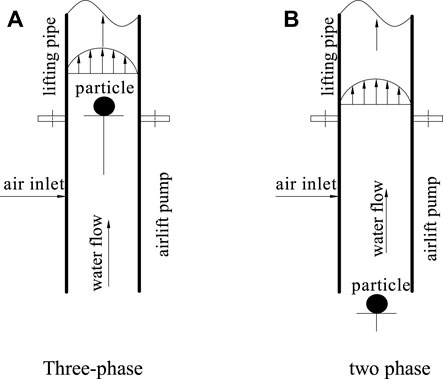
FIGURE 6. Experimental setup for measuring critical condition of particle (A) three-phase; (B) two phase.
First, the bracket is placed 5 mm from the entrance so that it is in the center of the tube. Second, particles are placed in the center of the tube to adjust the immersion depth so that the immersion rate can match the preset value. Third, the valve of the air compressor is slowly opened to allow the airflow to rise slowly. When the water at the outlet of the tube overflows, the valve is immediately closed. At this time, the critical water flow rate of the lifting solid JG,L,3,Cri can be calculated. While increasing the air volume, the distance between the particles and the support frame will gradually increase. At this time, the critical water flow rate JL,3,Cri and the corresponding air volume value JG,S,3,Cri can be calculated. In the two-phase flow experiment, a bracket is placed 5 mm below the air inlet, and the particles are placed on the support frame. Under this condition, the critical values JG,L, LS,Cri, JG,S,LS,Cri, and JL,LS,Cri of the two-phase flow are recalculated. Table 3 shows the calculation results.
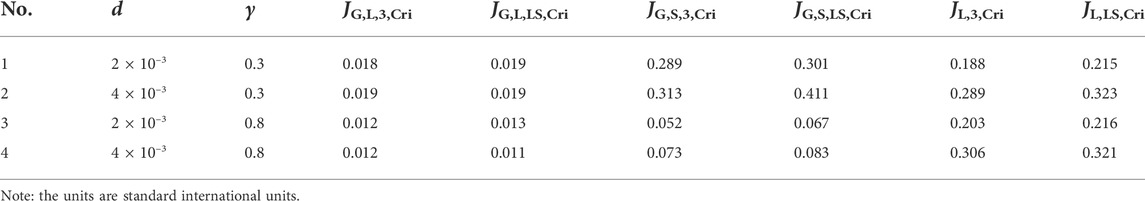
TABLE 3. Experimental results of the critical condition of the slurry airlift system.
If the immersion rate does not change, there is no significant difference between the critical values JG,L,LS,Cri of the two-phase flow and the critical values JG,L,3,Cri of the three-phase flow. When the immersion rate is equal to 0.8 and 0.3, respectively, the critical value of JG,L,LS,Cri and JG,L,3,Cri are approximately equal to 0.012 m/s and 0.019 m/s, respectively. Therefore, it can be considered that the key characteristics of the water–gas lift will not be affected by the position of the particles in the tube or the size of the particles. However, it needs to be clear that there are differences between the key characteristics of a slurry water–gas lift and the key characteristics of a gas lift. Compared with JG,S,LS,Cri of the corresponding particles in the two-phase flow, the critical air value of the particles in the three-phase flow, JG,S,3,Cri, is significantly lower, and when the temperature is increased, it will increase accordingly. Analyzing Table 3 shows that under the established conditions, compared with JL,LS,Cri, JL,3,Cri are always lower. Therefore, it can be considered that the water–solid two-phase flow has a greater impact on the critical characteristics of air transportation.
Comparing the experimental results and the calculated results, it is clear (as shown in Figure 7) that the experimental value of the critical water flow rate for lifting the solid is lower than that of the calculation result when only lifting the particles. This situation occurs because the tube and the pump will coalesce, expand, rupture, and re-aggregate. The bubbles will move periodically, causing mixed fluid instability along the axial direction when it rises. Ascending, its oscillation characteristic is ascending-descending-ascending, and compared with descending motion, the ascending motion is more intense. According to the results of other researchers and ours, it can be inferred (Hu et al., 2012; Hu et al., 2015) that the basic feature of a slurry airlift is the oscillating upward motion of the mixed fluid, which will cause a transient vacuum, so there will be resistance. If the particle’s fluctuation reaches its peak, then the particle’s activation state can be advanced. Figure 7 also shows that if the immersion rate is lower, the mixed fluid will have more prominent oscillation characteristics, which will result in a higher instantaneous vacuum. To confirm these phenomena, high-speed cameras can be used.
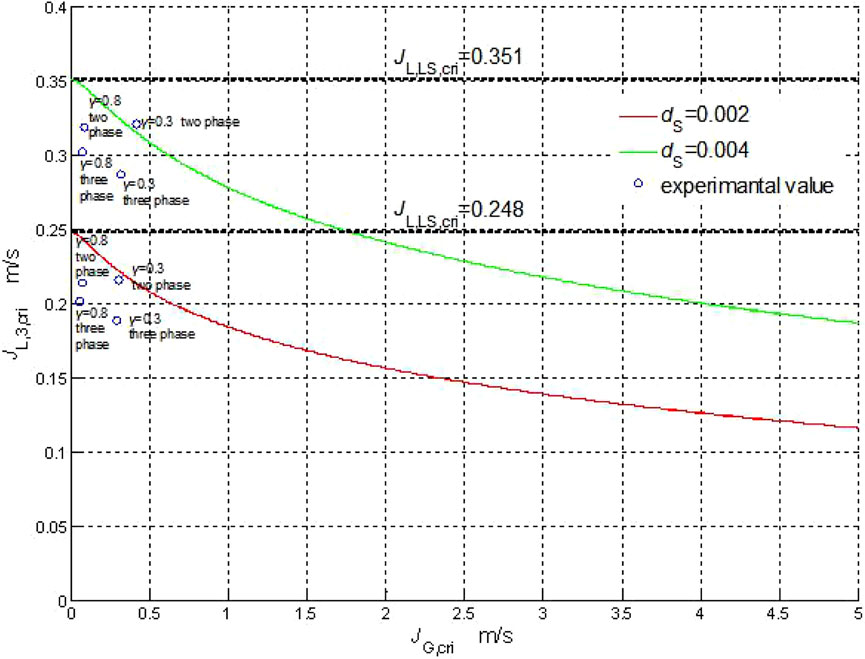
FIGURE 7. Comparison between calculated and measured critical conditions.
It can also be calculated from Table 3 that when the diameter of the particle is 0.004 m and the immersion rate is 0.3, the difference between the calculated results of JL,LS,Cri and JL,3,Cri and those of the experimental results is about 12.5% and 14.2%, respectively. The corresponding error of the other conditions is not more than 15.3%. So, we can conclude that the theoretical model built in this study has high prediction accuracy.
Due to the effect of gravity, the particles will be affected by the static chip retention effect when they are deposited at the bottom of the water. When we are conducting research, we put sand particles on the bottom of the pump in advance (Figure 4). At this time, the sand will be closely arranged and in a double-stacked state. To maintain the static chip retention effect, the particles need to be placed in the water continuously for 7 days. Then we adjusted the water tank and preset the immersion rate. The particles in the center of the upper layer are the object, and the key experimental steps are repeated. Based on this, we can get JG, L, LS, Cri, JG, S, LS, Cri, and JL, LS, Cri. The research results show that the particles cannot start when the air compressor valve is adjusted from close to the maximum gas flow. Therefore, it can be considered that the static chip retention effect is obvious at the bottom. Even if the pump has a large water value and the resistance imposed on the particles is small, the static chip retention force cannot be overcome, thus making it impossible to carry out an airlift. To clarify the experimental results of JL,LS,Cri, we connected the outlet of the airlift pump to a high-power centrifugal pump. Table 4 shows the comparison results of theoretical and experimental critical values. Research on the table can be clear, and the calculation results show that the experimental results of JL,LS,Cri are low. Therefore, it can be considered that the fluctuation of water flow and surface defects between adjacent particles (Figure 4) will reduce the compactness, which finally weakens the static retention effect of the chips. Therefore, it can be considered that as long as the static chip retention effect exists, it will affect air transportation, so it is necessary to take measures to eliminate it.
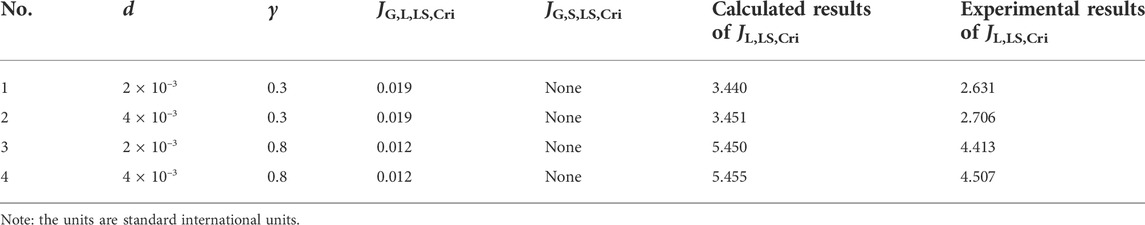
TABLE 4. Results of critical conditions of the airlift system by considering the static chip retention effect.
In this study, river sand particles were used as the lifting medium. Based on the static chip retention effect, the critical characteristics of liquid–solid two–phase flow and gas–liquid–solid three-phase flow are explored. The following conclusions can be drawn:
1) Considering the combined force acted on the particles in the water–solid two-phase flow, the critical control equation is established, and the critical model of the particles in the gas–water–solid three-phase flow is obtained through the gas holding model.
2) In a water-solid two-phase flow, the physical properties of the water and particles will affect the critical water rate. However, in the gas–water–solid three-phase flow, not only will the physical properties of water and particles affect the critical water rate but so will the air rate. Before the inflection point, as the air critical flow increases, the water flow will decrease. After the inflection point, as the air critical flow increases, the water flow will increase. In addition, the existence of the inflection point is not conducive to airlift.
3) On the basis of the constant immersion rate, the critical air rate of the fluid discharged to the pipe outlet is roughly the same. The physical properties of the particles will affect the corresponding water rate and critical air value. In the three-phase gas–water–solid flow, the start of the particles can be easier.
4) When there is a static chip retention effect under water, it is necessary to use auxiliary methods to impact the particle layer or to increase the resistance of the particles, otherwise, it will not be conducive to airlift.
The original contributions presented in the study are included in the article/Supplementary Material; further inquiries can be directed to the corresponding author.
DH was in charge of the whole trial; JG wrote the manuscript; and LD assisted with structure and language of the manuscript. FY designed and analyzed the experiments; all authors read and approved the final manuscript.
This research was supported by the Hunan Province Key Area R&D Program (2020NK2063) and the Hunan Provincial Department of Water Resources Project (XSKJ2019081-56).
The authors declare that the research was conducted in the absence of any commercial or financial relationships that could be construed as a potential conflict of interest.
All claims expressed in this article are solely those of the authors and do not necessarily represent those of their affiliated organizations, or those of the publisher, the editors, and the reviewers. Any product that may be evaluated in this article, or claim that may be made by its manufacturer, is not guaranteed or endorsed by the publisher.
Alasadi, A. A. M. H., and Habeeb, A. K. (2017). Experimental and numerical simulation of an airlift pump with conventional and modified air injection device. J. Eng. 23 (2), 62.
Chen, G., Ning, Y., Tang, D., and Jin, X. (2009). Study on the operation performance of pipeline air-lift system[J]. Min. Metallurgical Eng. 29 (5), 24. doi:10.3969/j.issn.0253-6099.2009.05.007
Fu, C., and Yan, E. (2004). New mining technique—bore hydromining[J]. Min. Metallurgical Eng. 24 (4), 7. doi:10.3969/j.issn.0253-6099.2004.04.003
Fujimoto, H., Murakami, S., Omura, A., and Takuda, H. (2004). Effect of local pipe bends on pump performance of a small air-lift system in transporting solid particles. Int. J. Heat Fluid Flow 25 (6), 996–1005. doi:10.1016/j.ijheatfluidflow.2004.02.025
Fujimoto, H., Nagatani, T., and Takuda, H. (2005). Performance characteristics of a gas–liquid–solid airlift pump. Int. Jonalur Multiph. Flow 31 (10-11), 1116–1133. doi:10.1016/j.ijmultiphaseflow.2005.06.008
Hanafizadeh, P., Ghanbarzadeh, S., and Saidi, M. H. (2011). Visual technique for detection of gas–liquid two-phase flow regime in the airlift pump. J. Petroleum Sci. Eng. 75 (3-4), 327–335. doi:10.1016/j.petrol.2010.11.028
Hattaa, N., Fujimotoa, H., Isobeb, M., and Kang, J. S. (1998). Theoretical analysis of flow characteriscics of multiphase mixtures in vertical pipe[J]. Int. J. Multiph. Flow 24 (4), 539–561. doi:10.1016/s0301-9322(97)00074-8
Hu, D., Kang, Y., Tang, C-L., and Wang, X-C. (2015). Modeling and analysis of airlift system operating in three-phase flow. China Ocean. Eng. 29 (1), 121–132. doi:10.1007/s13344-015-0009-z
Hu, D., Tang, C., Zhang, F., and Lin, Y. (2012). Theoretical model and experimental research of airlift device in borehole hydraulic jet mining[J]. J. China Coal Soc. 37 (3), 522. doi:10.13225/j.cnki.jccs.2012.03.014
Hu, D., Wu, X., Tang, C., and Liao, Z. (2013). Experimental study of airlift device for borehole hydraulic jet mining[J]. Mech. Sci. Technol. Aerosp. Eng. 32 (5), 756. doi:10.13433/j.cnki.1003-8728.2013.05.004
Huang, H., Wu, J., Yang, Z., Xue, Z., Ge, W., Wei, W., et al. (2017). A CFD simulation study of air-lift artificial upwelling based on Qiandao Lake experiment[J]. Ocean. Eng. 144, 257–265. doi:10.1016/j.oceaneng.2017.07.048
Kassab, S. Z., Kandil, H. A., Warda, H. A., and Ahmed, W. (2007). Experimental and analytical investigations of airlift pumps operating in three-phase flow. Chem. Eng. J. 131 (1–3), 273–281. doi:10.1016/j.cej.2006.12.009
Mahrous, A. F. (2013). Airlift pump with a gradually enlarged segment in the riser tube[J]. J. Fluids Eng. 135 (3), 22–25.
Oueslati, A., and Megriche, A. (2017). The effect of liquid temperature on the performance of an airlift pump. Energy Procedia 119, 693–701. doi:10.1016/j.egypro.2017.07.096
Pei, J., and Liao, Z. (2010). Mathematic model of air-lift in borehole hydraulic jet mining[J]. J. China Coal Soc. 35 (3), 373–376.
Pei, J., Liao, Z., and Tang, C. (2010). Experimental analysis on borehole hydraulic lift equipment[J]. J. Chong Qing Univ. 33 (3), 19–23.
Pei, J., and Tang, C. (2015). Affecting factors for apparent air velocity of critical lift in air lift[J]. Min. Metallurgical Eng. 35 (1), 14–16.
Taleb, F., and Al-Jarrah, J. A. (2017). Experimental study of an air lift pump[J]. Eng. Technol. Appl. Sci. Res. 7 (3), 1676–1680.
Tang, C., Ge, R., Hu, D., and Wang, Z. (2016). Experimental study on pipe performance of air-lift system[J]. Chin. J. Hydrodynamics (1), 37–42. doi:10.16076/j.cnki.cjhd.2016.01.006
Keywords: airlift pump, three-phase flow, critical characteristic, static chip retention force, dredging
Citation: Hu D, Guo J, Deng L and Yang F (2022) Critical characteristics of an airlift pump for dredging. Front. Earth Sci. 10:993782. doi: 10.3389/feart.2022.993782
Received: 14 July 2022; Accepted: 28 July 2022;
Published: 26 September 2022.
Edited by:
Fei Huang, Hunan University of Science and Technology, ChinaCopyright © 2022 Hu, Guo, Deng and Yang. This is an open-access article distributed under the terms of the Creative Commons Attribution License (CC BY). The use, distribution or reproduction in other forums is permitted, provided the original author(s) and the copyright owner(s) are credited and that the original publication in this journal is cited, in accordance with accepted academic practice. No use, distribution or reproduction is permitted which does not comply with these terms.
*Correspondence: Jingzhi Guo, NTUzODk5NTY2QHFxLmNvbQ==
Disclaimer: All claims expressed in this article are solely those of the authors and do not necessarily represent those of their affiliated organizations, or those of the publisher, the editors and the reviewers. Any product that may be evaluated in this article or claim that may be made by its manufacturer is not guaranteed or endorsed by the publisher.
Research integrity at Frontiers
Learn more about the work of our research integrity team to safeguard the quality of each article we publish.