- 1College of Geoscience and Surveying Engineering, China University of Mining and Technology, Beijing, China
- 2Department of Geological and Surveying Engineering, Shanxi Institute of Energy, Jinzhong, China
In order to carry out an in-depth study of the differences in the molecular structure evolution of the vitrinite and the inertinite during coalification, the chemical structure of 13 groups of vitrinite and inertinite with different coal ranks were comprehensively characterized using X-ray diffraction (XRD), Fourier transform infrared (FTIR) spectroscopy, and 13C nuclear magnetic resonance (13C NMR). The correlation of structure parameters and vitrinite random reflectance (Ro, ran) were analyzed. The results show that three evolution stages of vitrinite were observed with Ro, ran at 0.35%–0.90%, 1.20%–2.67%, and 3.03%–4.20%, and two evolution stages of inertinite were marked with Ro, ran at 0.35%–2.07% and 2.07%–4.20%. The fa, DOC, I, fa', faH, faN, faB, Xb, La, Lc, and Nave of inertinite are always larger than vitrinite, whereas the A(CH2)/(CH3), fal, fal *, fal H, d002 of inertinite are always smaller than vitrinite. When Ro, ran = 0.35%–0.90%, the oxygen-containing functional groups and aliphatic structure of vitrinite fall off rapidly, the condensation degrees of the aromatic ring, La, Lc, and Nave increase, whereas the lengths of side chains and d002 decrease. When Ro, ran = 1.20%–2.67%, the vitrinite structure variation follows the same trend as the first stage, but the evolution rate is significantly lower. When Ro, ran = 0.35%–2.07%, the oxygen-containing functional groups, methyl groups, and methylene groups of inertinite fall off at a slower rate than those of vitrinite. The aromaticity, condensation degree, aromatic carbon content, and order degree of microcrystalline structure also increase at a rate less than that of vitrinite. The vitrinite and inertinite structure variation becomes flat, and the structures of both macerals are similar in the high metamorphic stage. The content of oxygen-containing functional groups and aliphatic chain length decrease to the lowest, whereas the aromaticity increases to the maximum. This study contributes to a comprehensive understanding of the chemical structure differences between vitrinite and inertinite, which can provide a theoretical reference for the clean utilization of coal and coalbed methane (CBM) exploration and development.
1 Introduction
Coal is important fossil energy and chemical fuel. In recent years, the research on coal liquefaction, gasification, coking, and coal bed methane development has become more critical due to the demand for environmental protection and coal mine safety production. The macromolecular structure of coal not only determines its behavior and properties during thermal processing (Mathews and Chaffee, 2012; Mochida et al., 2014) but also controls the development of micropores (Wang et al., 2021b; Chen et al., 2022), further influencing the adsorption and transport of CBM (Wang et al., 2018a; Guo and Guo, 2018; Pan et al., 2019; Wang et al., 2021a). It is generally believed that the structure of coal varies with the macerals and coal rank (Stach et al., 1982; Chen et al., 2012; Wang et al., 2022a). Vitrinite and inertinite are the main macerals in coal. They have different chemical structures and physical properties due to their different genesis (Wang et al., 2018c; Wang et al., 2020a). In recent years, due to the extensive distribution and industrial importance of vitrinite-rich coals, the research mainly focused on the characterization and evolution of vitrinite molecular structure. However, there are also inertinite-rich coals in nature, such as Early-Middle Jurassic coals in Northwest China and the coals in India, Southern Africa, and Eastern Australia (Stach et al., 1982; Qin et al., 2020). These coals are thick, widely distributed, and of good quality, which are of great significance to coal gasification, liquefaction, and coalbed methane development. Thus, it has become increasingly important to study the molecular structure of the inertinite. Therefore, understanding the behavior of coal in coking, liquefaction, vaporization, combustion, and coalbed methane development must be based on understanding the molecular structure evolution differences between macerals during the coal metamorphism process.
In recent years, with the development of software design and technology, many modern analytical techniques have been integrated to characterize the evolution of the molecular structures of coal and pyrolysis chars, such as X-ray diffraction (XRD) (Lu et al., 2001; Takagi et al., 2004; Manoj and Kunjomana, 2012), Fourier transform infrared (FTIR) spectroscopy (Iglesias et al., 1995; Ibarra et al., 1996), solid-state nuclear magnetism (13C NMR) (Suggate and Dickinson, 2004; Erdenetsogt et al., 2010; Jiang et al., 2019), microscopic laser Raman (Pan et al., 2017; Xie et al., 2019), and high-resolution transmission electron microscopy (HRTEM) (Sharma et al., 2001; Wang et al., 2018b). Some scholars used the various experimental methods mentioned above to study the evolution of the molecular structures of naturally evolved coal or pyrolysis chars and achieved a relatively consistent conclusion. Okolo et al. (2015) analyzed the structural evolution characteristics of bituminous coal using wide-angle X-ray diffraction–carbon fraction analysis (WAXRD–CFA), attenuated total reflection Fourier transform infrared (ATR-FTIR) spectroscopy, 13C NMR, and HRTEM. Lin et al. (2014) used FTIR, 13C NMR, and Raman spectroscopy techniques to investigate the effect of pyrolysis on the structural transformation of Chinese lignite. Jiang et al. (2019) investigated the characteristics of the macromolecular structure evolution of medium- and high-rank coals using XRD, Raman, and FTIR. All these studies indicated that the content of aromatic structure and the aromatization degree increase, the aliphatic structure content decreases, and the length of the aliphatic chain shortens with the increase in coalification degree. In terms of oxygen-containing functional groups, it was found that oxygen atoms are removed by demethylation and dihydroxylation reactions and replaced by carbon or hydrogen, with the reduction of carbonyl and oxidized aliphatic carbons during coalification. However, there are different reports on the evolution of microcrystalline structure size. Lin et al. (2014) found no significance in the variation of microcrystalline structure size during the pyrolysis process. Jiang et al. (2019) concluded that the crystallite height (Lc) and average crystallite diameter (La) are positively linearly related to Ro, whereas the interlayer spacing (d002) is negatively linearly related to Ro. Recently, significant progress has been made in researching the molecular structure evolution of vitrinite (Li and Zhu, 2014; Wang et al., 2018b; Zhang et al., 2021b). Li and Zhu (2014) found that, with the increase in vitrinite reflectance, the C-H and aliphatic/oxygen compounds in vitrinite gradually decrease, and the CH2/CH3 ratio firstly decreases and then increases. Zhang et al. concluded that, with the increase in vitrinite reflectance, the aromatic layer changed from disorder to order, and the shape changed from distortion to straighter and more parallel. However, the above studies neglected the characteristics of inertinite molecular structure and lacked a quantitative and visualized insight into the structural evolution differences between vitrinite and inertinite.
Some scholars have researched the molecular structure evolution differences between vitrinite and inertinite (Sun et al., 2003; Chen et al., 2012; Roberts et al., 2015a; Zhou et al., 2021). Sun et al. (2003) analyzed the molecular structure evolution of vitrinite and inertinite during the pyrolysis process using FTIR and 13C NMR. Still, the pyrolysis temperature points were too few to reflect the structure evolution differences of the two macerals in a comprehensive and detailed manner during the coalification process, and there was a lack of quantitative data. Zhao et al. showed that the maturity, aromaticity, and graphitization of the vitrinite were lower than those of the inertinite. However, the length of aliphatic chains of the vitrinite was larger than that of the inertinite, and there were more functional groups and more complex structures in the vitrinite (Zhou et al., 2021). Roberts et al. (2015a) investigated the molecular structural characteristics of Pyrolysis chars of vitrinite-rich coals and inertinite-rich coals generated at 450°C, 700°C, and 1,000°C in South Africa. It was concluded that the vitrinite-rich and inertinite-rich chars at 700°C–1,000°C were remarkably similar in terms of the proximate, ultimate, total maceral scan, and aromaticity values and the greater transition occurred in the vitrinite-rich coal. Chen et al. (2012) characterized the changes of functional groups in a suite of coal samples ranging from peat to anthracite by both traditional KBr-FTIR and novel micro-FTIR methods. However, it could not be supported by other experimental data, and the results were single and one-sided. Because the coalification stages involved were relatively limited in these studies, which are mainly focused on low-middle rank coals, or there are fewer pyrolysis temperature points, despite these research efforts, they are not sufficient to provide a complete and detailed understanding of the variation of coal maceral macromolecule structure with coalification. It is still necessary to improve the accuracy and comprehensiveness of the characterization of macromolecular structure differences between different macerals of different coal ranks and further discuss the mechanism of structural evolution differences between vitrinite and inertinite during coalification.
It is difficult to conduct comparative structural research on naturally evolved vitrinite and inertinite because of the convergence of optical features of the macerals at high metamorphic stages. Therefore, the coal seam in the Yining mining area that experienced the same coalification process was selected, and two sets of vitrinite and inertinite samples varying low to high rank were obtained by thermal simulation experiments. The chemical structure parameters of vitrinite and inertinite were characterized quantitatively using proximate analysis, elemental analysis, XRD, FTIR, and 13C NMR. The molecular structure differences and evolution characteristics of vitrinite and inertinite under the same thermal conditions are quantitatively described and discussed using random reflectance of vitrinite (Ro, ran) as the indices of coalification. This research can contribute to an in-depth understanding of the mechanism of evolutionary differences in molecular structure between coal macerals and provide a theoretical basis for clean and efficient utilization of coal and the physical properties evaluation of coal reservoirs.
2 Materials and methods
2.1 Origin of coal samples
The samples were collected from the lignite of the Xishangyao Formation in the Yining Mining area, Yili Basin, Xinjiang. Inertinite-rich and vitrinite-rich coals formed with the same inputs but in different depositional environments are available in the Yining mining area, providing an opportunity to examine maceral influences without facing too many challenges associated with maceral separation. The samples were collected by stratified sampling intensively from top to bottom at intervals of 0.2–0.5 m according to “GB482-2008” and the changes of Macrolithotype in coal. We selected bright and bleak coals based on the macrolithotype identification. Bright coal is mainly composed of vitrain and clarain, among which vitrain includes telocollinite and telinite. Bleak coal is mainly composed of durain and fusain, among which fusain includes fusinite and semifusinite. Then, YN-V with 82% of huminite (predecessor of the vitrinite) and YN-I with 90.7% of inertinite were selected by quantitative analysis of macerals of the selected bright and bleak coals (Table 1). The vitrain and fusain bands in YN-V and YN-I were further stripped by hand to obtain the samples of YN-V-0 with 92.62% huminite and YN-I-0 with 94.5% inertinite (Table 1). The obtained samples were quantified for macerals according to the Chinese standard GB/T 8899-2013. Above, the contents of vitrinite and inertinite in the samples are above 92% after manual selection, which meets the research needs in this study.

TABLE 1. Petrographic characteristics of initial coal samples and precursor samples of thermal simulation experiments.
2.2 Sample preparation
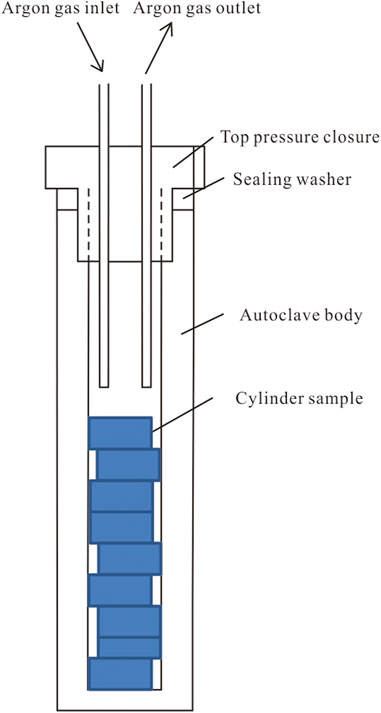
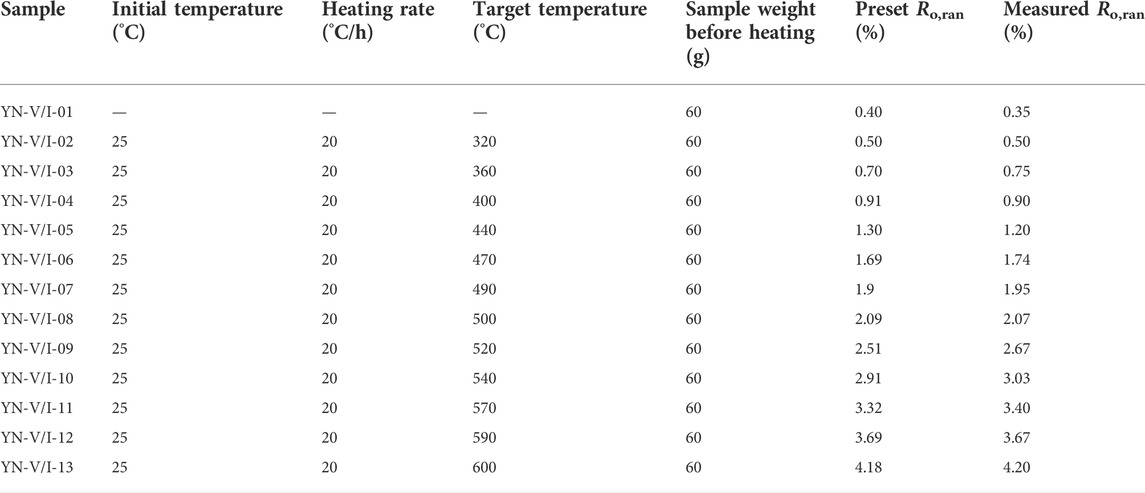
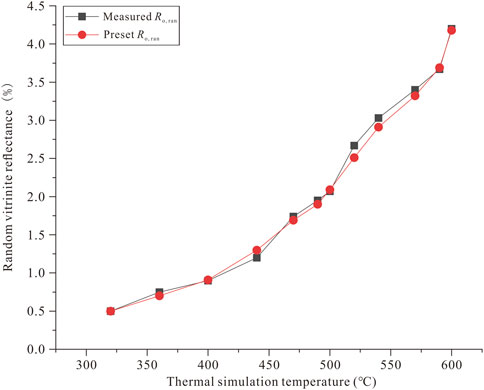
The open system experimental setup was used for the thermal simulation experiment, completed by the Guangzhou Institute of Geochemistry, Chinese Academy of Sciences. The internal structure of the block sample thermal simulation experimental vessel is shown in Figure 1. The sample was placed in a container made of stainless steel, the top of which was closed by a sealing cap and had an argon gas inlet and outlet on the top cap. A high purity argon flow rate of 20 ml/min was maintained during the experiment to protect the sample from oxidation during the heating process. The argon outlet was opened outward, and the exhaust gas was released into the atmosphere after water washing. The pressure to which the sample was subjected in this device was atmospheric, and the oil and gas products were not collected. Therefore, the device was only used for the thermal maturation simulation process of block samples. The precursor samples YN-V-0 and YN-I-0 were divided into 13 parallel samples with a weight of 60 g and were numbered, respectively. Twelve temperature points from 320°C to 600°C were set up for the experiment (Table 2). The parallel samples are loaded into the reaction vessel and then put into the heating furnace. The temperature is increased from indoor temperature to a preset temperature at a rate of 20°C/h. The reaction vessel was removed from the heating furnace when the temperature reached a preset temperature, and the sample was removed from the reaction vessel after cooling. Vitrinite reflectance of thermal simulated samples was measured according to GB/T6948-1998, and the results were basically consistent with the preset Ro (Table 2; Figure 2). Then, the samples were crushed to 200 mesh for macromolecular structure experiments and analysis.
2.3 Proximate and ultimate analysis
Proximate analysis is according to GB/T 212-2008 to test the moisture and ash. With GB/T 30733-2014 as the standard, ultimate analysis was taken to measure the content of major elements in the samples, and the elements C, H, O, N, and S in coal were tested and used to calculate H/C.
2.4 Molecular structure analysis
2.4.1 X-ray diffraction analysis
The acid-washed and demineralized powder samples were prepared for XRD experiments. It was conducted by an Ultima IV X-ray diffractometer produced by Rigaku Corporation (Japan). The operating conditions of the X-ray tube were U = 40 kV and I = 40 mA, and the XRD scans were conducted on a Cu target (λ = 0.15418 nm). The scanning range of 2θ was adjusted from 10° to 80° at a scan rate of 5°/min. Origin 9.1 software was used to perform peak fitting of the spectrum, and the curves were corrected according to the internal standard method to obtain the peak position, area, peak width at half height (FWHM), and height.
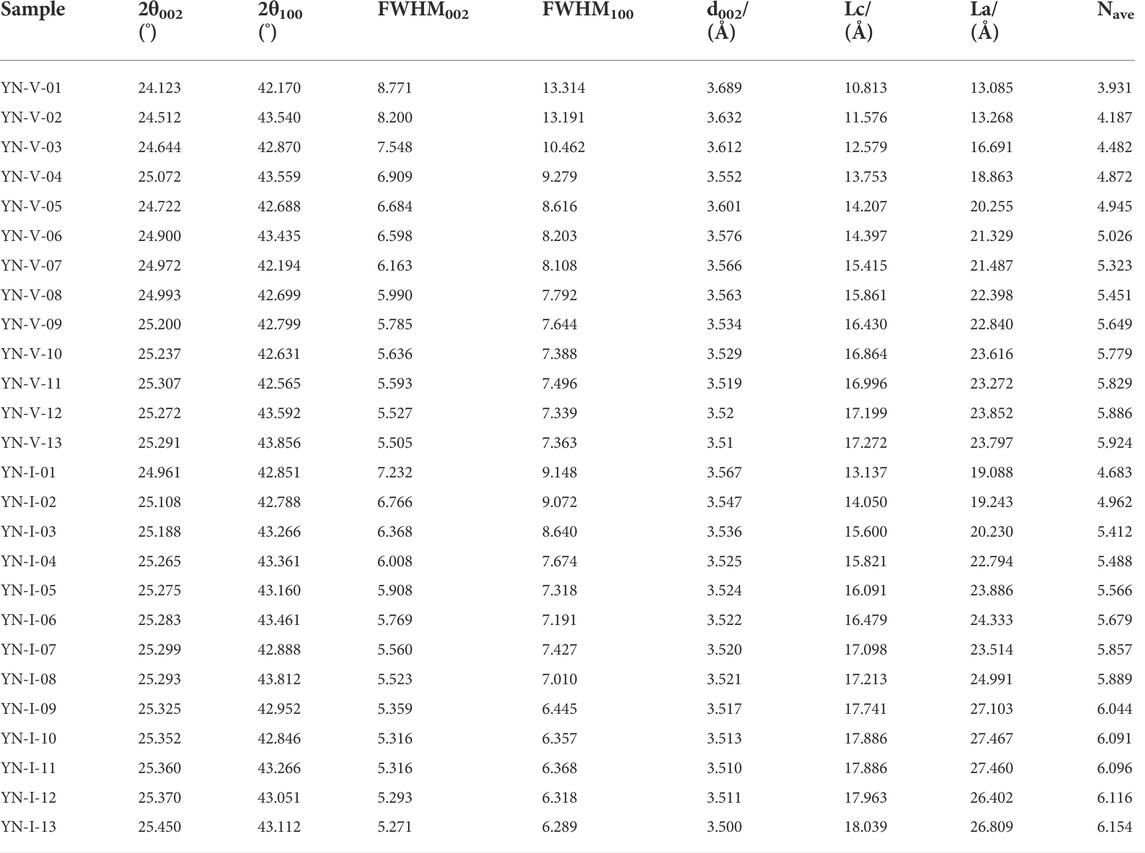
Based on the information from the peak fitting, the Bragg and Scherrer equations were used to calculate the interlayer spacing (d002), average crystallite diameter (La), crystallite height (Lc), and the number of carbon layers (Nave) (Lu et al., 2001; Takagi et al., 2004):
where λ is the wavelength of the X-ray (Å), which is 0.154056 nm, θ002 and θ100 are the peak positions of the 002 and 100 surfaces, and β002 and β100 are the peak widths at half height of 002 and 100 surfaces.
2.4.2 FTIR spectroscopy analysis
The FTIR experiments were carried out with a Thermo Scientific Nicolet iS10 FTIR spectrometer produced in the USA. A 1∼2 mg of powder specimen and 200 mg of pure KBr were finely ground and homogenized, then placed in a mold, and pressed into a transparent sheet on a hydraulic press. Then, the sample was put into the infrared spectrometer and tested in the wave number range from 4,000 cm−1 to 400 cm−1 with a scan number of 32 and a resolution of 4 cm−1.
Based on previous research on the peak attribution of different wavelength bands of the infrared spectrum (Painter et al., 1981; Ibarra et al., 1996; Dutta et al., 2013; Li et al., 2015a; Jiang et al., 2019; Wang et al., 2022b), the infrared spectrum curve can be divided into the following bands (Table 3), and each band can be analyzed by the curve-fitting method. FTIR structural parameters are divided into three parts—aromatic structural parameters (fa, I, DOC), aliphatic structural parameters [A(CH2)/A(CH3)], and oxygen-containing (“C”) (Li et al., 2020a; Zhou et al., 2021)—which can be obtained according to the peak fitting of FTIR spectrum. The following parameters have different meanings: the higher the values of I and fa, the higher the aromatic degree. The DOC is the degree of condensation of the aromatic ring and represents the change in the ratio of aromatic C-H bonds to aromatic hydrocarbon C=C bonds (Guo and Bustin, 1998). The higher the A(CH2)/A(CH3) value, the longer the aliphatic side chains and the lower the branching degree (Wang et al., 2022b). The change of its value can map out the overall evolution of the aliphatic structure (Jiang et al., 2019). “C” characterizes the maturity of the coal and is the ratio of the functional group C=O to C=C, which can reflect the variation of the C=O content. These structural parameters can be calculated using Eqs 5–11 (Painter et al., 1981; Ibarra et al., 1994; Ibarra et al., 1996; Guo and Bustin, 1998; Dutta et al., 2013; Li et al., 2015a; Jiang et al., 2019; Wang et al., 2022b):
where Cal/C is the ratio of aliphatic carbon to total carbon atoms, H/C is the ratio of total hydrogen atoms to total carbon atoms obtained from the results of ultimate analysis, Hal/H is the ratio of aliphatic hydrogen to total hydrogen atoms, Hal/Cal is the ratio of the number of hydrogens to carbon atoms in the aliphatic group, taking the empirical value of 1.80.
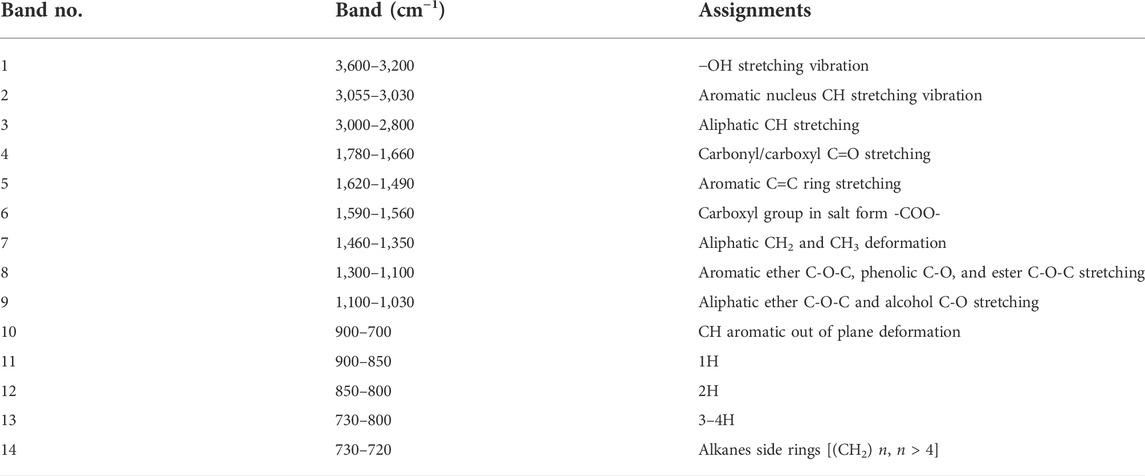
TABLE 3. Band assignments of the functional groups in the coal FTIR spectra (Painter et al., 1981; Ibarra et al., 1996; Dutta et al., 2013; Li et al., 2015a; Jiang et al., 2019; Wang et al., 2022b).
2.4.3 Solid-state 13C NMR spectroscopy analysis
Solid-state 13C NMR was performed using a Bruker Avance 400 MHz solid-state spectrometers in cross-polarization/magic angle mode/dipolar dephasing (CP/MAS/DD) methods equipped with a 4 mm MAS and ZrO2 Probe. The samples were characterized at a contact time condition of 4 ms and a pulse repetition delay of 1–2 s under a rotation frequency of 10 kHz. Peakfit 4.12 software was used to perform peak fitting on the 13C NMR spectrum to better quantify the structural parameters of vitrinite and inertinite in this research. Different types of carbon in the 13C NMR spectrum are classified according to the different assignments of chemical shifts of carbon atom types (Solum et al., 1989; Solum et al., 2001; Suggate and Dickinson, 2004; Erdenetsogt et al., 2010): Fa (100–220 ppm, total aromatic carbon);
3 Results
3.1 Chemical properties
Table 4 shows the results of the proximate and ultimate analysis of the thermally simulated samples. The moisture content of vitrinite and inertinite was 2.02%–5.0% and 2.58%–6.44%, respectively, which decreased gradually with the increase in Ro, ran. The ash content of vitrinite and inertinite was 2.95%–4.18 and 4.2%–7.75%, respectively. These results indicate that the inertinite has received more clastic deposits during the peatification stage in the adlittoral and dry, hot oxidation environment.
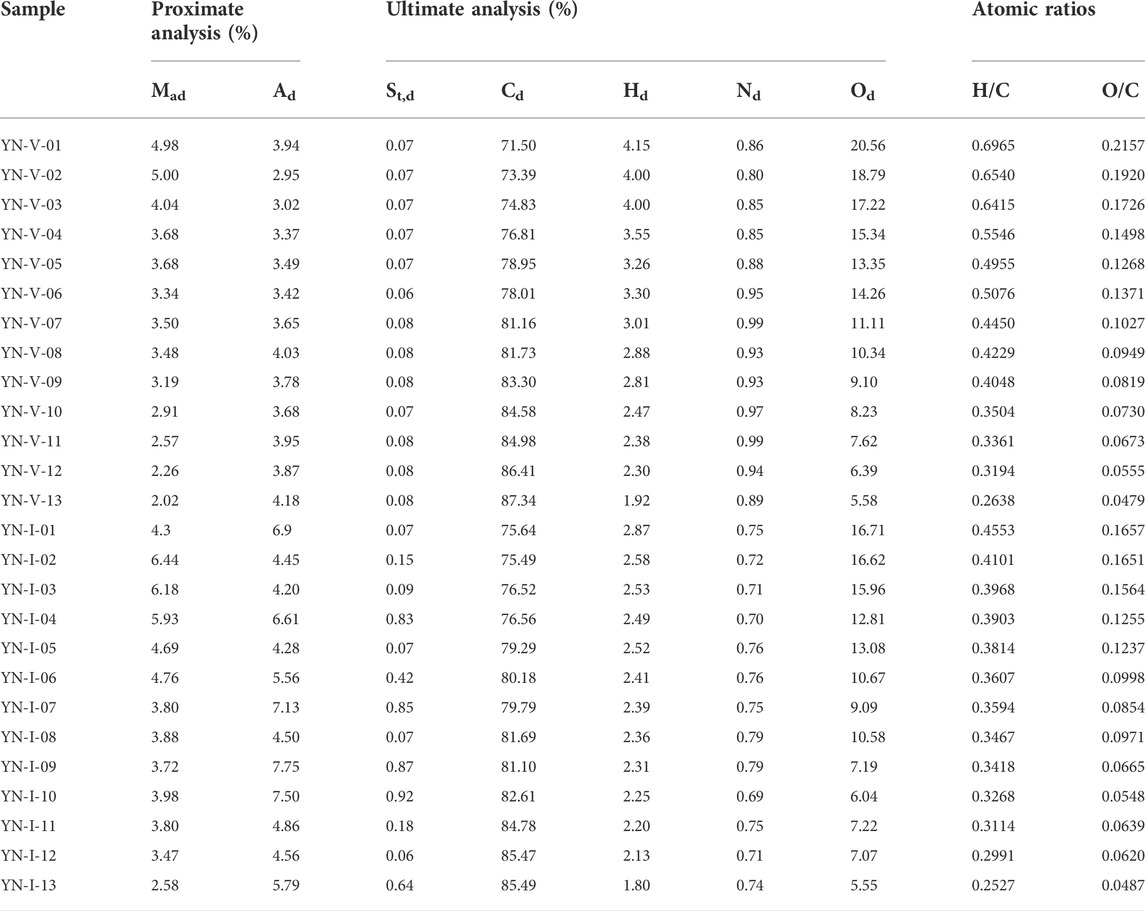
TABLE 4. Results of proximate and ultimate analysis of thermally simulated vitrinite and inertinite samples.
The vitrinite was generally lower in C and higher in H, O, and N compared to the inertinite. As the thermal simulation progressed, the O content changed most and decreased continuously. The H content of the vitrinite gradually decreases from 4.15% to 1.92%, and that of the inertinite decreases from 2.87% to 1.8%. With the increase in Ro,ran, the C content of vitrinite increased rapidly at first and then slowly rose to 87.34%. The change of the C content of inertinite was smaller than that of vitrinite and showed an increasing linear trend with the increase in Ro,ran. The content of N was essentially constant during the thermal simulation because N exists in the form of pyrrole and pyridine in the vitrinite and in the form of amino and pyrrole in the inertinite, both of which are relatively stable in structure and less prone to change (Xie, 2002).
3.2 XRD analysis
3.2.1 XRD spectrum characteristics
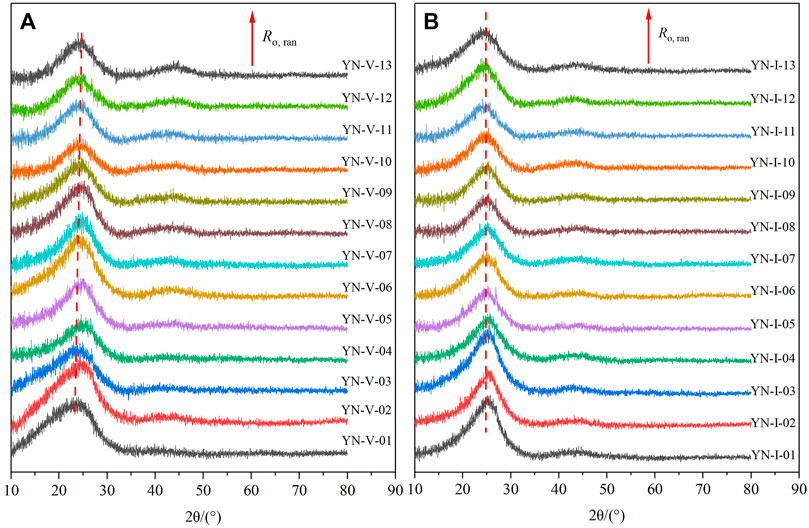
The XRD spectrums of samples are shown in Figure 3. There are two diffraction peaks at 2θ = 25° and 2θ = 44° in the XRD spectrum, respectively. The existence of unsaturated structures such as aliphatic side chains leads to the asymmetry of the D002 peak. As Ro,ran increased, the content of aliphatic structures in coal decreased, and the asymmetry caused by their existence also gradually weakened (Takagi et al., 2004; Okolo et al., 2015) (Figure 3). As Ro,ran increased, the D002 peak shape of the samples gradually became narrower and sharper, and the position of the peak center gradually shifted to the right. The D100 p peak shape of the two macerals became narrower with the increase in Ro,ran.
Furthermore, there was a significant difference between the XRD spectrum of the vitrinite and inertinite. Figure 3 showed that the diffraction peak relative intensity (integral area) of the inertinite was higher than that of the vitrinite with the same Ro,ran, indicating that the inertinite molecular structure contained more polymeric aromatic rings. On the contrary, with Ro,ran increasing, the variation of the diffraction peaks of the inertinite was small, which was not as significant as that of the vitrinite. Moreover, the symmetry of the inertinite was stronger than that of the vitrinite with the same Ro,ran. It shows fewer aliphatic structures in the inertinite than in the vitrinite. The narrower the peak shape, the more ordered the coal structure (Zhang et al., 2008). Therefore, it can be concluded that the structure of the inertinite was more orderly than that of the vitrinite with the same Ro,ran, and the structure of the vitrinite and inertinite became more orderly as Ro,ran increased.
3.2.2 Structural parameters from the XRD spectrum
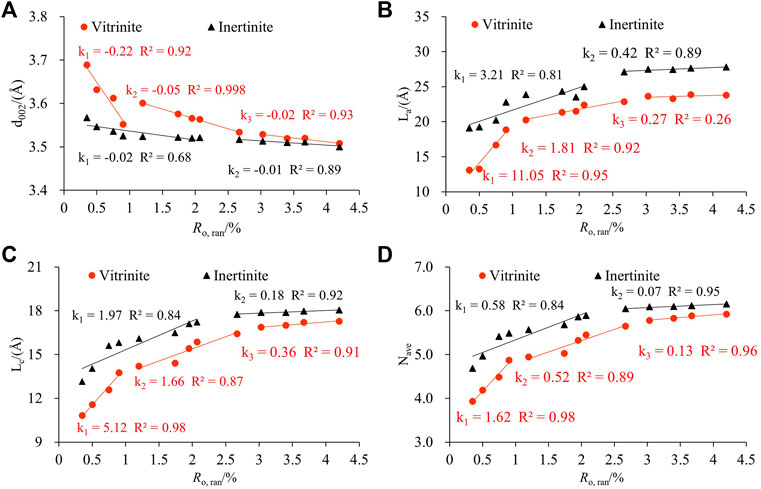
The carbon interlayer spacing d002 of the vitrinite and inertinite is 3.52–3.689 Å and 3.508–3.567 Å, respectively. Furthermore, the d002 of the vitrinite is more variable. The La and Lc of vitrinite are 13.08–24.26 Å and 9.68–16.07 Å, and those of inertinite are 17.21–31.67 Å and 11.76–16.79 Å (Table 5). It shows that the degree of crystallinity of aromatic carbon layers is low in all samples.
The relationship between XRD structural parameters and Ro, ran is demonstrated in Figure 4. Three obvious evolution stages of vitrinite are observed with Ro, ran at 0.35%–0.90%, 1.20%–2.67%, and 3.03%–4.20%, and two evolution stages of inertinite are observed with Ro, ran at 0.35%–2.07% and 2.07%–4.20%. d002 decreased with the increase in Ro, ran (Figure 4A), and La, Lc, and Nave increased with the increase in Ro, ran (Figures 4B–D). When Ro, ran < 0.9%, d002, La, Lc, and Nave of vitrinite changed rapidly. Moreover, when Ro, ran = 1.2%–2.67%, their evolution rate slowed down. These parameters of inertinite increased linearly in the corresponding range of Ro, ran, and the evolution rate was less than vitrinite. The d002, La, Lc, and Nave variation of the two macerals remained stable as Ro, ran increased in the high coal rank. In addition, the d002 of the vitrinite with the same Ro, ran was smaller than that of the inertinite, whereas La, Lc, and Nave were all higher than that of the vitrinite. The results showed that the number of aromatic layers and the degree of aromatic ring condensation of the inertinite were higher than the vitrinite. The arrangement of aromatic layers in inertinite was more regular and compact than in vitrinite, and the orientation of aromatic layers was better than in vitrinite. That is why the evolution rate of vitrinite is higher than inertinite in low and middle metamorphic stages. Since in the low metamorphic stage, the inertinite already has a larger proportion of aromatic structures, which makes the variation of the inertinite crystallite structure size not as significant as that of the vitrinite during the coalification process.
3.3 FTIR analysis
3.3.1 FTIR spectrum characteristics
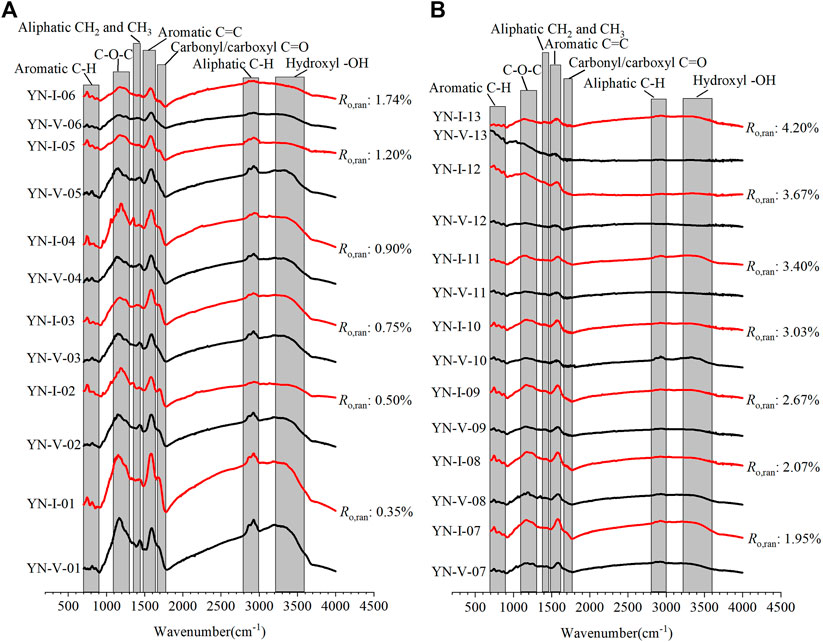
Figure 5 shows the FTIR spectrum of the samples. The adsorption band characteristics of different coal ranks and macerals were similar, indicating that they have similar surface structures and functional groups. However, the peak intensities and shifts of the two macerals were different, meaning that there were significant differences in the types and contents of functional groups during the coalification process.
The peak intensity of the vitrinite in the region of 700–900 cm−1 first increased and then decreased with the increase in Ro,ran. The aromatic C-H may increase first due to the formation of the new aromatic rings by aromatization in the early stage. Since C-H exists only at the edge of the aromatic ring, the polycondensation that occurs later at the edge of the aromatic rings leads to a decrease in the C-H content. However, the peak intensity of the inertinite in this region keeps decreasing with the increase in Ro,ran , indicating that the aromatic C-H decreases during the coalification process. It indicates that the aromatization of the inertinite is relatively weak during the coalification, and the polycondensation is dominant.
The peak intensity of the 1,100–1,300 cm−1 bands, 1,350–1,460 cm−1 bands, and 1,660–1,780cm−1 bands decreased as Ro,ran increased, indicating that the aromatic C-O, aliphatic CH2 and CH3, and the carbonyl/carboxyl C=O decreased. The peak intensity of the 1,490–1,620 cm−1 band also decreased with increasing Ro,ran. It should be noted that the absorption peaks in this band were complex. It may be attributed to the overlap of the absorption of the hydrogen-bonded carbonyl and aromatic ring C=C, or it may be due to the condensed ring being linked by CH2 (Xie, 2002). In addition, the peak position of vitrinite in the 1,100–1,300 cm−1 and 1,490–1,620 cm−1 bands shifted from 1,167 cm−1 to 1,150 cm−1 and from 1,591 cm−1 to 1,552 cm−1, respectively. Moreover, the peak position of inertinite in these two bands shifted from 1,150 cm−1 to 1,133 cm−1 and from 1,585 cm−1 to 1,568 cm−1, respectively. The peak intensity of the vitrinite in these bands was smaller than that of inertinite. In addition, the peak shifts of the vitrinite in the 1,100–1,300 cm−1 and 1,490–1,620 cm−1 bands were greater than that of inertinite. The peak intensity and position variation were greater than that of inertinite during the coalification.
The peak intensity of the 2,800–3,000 cm−1 band decreased as Ro,ran increased, indicating that the aliphatic C-H decreased. Furthermore, when Ro,ran>1.74%, the peak gradually disappeared. The peak intensity of 2,924 cm−1 was more significant than that of 2,850 cm−1, which indicated the presence of long aliphatic chains in the samples. When Ro,ran = 0.35%–0.9%, the peak intensity of the vitrinite was larger than that of the inertinite, indicating that the aliphatic structure content of the vitrinite was larger in the low coal rank. The peak intensities of the two macerals gradually tended to be the same in the middle-high coal rank.
3.3.2 Structural parameters from the FTIR spectrum
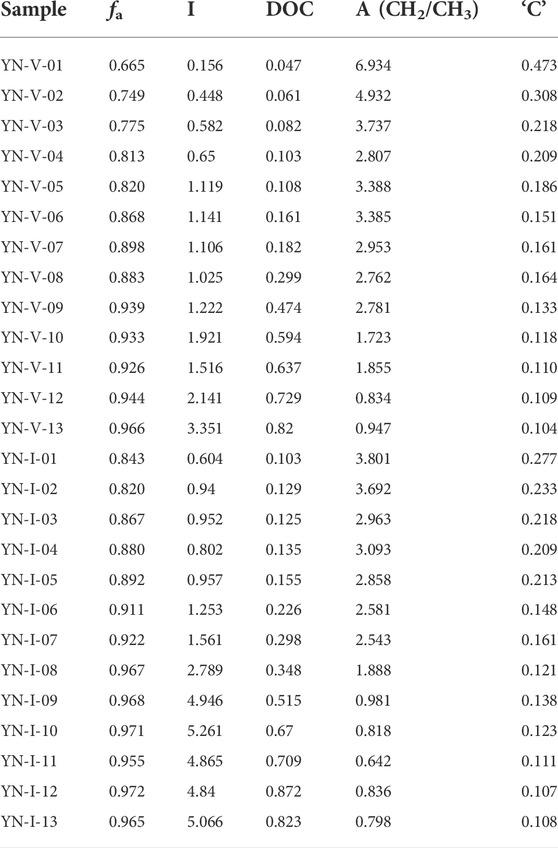
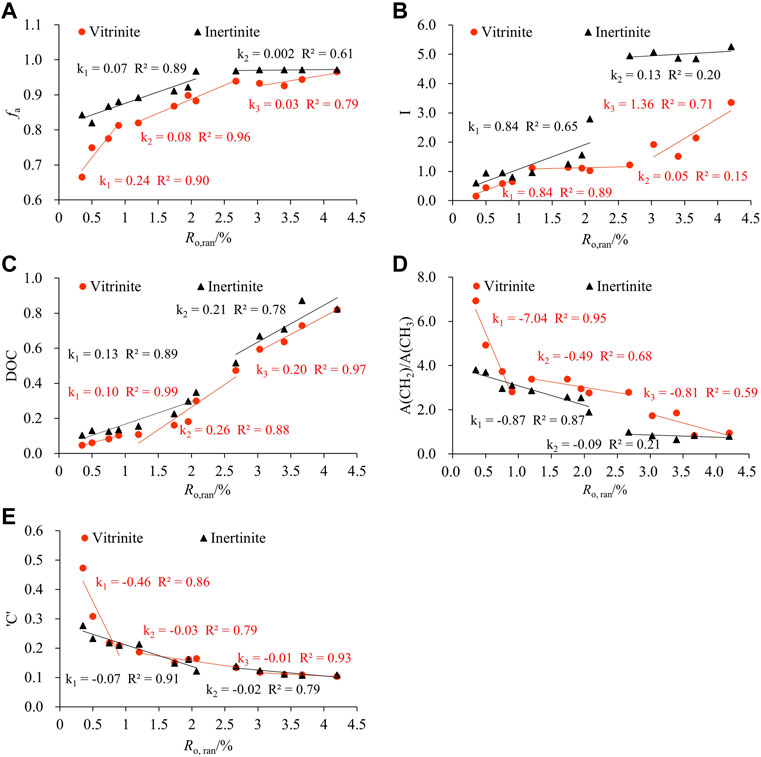
Table 6 shows the structural parameters of the FTIR. Correlation analysis was used to investigate the evolution of fa, I, and DOC during the thermal simulation process (Figure 6). Three evolutionary stages were observed for the FTIR structure parameters of the vitrinite, with Ro, ran at 0.35%–0.90%, 1.20%–2.67%, and 3.03%–4.20%, respectively. However, the evolution of the inertinite parameters was divided into two stages: Ro, ran = 0.35%–2.07% and Ro, ran =2.67%–4.2%.
The fa, I, and DOC of the samples showed a trend of gradual increase with the increase in the Ro, ran (Figures 6A–C), indicating that the aromaticity and condensation of the aromatic structure increased. Moreover, the evolution rate of each stage gradually slowed down. The variation trend of the I value in the second stage of vitrinite tended to be flat. It increased rapidly in the third stage. However, the variation trend of inertinite in the corresponding range was precisely the opposite. It indicated that the relative abundance of aromatic functional groups varied widely between the vitrinite and the inertinite in the middle and high coal rank. The variation of these parameters of the vitrinite was greater than that of inertinite during the coalification process. The fa, I, and DOC values of inertinite with the same Ro, ran were greater than that of vitrinite, which is also consistent with previous studies (He et al., 2017; Zhou et al., 2021). It shows that maturity is related to the macerals of coal (Zhou et al., 2021).
With the increase in Ro, ran, the A(CH2)/A(CH3) of samples gradually decreased, which means that the content of methylene decreased at a faster rate than that of methyl. It indicates that the aliphatic chains gradually shorten and increase during the coalification process. The A(CH2)/A(CH3) values of the inertinite were all smaller than that of the vitrinite at the same Ro,ran, suggesting that there were longer and more aliphatic side chains in the vitrinite. A(CH2)/A(CH3) of both macerals differed greatly at the low metamorphic stage, but they tended to be the same at the high metamorphic stage (Figure 6D). It showed that the evolution rate of the aliphatic structure in the vitrinite was significantly faster than that in the inertinite.
The ‘C’ decreased with increasing Ro,ran, which was caused by the de-functionalization of the oxygenation during the coalification process (Jiang et al., 2019). When Ro,ran< 0.9%, the “C” of vitrinite changed faster than that of inertinite. As Ro,ran continued to increase, the decrease rate of “C” slowed down. The “C” of the two macerals gradually tended to be the same in Ro,ran = 1.2%–4.2%. The ‘C’ of the inertinite with the same Ro,ran was less than that of the vitrinite (Figure 6E).
3.4 13C NMR analysis
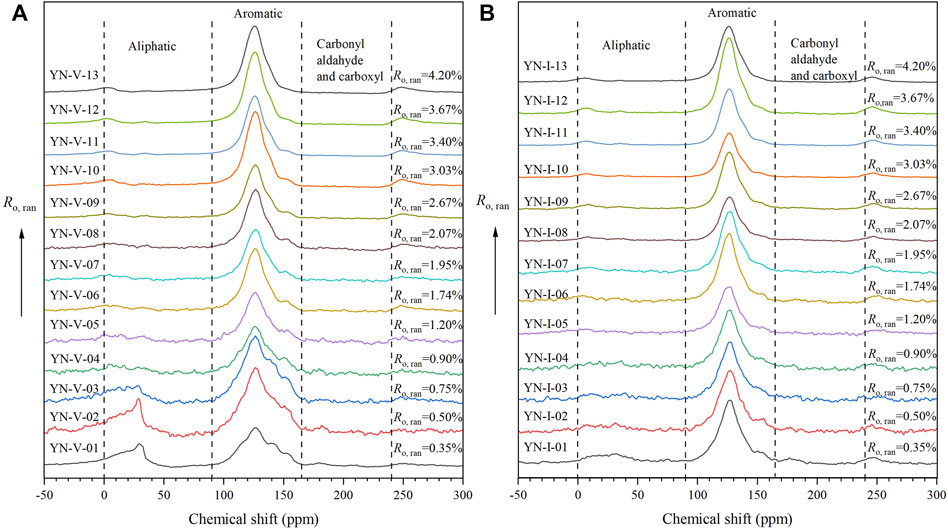
3.4.1 13C NMR spectrum characteristics
Figure 7 displays the 13C NMR spectrum of vitrinite and inertinite samples with different Ro, ran. The spectrum is divided into two regions: an aliphatic carbon region (shift: 0–90 ppm) and an aromatic carbon region (shift: 90–165 ppm). There was almost no absorption peak in the carbonyl and carboxyl region in the spectrum (165–24 ppm), which indicates that there are few of these two groups. It was consistent with the results of the FTIR spectrum.
As shown in Figure 7, the 13C NMR spectra of vitrinite and inertinite were different. The peak intensity and area in the range of 0–90 ppm of the vitrinite at the low metamorphic stage were slightly smaller than those in the range of 90–165 ppm, indicating that the contents of aliphatic and aromatic structures are comparable at the low rank. However, the peak intensity and area in the range of 0–90 ppm of the inertinite at the low metamorphic stage are much smaller than those in the range of 90–165 ppm, indicating that the inertinite is basically dominated by the aromatic structure.
The peak intensity and area of the samples in the range of 0–90 ppm decreased rapidly with the increase in Ro, ran, indicating that the aliphatic structure fell off rapidly. The peaks in the range of 0–90 ppm of the vitrinite almost disappeared when Ro, ran was 2.67%, whereas the peaks in the same range of the inertinite disappeared when Ro, ran was 2.07%. At this time, the content of aliphatic structures in both macerals was reduced to very low. However, the peak intensity and area of the samples in the range of 90–165 ppm increased with the increase in Ro, ran (Figure 7), reflecting an increase in the content of aromatic structure. The peak of the aromatic structure became narrower with the increase in Ro, ran. However, the variation of inertinite was weaker than that of vitrinite. The aromatic structure peak of the vitrinite in the low coal rank was in the range of 100–160 ppm, whereas it shifted to 105–150 ppm when Ro, ran > 0.90% and continued to narrow down to 110–145 ppm when Ro, ran > 2.67%. The aromatic structure peak of the inertinite in the low coal rank was in the range of 100–150 ppm, and it narrowed down to 110–145 ppm when Ro, ran > 2.07%.
3.4.2 Structural parameters from the 13C NMR spectrum
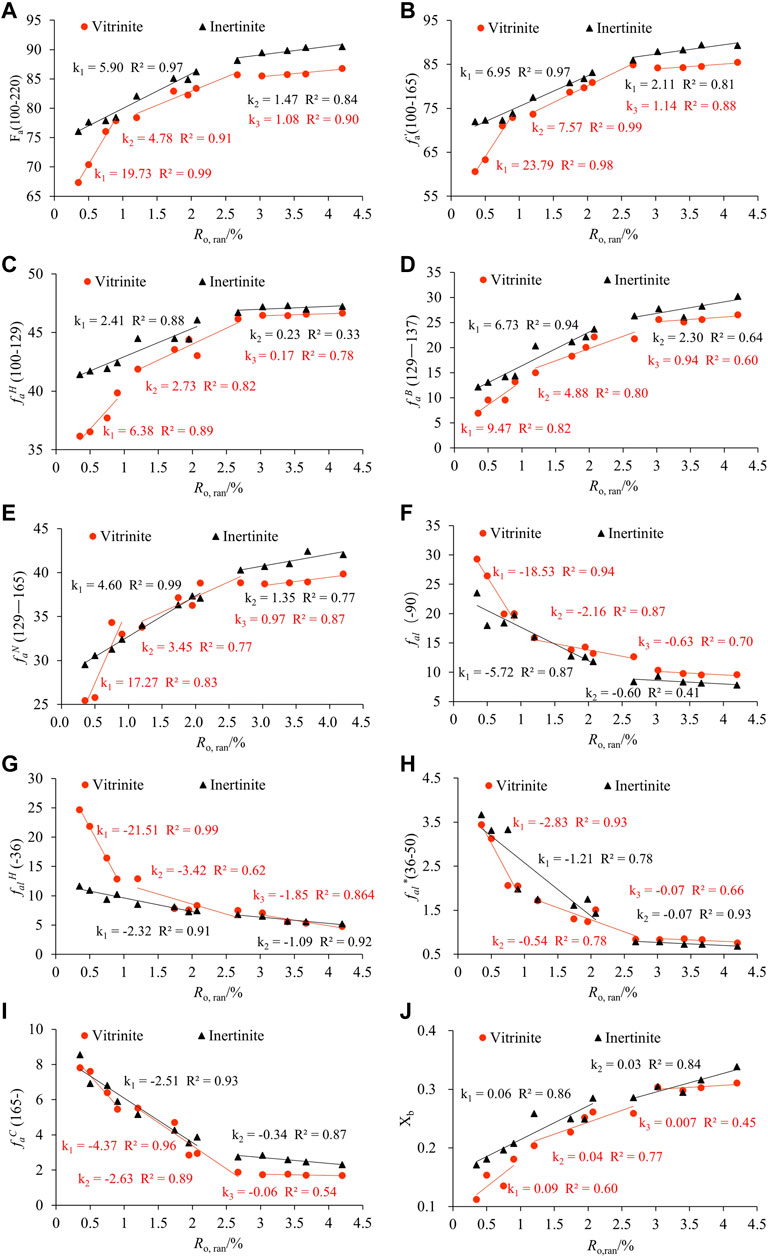
13C NMR parameters were calculated using the curve-fitting method, and the significance and results of each parameter are shown in Table 7. The information about the carbon skeleton can be obtained by analyzing these parameters. Linear fittings between Ro, ran and 13C NMR structural parameters with a higher correlation coefficient are shown in Figure 8. The evolution stages of 13C NMR structural parameters were the same as in the XRD and FTIR experiments.
Fa increased during the coalification process, indicating that the aromatic carbon content gradually increased, consistent with the published results (Li and Zhu, 2014; Liu et al., 2016b; Gao et al., 2022). Due to the variability of coal-forming environments, Fa of the samples in this study is larger than that of samples with the same coal rank in other regions, such as those mentioned in the literature (Li et al., 2021a; Wang et al., 2022b). The aromatic carbon (Fa) of vitrinite increased rapidly from 67.35% to 77.88% in Ro, ran = 0.35%–0.90%, then increased more slowly from 78.38% to 85.72% in Ro, ran = 1.20%–2.67%, and remained stable at around 86% in Ro, ran = 3.03%–4.20%. However, the aromatic carbon (Fa) of inertinite increased slowly from 76.05% to 88.14% with Ro, ran ranging from 0.35% to 2.07% and then remained stable when Ro, ran = 2.67%–4.20% (Table 7; Figure 8A). Furthermore, fa′, faH, faN, and faB of the vitrinite and inertinite gradually increased in the low-middle coal rank with the same evolution rate as Fa (Figures 8B–E). It indicates that the degree of condensation and aromatization rings were gradually increasing, which is consistent with the study of FTIR. At the high coal rank, fa′ of both the vitrinite and inertinite remained stable at about 85% and 88%, faH at about 46% and 47%, faN at about 40% and 42%, and faB at about 26% and 30%, respectively. It indicates that the aromatization difference between them is gradually decreasing.
The aliphatic carbon (fal) and aromatic carbon (Fa) showed the opposite trend with the increase in Ro, ran, which indicates that the content of aliphatic carbon (fal) decreased (Figure 8F). The aliphatic carbon exists mainly in the form of methylene and methine, followed by methyl (Table 7), suggesting that the methylene and methyl groups fell off during the coalification process. The aliphatic carbon (fal) in the vitrinite decreased rapidly from 29.32% to 19.98% in the first stage, decreased slowly from 15.87% to 12.63% in the second stage, and remained stable at about 10% in the third stage (Table 7; Figure 8F). The aliphatic carbon (fal) of the inertinite follows the same variation trend as vitrinite. It decreased slowly from 23.5% to 11.8% with Ro, ran ranging from 0.35% to 2.07% and then remained stable at about 8% when Ro, ran = 2.67%–4.20% (Table 7; Figure 8F).
Thus, the methyl fal* and methylene-methine (falH) of the samples showed the same variation trend as the aliphatic carbon (fal) with the increase in Ro, ran. In the first stage, fal* and falH of the vitrinite samples decreased rapidly with increasing Ro, ran from 3.44% and 24.65% to 2.05% and 12.85%, respectively. In the second stage, fal* and falH continued to decrease with increasing Ro, ran, and the rate of decrease was slower than that in the first stage. Overall, the methyl (fal*) and methylene-methine (falH) contents of the inertinite were less variable and slowly decreased (Figures 8G,H). At the high coal rank, the contents and change rate of the two macerals tended to be consistent and remained stable. These results showed that there were aliphatic side chains in the form of cyclane and long-chain alkanes in the low-rank coals, and the aliphatic side chains were longer. As Ro, ran increased, the aliphatic side chain gradually became shorter, which is consistent with the results of the FTIR analysis.
faC of the vitrinite and inertinite decreased rapidly from 7.81% to 22.94% and from 8.55% to 3.88% in the first and second stages, respectively. Then, they remained stable at about 1.7% and 2.3% in the third stage (Figure 8I). It indicates that the carbonyl/carboxyl groups decreased rapidly at the low-middle coal rank stage, and the content of carbonyl/carboxyl groups was small and stable at the high coal rank stage.
In addition, the aromatic carbon structure parameters of the vitrinite with the same Ro, ran were smaller than those of the inertinite, the aliphatic carbon structure parameters were larger than those of the inertinite, and they gradually tended to be the same with the increase in Ro,ran. It suggests a convergence in the evolution of the molecular structures of the two macerals. The results of Xb show that the condensation degree of aromatic carbon of inertinite is higher than the vitrinite (Figure 8J). Moreover, inertinite has a larger aromatic cluster structure. It kept increasing during the coalification process, indicating that the condensation degree of aromatic carbon keeps increasing with the increase in Ro,ran.
4 Discussion
4.1 Molecular structure evolution mechanism and difference between vitrinite and inertinite during coalification
Coalification is a chemical process in which heteroatoms gradually fall off, and carbon atoms gradually concentrate. This process involves changes in three aspects: 1) shedding of oxygen-containing heteroatom groups, 2) degradation of hydrogen-containing alkyl side chains, and 3) recarburizing and condensation of aromatic rings (Zhang et al., 2009). The relationships between XRD, FTIR, and 13C NMR structural parameters and Ro,ran show that the overall trend of coal structure evolution is that the aromatic system increases during the coalification process, but various functional groups are characterized by staged evolution, which reflects the profound coalification mechanism.
According to the FTIR and NMR spectrum, oxygen-containing functional groups in coal decrease rapidly with the increase in Ro, ran, among which ether oxygen bond C-O-C decreases the most, followed by hydroxy-OH and carbonyl and carboxyl groups C=O. The shedding of these functional groups leads to not only the relative increase in the proportion of aromatic carbon atoms in coal but also the formation of new active sites. Then, various solid and newly formed soluble organic matter further polymerizes, resulting in the enlargement of the aromatic system (Li et al., 2015b). C-O-C exists in coal as aliphatic ether and aromatic ether. Therefore, when Ro, ran < 0.90%, the group decreases rapidly with the shedding of the aliphatic structure. As Ro, ran increases, the number of aromatic ethers attached to the aromatic structure gradually increases, so the rate of decrease of the C-O-C group gradually becomes slower until it is stable. However, in the low-middle metamorphic stage, the content of aromatic ether in inertinite is more than that in vitrinite, which is difficult to be eliminated with evolution (Liu, 2021), and the content of aliphatic structure is less than that of vitrinite. Therefore, the group decreases slower with the increase in Ro, ran than in vitrinite. In the high metamorphic stage, the C-O-C group content gradually becomes flat as the aliphatic and aromatic structures become stable. The content of the C-O-C group in inertinite is lower than vitrinite at the low metamorphic stage and higher than vitrinite at the high metamorphic stage, which is consistent with the literature (Liu, 2021). The variation characteristics of DOC and absorption peaks in 1,660–1,780 cm−1 region indicate that the rapid shedding of the vitrinite carboxyl group occurred before Ro, ran = 0.90%. When Ro, ran =1.20%–2.67%, the carboxyl groups still exist. Moreover, when Ro, ran > 3.03%, it almost disappeared. However, the carboxyl group of inertinite decreases linearly and stably in the range of Ro, ran = 0.35%–2.07%; it almost disappears until Ro, ran > 2.67%.
The evolution of the aromatic and aliphatic structures of the vitrinite is divided into three stages. When Ro, ran < 0.90%, the rapid increases in parameters such as fa (FTIR), Fa, fa (13C NMR), DOC,
and I imply that the aromatization is evident in the low metamorphic stage and the condensation of aromatic rings is enhanced. It is also corroborated that the absorption peaks in the 1,490–1,620 cm−1 region of the FTIR spectrum shift toward lower wave numbers as Ro, ran increases, whereas the absorption peak area decreases because the enhancement of the condensation degree of the aromatic ring leads to the reduction of the molecule free vibration energy, which in turn leads to a decrease in the C=C bond stretching vibration frequency. Combined with the analysis of Figures 6D, 8I,J, the aliphatic structure decreased rapidly in this stage, the shedding rate of methylene was faster than that of methyl, the degree of branch chain increased, and the side chain became shorter. A lower value of A(CH2)/A(CH3) indicates that the aliphatic chain between aromatic rings is shorter as the space between coal aromatic rings with a high concentration of CH3 is smaller and has a tighter structure (Orrego-Ruiz et al., 2011). Therefore, the shedding of the aliphatic structure will also lead to the enlargement of the aromatic system. In conclusion, the coalification process results from the synergistic effect of aromatic structure, aliphatic structure, and oxygen-containing functional groups. In addition, Liu believed that the ether oxygen bond is generally short in bond length and high in bond energy, which makes it difficult to destroy. Therefore, the essential difference between vitrinite and inertinite in the evolution of coal macromolecular structure lies in the number of ether oxygen bonds, whose higher bond energy hinders the chemical bond breakage and aromatic layer rearrangement (Liu, 2021). As Ro, ran continues to increase, the shedding rate of aliphatic structure and oxygen-containing functional groups slows down significantly, leading to the weakening of aromatization. At the same time, the rate of C-O-C reduction slows down, which means that the structural reorganization barriers increase. It leads to a slowdown in the rate of aromatic layer rearrangement. As the content of C-O-O gradually remains constant, the variations of parameters such as aromatic carbon ratio, aromatic carbon, and condensation degree remain flat at the high metamorphic stage (Ro, ran = 3.03%–4.2%), indicating that the aromatic system becomes stable at this stage. The evolution of the aromatic and aliphatic structures of the inertinite is divided into two stages. When Ro, ran < 2.07%, the parameters fa (FTIR), Fa, fa (13C NMR), DOC,
and I of the inertinite increase rapidly, indicating that the aromatic system of inertinite increases linearly during the low-middle metamorphic stage. However, the aromatization degree and aromatic ether content of inertinite in the low metamorphic stage are higher than that of vitrinite, so the increase rate of the aromatic system in this stage is lower than that of vitrinite with the evolution. The shedding rate and content of C=O, C-O-O, CH2, and CH3 are smaller than those of vitrinite in the same metamorphic stage, and the rearrangement of the aromatic carbon layer is slower than in vitrinite. The structures gradually become stable at the high metamorphic stage (Ro, ran > 2.67%).
In addition, the aliphatic structure and functional groups gradually fall off as Ro, ran increases, and the coal macromolecular chains begin to connect, leading to an increase in the average crystallite diameter (La). The shedding of these structures also makes the arrangement of macromolecules more compact (Li et al., 2020b), leading to a decrease in interlayer spacing (d002). At the same time, the content of aliphatic hydrogen tends to decrease, the content of aromatic hydrogen increases, and the aromatic layer is stacked rapidly, which leads to the increase in crystallite height (Lc) and the number of carbon layers (Nave).
In conclusion, the aromatization degree of inertinite is always higher than that of vitrinite during the coalification process. The content of aromatic structure and condensation degree of the aromatic ring is greater than in vitrinite with the same Ro, ran, whereas the content of aliphatic structure, degree of branch chain, side chain length, and the oxygen-containing functional group is less than in vitrinite. The evolution rate of inertinite structures is lower than that of vitrinite, but the structural parameters of the two macerals tend to be the same in the high metamorphic stage.
4.2 Recommendations
It can be realized from the above conclusions that the macromolecular structure evolution of the vitrinite and inertinite is different during the coalification process. However, the differences between the two macerals are getting smaller and smaller. The macromolecular structure is an important basis for studying coal chemical and coal reservoir physical properties. Some recommendations for future work in the field of coal liquefaction, gasification, coking, and CBM exploration and development are as follows:
(1) The coal macerals should be studied separately to reveal the evolution of industrial and methane adsorption properties of coal with different vitrinite/inertinite ratios.
(2) The coalification process of highly enriched vitrinite or inertinite with different densities is also different (Lin et al., 2021). Studying the effect of density on the evolution of molecular structure from the perspective of a single coal maceral may be more relevant for improving the efficiency of clean coal utilization.
(3) The molecular structure of macerals is characterized by phased evolution. It has important directive significance to the reactivity, physical and chemical behavior, and reaction change trajectory of coals of different coal ranks in the thermal processing process.
(4) The developmental changes of the micropores of coal are directly controlled by the macromolecular structure, and the pore structure determines the adsorption property of coal, so the molecular structure affects the adsorption and transport of CBM. As a coal reservoir, the physical properties of vitrinite and inertinite should also be different, which has important practical significance in coalbed methane exploration and coal mine gas extraction.
5 Conclusion
The molecular structure characteristics of the two groups of thermal simulation sequence samples were quantitatively characterized by multispectral analysis, and the relationship between the molecular structure parameters and Ro,ran was discussed. Based on these results, the differences in molecular structure evolution between vitrinite and inertinite during coalification were summarized and compared. The main conclusions of this study are as follows:
(1) The coalification process results from the synergistic effect of aromatic structure, aliphatic structure, and oxygen-containing functional groups. The macromolecular structures of vitrinite and inertinite are characterized by staged evolution. When Ro,ran = 0.35%–0.90%, the oxygen-containing functional groups and aliphatic structure of vitrinite fall off rapidly, leading to the rapid increase in the aromatic system, which means that La increases. The aromatic layers accumulate rapidly, and the spatial arrangement of the aromatic layers is more regular and closer, so Lc and Nave increase, whereas d002 decreases. When Ro,ran = 1.20%–2.67%, there are still a certain amount of groups such as C=O, C-O-C, CH2, and CH3 in the vitrinite, but the content of these groups decreases with the evolution, and the side chains become shorter and more. With the shedding of oxygen-containing functional groups and aliphatic structures, La, Lc, and Nave continue to increase, whereas d002 continues to decrease. However, the rate of evolution in this stage is smaller than that in the first stage. When Ro,ran > 3.03%, the C=O group of vitrinite almost disappeared, and C-O-O existed as a small amount of aromatic ether, which was difficult to eliminate. The changes of each group become flat, the contents of oxygen-containing functional groups and aliphatic structure decrease to the lowest, the degree of branched chain reaches the maximum, and the side chain reaches the shortest.
(2) The fa, DOC, I, fa’, faH, faN, faB, and Xb of inertinite are always larger than those of vitrinite, whereas the A (CH2)/(CH3), fal, fal*, and falH of inertinite are always smaller than those of vitrinite. When Ro,ran = 0.35%–2.07%, the groups and microcrystal sizes of the inertinite maintain the same trend as those of the vitrinite, but their evolution rate is similar to that of the second stage of the vitrinite. In other words, the aromatic ether content of inertinite is more than that of vitrinite and the barriers to molecular reorganization are greater than those of vitrinite at the same stage, resulting in the shedding of oxygen-containing functional groups, methyl, and methylene at a rate less than that in vitrinite. The aromaticity, condensation degree, aromatic carbon content, and order degree of microcrystalline structure also increase at a rate less than that of vitrinite. When Ro,ran > 2.67%, the C=O group of vitrinite almost disappeared. The changes of various groups remain flat as those of vitrinite; however, the structural parameters tend to be the same as those of vitrinite, and the microcrystalline structure is closer to the graphite structure.
Data availability statement
The original contributions presented in the study are included in the article/supplementary material. Further inquiries can be directed to the corresponding author.
Author contributions
Conceptualization: DC and RQ. Data collection and analysis: RQ and LW. Methodology: LW, AW, and JL. Writing original draft: RQ. Supervision, review, and editing: DC and YW.
Funding
This study is financially supported by the National Key Research and Development Plan of China (2021YFC2902004), and the National Natural Science Foundation of China (grant Nos. 42072197, 41902170, 41972174).
Conflict of interest
The authors declare that the research was conducted in the absence of any commercial or financial relationships that could be construed as a potential conflict of interest.
Publisher’s note
All claims expressed in this article are solely those of the authors and do not necessarily represent those of their affiliated organizations or those of the publisher, the editors, and the reviewers. Any product that may be evaluated in this article, or claim that may be made by its manufacturer, is not guaranteed or endorsed by the publisher.
References
Chen, X., Li, M., and Zeng, F. (2022). Control of chemical structure on the characteristics of micropore structure in medium-rank coals. Fuel Process. Technol. 228, 107162. doi:10.1016/j.fuproc.2022.107162
Chen, Y., Mastalerz, M., and Schimmelmann, A. (2012). Characterization of chemical functional groups in macerals across different coal ranks via micro-FTIR spectroscopy. Int. J. Coal Geol. 104, 22–33. doi:10.1016/j.coal.2012.09.001
Dutta, S., Hartkopf-Froeder, C., Witte, K., Brocke, R., and Mann, U. (2013). Molecular characterization of fossil palynomorphs by transmission micro-FTIR spectroscopy: Implications for hydrocarbon source evaluation. Int. J. Coal Geol. 115, 13–23. doi:10.1016/j.coal.2013.04.003
Erdenetsogt, B.-O., Lee, I., Lee, S. K., Ko, Y.-J., and Bat-Erdene, D. (2010). Solid-state C-13 CP/MAS NMR study of Baganuur coal, Mongolia: Oxygen-loss during coalification from lignite to subbituminous rank. Int. J. Coal Geol. 82 (1-2), 37–44. doi:10.1016/j.coal.2010.02.005
Gao, B., Wu, C., Song, Y., Zhou, D., Niu, Q., Zhou, H., et al. (2022). Structural characterization of high fidelity for bituminous and semi-anthracite: Insights from spectral analysis and modeling. Fuel 315, 123183. doi:10.1016/j.fuel.2022.123183
Guo, D., and Guo, X. (2018). The influence factors for gas adsorption with different ranks of coals. Adsorpt. Sci. Technol. 36 (3-4), 904–918. doi:10.1177/0263617417730186
Guo, Y., and Bustin, R. M. (1998). Micro-FTIR spectroscopy of liptinite macerals in coal. Int. J. Coal Geol. 36 (3), 259–275. doi:10.1016/s0166-5162(97)00044-x
He, X., Liu, X., Nie, B., and Song, D. (2017). FTIR and Raman spectroscopy characterization of functional groups in various rank coals. Fuel 206, 555–563. doi:10.1016/j.fuel.2017.05.101
Ibarra, J., Moliner, R., and Bonet, A. J. (1994). FT-i.r. investigation on char formation during the early stages of coal pyrolysis. Fuel 73 (6), 918–924. doi:10.1016/0016-2361(94)90287-9
Ibarra, J., Muñoz, E., and Moliner, R. (1996). FTIR study of the evolution of coal structure during the coalification process. Org. Geochem. 24, 725–735. doi:10.1016/0146-6380(96)00063-0
Iglesias, M. J., Jimenez, A., Laggoun-Defarge, F., and Suarez-Ruiz, I. (1995). FTIR study of pure vitrains and associated coals. Energy fuels. 9 (3), 458–466. doi:10.1021/ef00051a010
Jiang, J., Yang, W., Cheng, Y., Liu, Z., Zhang, Q., and Zhao, K. (2019). Molecular structure characterization of middle-high rank coal via XRD, Raman and FTIR spectroscopy: Implications for coalification. Fuel 239, 559–572. doi:10.1016/j.fuel.2018.11.057
Kidena, K., Katsuyama, M., Murata, S., Nomura, M., and Chikada, T. (2002). Study on plasticity of maceral concentrates in terms of their structural features. Energy fuels. 16 (5), 1231–1238. doi:10.1021/ef020029j
Li, K., Khanna, R., Zhang, J., Barati, M., Liu, Z., Xu, T., et al. (2015a). Comprehensive investigation of various structural features of bituminous coals using advanced analytical techniques. Energy fuels. 29 (11), 7178–7189. doi:10.1021/acs.energyfuels.5b02064
Li, S., Zhu, Y., Wang, Y., and Liu, J. (2021a). The chemical and alignment structural properties of coal: Insights from Raman, solid-state 13C NMR, XRD, and HRTEM techniques. Acs Omega 6 (17), 11266–11279. doi:10.1021/acsomega.1c00111
Li, W., and Zhu, Y. (2014). Structural characteristics of coal vitrinite during pyrolysis. Energy fuels. 28 (6), 3645–3654. doi:10.1021/ef500300r
Li, X., Zeng, F., Wang, W., Dong, K., and Cheng, L. (2015b). FTIR characterization of structural evolution in low-middle rank coals. J. China Coal Soc. 40 (12), 9. doi:10.13225/j.cnki.jccs.2015.1085
Li, Z., Ni, G., Wang, H., Sun, Q., Wang, G., Jiang, B., et al. (2020a). Molecular structure characterization of lignite treated with ionic liquid via FTIR and XRD spectroscopy. Fuel 272, 117705. doi:10.1016/j.fuel.2020.117705
Li, Z., Ni, G., Wang, H., Sun, Q., Zhang, C., Bingyou, J., et al. (2020b). Molecular structure characterization of lignite treated with ionic liquid via FTIR and XRD spectroscopy. Fuel 272, 117705. doi:10.1016/j.fuel.2020.117705
Lin, H., Wang, Y., Gao, S., Xue, Y., Yan, C., and Han, S. (2021). Chemical structural characteristics of high inertinite coal. Fuel 286, 119283. doi:10.1016/j.fuel.2020.119283
Lin, X., Wang, C., Ideta, K., Miyawaki, J., Nishiyama, Y., Wang, Y., et al. (2014). Insights into the functional group transformation of a Chinese Brown coal during slow pyrolysis by combining various experiments. Fuel 118, 257–264. doi:10.1016/j.fuel.2013.10.081
Liu, P., Zhang, D., Wang, L., Zhou, Y., Pan, T., and Lu, X. (2016b). The structure and pyrolysis product distribution of lignite from different sedimentary environment. Appl. Energy 163 (1), 254–262. doi:10.1016/j.apenergy.2015.10.166
Liu, Z. (2021). The mechanism of graphitization difference of coal macerals based on simulation experiments Doctor. Beijing: China University of Mining and Technology.
Lu, L., Sahajwalla, V., Kong, C., and Harris, D. (2001). Quantitative X-ray diffraction analysis and its application to various coals. Carbon 39 (12), 1821–1833. doi:10.1016/s0008-6223(00)00318-3
Manoj, B., and Kunjomana, A. G. (2012). Study of stacking structure of amorphous carbon by X-ray diffraction technique. Int. J. Electrochem. Sci. 7 (4), 3127–3134.
Mathews, J. P., and Chaffee, A. L. (2012). The molecular representations of coal - a review. Fuel 96 (1), 1–14. doi:10.1016/j.fuel.2011.11.025
Mochida, I., Okuma, O., and Yoon, S.-H. (2014). Chemicals from direct coal liquefaction. Chem. Rev. 114 (3), 1637–1672. doi:10.1021/cr4002885
Okolo, G. N., Neomagus, H. W. J. P., Everson, R. C., Roberts, M. J., Bunt, J. R., Sakurovs, R., et al. (2015). Chemical–structural properties of South African bituminous coals: Insights from wide angle XRD–carbon fraction analysis, ATR–FTIR, solid state 13 C NMR, and HRTEM techniques. Fuel 158, 779–792. doi:10.1016/j.fuel.2015.06.027
Orrego-Ruiz, J. A., Cabanzo, R., and Mejía-Ospino, E. (2011). Study of Colombian coals using photoacoustic Fourier transform infrared spectroscopy. Int. J. Coal Geol. 85 (3-4), 307–310. doi:10.1016/j.coal.2010.12.013
Painter, P. C., Snyder, R. W., Starsinic, M., Coleman, M. M., Kuehn, D. W., and Davis, A. (1981). Concerning the application of FT-IR to the study of coal: A critical assessment of band Assignments and the application of spectral analysis programs. Appl. Spectrosc. 35, 475–485. doi:10.1366/0003702814732256
Pan, J., Lv, M., Bai, H., Hou, Q., Li, M., and Wang, Z. (2017). Effects of metamorphism and deformation on the coal macromolecular structure by laser Raman spectroscopy. Energy fuels. 31 (2), 1136–1146. doi:10.1021/acs.energyfuels.6b02176
Pan, J., Lv, M., Hou, Q., Han, Y., and Wang, K. (2019). Coal microcrystalline structural changes related to methane adsorption/desorption. Fuel 239, 13–23. doi:10.1016/j.fuel.2018.10.155
Ping, A., Xia, W., Peng, Y., and Xie, G. (2020). Construction of bituminous coal vitrinite and inertinite molecular assisted by 13C NMR, FTIR and XPS. J. Mol. Struct. 1222, 128959. doi:10.1016/j.molstruc.2020.128959
Qin, R., Wang, A., Cao, D., Wei, Y., Ding, L., and Li, J. (2020). Effect of peat mire evolution on pore structure characteristics in thick coal seam: Examples from Xishanyao Formation (Middle Jurassic), Yili Basin, China. Energy Explor. Exploitation 38 (5), 1484–1514. doi:10.1177/0144598720950479
Roberts, M. J., Everson, R. C., Neomagus, H. W. J. P., Okolo, G. N., Van Niekerk, D., and Mathews, J. P. (2015a). The characterisation of slow-heated inertinite- and vitrinite-rich coals from the South African coalfields. Fuel 158, 591–601. doi:10.1016/j.fuel.2015.06.006
Sharma, A., Kyotani, T., and Tomita, A. (2001). Quantitative evaluation of structural transformations in raw coals on heat-treatment using HRTEM technique. Fuel 80 (10), 1467–1473. doi:10.1016/s0016-2361(01)00018-7
Solum, M. S., Pugmire, R. J., and Grant, D. M. (1989). Carbon-13 solid-state NMR of Argonne-premium coals. Energy fuels. 3, 187–193. doi:10.1021/ef00014a012
Solum, M. S., Sarofim, A. F., Pugmire, R. J., Fletcher, T. H., and Zhang, H. (2001). 13C NMR analysis of soot produced from model compounds and a coal. Energy fuels. 15 (4), 961–971. doi:10.1021/ef0100294
Stach, E. M., Mackowsky, T. M., Teichmuller, G. H., Taylor, D., and Sfuftgarf, (1982). Stach's textbook of coal petrology.
Suggate, R. P., and Dickinson, W. W. (2004). Carbon NMR of coals: The effects of coal type and rank. Int. J. Coal Geol. 57 (1), 1–22. doi:10.1016/s0166-5162(03)00116-2
Sun, Q. L., Li, W., Chen, H., and Li, B. Q. (2003). The variation of structural characteristics of macerals during pyrolysis. Fuel 82 (6), 669–676. doi:10.1016/s0016-2361(02)00356-3
Takagi, H., Maruyama, K., Yoshizawa, N., Yamada, Y., and Sato, Y. (2004). XRD analysis of carbon stacking structure in coal during heat treatment. Fuel 83 (17-18), 2427–2433. doi:10.1016/j.fuel.2004.06.019
Wang, A., Cao, D., Wei, Y., and Liu, Z. (2020a). Macromolecular structure controlling micro mechanical properties of vitrinite and inertinite in tectonically deformed coals—a case study in fengfeng coal mine of taihangshan fault zone (north China). Energies 24, 6618. doi:10.3390/en13246618
Wang, A., Li, J., Cao, D., Wei, Y., Ding, L., and Zhao, M. (2022a). Comparison of nanopore structure evolution in vitrinite and inertinite of tectonically deformed coals: A case study in the wutongzhuang coal mine of hebei province, north China. Front. Earth Sci. (Lausanne). 10. doi:10.3389/feart.2022.822338
Wang, A., Wei, Y., Cao, D., Ding, L., and Zang, M. (2022b). Effect of different functional groups on CH4 adsorption heat and surface free energy of vitrinite during coalification. Appl. Surf. Sci. 597, 153748. doi:10.1016/j.apsusc.2022.153748
Wang, B., Qin, Y., Shen, J., Zhang, Q., and Wang, G. (2018a). Pore structure characteristics of low- and medium-rank coals and their differential adsorption and desorption effects. J. Petroleum Sci. Eng. 165, 1–12. doi:10.1016/j.petrol.2018.02.014
Wang, S., Tang, Y., Chen, H., Liu, P., and Sha, Y. (2018b). Chemical structural transformations of different coal components at the similar coal rank by HRTEM in situ heating. Fuel 218, 140–147. doi:10.1016/j.fuel.2018.01.024
Wang, Z., Fu, X., Hao, M., Li, G., Zhou, H., Niu, Q., et al. (2021a). Experimental insights into the adsorption-desorption of CH4/N2 and induced strain for medium-rank coals. J. Petroleum Sci. Eng. 204 (3), 108705. doi:10.1016/j.petrol.2021.108705
Wang, Z., Pan, J., Hou, Q., Yu, B., Li, M., and Niu, Q. (2018c). Anisotropic characteristics of low-rank coal fractures in the Fukang mining area, China. Fuel 211 (1), 182–193. doi:10.1016/j.fuel.2017.09.067
Wang, Z., Wang, H., Yang, Y., Deng, Z., Fu, X., Pan, J., et al. (2021b). Effect of the coal molecular structure on the micropore volume and the coalbed methane content. Energy fuels. 35 (23), 19437–19447. doi:10.1021/acs.energyfuels.1c02889
Xie, Y., You, J., Lu, L., Wang, M., and Wang, J. (2019). Raman spectroscopic study of coal samples during heating. Appl. Sci. (Basel). 9 (21), 4699. doi:10.3390/app9214699
Zhang, K., Yao, S., Hu, W., and Fang, H. (2009). Analysis on infrared spectra characteristic of coal and discussion of coalification mechanism. Coal Geol. Explor. 37 (6), 6.
Zhang, S.-Y., Lu, J.-F., Zhang, J.-S., and Yue, G.-X. (2008). Effect of pyrolysis intensity on the reactivity of coal char. Energy fuels. 22 (5), 3213–3221. doi:10.1021/ef800245z
Zhang, X., Wang, S., Chen, H., Guo, Q., Li, L., and Luo, G. (2021b). Aromatic structural characterization of different-rank vitrinites: Using HRTEM, XRD and AFM. Polycycl. Aromat. Compd. 41 (6), 1319–1330. doi:10.1080/10406638.2019.1676267
Keywords: vitrinite, inertinite, macromolecular structure, thermal simulation, coalification
Citation: Qin R, Wang L, Cao D, Wang A, Wei Y and Li J (2022) Thermal simulation experimental study on the difference of molecular structure evolution between vitrinite and inertinite in low-rank coal. Front. Earth Sci. 10:992017. doi: 10.3389/feart.2022.992017
Received: 12 July 2022; Accepted: 08 August 2022;
Published: 27 September 2022.
Edited by:
Yunguo Li, University of Science and Technology of China, ChinaReviewed by:
Zhenzhi Wang, Henan Polytechnic University, ChinaJienan Pan, Henan Polytechnic University, China
Dangyu Song, Henan Polytechnic University, China
Copyright © 2022 Qin, Wang, Cao, Wang, Wei and Li. This is an open-access article distributed under the terms of the Creative Commons Attribution License (CC BY). The use, distribution or reproduction in other forums is permitted, provided the original author(s) and the copyright owner(s) are credited and that the original publication in this journal is cited, in accordance with accepted academic practice. No use, distribution or reproduction is permitted which does not comply with these terms.
*Correspondence: Daiyong Cao, Y2R5QGN1bXRiLmVkdS5jbg==
†These authors have contributed equally to this work
 Rongfang Qin
 Lu Wang2†
 Anmin Wang