 Takahiro Nakajima
 Takayuki Miyoshi1,2†
 Ziqiu Xue
- 1Geological Carbon Dioxide Storage Technology Research Association, Kyoto, Japan
- 2Research Institute of Innovative Technology for the Earth (RITE), Kyoto, Japan
Distributed acoustic sensing (DAS) is an effective tool for seismic surveys and is widely used as the preferred sensor for acquiring dense Vertical Seismic Profile (VSP). However, DAS has some disadvantages compared to conventional geophone acquisition, such as single-component data, sensor directivity pattern, low S/N, etc. To apply DAS data to VSP processing, it is important to understand the characteristics of DAS measurements. This study first examined DAS and geophone responses for a VSP survey in a 1D earth model. The relationship of signal amplitude as a function of incident angle and phase shift between wavelets was confirmed. Next, we validated this relationship in a walk-away VSP survey, which was conventionally applied to monitor geological CO2 storage. The survey was carried out at a test site in Japan. We obtained both three-component (3C) geophone and DAS data using a single-mode fiber installed behind a casing. The observed amplitudes of the first P-waves by DAS and geophone showed very good agreement with the theoretical expectations. Finally, we performed imaging using acquired DAS data following the workflow for conventional VSP processing. These basic behaviors of DAS are useful for designing further analyses, such as VSP in deviated wells and full waveform inversion.
1 Introduction
Fiber-optic sensors (FOS) have been developed as advanced measurement tools. Many findings in geophysical applications have been reported in the oil and gas industries, as reviewed in Fenta et al. (2021). These applications include sensing pressure, temperature, vibration, and strain. In particular, distributed acoustic sensing (DAS) has been exploited for seismic exploration surveys during the past decade.
DAS utilizes optical time-domain reflectometry (OTDR) techniques to detect seismic waves along a fiber-optic cable. A pulse of laser light is transmitted from one end of an optical fiber; coherent, back-scattered Rayleigh light is recorded by an optical interrogator at the same end of the fiber. From the observed time of arrival of the returning light, the points passing the seismic waves can be determined (Molenaar, 2013). When a second laser pulse is fired into the fiber, changes in strain are evaluated by comparing the two records (Grindei 2019).
DAS measurements have been applied in mining, geothermal studies, natural earthquake detection, and hydraulic fracturing (Ajo-Franklin et al., 2019; Bakku et al., 2014a; Bakku et al., 2014b; Li and Zhan, 2018). DAS is now used for observation in marine environments using fibers for telecommunications deployed on the seabed (Spica et al., 2021). DAS technology is also popular for seismic data acquisition, especially in wellbores (Lellouch and Biondi, 2021). P-wave observation in less noisy environments can be expected from fibers deployed in vertical wells. A Vertical Seismic Profile (VSP) survey using DAS was assessed to possibly replace conventional surveys with geophones (Mestayer et al., 2011). Reports on VSP (Barberan et al., 2012; Willis et al., 2016; Wu et al., 2017), CO2 plume imaging by DAS-VSP (Daley et al., 2016; Miller et al., 2016; Harris et al., 2017; Cheraghi et al., 2018; Correa et al., 2018), and micro-seismic monitoring (Maxwell, 2014; Molteni et al., 2017; Karrenbach et al., 2019) have recently been published.
However, a large disadvantage of borehole DAS measurement is that only a single component can be acquired along the fiber. Moreover, DAS data on the strain or strain rate is the average over the a gauge length (Dean et al., 2016). These disadvantages introduce a sensitivity issue depending on the incident angle of a wavefield. Theoretically, the amplitude ratio of DAS over a single component of particle velocity exhibits cosine dependency as a function of the incident angle. This relationship indicates a drawback of DAS measurements of waves with large incident angles. Furthermore, comparisons of DAS and single-component geophone data have been reported in some field observations (Willis et al., 2016; Correa et al., 2017; Wu et al., 2017). In these comparisons, the basic trend followed the theoretical relationship; however, amplitude ratios in field data were very noisy. These results suggested that the relationship between DAS and geophone amplitudes in field data has not yet been fully demonstrated.
Another problem is differences in interrogator design. While some comparisons of DAS outputs among several vendors (Verliac et al., 2015; Olfsson and Martinez, 2017; Sidenko et al., 2020). Verliac et al. (2015) reported differing wavelets among three DAS datasets acquired with equipment from various suppliers, Olfsson and Martinez (2017) observed that differences among vendors were small. Sidenko et al. (2020) confirmed that the dimensions of interrogator output were deformation rate and dynamic strain, which are the output designed by the vendors. Therefore, signal directivity differed among interrogators.
Because of issues concerning differences in the averaged values or point sources and dimensional differences between DAS and conventional seismometers, it is critical to understand what is measured, and what limitations apply to those DAS measurements for a given interrogator unit. In further analysis, data conversion might be necessary to adjust data dimensions.
The present study compared DAS and conventional geophone data in a field survey conducted in Japan. In Section 2, we examine the theoretical relationship between strain rate and particle velocity that are observable by conventional geophone. In Section 3, we compute a synthetic wavefield at vertical observation points in layered models. We then compared the wavefield of direct P-waves measured by Vz and the vertical components of the strain rate. In Section 4, we introduce a test field for DAS measurements in Japan. During a walk-away VSP survey at this site, we collected both DAS and three-component (3C) geophone data at a borehole. From these data, we examined the sensitivity of the sensors against the incident angles by comparing the signal amplitudes of the direct P-waves. We also studied the resolution of imaging results obtained by standard VSP data analysis.
2 Theory of DAS measurements
In strain rate measurements for DAS output, the output is proportional to the strain rate averaged over a gauge length. This is the same as Silixa’s iDAS (Willis et al., 2020). Bakku (2015) reported that this type of output can be interpreted as the difference in velocities measured by two separated geophones. We followed their method to compute the theoretical strain rate in this study.
As many have noted, DAS measurements depend on gauge length (G) and pulse width (L) (Dean et al., 2016; Correa et al., 2017). In the following analysis, we assume that the wavelength of elastic waves is several times larger than the G and L. The DAS output for an optical fiber installed in a vertical borehole is represented by the difference in the strain at the internal sampling interval (Parker et al., 2013; Daley et al., 2016).
where
or the spatial derivative of the dynamic displacement of the fiber
where
We consider a primary seismic plane wave propagating in the z-direction with an apparent velocity
where
where
This equation indicates that the strain rate amplitude depends on the apparent velocity in the z direction. Daley et al. (2016) applied this conversion to limited interval data, where the apparent velocity is a constant. This relationship suggests that the amplitude would be changed in layers with different apparent velocities. Another point in the comparison of Eqs 6, 7 is that time integration is needed as the first step to convert strain rate data to an equivalent geophone signal.
We can also derive the relationship between the strain rate and the total amplitude of the particle velocity. The sine
A more sophisticated transformation between DAS and geophone data was proposed by Bona et al. (2017) by considering the effects of gauge length and pulse width. Their evaluation is a kind of two-spatial averaging filter, and the amplitude ratio between DAS and geophone depends on the wavelength of the seismic field compared to the gauge length. This filter was applied to field data by Correa et al. (2017). Although the effect of gauge length is important in DAS measurement, the present study does not consider gauge length correction in its evaluation of the effect of depth-dependent apparent velocity in the DAS—geophone data conversion.
3 Comparison of DAS and geophone data using synthetic wave computation
We compared geophone and DAS data by calculating the seismic wavefield using a synthetic method. We first simulated the wavefield from a point source on layered earth models. Based on the observation points in a wellbore, the velocity fields at 5-m depth intervals were calculated. From the obtained velocity field, the strain rate
To simulate a synthetic wavefield, we used “grpnt2” developed by Hisada (1994); Hisada (1995). This code calculates the strict Green’s function theoretically in layered half-space and uses an efficient mathematical method for wavenumber integrations. The wavefield excited by a Ricker wavelet with a 20-Hz dominant frequency was obtained in the frequency domain using this code. As the time domain wavefield was a bit noisy due to the transformation from the frequency domain to the time domain, we applied a bandpass filter to reduce artificial vibrations.
We tested three earth models to compare DAS and geophone responses: homogeneous, a layer model without an impedance jump, and a layer model with an impedance jump. To simplify the comparison among models, the parameters at the upper layer were identical. The parameters of the synthetic model are summarized in Table 1.
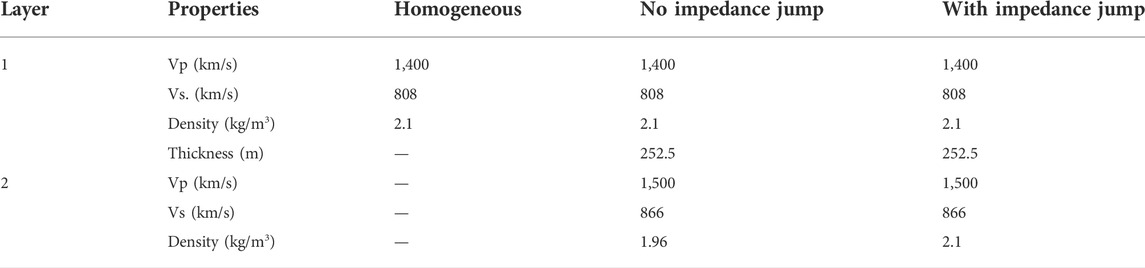
TABLE 1. Summary of the synthetic models.
3.1 Homogeneous model
First, we computed the wavefield in a homogeneous half-space model. Density was set to 1,400 m/s for Vp, 808 m/s for Vs, and 2.1 kg/m3. We placed vertical sources at points 100 and 500 m horizontally from the wellbore. We introduced two source points because we encountered difficulties in following the first P-wave at shallower receivers (low incident angle). The P- and S-waves become too close to separate and were also affected by surface Rayleigh waves. These mixed waves cannot be regarded as a simple plane wave. Therefore, we excluded data from receivers shallower than 100 m in subsequent analysis. Then, the range of incident angles became limited at near offset (100 m) data. To cover the incident angle for the comparison between DAS and geophone data, we added far offset (500 m) results.
Figure 1 shows the wavefield in the synthetic homogeneous model in the case of a 500-m offset. To clearly show the wavefield, the time axis was shifted to 0.2 s using the grpnt2 function. Figures 1A,B are shot gathers for particle velocity and strain rate, respectively. The event starting about 0.55 s with a downward bent is the direct P-wave, while that starting about 0.8 s corresponds to the direct S-wave. The line connecting direct P- and S-waves represents the Rayleigh wave with a smaller propagation velocity than that of the S-wave excited at the surface. The directional dependency of amplitude is illustrated in this figure. The amplitude of the direct P-wave at shallower depths decreases since the wave path is close to the right angle to the measurement component. In contrast, the wavefield of the S-wave is perpendicular to the propagating direction; thus, the amplitude of the S-wave near the surface is larger than that of the P-wave. Figure 1C represents wavefields around the first break of the P-wave at a depth of 400 m for Vz and strain rate, although the amplitudes of the wavefields were normalized so that the maximum amplitude of the direct wave in the time domain is equal to 1. As Eq. 6 suggests, the wavelet of the particle velocity is close to the minimum phase, while that of the strain rate becomes zero phase. Figure 1D is the ratio of strain rate to particle velocity as a function of incident angle. The incident angle was simply evaluated by geometrical arrangement, and the amplitude ratio was normalized using the deepest point data to adjust the theoretical relationship (
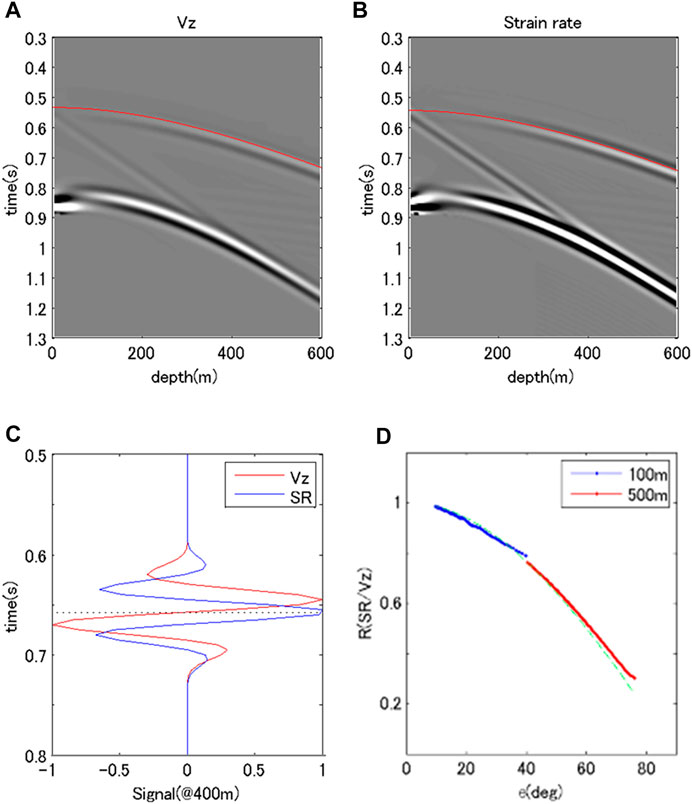
FIGURE 1. Characteristics of the synthetic wavefield in a homogeneous model. (A,B) show shot gather with the z components of the particle velocity and the calculated strain rate, respectively. Overlapping red lines correspond to the first P-wave. (C) shows the wavefields around the P-wave arrival by particle velocity (red) and calculated strain rate (blue) at a depth of 400 m. The amplitude was normalized with the maximum absolute value equal to 1. (D) represents the P-wave amplitude ratio of strain rate/particle velocity. The colored lines correspond to the difference in the source offset; blue: 100 m, red: 500 m. The green line is the reference of the
3.2 A layer model without impedance jump
Next, we computed the wavefield in a layer model without a jump in impedance. We studied this artificial case to consider the effects of differences in inherent velocity without impedance jump. Therefore, we set the parameters of the second layer to 1,500 m/s for Vp, 866 m/s for Vs, and 1.96 kg/m3 for density at a boundary depth of 252.5 m. We also calculated the wavefield from the 100 and 500 m offsets.
Figure 2 shows the wavefields of this model for a 500-m offset. Figures 2A,B illustrate shot gathers for particle velocities and strain rates, respectively. The events in these figures are almost the same as those in Figures 1A,B. However, reflected and converted waves can be seen in Figure 2B at the point of 252.5 m and 0.6 s. These waves correspond to converted P-S waves, where the properties of wave propagation were not the same as in the homogeneous model. Figure 2C shows normalized wavefields around the first P-wave (at 400 m) for strain rate and particle velocity. The features of the two wavefields are the same as those in Figure 1C. Figure 2D is the ratio of strain rate to particle velocity as a function of incident angle. The incident angle was evaluated by ray tracing between sources and receivers in the velocity model. The ratios at the two offsets differ above and below the layer boundary. From the part above the boundary, the ratios were close to the theoretical dependency,
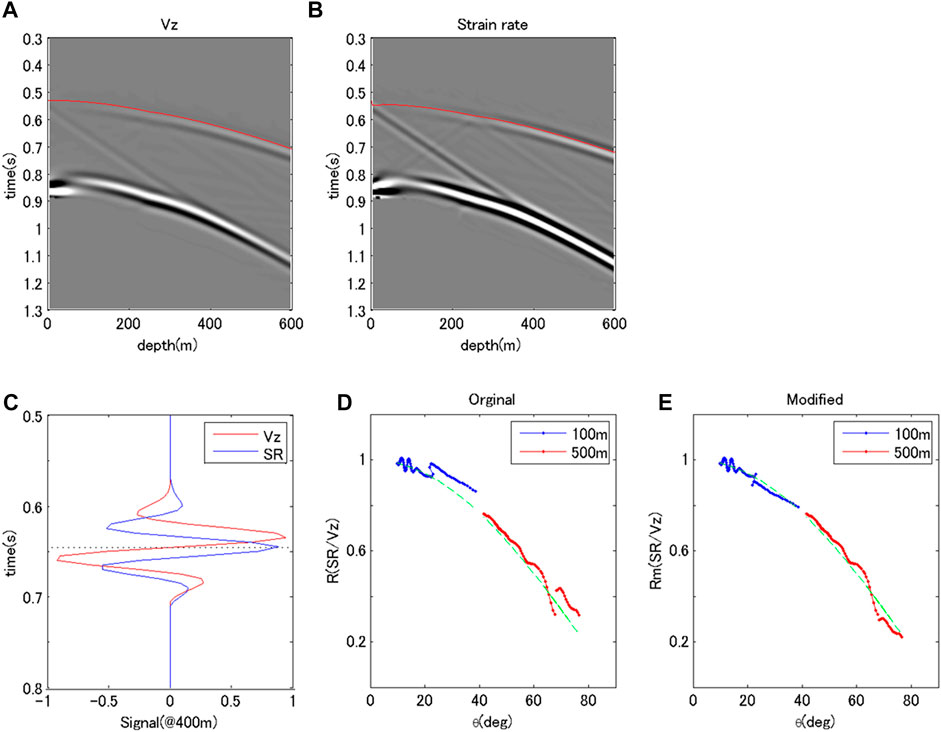
FIGURE 2. Characteristics of the synthetic wavefield in a layer mode without a difference in acoustic impedance. (A–D) use the same arrangement as in Figure 1. In wavefields shown in (C), amplitude normalization is the same as in the homogeneous model. (E) shows the amplitude ratio modified by the effect of apparent velocity. The colors in (E) are the same as in (D).
3.3 A layer model with impedance jump
Finally, we computed the wavefield in a layer model with a jump in impedance. In this model, the amplitude of the wavefield decreased due to reflection at the layer boundaries. We used the same values as in the previous model, except for the density of the second layer (2.1 kg/m3, as in the top layer).
Figure 3 shows the wave fields of this model for a 500-m offset. The shot gathers (A and B) show events similar to those in the previous models. Moreover, apparent reflected waves, especially S-S waves, appear at the point of 252.5 m and 0.9 s. The reflection at the surface is also evident. Figure 3C shows the normalized wavefields around the first P-wave (at 400 m) for strain rates and particle velocities. Although this reflected wave decreased the amplitude of the wavefield below the boundary, the amplitude ratio between strain ratio and particle velocity was the same, except for data near the boundary. Figures 3D,E are the ratios of strain rates to particle velocities before and after the modification of apparent velocity. The modification worked well to adjust the amplitude ratio between strain rate and particle velocity to the theoretical dependency of the incident angle.
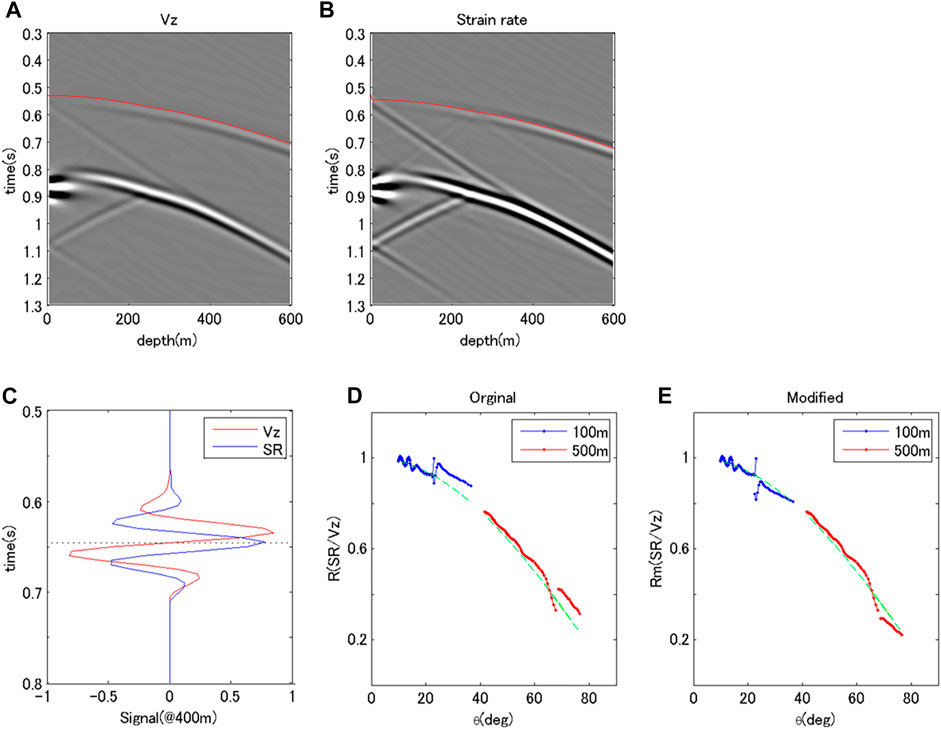
FIGURE 3. Characteristics of the synthetic wavefield in a layer mode with impedance change. (A–E) show the same arrangement as in Figure 2. In the wavefields shown in (C), amplitude normalization is the same as in the homogeneous model.
The synthetic model confirmed the dependency of the incident angle in the amplitude ratio by modification of the apparent velocity. This was also noted by Daley et al. (2016). However, many papers comparing the amplitude of DAS and geophone data did not consider this dependency. The next chapter introduces our field survey and shows the results using DAS.
4 A walk-away VSP survey in chiba, Japan
The results of a walk-away VSP survey at a site in Japan were used to compare DAS and geophone data. Although there was no expected subsurface change at this site, such as fluid injection, the results are a good reference for understanding the characteristics of DAS measurements and considering survey design using DAS-VSP.
4.1 Overview of the field survey
To conduct field experiments for DAS measurements, we have established a research site in Chiba Prefecture, Japan. This site has an 880-m, deep-cased borehole with a single-mode and single-end, straight, fiber-optic cable cemented behind the casing, a 250-m well in which a straight and a helically wound cable are cemented, and surface deployed cables buried in a shallow trench (Figure 4). These installed fibers were connected as a one-stroke sketch to measure the DAS signal with an interrogator located in an observation shed. This study focused on DAS data from this borehole to compare the sensitivity pattern against that of a conventional geophone.
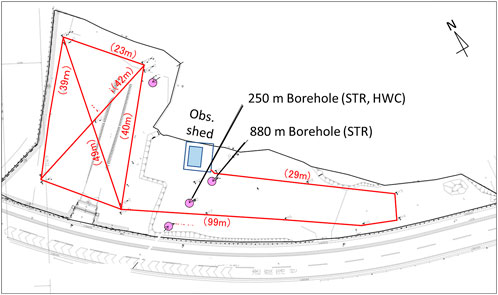
FIGURE 4. Overview of a test field for DAS field measurement in Chiba, Japan.
A walk-away VSP experiment was carried out in January 2021. Eleven shot points were selected for the survey (Figure 5). Shot points up to 1,300 m away from the borehole were employed (Figure 5). At each shot point, a vibroseis truck was used, with an increased number of sweeps at far-offset points. Particle velocity was acquired via a 3C geophone tool with four downhole shuttles. The shuttle interval was 15 m. Therefore, with 21 deployments, we obtained data measurements every 7.5 m between depths of 100 and 700 m in the casing of the 880-m borehole. In contrast, a Silixa iDAS v2 interrogator unit was used for the DAS measurements. The data interval was set to ∼1 m. Furthermore, DAS was available for data acquisition at every sweep of geophone measurements; thus, the total number of stacks at each shot point was approximately 100;5 (sweeps) x 21 (geophone deployments). The data acquisition settings of the walk-away VSP survey are summarized in Table 2.
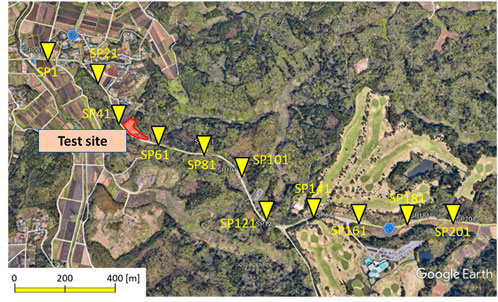
FIGURE 5. Positions of shot points and the observation site for a walk-away VSP conducted in January 2021.
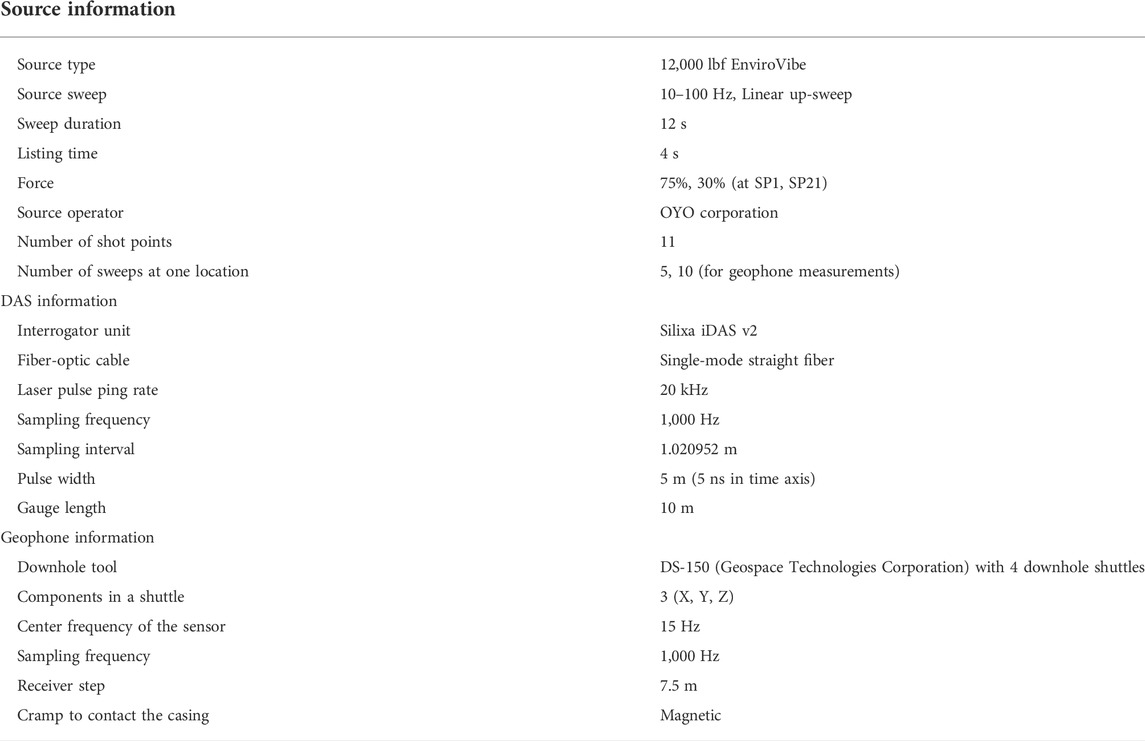
TABLE 2. VSP survey settings.
4.2 Comparison of observed wave data between DAS and geophone measurements
We first examined the signal-to-noise ratios (SNRs) between the DAS and geophone measurements. We simply compared the root-mean-square (RMS) between the direct P-wave signal and the duration before the first break. The seismic signal at each sweep was clearer in the geophone data. This noise floor of DAS data was higher than that of the geophone data. Figure 6 shows the SNR of DAS against stack numbers at SP121, offset 650 m, where the SNR of the geophone data was obtained by stacking five sweeps. The SNR of DAS increased when the stack number increased. When the number of stacks reached 100 for DAS at a 650-m offset and a 700-m depth, the SNRs were comparable to those of geophone data. This difference in the stack number was not disadvantageous for DAS. The geophone tool must be relocated to cover the entire length of the borehole, while DAS data can be acquired at all depths in a single sweep.
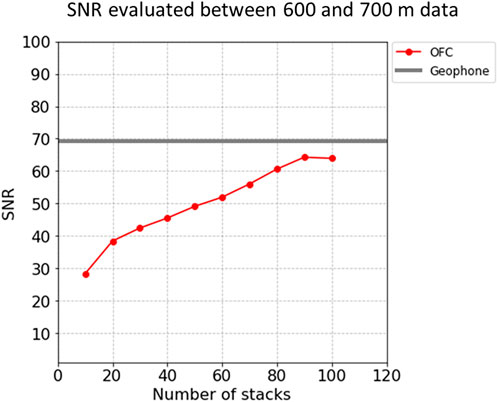
FIGURE 6. Comparison of SNR by geophone and DAS. Geophone data were evaluated by a stack of five sweeps and the effect of stacking to SNR is shown for DAS data.
Next, we compared the wavefields obtained with DAS and geophone. Figure 7 shows the wavefield and spectrum around the first P-wave at the SP121 shot point (offset 650 m) and recorded at 700 m. Unlike the results of the synthetic model, the wavelet at the direct P-wave of DAS and geophone data was close to the zero-phase case. However, the apparent first break time of the DAS data was earlier than that of the geophone data. The synthetic results and field data differences occurred due to the method of data deconvolution. The source signal was a linear sweep with a vibroseis, and the shot gathered was calculated by cross-correlation or source deconvolution. This process produces essentially zero-phase data. However, the difference in first break time may reflect the phase difference of the wavelets. As Daley et al. (2016) noted, the time integration procedure of DAS data can reduce the difference between DAS and geophone data.
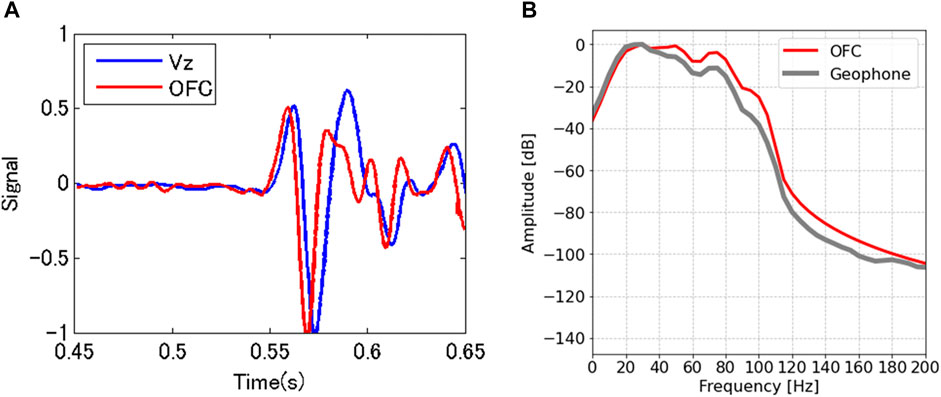
FIGURE 7. Comparison of DAS and geophone data shot at a 650-m offset and a 700-m depth. (A) Wavefield in the time domain. (B) Amplitude spectrum.
After confirmation of the waveform of the direct P-wave, we compared the amplitudes of DAS and geophone data. We first evaluated the incident angle of the direct P-wave between shot points and receivers using 3C geophone data (Figure 8). This analysis did not use any special rock physics model to modify the observed amplitude. The horizontal direction and amplitude at each receiver potion were evaluated from particle motions of horizontal components of the geophone records. The incident angle was then calculated from the evaluated horizontal and vertical components of the geophone. The general trend of the incident angle (Figure 8) became steeper, as expected. This step provided a precise incident angle for the DAS amplitude trend against the angle and also allowed the comparison of DAS amplitude with both Vz and the total amplitude of the particle velocity. We also compensated for the difference in apparent velocity along the well, as shown in Eq. 7. Since the P-wave velocity generally increases with depth, the amplitude ratio without this modification increases at larger angles.
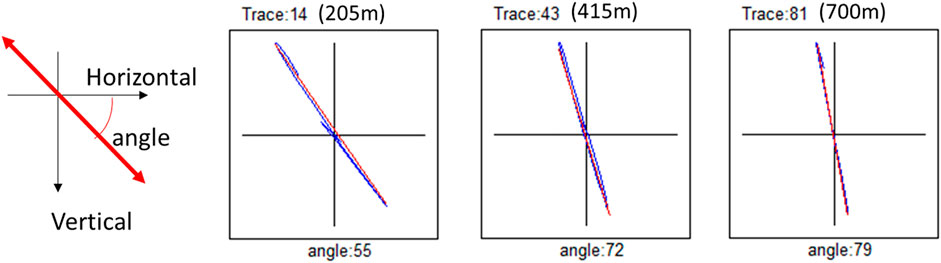
FIGURE 8. Evaluation of the incident angle evaluated by the three geophone components when the vibrator is shot at SP61. The locus is obtained from the time duration of the direct P-wave arrival.
Figure 9 shows the ratios of DAS amplitude over Vz (A) and over the total amplitude of the particle velocity (B) against the incident angle. Dependencies are shown at all shot points against the theoretical dependencies on the incident angle; i.e.,
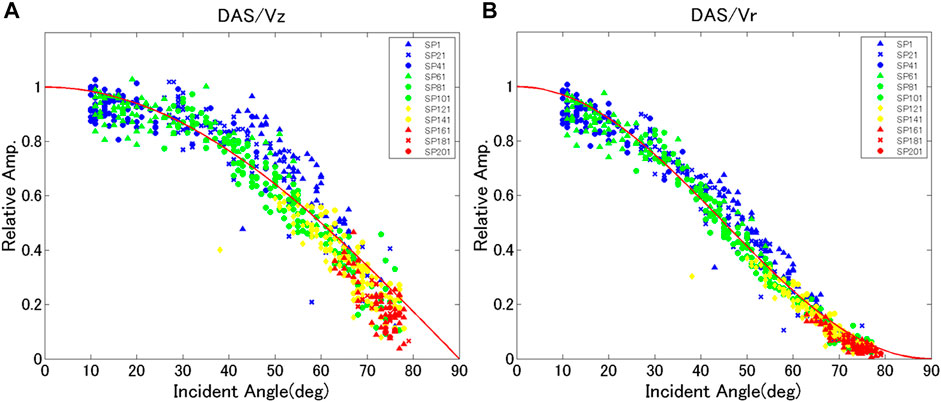
FIGURE 9. Incident angle dependency of DAS amplitude over the geophone amplitude evaluated by the direct P-wave. (A) Vz amplitude for geophone data. (B) Geophone total amplitude. The colors and markers correspond to different shot points.
4.3 Comparison of imaging results between DAS and geophone data
We evaluated imaging from DAS and geophone data, where only Vz components were used for geophone data processing.
First, we compared shot gathers of DAS and geophone stacked data. Figure 10 shows the shot gathers collected at each offset. In the near-offset geophone results, the noise was evenly aligned along the time axis because the sensitivity of the Vz geophone array component was not even. This effect was large in the near-offset survey. The quality of the shot gather was good in both DAS and geophone, and the direct P- and S-waves were clearly recognizable. From the first break time in the nearest offset data, we evaluated a 1-D velocity model of the site for the further analysis.
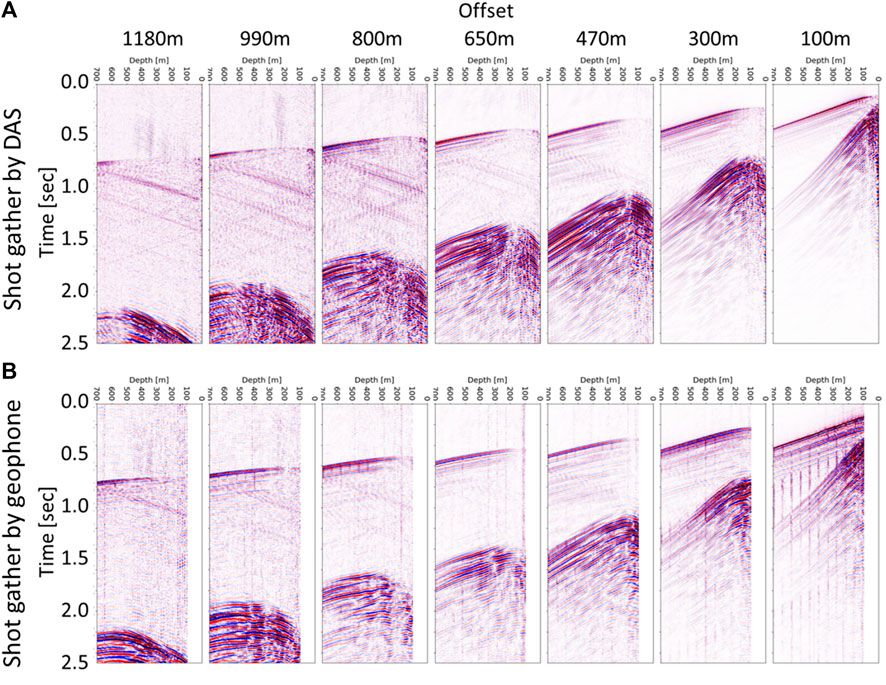
FIGURE 10. Shot gathers obtained by DAS (A) and geophone array (B) at each shot point.
These results were used for image data processing. To image DAS data, we utilized data at 7.5-m and 1-m intervals to compare the effect of measurement density. The 7.5-m interval is the same as that of the geophone, and 1 m is the resolution of the original DAS data, although the SNR is inferior to the averaged data. The peak position of source deconvolved data from DAS measurement is about 5 ms ahead compared to that of geophone data (Figure 7). This difference can be adjusted with time integration of each trace. Signature deconvolution (Isaenkov et al., 2020), would also be useful to adjust wavelets and to obtain clear reflected events, although we did not do that in this data analysis. After preconditioning, we followed the general data processing flow for 2D-VSP. This workflow includes wavefield separation and VSP-CMP transformation. For wavefield separation, an FK-filter was used to isolate primary PP reflections. This filter is also valid to exclude diminishing S-waves. For time migration, we used normal moveout (NMO) and common mid-point (CMP) stacking techniques. Bins for migration were set at 5 m.
After time domain data processing, the time axis of the image was converted to a depth domain (Figure 11). The white area in the wide area view (upper raw) means that the reflection points cannot be visualized by the configuration of this survey. The general characteristics of the strong reflections were similar between the DAS and geophone images. However, the results looked different in the enlarged view. The reflections in geophone measurement were not clear in the right (eastern) part shallower than 800 m, while the continuity of reflections improved in DAS measurements, even in 7.5-m interval data. The coupling of the geophone at that shot point may not have been not equal to that at other shots, as the geophone tool must be relocated at each depth and shot point.
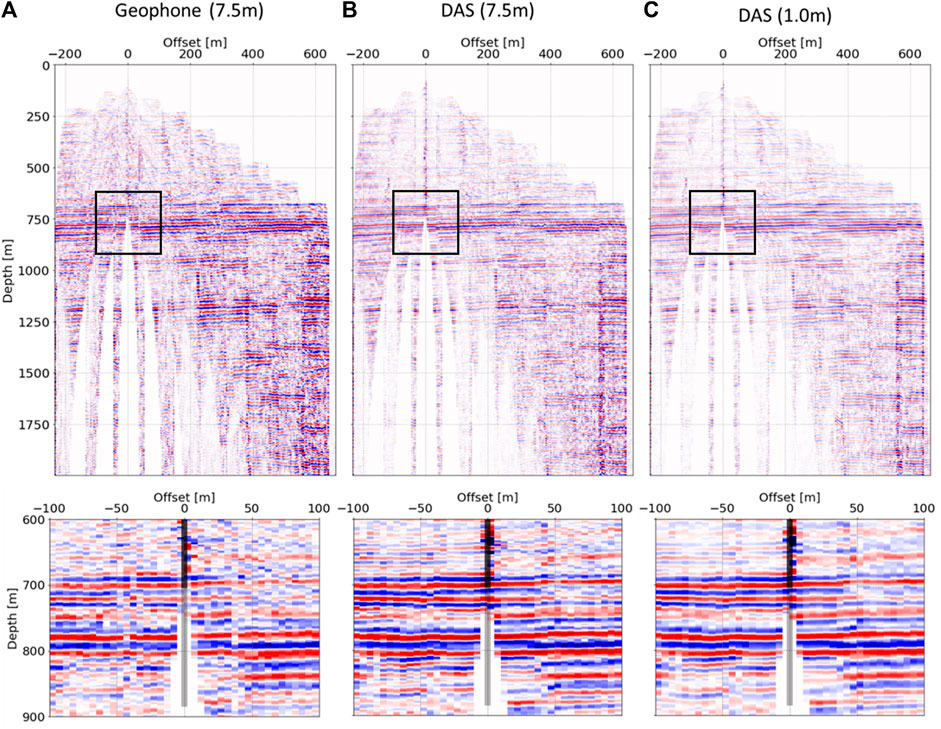
FIGURE 11. Migrated VPS images for 2-D walk away at a test site in Japan. Vz data [(A) 7.5-m intervals], averaged DAS data [(B) reduced to 7.5-m intervals], and original DAS data [(C) 1-m intervals] were used for migration processing. The upper raw image represents a wide area, while the lower image is the enlarged view around the well.
Comparison of the results of DAS data at 7.5 and 1 m intervals showed that the reflections were more clearly connected at smaller intervals. This is because the number of traces at each bin for migration was larger at 1 m intervals. This effect had advantages despite the inferior SNR at each trace. This represents another advantage of DAS-VSP with distributed sensing.
5 Discussion
To consider the observed characteristics of DAS data, we computed synthetic wavefields from a point source excitation using simple layered models. The calculated velocity field was taken as the spatial derivative to obtain the strain rate. The amplitude ratio between the strain rate and particle velocity of the direct P-wave showed that the effect of inherent velocity is more important than that of impedance, as previously suggested in DAS papers (Daley et al., 2016; Isaenkov et al., 2020), but we confirmed the compensation method for recovering the DAS amplitude. Note that the determination of wavefield amplitude near layer boundaries including the surface was difficult, even for synthetic results. This difficulty occurs because some converted waves are too close to separate near the boundaries. Therefore, we considered two shot points to cover a wide range of incident angles. This would be more severe in field surveys with observation noise.
We demonstrated a walk-away DAS-VSP using a single-mode fiber installed behind the casing of a borehole at a site in Japan. During survey comparisons, DAS and 3C geophone data were acquired at the same borehole. Using the survey data, we performed two main analyses: we compared the amplitude ratio of the direct P-wave as a function of the incident angle between DAS and geophone data. To exclude the effect of surface waves, we did not use shallow (<100 m) data. We also applied the same compensation method as in a synthetic case, in which the velocity trend was considered. Isaenkov et al. (2020) discussed the effect of rock stiffness on the amplitude ratio. This effect is essentially the same as our compensation method since both methods consider changes in medium velocity. Our results show very good agreement with the theoretical relationship. We believe that the results are the best to date among reported field results.
Field data were also imaged using DAS and geophone data. The total time of data acquisition was the same except for the wireline logging efforts to relocate the geophone array. Even though the DAS data had a lower SNR compared to that for geophone data at each trace and shot point, the connectivity of the reflected waves was better in the DAS data. One reason for this is the high-density data in DAS measurements. Many traces was more important than the quality of individual traces in the imaging analysis. Another reason is that the observation points did not change in DAS measurements and the coupling between DAS and the formation was invariant, illustrating the advantages of DAS-VPS. In contrast, signal amplitudes with high incident angles were weaker than those of the geophone (Figure 7). This is the major limitation of DAS measurements. Thus, it is better to design survey plans to exploit the sensitivity of the DAS sensor. When data with a low-sensitivity angle must be acquired, we should consider the survey time to stack the data. These limitations are important for cost-effective surveys, as in time-lapse monitoring of subsurface CO2.
As many papers have indicated, DAS has lower sensitivity than geophone (Figure 6). However, new interrogators with high sensitivity are being developed. Moreover, the proper combination of engineered fiber and interrogator reportedly yields DAS sensitivity comparable to that of high-sensitivity seismometers (Hartog et al., 2022; Shatalin et al., 2022). This type of interrogator also has a larger dynamic range than that used in the present study. Thus, the issue of sensitivity will hopefully soon be solved.
6 Conclusion
We compared strain rates based on DAS and particle velocity data using synthetically computed data and a field survey in Japan. DAS amplitude depended on the incident angle of the acoustic waves; however, we also confirmed its dependency on the apparent velocity. The synthetic computations of artificial layered models showed that the effect of the apparent velocity in the layer is more important than that of the reflected waves. The amplitude change due to reflection was automatically adjusted by taking the ratio of the strain rate and the particle velocity, except near the boundary zone. While the effect of apparent velocity has already been suggested in the derivation of DAS measurements, it has been little discussed in the literature.
To examine the effectiveness and limitations of DAS measurements in field surveys, we conducted a walk-away VSP at a test site for DAS measurement in Japan. We acquired DAS data using a combination of a single-mode straight fiber installed behind the casing and a Silixa iDAS v2 interrogator and also obtained a conventional geophone array in the same wellbore. The amplitude ratio of DAS and geophone as a function of the incident angle agreed well with the theoretical relationship after modification of the effect of the apparent velocity. Furthermore, we compared imaging results obtained using a standard VSP analyzing workflow. The DAS image was superior at near offset owing to the high-density data and better repeatability compared to those for wireline logging. These results will guide future survey designs, such as the offset range of shot points, survey time, monitoring of small changes in physical parameters, and surveys related to the incident angle of the wavefield.
Data availability statement
The original contributions presented in the study are included in the article/Supplementary Material. Further inquiries can be directed to the corresponding author.
Author contributions
All authors listed have made substantial, direct, and intellectual contributions to the work and have approved its publication.
Acknowledgments
This article is based on results obtained from a project (JPNP18006) commissioned by the New Energy and Industrial Technology Development Organization (NEDO) and the Ministry of Economy, Trade and Industry (METI) of Japan. We thank Suncoh Ltd. for its support during the data acquisition in this study and for guidance during the processing phases.
Conflict of interest
Suncoh Ltd provided their support during the data acquisition of this study, and their guidance during processing phases. The authors declare that the research was conducted in the absence of any other commercial or financial relationships that could be construed as a potential conflict of interest.
Publisher’s note
All claims expressed in this article are solely those of the authors and do not necessarily represent those of their affiliated organizations, or those of the publisher, the editors, and the reviewers. Any product that may be evaluated in this article, or claim that may be made by its manufacturer, is not guaranteed or endorsed by the publisher.
References
Ajo-Franklin, J. B., Dou, S., Lindsey, N. J., Monga, I., Tracy, C., Robertson, M., et al. (2019). Distributed acoustic sensing using dark fiber for near-surface characterization and broadband seismic event detection. Sci. Rep. 9, 1328. doi:10.1038/s41598-018-36675-8
Bakku, S. K. (2015). Fracture characterization from seismic measurements in a borehole (Massachusetts Ave, Cambridge, MA: Massachusetts Institude of Technology). Ph.D. thesis.
Bakku, S., Wills, P., Fehler, M., Mestayer, J., and Lopez, J. (2014a). “Vertical seismic profiling using distributed acoustic sensing in a hydrofrac treatment well,” in 84th SEG annual international meeting, Denver, United States, October 26–31, 2014, 5024–5028. doi:10.1117/12.2050550
Bakku, S., Wills, P., and Fehler, M. (2014b). “Monitoring hydraulic fracturing using distributed acoustic sensing in a treatment well,” in 84th SEG annual international meeting (Denver, United States, October 26–31, 2014), 5003–5008. doi:10.1190/segam2014-1559.1
Barberan, C., Allanic, C., Avila, D., Yh-Billiot, J., Hartog, A., Frignet, B., et al. (2012). “Multi-offset seismic acquisition using optical fiber behind turing,” in 74th EAGE conference & exhibition incorporating SPE EUROPE 2012, Copenhagen, Denmark, 4-7 June 2012.
Bona, A., Dean, T., Correa, J., Pevzner, R., Tertyshnikov, K. V., and Van Xaanen, L. (2017). “Amplitude and phase response of DAS receivers,” in 79th EAGE conference & exhibition 2017, Paris, France, June 12-15, 2017.
Cheraghi, S., White, D., Harris, K., and Roberts, B. (2018). “Initial results of time-lapse processing of VSP geophone and DAS fiber-optic cable at Aquistore CO2 injection site,” in 80th EAGE conference & exhibition, Copenhagen, Denmark, June 11-14, 2018.
Correa, J., Egorov, A., Tertyshnikov, K., Bona, K., Pevzner, R., Dean, T., et al. (2017). Analysis of signal to noise and directivity characteristics of DAS-VSP at near and far offsets – a CO2CRC Otway project data example. Lead. Edge 36, 994a1–994a7. doi:10.1190/tle36120994a1.1
Correa, J., Tertyshnikov, K., Wood, T., Yavuz, S., Freifeld, B., and Pevzner, R. (2018). “Time-lapse VSP with permanent seismic source and distributed acoustic sensors: CO2CRC stage 3 equipment trials, GHGT-14,” in 14th International Conference on Greenhouse Gas Control Technologies, Melbourne, Australia, 21-26 October 2018.
Daley, T. M., Miller, D. E., Dodds, K., Cook, P., and Freifeld, B. M. (2016). Field testing of modular borehole monitoring with simultaneous distributed acoustic sensing and geophone vertical seismic profiles at Citronelle, Alabama. Geophys. Prospect. 64, 1318–1334. doi:10.1111/1365-2478.12324
Dean, T., Cuny, T., and Hartog, A. (2016). The effect of gauge length on axially incident p-wave measured using fiber optic distributed vibration sensing Geophys. Prospect. 65, 184–193. doi:10.1111/1365-2478.12419
Fenta, M. C., Potter, D. K., and Szanyi, L. (2021). Fibre optic methods of prospecting: A comprehensive and modern branch of Geophysics. Surv. Geophys. 42, 551–584. doi:10.1007/s10712-021-09634-8
Grindei, L., Kelley, M., Modroo, A., Mondanos, M., Farhadiroushan, M., and Coleman, T. (2019). “Distributed acoustic sensing (DAS) for monitoring CO2 injection into a Pinnacle-Reef reservoir,” in 2nd EAGE workshop practical reservoir monitoring 2019, Amsterdam, Netherlands, April 1-4, 2019.
Harris, K., White, D., and Samson, C. (2017). Imaging the Aquistore reservoir after 36 kilotonnes of CO2 injection using distributed acoustic sensing. Geophysics 82, M81–M96. doi:10.1190/geo2017-0174.1
Hartog, A. H. (2020). “Distributed sensors in the oil and gas industry,” in Optical fibre sensors. Editors I. del Villar, and U. R. Matias (Hoboken, NJ, USA: John Wiley & Sons), 151–191.
Hisada, Y. (1994). An efficient method for computing Green's functions for a layered half-space with sources and receivers at close depths. Bull. Seismol. Soc. Am. 84, 1456–1472. doi:10.1785/bssa0840051456
Hisada, Y. (1995). An efficient method for computing Green's functions for a layered half-space with sources and receivers at close depths (part 2). Bull. Seismol. Soc. Am. 85, 1080–1093. doi:10.1785/bssa0850041080
Isaenkov, R., Glubekovskikh, S., Tertyshnikov, K., Pevzner, R., and Bonna, A. (2020). “Effect on rocks stiffness on observed DAS VSP amplitude,” in EAGE Workshop on fiber optic sensing for energy applications in Asia Pacific, Perth, Australia, November 9–11, 2020.
Karrenbach, M., Cole, S., Ridge, A., Boone, K., Kahn, D., Rich, J., et al. (2019). Fiber-optic distributed acoustic sensing of microseismicity, strain and temperature during hydraulic fracturing. Geophysics 84 (1), D11–D23. doi:10.1190/geo2017-0396.1
Lellouch, A., and Biondi, B. L. (2021). Seismic applications of downhole DAS. Sensors (Basel) 21 (9), 2897. doi:10.3390/s21092897
Li, Z., and Zhan, Z. (2018). Pushing the limit of earthquake detection with distributed acoustic sensing and template matching: A case study at the brady geothermal field. Geophys. J. Int. 215, 1583–1593. doi:10.1093/gji/ggy359
Maxwell, S. (2014). Microseismic imaging of hydraulic fracturing: Improved engineering of unconventional shale reservoirs. Denver, CO, USA: Society of Exploration Geophysics.
Mestayer, J., Cox, B., Willis, P., Kiyashchenko, D., Lopez, J., and Costello, M. (2011). “Field trials of distributed acoustic sensing for geophysical monitoring,” in 81st SEG annual international meeting (San Antonio, USA: Society of Exploration Geophysicists), 4253–4257. expanded abstract. doi:10.1190/1.3628095
Miller, D. E., Daley, T. M., White, D., Freifeld, B. M., Robertson, M., Cocker, J., et al. (2016). Simultaneous acquisition of distributed acoustic sensing VSP with multi-mode and single-mode fiber-optic cables and 3C-Geophones at the Aquistore CO2 storage site. Canadian Society of Exploration Geophysics 41 (6), 28–33.
Molenaar, M. (2013). “Field cases of hydraulic fracture stimulation diagnostics using fiber-optic distributed acoustic sensing (DAS) measurements and analysis,” in SPE Middle East unconventional gas conference and exhibition, Muscat, Oman, January 28–30, 2013.
Molteni, D., Williams, M. J., and Wilson, C. (2017). Detecting microseismicity using distributed vibration. First Break 35, 51–55. doi:10.3997/1365-2397.35.4.87841
Olofsson, B., and Martinez, A. (2017). Validation of DAS data integrity against standard geophones – DAS field test at Aquistore site Lead. Edge 36, 981–986.
Parker, T., Shatalin, S. V., Farhadiroishan, M., and Miller, D. (2013). “Distributed acoustic sensing : Recent field data and performance validation,” in 2nd EAGE workshop on permanent reservoir monitoring 2013– Current and future trends, Stavanger, Norway, July 2–5, 2013.
Shatalin, S., Parker, T., and Farhadireoushan, M. (2022). “High definition and microseismic data acquisition using distributed and engineered fiber optic acoustic sensors,” in Distributed acoustic sensing in Geophysics, geophysical monograph series 268. Editors Y. Li, M. Karrenbach, and J. B. Ajo-Franklin (Hoboken, NJ, USA: Jhon Wiley & Sons), 1–32.
Sidenko, E., Bonna, A., Pevzner, R., Issa, N., and Tertyshnikov, K. (2020). “Influence of interrogators’ design on DAS directional sensitivity,” in EAGE workshop on fiber optic sensing for energy applications in asia pacific, Perth, Australia, November 9–11, 2020
Spica, Z. J., Castellanos, J. C., Viens, L., Nishida, K., Akuhara, T., Shinohara, M., et al. (2022). Subsurface imaging with ocean-bottom distributed acoustic sensing and water phases reverberations. Geophys. Res. Lett. 49, e2021GL095287. doi:10.1029/2021GL095287
Verliac, M., Lesnikov, V., and Euriat, C. (2015). “The Rousse-1 DAS VSP experiment – observations and comparison from various optical acquisition system,” in SEG 85th annual international meeting, New Orleans, United States, October 18–23, 2015, 5534–5528. doi:10.1190/segam2015-5886544.1
Willis, M. E., Barkfoot, D., Elimauthaler, A., Wu, X., Barrios, O., Erdemir, C., et al. (2016). Quantitative quality of distributed acoustic sensing vertical seismic profile data. Lead. Edge 35 (7), 605–609. doi:10.1190/tle35070605.1
Willis, M. E., Ellmauthaler, A., Wu, X., and Leblanc, M. J. (2020). “Important aspects of acquiring distributed acoustic sensing (DAS) data for geoscientists,” in Distributed acoustic sensing in Geophysics, geophysical monograph series 268. Editors Y. Li, M. Karrenbach, and J. B. Ajo-Franklin (Hoboken, NJ, USA: John Wiley & Sons), 33–44.
Keywords: distributed acoustic sensing (DAS), DAS sensitivity, relationship between DAS and geophone, walk-away VSP, monitoring by DAS
Citation: Nakajima T, Miyoshi T, Hashimoto T and Xue Z (2022) Case study on amplitude and phase response comparison between DAS and 3C geophone VSP surveys at a test site in Japan. Front. Earth Sci. 10:991964. doi: 10.3389/feart.2022.991964
Received: 12 July 2022; Accepted: 07 September 2022;
Published: 03 October 2022.
Edited by:
Yibo Wang, Institute of Geology and Geophysics (CAS), ChinaReviewed by:
Yikang Zheng, Institute of Geology and Geophysics (CAS), ChinaWuqun Li, Innovation Academy for Precision Measurement Science and Technology (CAS), China
Copyright © 2022 Nakajima, Miyoshi, Hashimoto and Xue. This is an open-access article distributed under the terms of the Creative Commons Attribution License (CC BY). The use, distribution or reproduction in other forums is permitted, provided the original author(s) and the copyright owner(s) are credited and that the original publication in this journal is cited, in accordance with accepted academic practice. No use, distribution or reproduction is permitted which does not comply with these terms.
*Correspondence: Takahiro Nakajima, dG5hazA2QHJpdGUub3IuanA=
†These authors have contributed equally to this work