 Liliana Velasquez-Montoya
1*†
Liliana Velasquez-Montoya
1*†
 Anna Wargula
1
†
Anna Wargula
1
† Jessica Nangle1
 Elizabeth Sciaudone
2Elizabeth Smyre3
Elizabeth Sciaudone
2Elizabeth Smyre3
 Tori Tomiczek
1
Tori Tomiczek
1
- 1 United States Naval Academy, Naval Architecture and Ocean Engineering Department, Annapolis, MD, United States
- 2 North Carolina State University, Department of Civil, Construction and Environmental Engineering, Raleigh, NC, United States
- 3 Dewberry, Raleigh, NC, United States
Structural coastal protection interventions have been implemented worldwide to stabilize channels and shorelines in tidal inlets. Although these conventional “gray” interventions typically attain their goals, there is an increasing interest and need to consider nature-based or “green” interventions that also address system resilience and environmental impacts. For a better implementation of gray to green interventions in tidal inlets, their effectiveness and their effects on the velocity of these dynamic coastal systems need to be understood. The effects on flow velocity of gray to green coastal protection interventions for tidal inlets are assessed here by exploring six interventions intended to protect against erosion on the estuarine-side shoreline near the inlet. A field-calibrated numerical model with Willmott Skill scores rated as excellent for Oregon Inlet located in North Carolina, United States, is used to simulate tidal currents under present conditions and after implementing a seawall, a set of bendway weirs, a terminal groin extension, a dual-jetty system, a flood channel relocation, and an island restoration project. Comparisons of time series of flow velocities in the flood channel along an eroding, estuarine shoreline are used to identify the effectiveness of each coastal protection alternative at reducing erosive velocities. Geospatial difference maps are used to determine velocity changes caused by each alternative throughout the inlet system. With no coastal protection interventions, the velocities along the eroding shoreline exceeded an erosive threshold velocity (defined as 0.2 m/s) during 50% of the simulated period. Alternatives closer to the green side of the coastal protection intervention spectrum, such as channel relocation and island restoration, tend to display the most effectiveness at reducing flow velocities at the eroding shoreline while resulting in minimal inlet-wide hydrodynamic changes. On the other hand, gray alternatives either cause minimal (seawall and bendway weirs) or extreme (jetties) changes in velocities throughout the inlet system. This comparison of gray and green coastal protection interventions in tidal inlets serves as an example to contrast the effectiveness of different coastal protection alternatives at reducing erosive flow velocities and to inform alternative selection at other inlet systems.
Introduction
Tidal inlets, which connect the open ocean to an inland body of water (e.g., a sound or bay), are naturally prone to dynamic changes, as longshore sediment transport elongates and erodes the upstream and downstream barrier islands, respectively (Bruun, 1978; Hayes, 1980; Hayes and FitzGerald, 2013). Given the dynamicity of tidal inlets and their economic relevance for navigation, recreation, and fisheries, neighboring communities face complex management and engineering challenges related to these coastal features (Beck and Wang, 2019; Toso et al., 2019; Elko et al., 2020). With the aim to allow for safe navigation through inlets or to protect infrastructure (e.g., roads, electrical and utility lines, private property), inlets have historically been stabilized, in this context meaning that an inlet is kept open in a somewhat fixed location (Bruun, 1978; Dean and Dalrymple, 2002). This stabilization can be accomplished through traditional, “gray” engineering solutions (e.g., hardened structures), including jetties and terminal groins (Bruun, 1978; Seabergh et al., 1997; Dean and Dalrymple, 2002; Seabergh and Kraus, 2003; Kraus, 2008), using “green” (e.g., nature-based) engineering alternatives, like channel relocation (Cleary and FitzGerald, 2003; Vila-Concejo et al., 2004; Rosgen, 2011), or through hybrid approaches (Ruprecht et al., 2016; Smolders et al., 2020; Rankin et al., 2022). Although gray, green, or hybrid engineering interventions may accomplish their intended stabilization goals, they can also lead to other consequences, such as changes in circulation patterns and morphological adjustment of ebb deltas and channels (Wang and Beck, 2012; Garel et al., 2014; Velasquez-Montoya et al., 2020), development of scour holes (Lillycrop and Hughes, 1993; Ferrarin et al., 2018; Toso et al., 2019), or severe erosion of the downdrift barrier island (Seabergh and Kraus, 2003; Houston and Dean, 2016). Morphological adjustments may also create the need for permanent or seasonal dredging and mechanical sand bypassing (Seabergh and Kraus, 2003; Toso et al., 2019).
Natural or anthropogenically-induced hydrodynamic changes of tidal inlets tend to lead to rapid morphological adjustments on the beaches and ebb delta on the ocean side, where breaking waves and longshore currents drive sediment transport (Hayes and FitzGerald, 2013). If erosive patterns are present on the ocean side, they may be mitigated through well-documented solutions such as beach nourishments and dune restoration (Elko et al., 2020) or hardened structures (Dean and Dalrymple, 2002). However, the estuarine side of a tidal inlet is often made up of a complex flood delta of meandering channels and shallow shoals, surrounded by low-lying marshlands, where the erosive forces come from channelized currents, fetch- and depth-limited wind waves, and vessel wakes. Examples of tidal inlets with complex systems of flood deltas include those in the Outer Banks of North Carolina and the Sea Islands in South Carolina, United States. Thus, if an eroding estuarine shoreline develops near a tidal inlet, different coastal protection approaches are needed compared to those employed on the ocean side shorelines.
Green engineering methods, such as Natural and Nature-Based Features (NNBF), have been broadly used along estuarine shorelines and have been shown to mitigate erosion while also enhancing ecosystem benefits (Bridges et al., 2015, 2021). Large-scale NNBF solutions for mitigating shoreline erosion in and near a tidal inlet can include channel relocation (Cleary and FitzGerald, 2003; Vila-Concejo et al., 2004; Rosgen, 2011) and island restoration (Berkowitz and Szimanski, 2020), while localized NNBF solutions can include living shorelines (Hardaway and Byrne, 1999; Hardaway et al., 2017; Polk and Eulie, 2018) and thin layer placement (Wilber 1992; Berkowitz et al., 2017, 2019). NNBF and hardened solutions may also be combined, such as by including a rock sill on the offshore edge of a living shoreline to break wave energy or by armoring eroding banks with stabilizing material that is natural or native (e.g., root wad or vegetated geogrids).
Studies comparing the efficacy of gray and green coastal protection interventions have focused on ocean front shoreline erosion and wave height attenuation (Narayan et al., 2016; Morris et al., 2018) and highlight the need for additional quantitative evidence of the effectiveness of different types of coastal interventions. On that regard, wave height attenuation in natural environments by mangroves have been reported to range between 38 and 65% (Tomiczek et al., 2022a), by seagrass less than 20% (Paul and Amos, 2011) and by marshes up to 70% (Garzon et al., 2019) and 80% (Yang et al., 2012), depending on the length of the marsh field and incident hydrodynamic conditions (e.g., wave height, period, water depth relative to vegetation). Despite the relevance of these findings, the system performance was reported for a specific range of applicable environmental and vegetation parameters, leading to a knowledge gap in the quantification of the performance of natural systems for comparison with that of traditional coastal protection interventions (Ostrow et al., 2022). Therefore, the comparative impacts of gray and green interventions at unique sites must be better understood, particularly considering circulation patterns and their effectiveness in reducing erosive currents near tidal inlet systems.
Fast currents flowing through tidal inlets tend to generate dynamic morphological changes, leading to management challenges in maintaining navigability and protecting infrastructure on adjacent shorelines. This study aims to increase understanding of the consequences for velocity and related performance of coastal protection alternatives near tidal inlets exploring different engineering interventions along the gray to green spectrum as defined by SAGE (2017); Webb et al. (2019); Bridges et al. (2021); and Singhvi et al. (2022). Under this spectrum, “gray” coastal interventions are engineered infrastructure made of conventional structural elements like walls, rocks, and rubble mounds intended to decrease shoreline erosion, wave damage, and flooding. On the other hand, “green” coastal interventions are designed and constructed to mimic nature. Thus, they imply building with nature to create natural barriers and working with natural processes to reduce erosion, flooding, and wave damage while providing ecosystem services. “Hybrid” interventions combine elements from green and gray infrastructure, or where natural processes are combined with artificial maintenance.
Simulated depth-averaged velocities from a field-calibrated numerical model based on Delft3D are used to investigate the changes in flow owing to gray and green coastal protection interventions, with a focus on the estuarine flood delta. A total of six coastal protection alternatives are considered and compared in their performance at reducing erosive flow velocities near an estuarine shoreline in the back-barrier region of a barrier island. An effectiveness scale based on the duration of flow velocities below an erosion threshold is proposed and used to categorize the performance of the six alternatives. Geospatial analysis of flow velocities at peak tidal flows are also presented to illustrate the differences between hydrodynamic effects at local scales (i.e., shoreline) and inlet scales created by each coastal protection alternative.
The study is completed for Oregon Inlet, North Carolina, on the east coast of the United States, and results are discussed in a generalized context for their potential application to other tidal inlet systems where gray or green coastal protection alternatives need to be considered. Erosion and loss of marshland along estuarine shorelines have been reported worldwide (Bendoni et al., 2016; FitzGerald and Hughes, 2019; Murray et al., 2022), and such problems are exacerbated near tidal inlets where fast currents can undercut shorelines causing marshland collapse. The novelty of this work resides in the exploration of the hydrodynamic effectiveness of gray to green coastal protection alternatives around deep and steep shoreline-adjacent channels created by tidal inlets, which are intrinsically different environments from typical shallow and gentle sloping estuarine shorelines.
Study site
Oregon Inlet, which was formed by a storm in 1846 (Inman and Dolan, 1989), is the northernmost tidal inlet on the barrier island system known as the Outer Banks of North Carolina, United States of America (Figures 1A,B). It is the only stable inlet within nearly 210 km of shoreline and provides connectivity between the Albemarle-Pamlico Sound and the Atlantic Ocean. The inlet is approximately 1-km wide in its most constricted section and has a complex system of shoals and channels with maximum depths of 15 m in the deepest channels. The ebb and flood deltas extend approximately 3.5 km offshore and 10 km inland respectively. The ebb delta has an average depth of 2 m, while the flood delta on the estuarine side is composed of a system of shoals and three main channels, herein referred to as the north, center, and south flood channels (Figure 1C), with approximate maximum depths of 8 m, 4 m and 15 m respectively. The depth of the shoals in the flood delta varies from 2 to 0 m, with the shallower shoals emerging on the surface during low tide.
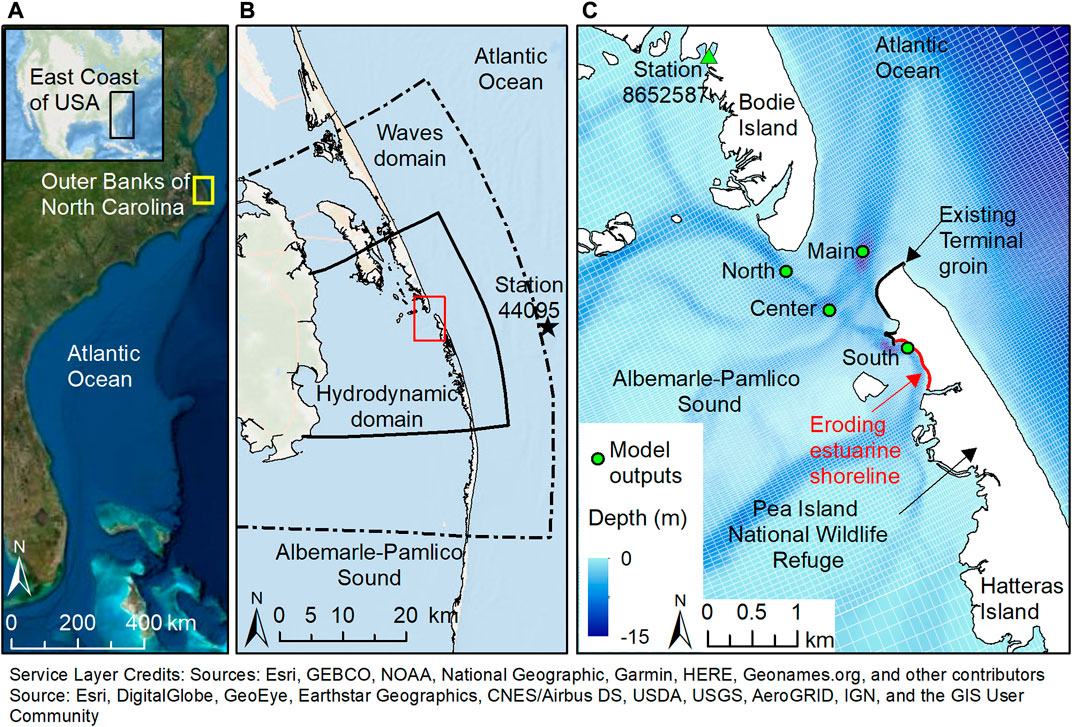
FIGURE 1. Study Area. (A) Location of the Outer Banks of North Carolina relative to the East Coast of the United States. The yellow rectangle indicates the extent of panel (B). (B) The Outer Banks with the hydrodynamic and wave model domains indicated in black solid and black dashed-dot lines, respectively. The red rectangle indicates the extent of panel (C). (C) Oregon Inlet, where blue shades indicate depths in meters relative to NAVD88.
The main transportation and coastal infrastructure surrounding Oregon Inlet are, respectively, the 4.5-km long Marc Basnight Bridge that crosses the inlet and a terminal groin that was constructed along the northern edge of the southern barrier island (Hatteras Island) in 1991. The terminal groin was built to protect the abutment of the original bridge crossing the inlet, the Herbert C. Bonner Bridge, from potential scouring due to the southern migration of the inlet. Since then, the northern barrier island (Bodie Island) has extended to the southwest (Joyner et al., 1998), and the main channel of the inlet has rotated counterclockwise (Velasquez-Montoya et al., 2020). As the inlet’s main channel has rotated, the channels and shoals in the flood delta have evolved as well. Aerial imagery from 2003 to 2021 have shown that the south channel has curved and encroached into the estuarine shoreline of Hatteras Island, causing shoreline erosion rates on the order of 3.4 m/yr–4.5 m/yr (Dunn et al., 2019; Tomiczek et al., 2022a).
The south flood channel meanders along the estuarine shoreline on the edge of the Pea Island National Wildlife Refuge, located on Hatteras Island (Figure 1C). The channel’s thalweg depths vary from 6 to 15 m, relative to the North American Vertical Datum of 1988 (NAVD88), creating steep slopes with the adjacent shoreline that range between 15% (∼1:7) to 45% (∼1:2). Flow velocities in this channel are ebb-dominated and reach up to 1 m/s under typical conditions. The eroding estuarine shoreline adjacent to the south flood channel is 1-km long, with areas covered by marshes, salt flats, and small pocket beaches (Velasquez-Montoya et al., 2021). Erosion on the estuarine side of the barrier island results in loss of habitat for migratory birds and an increased proximity of the estuarine waters to the only roadway that connects the refuge and the communities along Hatteras Island with mainland North Carolina.
Tides on the Outer Banks of North Carolina are semidiurnal with an ocean side range of 1 m. Waves are seasonal; the most energetic period occurs from October to April when extratropical storms generate significant wave heights above 3 m mostly from the northeast. During the remaining half of the year, wave energy is low, except when tropical storms and hurricanes reach the area (Inman and Dolan, 1989; Velasquez-Montoya et al., 2020). Water levels and currents inside Oregon Inlet are influenced by both tidal and subtidal processes (e.g., waves and winds) (Jarrett, 1978; Nichols and Pietrafesa, 1997; Humberston and Lippmann, 2022). Currents inside Oregon Inlet are typically ebb-dominated, ranging from roughly -1.5 m/s to 0.5 m/s (positive indicates flooding from ocean to bay) (Nichols and Pietrafesa, 1997; Humberston and Lippmann, 2022). On the estuarine side, the Albemarle-Pamlico Sound is a well-mixed estuary with average depths of 5 m. The net annual average freshwater inflow to the Pamlico Sound is 906 m3/s, of which 490 m3/s are contributed by the Albemarle Sound (Giese et al., 1985). Flow stratification has only been reported near the riverine discharges located more than 20 km away from the tidal inlet (Giese et al., 1985).
Methods
Numerical model setup
Given that the Albemarle-Pamlico Sound is a well-mixed estuary, a two-dimensional depth-averaged numerical model based on Delft3D (Lesser et al., 2004) coupled with the third-generation wave model Simulating WAves Nearshore (SWAN) (Booij et al., 1999) was set up to simulate the hydrodynamics (i.e., water levels and currents) and waves at Oregon Inlet under present conditions and with different coastal protection alternatives. The hydrodynamic model extends 35 km alongshore and 27 km cross-shore (Figure 1B), including Mainland North Carolina to the west and ocean depths of about 25 m to the east. The hydrodynamic model has two subdomains that allow for increased resolution near the inlet; the length of the grid cells varies from 600 m at the boundaries to 15 m near the inlet. Water level boundary conditions are obtained from large-scale simulations of the Advanced Circulation Model (ADCIRC) (Luettich and Westerink, 2004; Westerink et al., 2008), part of Coastal Emergency Risk Assessment (CERA) archives.
The wave model domain extends 70 km alongshore with Oregon Inlet located in the middle of the domain to prevent boundary artifacts from reaching the area of interest. The wave grid has cells with lengths ranging from 750 m near the boundaries to 30 m near the inlet. Wave boundary conditions are extracted from the closest wave buoy to the site, Station 44095—Oregon Inlet, owned by the University of North Carolina System Coastal Studies Institute (black star in Figure 1B). Spatially constant, time-varying wind speed and direction are extracted from the closest meteorological station to Oregon Inlet, the National Oceanic and Atmospheric Administration’s (NOAA’s) Oregon Inlet Marina, North Carolina - Station ID: 8652587 (green triangle in Figure 1C), and are used for wind-wave growth in SWAN and wind-driven flows in Delft3D.
The bathymetry and topography of the model were obtained from different sources; thus, interpolation and smoothing were performed within Delft3D to retain realistic features while preventing interpolation artifacts from multi-source data merging. The bathymetry of the ocean-side was obtained from the 10-m resolution digital elevation model of the North Carolina Floodplain Mapping Project (Blanton et al., 2008). The bathymetry of the Albemarle-Pamlico Sound was extracted from NOAA’s H11032 hydrographic survey with an average point spacing of 100 m, and the depths of the inlet channels and shoals were obtained from the 2019 U.S. Army Corps of Engineers (USACE) hydrographic survey (Figure 1C) with point spacing ranging from 0.5 to 30 m. All depths and elevations were converted to meters and referenced from NAVD88. The terminal groin in the south shoulder of Oregon Inlet is schematized as a thin dam, which is an infinitely thin object that prevents flow between adjacent computational cells (Deltares, 2022). The piles of the Marc Basnight Bridge are schematized as porous plates using spatially varying energy loss coefficients ranging from 0.03 to 3.75 dependent on the bridge pile sizes relative to the size of the computational cells (Deltares, 2022).
The numerical model for Oregon Inlet has been calibrated and validated for previous hydrodynamic and morphological studies for the inlet. The details of the calibration and validation can be found in Velasquez-Montoya and Overton (2017), Velasquez-Montoya et al. (2020), and Velasquez-Montoya et al. (submitted). In summary, model calibration and validation has been performed on the ocean and estuarine side of the inlet by comparing simulated currents, water levels, and waves with field data from 2014, 2019, and 2020. Table 1 presents the summary of skill scores (Sutherland et al., 2004; Bosboom, et al., 2014; Mao and Xia, 2018) for mean-subtracted water levels and depth-averaged along-channel velocity measured for 30 days in 2019 and 15 days in 2020 in the south flood channel (Velasquez-Montoya et al., submitted). Skill scores considered include the root-mean-square magnitude RMS, the Pearson correlation coefficient CC, the root-mean-square deviation RMSD, the relative bias RB, the Brier skill score BSS (Brier, 1950), and the Willmott Skill WS (Willmott, 1981). The model was found to accurately represent the hydrodynamics (water levels and currents) at the south flood channel of the inlet with WS for mean-subtracted water levels and depth-averaged velocities ranging from 0.85 to 0.94, which rate as excellent performance in accordance with Willmott (1981). Calibration and validation of the wave heights on the ocean side were performed previously (Velasquez-Montoya and Overton, 2017) for two 15-day periods in 2014 with a Mean Absolute Error of 0.29 m. Observed and simulated waves could not be compared in 2019 and 2020 because of the lack of observations in the vicinity of the inlet.
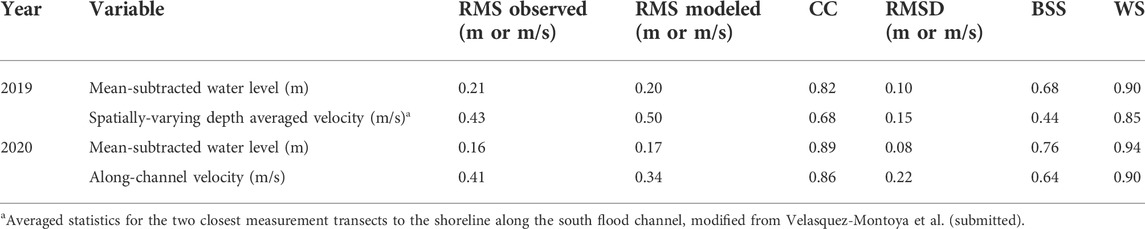
TABLE 1. Skill scores of water levels and velocities.
Simulations
A 30-day period of typical oceanographic and atmospheric conditions in the absence of major storms in 2020 was selected to simulate the hydrodynamics of Oregon Inlet under six estuarine coastal protection alternatives (Table 2) and present conditions. A calm period was selected as it better represents the daily hydrodynamic conditions in the back-barrier region and along the tidal inlet. Similar to previous studies, which suggest that daily stresses may dominate over episodic storms in causing long term marsh erosion (Leonardi et al., 2018), analysis of monthly aerial imagery from 2003 to 2021 over Oregon Inlet has shown steady rates of estuarine shoreline erosion over time that does not change significantly from stormy to calm seasons (Dunn et al., 2019; Tomiczek et al., 2022b). Therefore, a calm period is examined to determine the impact of engineering interventions on the daily stressors driving erosion on the estuarine shoreline.
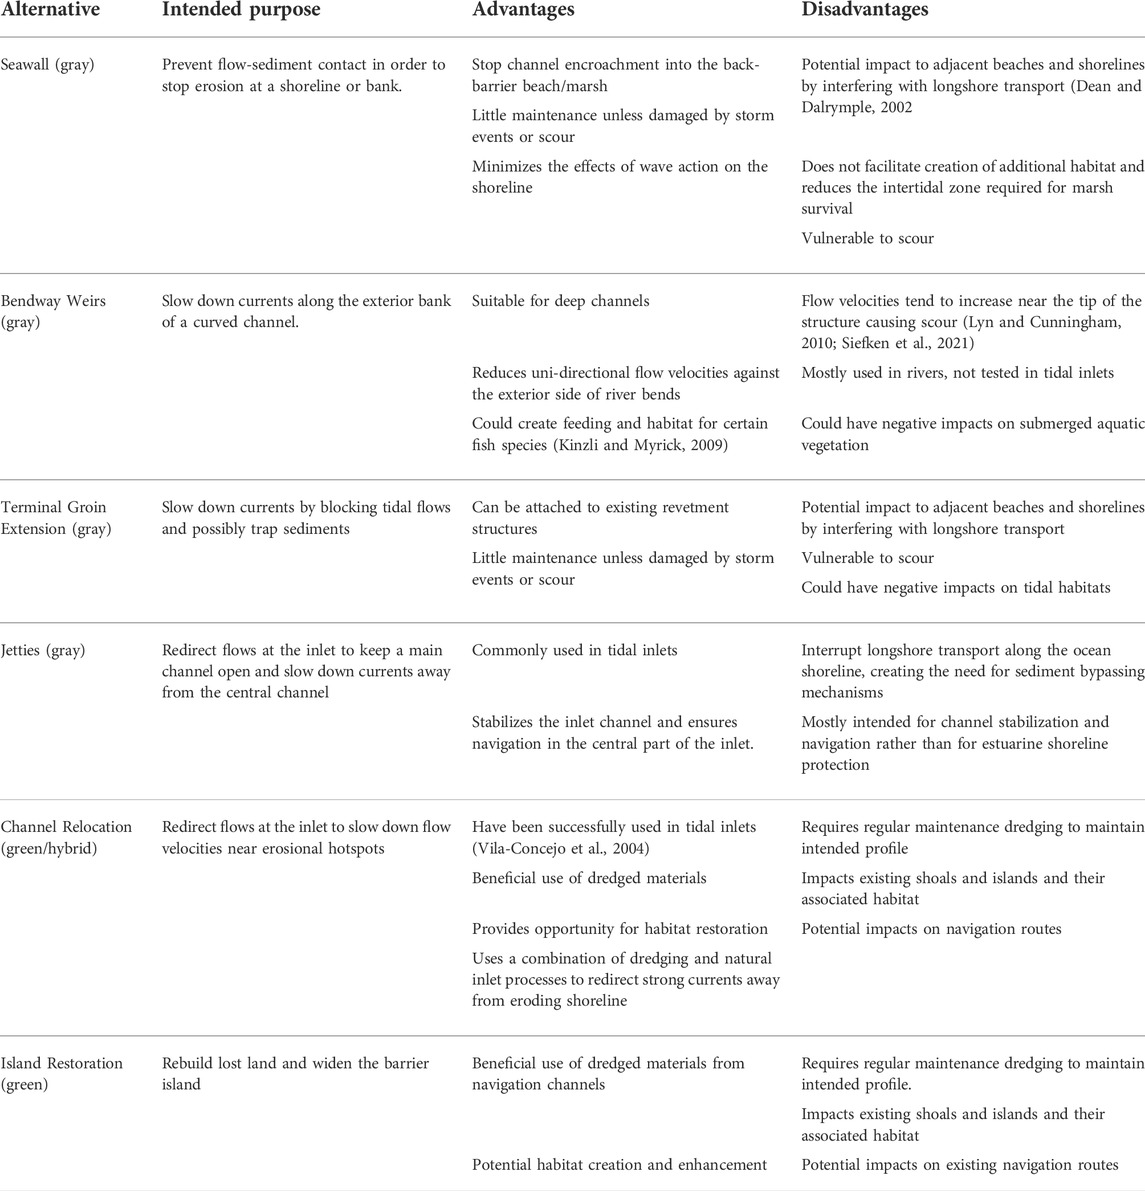
TABLE 2. Coastal protection alternatives with advantages and disadvantages of their use near tidal inlets. Note that this list does not include challenges related to local permitting or economic considerations.
All simulations were forced with tides, waves, and winds from August 12 to September 11, 2020, with a spin up period of 15 days to ensure hydrodynamic conditions stabilized from initial conditions. This period also corresponds to the model validation period, where water levels and depth-averaged velocities were accurately simulated (Velasquez-Montoya et al., submitted). A summary of the boundary conditions is shown in Figure 2. Water levels on the ocean boundary included neap and spring conditions, with a maximum total water level of 1.00 m (NAVD88). Significant wave heights predominantly from the east quadrant ranged between 0.36 and 1.86 m, and wind speed reached a maximum of 12.50 m/s with varying directions.
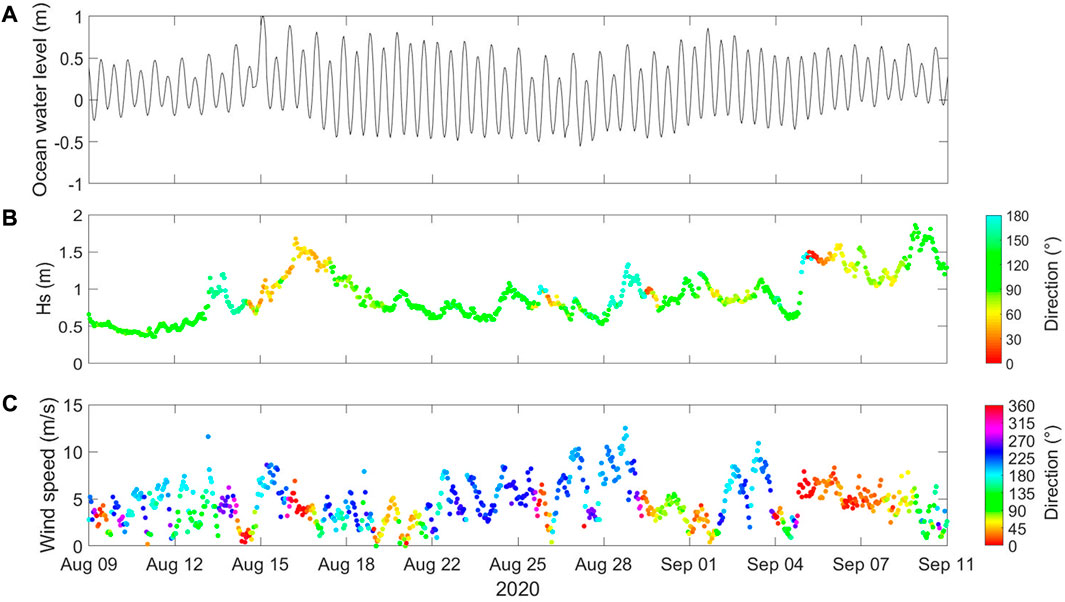
FIGURE 2. (A) Water levels relative to NAVD88 (B) wave heights, and (C) wind speed boundary conditions used for the 30-days simulation period versus time. Colors indicate the heading of the waves and winds.
The “present condition” simulation includes the existing features as close as possible to 2020 (e.g., terminal groin and Basnight Bridge piles) without any potential coastal protection alternative on the estuarine side of the inlet. The present condition simulation is used as a benchmark for comparison of depth-averaged velocities with simulations that include one inlet intervention at a time. Comparisons of time-series of depth-averaged velocities, herein referred to as “velocities,” for the sake of simplicity, are completed initially at the south flood channel to assess alternative performance near the region of shoreline experiencing the most severe erosion rates (Tomiczek et al., 2022b), and are presented in the Evaluation of alternatives performance. Thereafter, additional time-series comparisons are presented at three other channels that compose the inlet (i.e., main, north, center in Figure 1C). Lastly, geospatial difference maps of velocities during peak ebb (low tide) and peak flood (high tide) conditions are presented for all alternatives relative to the present condition simulation to better understand the spatial distribution of hydrodynamic effects throughout the system.
Coastal protection alternatives
After a review of coastal protection alternatives historically implemented for estuarine shorelines, tidal inlets, and deep channels, ten alternatives ranging from gray to green to hybrid structures were identified as the most commonly used in these environments. Those alternatives included channel relocation, island restoration, thin layer placement, living shorelines, living shorelines with sills, soil bioengineering (including vegetated geogrids and root wads), bendway weirs, seawalls, terminal groins, and jetties. Of this initial set of alternatives, six are investigated in this study (Table 2). The six alternatives were selected based on their historical use in or near tidal inlets, their potential to reduce constant high erosive flows near a deep channel, and the possibility to reasonably schematize them in the numerical model. Their intended purposes, categorization for this study as “gray,” “green,” or “hybrid,” and known advantages and disadvantages in terms of coastal processes are listed in Table 2.
The alternatives that were discarded include living shorelines (with and without sills), thin layer placement, and soil bioengineering. Living shorelines are a green coastal intervention and typically require gentle slopes (Hardaway et al., 2017) that are not necessarily present near flood channels of tidal inlets. Hybrid living shoreline solutions may include sills or offshore breakwaters in higher-energy environments with mild slopes (Hardaway et al., 2019; Waryszak et al., 2021). Thin layer placement, which is recommended to enhance vertical marsh resilience to sea level rise (Raposa et al., 2020), is not expected to enhance resilience to horizontal erosion as it cannot reduce fast, erosive flows along channel banks. Some soil bioengineering techniques such as live posts and live cribwalls, which are extensively used in riverine systems to strengthen the soil in exposed banks and slow high flows (Mississippi Watershed Management Organization, 2010; U.S. Department of Agriculture, Forest Service, National Technology and Development Program, 2003), are not feasible in a submerged bank with brackish and cold water. It should be noted that although these alternatives are not considered here, their use in other environments have proven to be adequate. The remaining six alternatives considered in this study and their schematization within the numerical model are described in the following paragraphs.
Seawalls are a traditional gray option to stop erosion along banks and shorelines by hardening the edge between land and water without any natural elements. This alternative is considered gray because it is typically made of structural elements, and it does not provide any ecosystem services. Seawalls (also known as bulkheads and revetments) are vertical, hardened structures made of rock, concrete, metal, or other non-native material and constructed along the eroding shoreline (USACE, 1995, USACE, 2002; Dean and Dalrymple, 2002). The seawall evaluated in this study extends 900 m along the eroding shoreline (red line in Figure 3A). The structure was schematized in the numerical model as a thin dam, in the same way the existing terminal groin is included in the model. The line of the thin dam follows the grid cell edges closest to the shoreline.
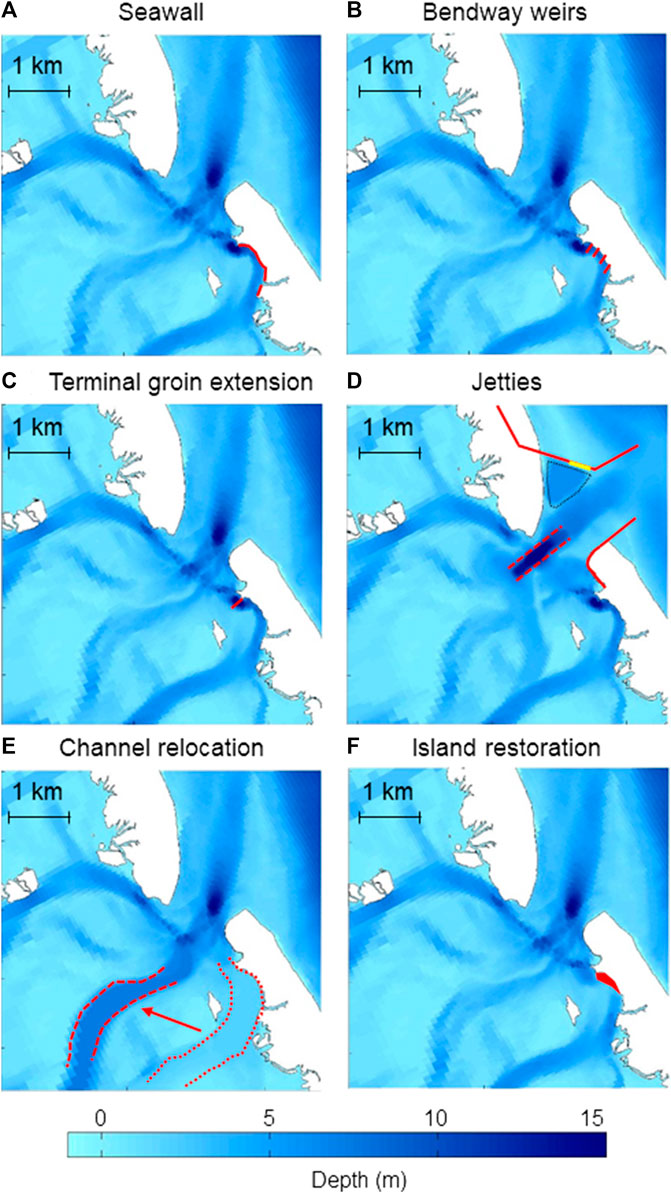
FIGURE 3. Coastal protection alternative (red highlights) on bathymetry (blue color contours) and the existing island shape (black outline) for (A) Seawall (B) Bendway Weirs, (C) Terminal Groin Extension (D) Jetties, where the dashed red line indicates the new position of central channel, the dotted black line indicates the area of the sedimentation basin, and the yellow line indicates the position of the weir (E) Channel Relocation, where dashed line indicates new flood channel position and dotted line indicates filled region (old channel) (F) Island Restoration.
Bendway weirs are submerged rock structures positioned on the outside bankline of a riverbend, typically in a unidirectional-flow channel, angled upstream towards the flow in order to slow erosive velocities (Davinroy, 1990; Winkler, 2003). These structures are also considered a gray intervention because they are typically made of rocks or concrete armor units and are not intended to provide habitat or ecological services other than reducing flow velocities. Bendway weirs have been built along bends in the Mississippi River (Derrick et al., 1994), the Rio Grande River (Scurlock et al., 2012), and other rivers in the United States. Although bendway weirs have not been used in coastal channels with bi-directional tidal flow, this alternative was considered to explore potential flow reduction of the prevalent currents at the site. Inside the south flood channel of Oregon Inlet, ebb currents are nearly 3 times larger than the flood currents (Velasquez-Montoya et al., submitted), leading to asymmetric forces along the channel banks. Bendway weirs angled into these strong ebb flows may help reduce the dominant cause of erosion. Following Winkler (2003), the dimension and angles of four bendway weirs were calculated, with alongshore spacing of 150 m, cross-channel lengths of 80 m (spanning the deepest part of the flood channel), and angled 20° from the shoreline towards the ebb currents (red lines in Figure 3B). A 2D weir feature was added in Delft3D that results in energy loss due to constriction of the flow. The energy loss is converted into an effective friction coefficient and included in the momentum equation (Deltares, 2022). In the model, the weirs are defined by their start and end nodes in the domain. Weir heights meet local USACE navigation channel depths (4.5 m depth relative to NAVD88). The default friction coefficient of one was used as recommended in the Delft3D manual (Deltares, 2022).
Terminal groins are similar to jetties, but they are typically shorter and built on the tip of a barrier island to stabilize its position and interrupt inlet migration (Dean and Dalrymple, 2002). Terminal groins are considered gray interventions as they are engineered infrastructure generally made of rocks or concrete armor units intended to impede natural morphological processes and not intended to provide habitat or ecological services. The terminal groin extension considered here was based on similar examples at Indian River Inlet, Delaware, United States and Ocean City Inlet, Maryland, United States, where shoreline armoring extends along the barrier island into the estuarine shoreline or the channels in the flood delta to redirect flows. Given the present conditions at Oregon Inlet, a terminal groin extension was started at the existing revetment and extended perpendicular across the width of the deepest portion of the entrance to the south flood channel. In Delft3D, this alternative was schematized as a 240-m long thin dam (Deltares, 2022) (red line in Figure 3C), similar to the seawall but located across the channel instead of along the shoreline. Different from the bendway weirs, this alternative completely blocks flow along its length.
Jetties are another gray intervention comprising single or double rocky, shore-perpendicular structures built to confine tidal flow through and control deposition of sediment in tidal inlets (Brunn, 1978; Kraus, 2008). The jetty system considered in this study was based on a dual jetty design for Oregon Inlet by USACE (2001). The jetty system has a 3055-m long northern jetty and a southern jetty, which connects to the existing terminal groin for a total length of 2004 m (red lines in Figure 3D). In the north jetty, a 305-m long weir at mean sea level (- 0.04 m NAVD88) is included to allow sedimentation in a 0.24 km2 deposition basin with a depth of 6.13 m below NAVD88 (USACE, 2001). Within Delft3D, this alternative was schematized as a combination of thin dams for the jetties’ extensions into the ocean, a 2D weir with a friction coefficient of 1 (default, Deltares, 2022) and a change in the bathymetry of the inlet based on that proposed by USACE (2001) to adjust the ebb delta to design conditions, to include the deposition basin, and to align the main channel with the center of the jetties (dashed red lines in Figure 3D).
Channel relocation is a green to hybrid solution that involves changes to the inlet channels’ locations through dredging and sediment placement with the aim to deepen some channels and close others (Rosgen, 2011) while increasing or maintaining a tidal prism that would keep the inlet open (Cleary and FitzGerald, 2003). The green to hybrid categorization is given to this alternative because no structural elements are used in their design; instead, channel relocation allows natural processes to continue to shape the inlet. However, as noted in other channel relocation studies (Cleary and FitzGerald, 2003; Vila-Concejo et al., 2004), this is an alternative that requires significant maintenance via dredging, which is not completely natural and may disrupt ecological processes. Thus the hybrid connotation is required to indicate that both natural processes and human interventions are required to ensure the long term engineering performance of this alternative, and some elements of the solution may have site specific biophysical consequences that should be evaluated. The channel relocation alternative was implemented in the numerical model by modifying the bathymetry in the domain. The south flood channel was filled to a depth of 1.80 m NAVD88 (dotted red lines, Figure 3E), and the center channel was deepened from depths ranging from 3.00 to 4.50 m (NAVD88) to a new maximum depth along the thalweg of 7.50 m NAVD88 (dashed red lines, Figure 3E). It should be noted that the change in bathymetry is instantaneous; in other words, the simulation is spun up with the bathymetric changes already in place, rather than accounting for dredging and sediment placement periods.
Island restoration (or shoal creation and restoration) is a nature-based (green) method involving building back land lost to erosion (Berkowitz and Szimanski, 2020; Bridges et al., 2021). Island restoration projects involve sediment placement as well as planting vegetation for the creation of habitat, and may include structural components as a hybrid intervention. The island restoration investigated in this study is a green alternative that entails rebuilding the rapidly eroding back-barrier region in the north tip of Hatteras Island (just south of Oregon Inlet) without any structural elements and allowing to evolve with nature. Although the ecological benefits of this alternative are not investigated in this study, it is expected to provide ecosystem services such as habitat creation. In the model, bathymetric and topographic changes were completed to account for this alternative; the addition of vegetation on the island is not accounted for. A total of 830 m of shoreline were considered to be restored. The new estuarine shoreline position was set to that of October 1989, prior to the construction of the terminal groin in Oregon Inlet. The location of this shoreline was obtained from georectified historical aerial images taken by the North Carolina Department of Transportation. The restored island has an elevation of 0.60 m NAVD88 (red area, Figure 3F); this elevation corresponds to the average elevation at which well-developed, healthy marsh vegetation is present at the site (Wargula et al., 2021). The topography of the back-barrier was leveled up to the 0.60 m contour, for a total restored area of 77,340 m2. At the edge of the restored shoreline, the bathymetry gets deeper up to a depth of 5 m (NAVD88) with a slope into the flood channel of 12.5% (1:8). Similar to other alternatives, the simulation is spun up with the new bathymetry and topography already in place.
Evaluation of alternatives performance
The potential for the alternatives to mitigate erosion along the shoreline was quantified by examining the duration of along-channel velocities below an erosion threshold relative to the median sediment size as defined by Hjulström (1939). Median sediment grain size diameters D50 in the flood channel, measured in 2019, range from 22 to 351 µm (medium silt to medium sand on the Wentworth scale) (Wentworth, 1922), with fines typically close to the shoreline edge and coarser grains in the middle of the flood channel (Wargula et al., 2021). For this range of sediment grain sizes, the minimum velocity needed to erode the particles, according to the Hjulström diagram, is approximately 0.20 m/s. This value is also the minimum velocity threshold on the Hjulström diagram, suggesting that it is a conservative value for silt that is more prevalent in the region of the flood channel experiencing the highest erosion rates (Tomiczek et al., 2022b). This velocity is therefore considered the threshold for comparison with simulations’ outputs.
Along-channel velocities at the location “South,” shown as a green marker in Figure 1, were extracted for all alternatives and the present condition simulations. This point is located in the more convex section of the shoreline where the historical erosion rates are the highest (Tomiczek et al., 2022b). Velocities in the south flood channel were rotated into along- and cross-channel velocity components using principal axes (Emery and Thomson, 2001). In the present condition simulation, the velocities near the shoreline are ebb-dominated, with a principal axis angle of 132° (azimuthal) (Emery and Thomson, 2001). The principal axis angles for most alternatives were within 3 degrees of that in the present condition, except for the seawall and channel relocation alternatives, which had principal axis angles of 140 and 110° (azimuthal), respectively, resulting from veering of the flows compared to the present condition.
In the present condition, along-channel velocities at the south flood channel are below the 0.20 m/s erosion threshold 49% of the time. Given that historical data indicates that the shoreline suffers erosion under this condition, it is expected that a reduction in the duration of velocities greater or equal to 0.20 m/s would result in a reduction of erosional processes at the shoreline. Based on this assumption, the main criterion to define the effectiveness of an alternative is the percentage of time that velocities are below the erosion threshold during typical flow conditions. To facilitate comparison and categorization between alternatives, three levels of effectiveness at reducing erosion were defined. The categories are Least Effective, Moderately Effective, and Highly Effective, corresponding to velocities below the erosion threshold (0.20 m/s) for less than 50% (almost no change in erosive flows relative to the present condition), 50–80%, and more than 80% of the time, respectively (Table 3).
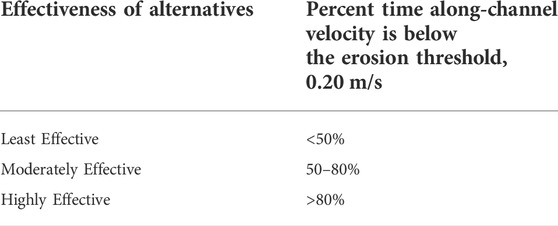
TABLE 3. Effectiveness categories for coastal protection alternatives based on percent duration below the erosion threshold.
Although the effectiveness rating provides a simple metric for determining the flow reduction at the point with the most severe erosion rates, additional analysis of changes to velocities across the flood delta and inlet mouth were examined to determine impacts on inlet circulation caused by each alternative. Along-channel velocities inside the main, north, and center channels (green circles in Figure 1C) are compared between alternatives and the present condition for the duration of the simulation. In addition, instantaneous geospatial difference maps of velocity magnitude in the present condition simulation and each alternative simulation (i.e., Velocity Present Condition - Velocity Alternative) were examined during maximum ebb (August 23rd at 0:00, which corresponds to low tide) and maximum flood (August 23rd at 06:00, which corresponds to high tide) to determine other large-scale impacts that the set of alternatives may have on circulation patterns in the inlet system.
Results
Changes in along-channel flows at the eroding estuarine shoreline
For the present condition simulation, along-channel (major axis) velocities range from -0.58 to 0.33 m/s (positive to the southeast, during the flood), with a median velocity of -0.06 m/s, consistent with ebb-dominated flows. Cross-channel (minor axis) velocities are small, ranging from -0.03 to 0.02 m/s (positive to the southwest), suggesting strong channelization. The cross-channel (minor axis) flow magnitudes are less than 0.03 m/s for all alternatives except for the channel relocation and island restoration alternatives, which have cross-channel flows ranging -0.07 to 0.06 m/s and -0.12 to 0.05 m/s, respectively, potentially owing to the reduced channelization of flows in these alternatives.
Within each model simulation, the total velocity magnitude is less than 0.02 m/s greater than the maximum along-channel velocities at the south flood channel. The percentage of time below the erosion threshold for the total velocity magnitude and the along-channel velocity component is also similar for each model configuration. To preserve the flood/ebb asymmetry, the along-channel component of velocity was used to evaluate the performance of each alternative.
Figure 4 summarizes the along-channel velocities in the present condition and for all of the alternatives. The median flows for all alternatives are negative, consistent with ebb-dominant velocities in the south flood channel, except for the island restoration case, which has a median of 0 m/s, consistent with no flow (i.e., the island was dry) for the majority of the time series. The strongest median velocity, -0.06 m/s, is simulated in the present condition; all alternatives reduce the magnitude of this median velocity, with the seawall causing the least reduction in velocity (median velocity of -0.05 m/s) and island restoration causing the greatest reduction (median velocity of 0 m/s). Maximum flood and ebb flows are also reduced relative to present conditions for all cases except for the seawall case, which has maximum ebb flows of -0.61 m/s, slightly larger in magnitude than the maximum ebb flows of -0.58 m/s in the present condition.
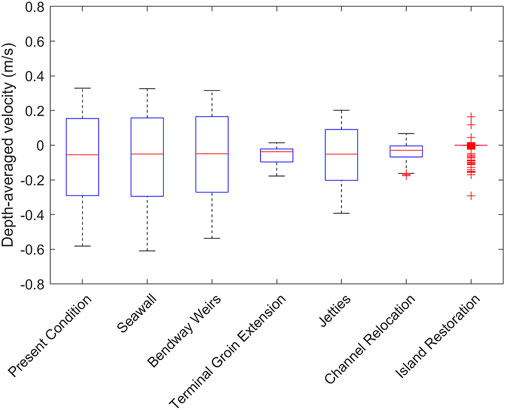
FIGURE 4. Box-and-whisker plots of depth-averaged along-channel velocity versus present condition and alternatives at the south flood channel. Negative velocities indicate ebb flows, while positive velocities indicate flood flows. The horizontal red line indicates the median velocity. The vertical length of the blue boxes indicates the 25th and 75th percentiles of velocity. The black whiskers extend to the maximum and minimum velocities, excluding outliers, which are represented with red plus symbols.
Alternative effectiveness at reducing erosional flows
Figure 5 shows comparisons of the along-channel velocity in the south flood channel during the present condition (red curves) and alternatives (black points) over the simulated period. The seawall and bendway weir alternatives result in an average change in along-channel velocity of 0.02 m/s. This change in velocities is small compared to that caused by other alternatives; thus, they are not shown in Figure 5. The terminal groin extension, channel relocation, and island restoration alternatives show constant flow reduction through the simulated period. The jetties also show a consistent reduction of flow velocities, but not as significant as that caused by the other three alternatives displayed in Figure 5. The near-zero velocities for island restoration correspond to times when the island is dry (Figure 5D).
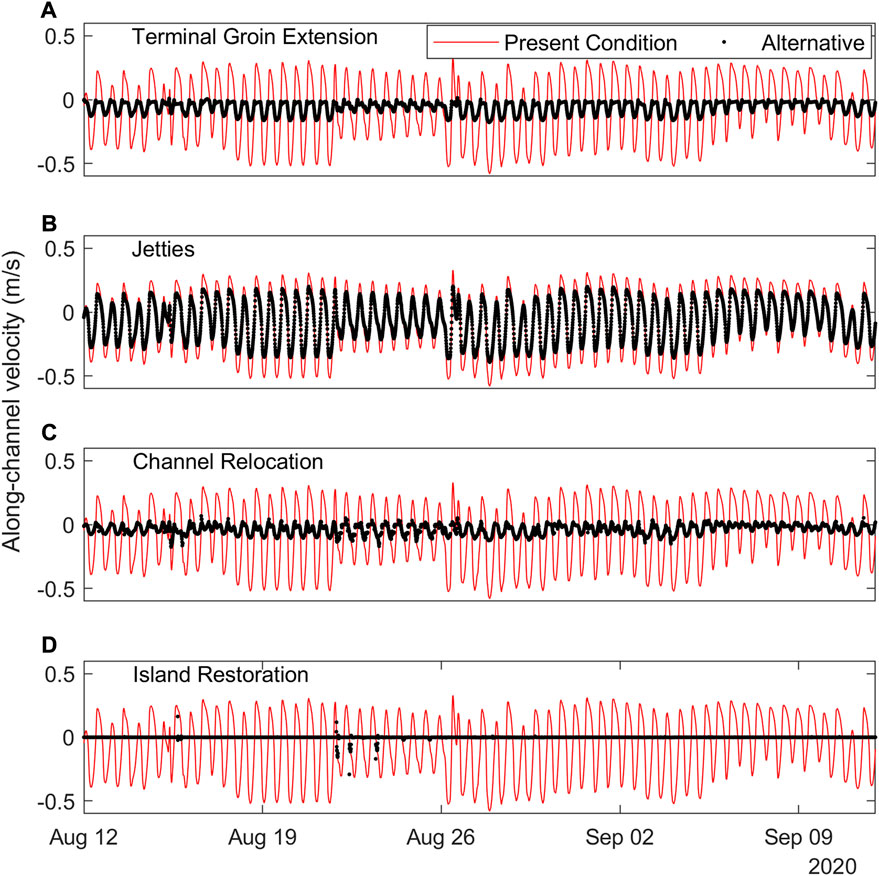
FIGURE 5. Depth-averaged along-channel velocity in the “South” location near the shoreline (Figure 1C) during the present condition (red line) and under coastal protection alternatives (black points) versus time. Positive velocity is to the southeast (flooding), negative velocity is to the northeast (ebbing). Alternatives include the (A) terminal groin extension (B) jetties, (C) channel relocation, and (D) island restoration; seawall and bendway weir alternatives are not shown.
Table 4 presents the relative difference in along-channel velocity, the percentage of time that the along-channel velocity is below the erosion threshold, and the resulting effectiveness rating (Table 3) based on the time below the erosion threshold (Coastal protection alternatives). Relative difference is calculated as the median of the absolute value of the difference between the present condition and alternative along-channel velocity divided by the present condition along-channel velocity. The positive sign on the relative differences presented in Table 4 represents a percent reduction in median velocity relative to the present condition.
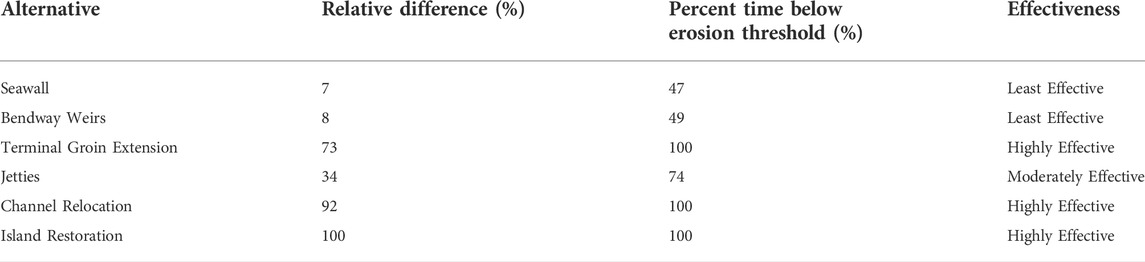
TABLE 4. Depth-averaged along-channel velocity comparison in the south flood channel.
The two alternatives with the largest impact on velocities (>92% reduction in along-channel velocity and below the erosion threshold 100% of the time), are channel relocation and island restoration (Table 4). The channel relocation alternative still allows flows through the south flood channel (Figure 5C), but with consistently smaller velocities, particularly on flood compared to ebb. The island restoration alternative is only intermittently wet (Figure 5D) and so, although velocities exceed the erosion threshold a few times, these “erosion events” are brief.
The terminal groin extension also has a significant impact on reducing velocities in the south flood channel (73% reduction in along-channel velocity and below the erosion threshold 100% of the time, Table 4). The flood velocities, in particular, are reduced from a maximum of 0.33 m/s to a maximum of 0.01 m/s (Figure 5A), potentially owing to blocking and redirecting of flows by the groin at the flood channel entrance. Ebb flows are also significantly reduced from a maximum of -0.58 m/s to -0.18 m/s (Figure 5A).
The jetties are moderately effective, decreasing the along-channel velocities in the south flood channel by 34% (Table 4), with consistent impacts across tidal cycles (Figure 5B) that lead to an increase in time below the erosion threshold (74%, Table 4). The seawall and bendway weirs are the least effective, with almost no change in the time below the erosion threshold and only a 7 and 8% reduction in along-channel velocity, respectively (Table 4). It should be noted that of all the alternatives, the seawall is the only one that is not directly blocking or redirecting flows; thus, its relatively low effect on flow reduction was expected. The discussion on this topic is expanded in Morphological considerations.
Changes in along-channel velocity in different channels
The impact that each alternative may have on circulation patterns in the other channels that form the inlet system were investigated by examining the change in along-channel velocities inside the main, north, and center channels (locations shown in Figure 1C), shown in Figure 6. Negligible change in along-channel velocities (less than 3% median relative difference and less than 1° change in principal flow axis angle) occur in the simulations for the seawall, bendway weirs, and island restoration alternatives in all three locations (Figure 6).
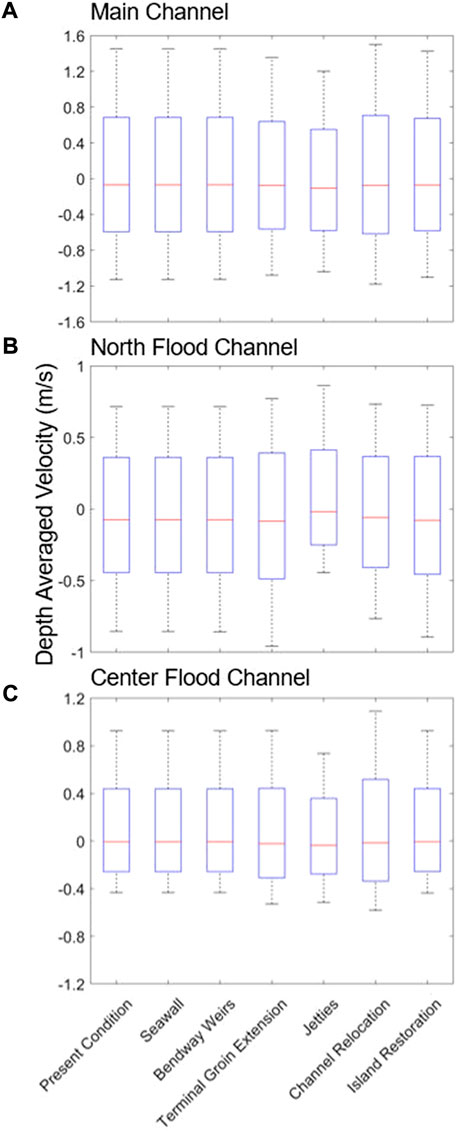
FIGURE 6. Box-and-whisker plots of depth-averaged along-channel velocity versus present condition and alternatives at the (A) main channel (B) north flood channel, and (C) center flood channel. Negative velocities indicate ebb flows (bay to ocean direction), while positive velocities indicate flood flows (ocean to bay direction). The horizontal red line indicates the median velocity. The vertical length of the blue boxes indicates the 25th and 75th percentiles of velocity. The black whiskers extend to the maximum and minimum velocities.
The jetties result in the largest changes to along-channel velocities in all the channels. In the main, north, and center channels, the principal flow axes rotate 20° clockwise, 27° counterclockwise, and 43° counterclockwise relative to those in the present condition, respectively. In the main channel, flows are more channelized (cross-channel velocity range decreased from 0.26 m/s in the present condition to 0.18 m/s in the jetties alternative), and the magnitudes of maximum flood and ebb flows are reduced relative to the present condition (Figure 6A), with a median relative difference of 16%. On flood, along-channel flows are increased in the north flood channel (Figure 6B) and decreased in the south and center flood channels (Figure 4 and Figure 6C). On ebb, flows are decreased in the south and north flood channels (Figure 4 and Figure 6B) and increased in the center flood channel (Figure 6C). Overall the median relative difference in along-channel velocities are 39 and 18% for the north and center channels, respectively. These changes in flows through the three flood channels are a consequence of the relocation and rotation of the main channel under this alternative (Figure 3D).
The largest impacts of the terminal groin extension and channel relocation simulations are located in the center flood channel (median relative difference of 15 and 22%, respectively), where the magnitudes of both the maximum flood and ebb are increased (Figure 6C), potentially to compensate for the reduction of flows in the south flood channel through blocking and channel in-filling (Figure 4). Changes in the along-channel flows in the north and main channels are small, with a median relative difference of less than 10% and less than 6% in each location for both alternatives (Figure 6A and Figure 6B).
Spatial changes in velocities across the inlet during peak tidal flows
Instantaneous difference maps of velocity vector subtraction between the present condition simulation and each alternative simulation were created during maximum ebb (August 23rd at 0:00, which corresponds to low tide) and maximum flood (August 23rd at 06:00, which corresponds to high tide) during spring tide to determine other large-scale impacts that the coastal protection alternatives may have on circulation patterns along shoals and channels (Figure 7 and Figure 8). Positive differences (red contours) indicate a reduction in velocity and negative differences (blue contours) indicate an increase in velocity in the alternative simulation, compared with the present condition (Figure 7 and Figure 8).
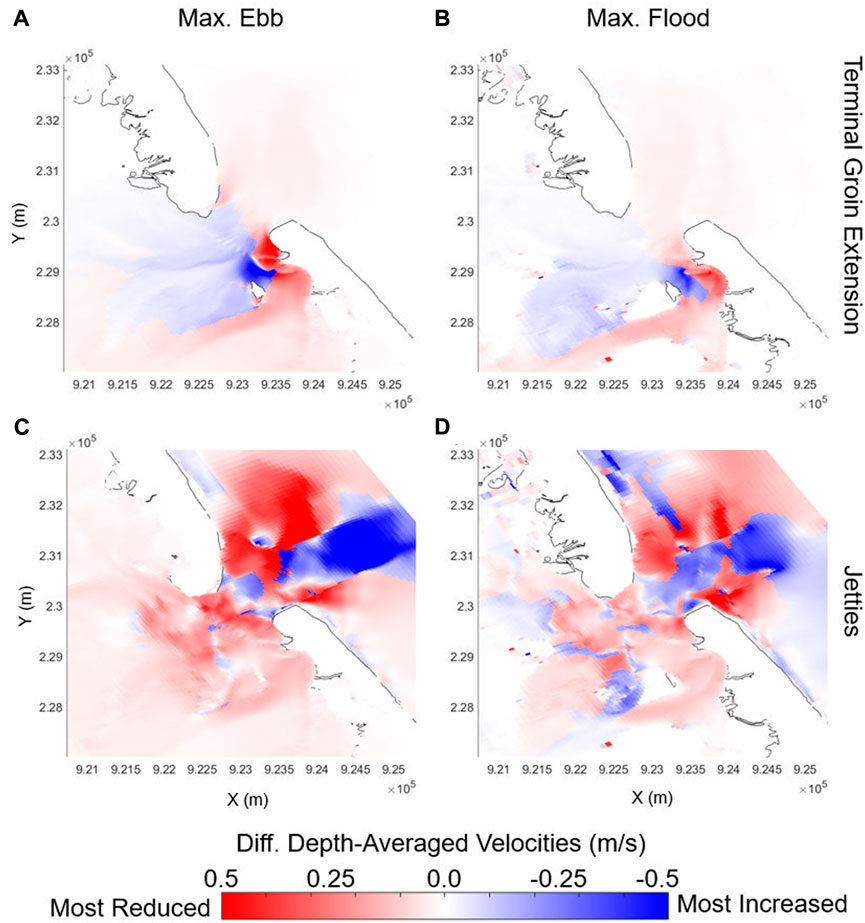
FIGURE 7. Difference in depth-averaged velocity for the present conditions and for the (A,B) terminal groin extension and (C,D) jetties during (A,C) maximum ebb and (B,D) maximum flood. Red and blue colors indicate reduced and increased velocity, respectively, relative to present conditions.
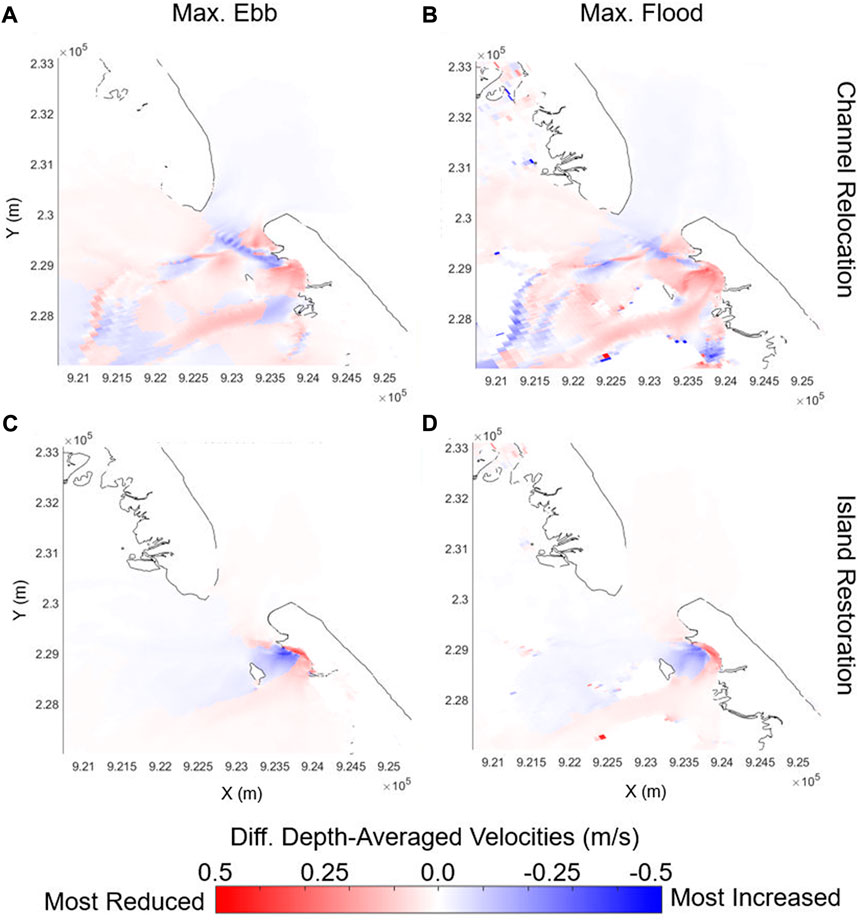
FIGURE 8. Difference in depth-averaged velocity for the present conditions and for the (A,B) channel relocation and (C,D) island restoration during (A,C) maximum ebb and (B,D) maximum flood. Red and blue colors indicate reduced and increased velocity, respectively, relative to present conditions.
The seawall and bendway weirs have only small local effects in their vicinities (Figure 4) and negligible impact on flows outside of the south flood channel (not shown). The largest impact on flows by the seawall is a small area adjacent to its southern end where velocity reduction was ∼0.2 m/s. The bendway weirs also reduce flows inside the south flood channel, with less than 0.1 m/s flow reduction along the shoreline and less than 0.1 m/s flow increase away from the shoreline, with slightly larger impacts on maximum ebb compared to maximum flood, owing to the angling of the weirs into the ebb currents.
The terminal groin extension and jetties drive changes in flow patterns across the entire inlet system during maximum flood and ebb (Figure 7A and Figure 7B). The terminal groin extension results in similar changes in circulation patterns for both maximum flood and ebb, with significant (>0.40 m/s) flow reduction within and to the south of the south flood channel and minor flow reduction on the ebb delta. The results indicate significant flow increase (>0.50 m/s) on the tip of the groin extension and increase of up to 0.1 m/s on the rest of the flood delta. The main difference between flood and ebb is a larger change in flow velocities (both reduction and increase) in the vicinity of the groin during maximum ebb flows.
The jetties simulation shows tidal asymmetry in changes to the circulation patterns (Figure 7C and Figure 7D). During the maximum ebb, the flows between the jetties on the ebb delta are significantly increased, while flows on the flood delta and on the external side of the jetties on the ebb delta are mainly reduced. During the maximum flood, patterns of change in velocities are complex; flow reduction is simulated in the vicinity of each flood channel (also shown in Figure 6) and adjacent to the jetties, while flow velocities increase mainly between the jetties, in shallow regions on the flood delta, and further alongshore on the ocean side. Flow increase at the weir location (Figure 3D) is more noticeable during maximum ebb but also present during maximum flood (circular blue region in the center of red shades along the north jetty), while flow reduction is predominant in the area of the sediment basin.
Flows throughout the inlet system also are altered by the channel relocation and island restoration alternatives (Figure 8), although the magnitude of the differences is small compared to those simulated for the jetties and the terminal groin extension alternatives (Figure 7). The channel relocation alternative increases flows through the center flood channel (also shown in Figure 6C), reducing flows through the south flood channel and northern part of the flood delta. There is some tidal asymmetry to this alternative, mainly in the region between the center and south flood channel and the inlet mouth. The channel relocation alternative also increases velocities inside the main inlet channel.
The island restoration alternative has the largest impact near the eroding shoreline, with significant flow reduction inside the south flood channel and significant flow increase just to the west of the entrance to the south flood channel (Figure 8). The flow is also increased on the center and northern part of the flood delta, potentially to compensate for the closed-off south flood channel. The strong gradient between the regions of velocity reduction and increase implies that the erosional flows are displaced, rather than fully reduced near the eroding region.
Discussion
Island restoration, channel relocation, and terminal groin extension alternatives were the most effective at reducing velocity magnitudes and increasing the time below the erosion threshold in the south flood channel (Table 4). However, the wider impact of these coastal protection interventions on circulation across the delta and inlet must also be considered, owing to the potential for morphological evolution and hydrodynamic patterns that could shorten project life durations. For example, despite island restoration being rated as the most effective alternative at reducing velocities along the shoreline, the increased currents along the “new shoreline” could lead to fast erosion of the restored land, thus potentially decreasing the durability of a project of this kind. Table 5 presents a summary of the effects of each alternative along the shoreline, alongside the effects on velocities in the surrounding areas.
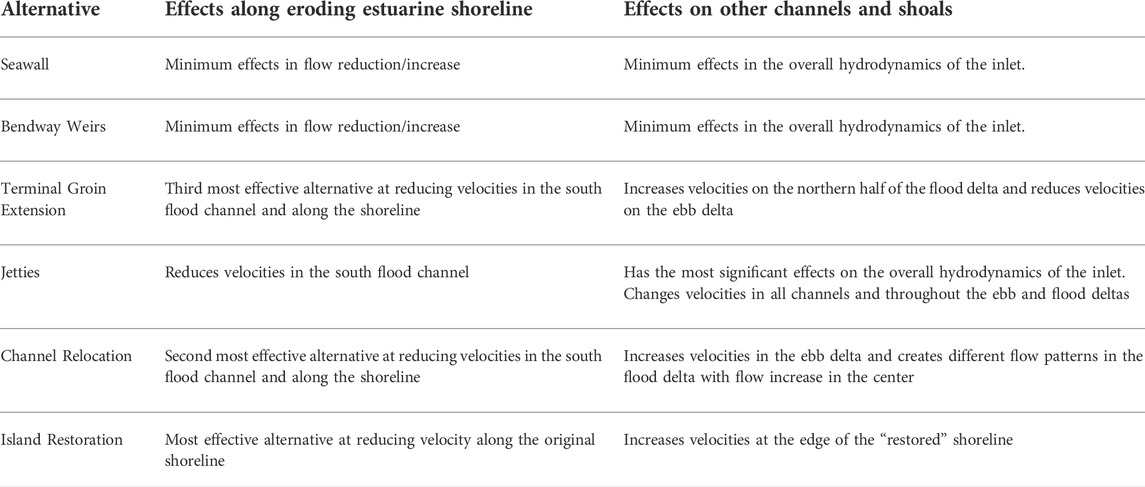
TABLE 5. Coastal protection alternatives with their effects on velocities within the inlet system.
All of the coastal protection alternatives explored here have been implemented to a certain extent in different inlet systems worldwide, except bendway weirs, which have not been tested in coastal or tidal environments. Instead, this structural solution to channel bend erosion has been limited to riverine environments. Thus, the true benefits and drawbacks of bendway weirs need to be explored further via physical modeling and more detailed studies with varying degrees of vertical flow blockage, spacing, and directions. Studies of this kind already exist for rivers (Davinroy, 1990; Winkler, 2003; Lyn and Cunningham, 2010; Siefken et al., 2021), but the effects of this structural measure under tides and waves remains to be explored. Other research opportunities include accounting for the effects of vegetation in alternatives like island restoration, as marsh fields have been shown to protect shorelines in estuarine environments (Gittman et al., 2014; Paquier et al., 2016).
While each alternative was explored separately, future work could look into combinations of alternatives as they could lead to further reductions of flow velocities. Combining the benefits of gray and green coastal protection alternatives could result in a solution that is effective in high-velocity environments while also providing ecological benefits by creating habitat for local species (Gittman et al., 2014; Sutton-Grier et al., 2015). For example, implementing temporary hard structures to mitigate extreme events until a nature-based solution is fully established (Bouma et al., 2014) or combining wetlands with hardened structures to improve flood defenses in an estuary (Smolders et al., 2020) are hybrid methods that have been implemented or proposed that combine benefits from both ends of the gray to green coastal protection spectrum. Although the alternatives assessed here are meant to address steady marsh shoreline erosion due to daily stresses, they may have other applications related to channel stabilization and flood protection. If the performance of the alternatives were to be addressed for such applications, simulations of storm conditions could inform other potential benefits and drawbacks that are not accounted for in this study. Furthermore, future work could explore morphological simulations that would allow evaluation of sedimentation and erosional patterns and the potential implementation of bypassing mechanisms, which can enhance the performance and design life of gray alternatives.
Morphological considerations
Morphological simulations were not conducted in this study; however, the potential impact on morphology caused by the coastal protection alternatives is examined through the discussion of the large-scale changes in circulation patterns. Velocity is used as a proxy here to discuss potential impacts on sediment transport, since velocity squared is related to the bottom shear stresses that erode and transport sediment. It is also noted that morphological evolution may, in turn, change the hydrodynamics. Such feedback between hydrodynamics and morphology could then potentially affect the effectiveness of a given alternative in mitigating erosion in the long term.
The jetties, terminal groin extension, and channel relocation alternatives had the largest impacts on velocity across the flood delta, with the jetties also significantly impacting the ebb delta. Large velocity changes could lead to significant morphological evolution of the channels and shoals along new pathways, leading to disruptions of navigation routes and changes to the dredging needs of the inlet. Increased velocities near the tip of the structures (i.e., jetties, terminal groin extension) indicate the potential for scour hole development as reported in other inlets by Lillycrop and Hughes (1993), Ferrarin et al. (2018) and Toso et al. (2019). In addition, the jetties, terminal groin extension, and channel relocation alternatives (Figure 7 and Figure 8) all show varying degrees of velocity increase inside the main channel of the inlet, which could scour existing structures like the bridge piles and the existing rubble mound terminal groin.
The island restoration alternative has the most significant velocity impact in the south flood channel, where flows were reduced to near-zero by the creation of new land that remained dry through most of the modeled period. However, the strong increase of flows (>1.5 m/s) at the entrance to the south flood channel may lead to a new channel cutting across the restored island. This option may temporarily “turn back the clock” on erosion without solving the problem in the long term. Similarly, relocating the south flood channel would rely on dredging maintenance, as active channel rotation, shoal movement and morphological changes due to storms and day-to-day processes have been reported at this inlet (Humberston et al., 2019; Velasquez-Montoya et al., 2020).
Although the seawall was not effective in reducing along-channel velocities, the scoring metric used here may not fully account for the erosion control provided by this alternative. Hardening of the bank does not reduce flows, but rather stops erosion by creating a barrier between the shoreline and the estuarine currents. In addition, this alternative has the advantage that its overall impact on velocities is localized and minimal, suggesting that any morphological evolution would mainly occur in the south flood channel, and not impact the rest of the flood delta. It should be noted however, that hardened structures on a shoreline can interfere with sediment sources and longshore transport (Dean and Dalrymple, 2002) causing erosion downstream on unprotected shorelines.
Broader implications to other inlets and coastal systems
The results presented for Oregon Inlet help illustrate the varying spatial and temporal effects that different coastal protection alternatives have on the flow velocities in tidal inlets. Gray to green coastal protection interventions tend to show varying influence on inlet systems, causing changes in flow velocities that range in scale from tens of meters around the vicinity of the intervention to kilometers expanding along ebb and flood deltas. The spatial extent where flow velocities change has important consequences on inlet stability, navigation, and the inlet ecology. Based on the results presented here, green interventions like island restoration and channel relocation result in minimal inlet-wide hydrodynamic changes, compared to gray alternatives like jetties, which have the potential to completely modify the hydrodynamics at an inlet.
A general comparison of gray to green coastal protection interventions near tidal inlets serves as a first step to differentiating the effectiveness and consequences of using a range of alternatives in different parts of the engineering spectrum. It should be noted that for each of the alternatives presented here, further technical analysis including changes in geometry, location, and response to extreme events should be performed to gain in-depth knowledge of design features needed for specific locations. For example, in the case of channel relocations, Vila-Concejo et al. (2004) suggest that the position of the new channel is a key factor for the success of these types of interventions. For groins and shore-normal structures used for sediment trapping, length, elevation, porosity and shoreline characteristics should be considered for successful designs (Basco and Pope, 2004). Estuarine shoreline restoration that typically entails sediment nourishments and planting of vegetation needs to consider sediment consolidation, restored land elevation, relative sea level rise, and local vegetation characteristics (Campbell et al., 2005).
Whether a gray or a green coastal protection alternative is better suited for erosional processes near a tidal inlet will depend on the particular morphology and environmental forces (i.e., wave climate, tidal range, geological setting, existing infrastructure, sediment and vegetation characteristics) present at the inlet. Nevertheless, assessing the effectiveness of coastal protection alternatives would benefit from standardized engineering metrics of success during initial project planning phases. In this regard, the effectiveness categories for coastal protection alternatives based on percent duration of an erosion threshold (Table 3) developed here can be applied in any other tidal inlet system where erosion may threaten critical infrastructure, private properties, or valuable habitat and resources.
Even with hydrodynamic and morphological modeling, there is always a risk with implementing coastal protection alternatives in dynamic environments such as tidal inlets. Construction of gray or green interventions in tidal inlets could result in unintended consequences due to natural and anthropogenic influences that may occur through decadal and century timescales. These consequences depend on the antecedent hydrodynamic, morphological, and ecological characteristics at a given site; therefore, at some locations solutions traditionally considered “green” may result in adverse biophysical effects, while other traditional “gray” solutions could lead to ecological benefits. In-depth feasibility studies for the gray to green spectrum of coastal protection measures should include environmental, economic, and societal impacts. Environmental impact considerations may include the impact of moving sediment or building structures in areas that may disrupt benthic communities and submerged aquatic vegetation. Only through rigorous consideration of both engineering and environmental requirements can coastal interventions be appropriately implemented to ensure the desired flood risk management and ecological performance. In addition, monitoring efforts of pre- and post-project construction would allow for assessments of project effectiveness and success and provide the required information for adaptive management in future projects at other dynamic tidal inlet systems.
Conclusion
Overall, island restoration, channel relocation, and terminal groin extension were the most effective alternatives at reducing velocity magnitudes and increasing the time below the erosion threshold in the south flood channel. Based on the options assessed in this study, alternatives closer to the green side of the coastal protection intervention spectrum tend to display the most effectiveness at reducing flow velocities at the eroding shoreline. The island restoration and channel relocation alternatives had a more localized effect on velocities, without significantly modifying the overall hydrodynamics throughout the inlet system. On the other hand, the alternatives on the gray side of the coastal protection spectrum cause two opposite effects on the velocities of the inlet; gray interventions either cause minimal or extreme changes in velocities. While the seawall and bendway weirs did not cause significant changes in currents, the terminal groin extension and the jetties proved to be interventions that would change the flow velocities throughout the inlet system. Since the seawall cuts off the interaction between the shoreline and the channel rather than reducing the velocities, its effects become relevant for considering local scour and morphological impacts downstream.
The results presented here are intended to illustrate the ability of select gray to green coastal protection infrastructure at reducing flows that could erode back-barrier regions surrounded by deep inlet channels. The coastal interventions studied here and their effects on the velocities of an inlet are exploratory in nature. Implementation of any of these interventions must consider a combination of hydrodynamic, morphological, and environmental parameters unique to the site, as well as economic, social, and policy considerations, to find an optimal solution or combination of solutions.
Data availability statement
The raw data supporting the conclusion of this article will be made available by the authors, without undue reservation.
Author contributions
Conceptualization, LV-M, AW, TT, ESm, and ESc; Methodology, LV-M, AW, TT, ESm, and ESc; Software, LV-M; Validation, LV-M and AW; Formal Analysis, LV-M, AW, and JN; Investigation, LV-M, AW, and JN; Writing—Original Draft Preparation, LV-M and AW; Writing—Review and Editing, LV-M, AW, TT, ESm, and ESc; Visualization, LV-M, AW, and JN; Supervision, LV-M; Project Administration, LV-M, AW, TT, ESm, and ESc; Funding Acquisition, LV-M, AW, TT, ESm, and ESc; All authors have read and agreed to the published version of the manuscript.
Funding
This project was funded by the North Carolina Department of Transportation (NCDOT) Grant #2020-09 and National Science Foundation (NSF) CBET Grant #2110262. Any opinions, findings, conclusion, or recommendations expressed in this material are those of the authors and do not necessarily reflect the views of the NCDOT, the NSF, the United States Naval Academy, North Carolina State University, or Dewberry.
Acknowledgments
We acknowledge former United States Naval Academy students Brent Schwartz, Katie Miller, Kyle Cortez, Austin McWherter, and Benjamin Johnson, who put forth preliminary designs for the channel relocation and island restoration alternatives as part of their Capstone Senior Design Project in 2020.
Conflict of interest
Author ES was employed by company Dewberry.
The remaining authors declare that the research was conducted in the absence of any commercial or financial relationships that could be construed as a potential conflict of interest.
Publisher’s note
All claims expressed in this article are solely those of the authors and do not necessarily represent those of their affiliated organizations, or those of the publisher, the editors and the reviewers. Any product that may be evaluated in this article, or claim that may be made by its manufacturer, is not guaranteed or endorsed by the publisher.
References
Basco, D. R., and Pope, J. (2004). Groin functional design guidance from the coastal engineering manual. J. Coast. Res. SI (33), 121–130.
Beck, T. M., and Wang, P. (2019). Morphodynamics of barrier-inlet systems in the context of regional sediment management, with case studies from west-central Florida, USA. Ocean Coast. Manag. 177, 31–51. doi:10.1016/j.ocecoaman.2019.04.022
Bendoni, M., Mel, R., Solari, L., Lanzoni, S., Francalanci, S., and Oumeraci, H. (2016). Insights into lateral marsh retreat mechanism through localized field measurements. Water Resour. Res. 52, 1446–1464. doi:10.1002/2015WR017966
Berkowitz, J. F., Piercy, C., Welp, T., and VanZomeren, C. (2019). Thin layer placement: Technical definition for the U.S. Army Corps of Engineers applications. ERDC TN-19-1. Vicksburg, MS: U.S. Army Corps of Engineers Engineer Research and Development Center.
Berkowitz, J. F., and Szimanski, D. M. (2020). Documenting engineering with nature implementation within the US army Corps of Engineers baltimore district ‐ completed projects and opportunities for chronosequence analysis. ERDC/TN EWN-20-3. Vicksburg, MS: US Army Engineer Research and Development Center. doi:10.21079/11681/38141
Berkowitz, J. F., VanZomeren, C., and Piercy, C. (2017). Marsh restoration using thin layer sediment addition: Initial soil evaluation. Wetl. Sci. Pract. 34, 13–17.
Blanton, B., Madry, S., Galluppi, K., Gamiel, K., Lander, H., Reed, M., et al. (2008). Report for the state of North Carolina Floodplain mapping project: Coastal flood analysis system. A renci technical report TR-08-08. Chapel Hill, NC: Topographic/BathymetricData.
Booij, N., Ris, R. C., and Holthuijsen, L. H. (1999). A third-generation wave model for coastal regions: 1. Model description and validation. J. Geophys. Res. 104, 7649–7666. doi:10.1029/98JC02622
Bosboom, J., Reniers, A. J. H. M., and Luijendijk, A. P. (2014). On the perception of morphodynamic model skill. Coast. Eng. 94 (2014), 112–125. doi:10.1016/j.coastaleng.2014.08.008
Bouma, T. J., van Belzen, J., Balke, T., Zhu, Z., Airoldi, L., and Blight, A. J. (2014). Identifying knowledge gaps hampering applications of intertidal habitats in coastal protection: Opportunities & steps to take. Coast. Eng. 87, 147–157. doi:10.1016/j.coastaleng.2013.11.014
Bridges, T. S., King, J. K., Simm, J. D., Beck, M. W., Collins, G., Lodder, Q., et al. (2021). International guidelines on natural and nature-based features for flood risk management. Vicksburg, MS: U.S. Army Engineer Research and Development Center. doi:10.21079/11681/41946
Bridges, T. S., Wagner, P. W., Burks-Copes, K. A., Bates, M. E., Collier, Z. A., Fischenich, C. J., et al. (2015). Use of natural and nature-based features (NNBF) for coastal resilience final report. ERDC SR-15-1. Vicksburg, MS: U.S. Army Corps of Engineers Engineer Research and Development Center.
Brier, G. W. (1950). Verification of forecasts expressed in terms of probability. Mon. Weather Rev. 78, 1–3. doi:10.1175/1520-0493(1950)078<0001:VOFEIT>2.0.CO;2
Bruun, P. (1978). Stability of tidal inlets. Theory and engineering. Trondheim, Norway: Elsevier Scientific Publishing Company.
Campbell, T., Benedet, L., and Thomson, G. (2005). Design considerations for barrier island nourishments and coastal structures for coastal restoration in Louisiana. J. Coast. Res. SI (44), 186–202.
Cleary, W. J., and FitzGerald, D. M. (2003). Tidal inlet response to natural sedimentation processes and dredging-induced tidal prism changes: Mason inlet, North Carolina. J. Coast. Res. 19, 1018–1025.
Davinroy, R. D. (1990). Bendway weirs, A new structural solution to navigation problems experienced on the Mississippi river. Bulletin. P.I.A.N.C. A.I.P.C.N.
Dean, R. G., and Dalrymple, R. A. (2002). Coastal processes with engineering applications. Cambridge University Press. doi:10.1017/CBO9780511754500
Deltares (2022). Simulation of multi-dimensional hydrodynamic flowsand transport phenomena, including sediments. User Manual Hydro-Morphodynamics. Version: 4.05 Delft3D-FLOW. Delft, Netherlands: SVN Revision, 75129.
Derrick, D. L., Pokrefke, T. J., Boyd, M. B., Crutchfield, J. P., and Henderson, R. R. (1994). Design and development of bendway weirs for the dogtooth bend reach, Mississippi river. Hydraulic model investigation. Vicksburg, MS: U.S. Army Corps of Engineers Engineer Research and Development Center. Technical Report HL-94-10.
Dunn, M., Sciaudone, E., and Velasquez-Montoya, L. (2019). “Estuarine shoreline erosion driven by flood channel proximity at Pea Island, NC,” in Presented at ASBPA national coastal conference (Myrtle Beach, SC, USA, 22–25.
Elko, N., Mckenna, K., Briggs, T. R., Brown, N., Walther, M., and York, D. (2020). Best management practices for coastal inlets. Shore Beach 88, 75–83. doi:10.34237/1008838
Emery, W. J., and Thomson, R. E. (2001). Data analysis in physical oceanography. 2nd ed. Amsterdam: Elsevier Sci.
Ferrarin, C., Madricardo, F., Rizzetto, F., McKiver, W., Bellafiore, D., Umgiesser, G., et al. (2018). Geomorphology of scour holes at tidal channel confluences. J. Geophys. Res. Earth Surf. 123, 1386–1406. doi:10.1029/2017JF004489
FitzGerald, D. M., and Hughes, Z. (2019). Marsh processes and their response to climate change and sea-level rise. Annu. Rev. Earth Planet. Sci. 47 (1), 481–517. doi:10.1146/annurev-earth-082517-010255
Garel, E., Sousa, C., Ferreira, O., and Morales, J. A. (2014). Decadal morphological response of an ebb-tidal delta and down-drift beach to artificial breaching and inlet stabilisation. Geomorphology 216, 13–25. doi:10.1016/j.geomorph.2014.03.031
Garzon, J. L., Maza, M., Ferreira, C. M., Lara, J. L., and Losada, I. J. (2019). Wave attenuation by Spartina saltmarshes in the Chesapeake Bay under storm surge conditions. J. Geophys. Res. Oceans 124, 5220–5243. doi:10.1029/2018JC014865
Giese, G. L., Wilder, H. B., and Parker, G. G. (1985). Hydrology of major estuaries and sounds of North Carolina. U.S. Geol. Surv. Water Supply, 108. Paper 2221. doi:10.3133/wsp2221
Gittman, R. K., Popowich, A. M., Bruno, J. F., and Peterson, C. H. (2014). Marshes with and without sills protect estuarine shorelines from erosion better than bulkheads during a Category 1 hurricane. Ocean Coast. Manag. 102, 94–102. doi:10.1016/j.ocecoaman.2014.09.016
Hardaway, C., Milligan, D. A., Wilcox, C. A., and Milligan, A. C. (2019). Living shoreline sea level resiliency: Performance and adaptive management of existing breakwater sites, year 2 summary report. Gloucester Point, VA: Virginia Institute of Marine Science, William & Mary. doi:10.25773/jpxn-r132
Hardaway, C. S., and Byrne, R. J. (1999). Shoreline management in chesapeake bay. Report. Gloucester Point, VA: College of William and Mary, Virginia Institute of Marine Science, Gloucester Points. doi:10.21220/V5DB1X
Hardaway, C. S., Milligan, D. A., Wilcox, C., and Duhring, K. (2017). Living shoreline design guidelines for shore protection in Virginia’s estuarine environments. Gloucester Point, VA: Virginia Institute of Marine Science. SRAMSOE #463. doi:10.21220/V5CF1N
Hayes, M. O., and FitzGerald, D. M. (2013). Origin, evolution, and classification of tidal inlets. J. Coast. Res. Sp. Issue 6, 14–33. doi:10.2112/SI_69_3
Hayes, M. O. (1980). General morphology and sediment patterns in tidal inlets. Sediment. Geol. 16, 139–156. doi:10.1016/0037-0738(80)90009-3
Hjulström, F. (1939). Transportation of detritus by moving water: Part 1. Transportation. SP 10. Recent Mar. Sediments, Spec. Volume, 5–31.
Houston, J. R., and Dean, R. G. (2016). Erosional impacts of modified inlets, beach encroachment, and beach nourishment on the east coast of Florida. J. Coast. Res. 32, 227–240. doi:10.2112/JCOASTRES-D-15-00105.1
Humberston, J., Lippmann, T., and McNinch, J. (2019). Observations of wave influence on alongshore ebb-tidal delta morphodynamics at Oregon Inlet, NC. Mar. Geol. 418, 106040. doi:10.1016/j.margeo.2019.106040
Humberston, J. L., and Lippmann, T. C. (2022). The effect of regional winds on subtidal along-inlet currents at Oregon Inlet, NC. J. Geophys. Res. Oceans 127, e2022JC018513. doi:10.1029/2022JC018513
Inman, D. L., and Dolan, R. (1989). The outer banks of North Carolina: Budget of sediment and inlet dynamics along a migrating barrier system. J. Coast. Res. 5, 193–237.
Jarrett, J. T. (1978). “Coastal processes at Oregon inlet, North Carolina,” in 16th international conference on coastal engineering (Hamburg, Germany: ASCE), 1257–1275. doi:10.1016/B978-1-4160-0087-7.50076-310.1061/9780872621909.075
Joyner, B. P., Overton, M. F., and Fisher, J. S. (1998261998). Post-stabilization morphology of Oregon inlet, NC. Copenhagen, Denmark: International Conference on Coastal Engineering. doi:10.1061/9780784404119.237
Kinzli, K. D., and Myrick, C. (2009). Bendway weirs: Could they create habitat for endangered Rio Grande silvery minnow. River research and applications. doi:10.1002/rra.1277
Kraus, N. C. (2008). Engineering of tidal inlets and morphologic consequences. Handb. Coast. Ocean Eng., 867–900. doi:10.1142/9789812819307_0031
Leonardi, N., Carnacina, I., Donatelli, C., Ganju, N. K., Plater, A. J., Schuerch, M., et al. (2018). Dynamic interactions between coastal storms and salt marshes: A review. Geomorphology 301, 92–107. doi:10.1016/j.geomorph.2017.11.001
Lesser, G. R., Roelvink, J. A., van Kester, J. A. T. M., and Stelling, G. S. (2004). Development and validation of a three-dimensional morphological model. Coast. Eng. 51, 883–915. doi:10.1016/j.coastaleng.2004.07.014
Lillycrop, W. J., and Hughes, S. A. (1993). Scour hole problems experienced by the Corps of Engineers; data presentation and summary. Vicksburg, MS: U.S. Army Corps of Engineers Engineer Research and Development Center. Miscellaneous Paper CERC-93-2.
Luettich, R. A., and Westerink, J. J. (2004). Formulation and numerical implementation of the 2D/3D ADCIRC finite element model.
Lyn, D. A., and Cunningham, R. (2010). A laboratory study of bendway weirs as a bank erosion countermeasure. Joint Transportation Research Program. FHWA/IN/JTRP-2010/24. Final Report. doi:10.5703/1288284314249
Mao, M., and Xia, M. (2018). Wave-current dynamics and interactions near the two inlets of a shallow lagoon-inlet-coastal ocean system under hurricane conditions. Ocean. Model. 129, 124–144. doi:10.1016/j.ocemod.2018.08.002
Mississippi Watershed Management Organization (2010). A guide to bank restoration options for large river systems: Part II bioengineering installation manual MWMO watershed. Bulletin 2010, 95.
Morris, R. L., Konlechner, T. M., Ghisalberti, M., and Swearer, S. E. (2018). From grey to green: Efficacy of eco-engineering solutions for nature-based coastal defence. Glob. Change Biol. 24, 1827–1842. doi:10.1111/gcb.14063
Murray, N. J., Worthington, T. A., Bunting, P., Duce, S., Hagger, V., Lovelock, C., et al. (2022). High-resolution mapping of losses and gains of Earth’s tidal wetlands. Science 376 (6594), 744–749. doi:10.1126/science.abm9583
Narayan, S., Beck, M. W., Reguero, B. G., Losada, I. J., van Wesenbeeck, B., Pontee, N., et al. (2016). The effectiveness, costs and coastal protection benefits of natural and nature-based defences. PLoS ONE 11 (5), e0154735. doi:10.1371/journal.pone.0154735
Nichols, C. R., and Pietrafesa, L. J. (1997). Oregon inlet: Hydrodynamics, volumetric fluxand implications for larval fish transport. Raleigh, NC.
Ostrow, K., Guannel, G., Biondi, E. L., Cox, D. T., and Tomiczek, T. (2022). State of the practice and engineering framework for using emergent vegetation in coastal infrastructure. Front. Built Environ. 8, 923965. doi:10.3389/fbuil.2022.923965
Paquier, A.-E., Haddad, J., Lawler, S., and Ferreira, C. M. (2016). Quantification of the attenuation of storm surge components by a coastal wetland of the US mid atlantic. Estuaries Coasts 40, 930–946. doi:10.1007/s12237-016-0190-1
Paul, M., and Amos, C. L. (2011). Spatial and seasonal variation in wave attenuation over Zostera noltii. J. Geophys. Res. Oceans 116, C08019. doi:10.1029/2010JC006797
Polk, M. A., and Eulie, D. O. (2018). Effectiveness of living shorelines as an erosion control method in North Carolina. Estuaries Coasts 41, 2212–2222. doi:10.1007/s12237-018-0439-y
Rankin, C., Gaston, T., Sadat-Noori, M., Glamore, W., Morton, J., and Chalmers, A. (2022). Innovative tidal control successfully promotes saltmarsh restoration. Restor. Ecol., e13774. Accepted Author Manuscript. doi:10.1111/rec.13774
Raposa, K. K., Wasson, J., Nelson, M., Fountain, J., West, C., Endris, , et al. (2020). Guidance for thin-layer sediment placement as a strategy to enhance tidal marsh resilience to sea-level rise. Ann Arbor, MI: The National Estuarine Research Reserve System Science Collaborative.
Rosgen, D. L. (2011). “Natural channel design: Fundamental concepts, assumptions, and methods,” in Stream restoration in dynamic fluvial systems: Scientific approaches, analyses, and tools, geophysical monograph series 194. Editors A. Simon, S. J. Bennett, and J. M. Castro (Washington, D.C.: American Geophysical Union), 69–93.
Ruprecht, J., Glamore, W., Felder, S., and Rayner, D. (2016). “Evolution of tidal inlet geometries in a restored coastal wetland,” in Proceedings of the 11th international symposium on ecohydraulics (Melbourne, Australia.
SAGE (2017). System Approach to geomorphic Engineering)Natural and structural measures for shoreline stabilization. Syst. Approach Geomorphic Eng. 7.
Scurlock, S. M., Baird, D. C., Cox, A. L., and Thornton, C. I. (2012). Bendway weir design – Rio Grande physical model. Engineering Research Center: Colorado State UniversityBureau of Reclamation Technical Service Center.
Seabergh, W. C., Cialone, M. A., and Stauble, D. K. (1997). Impacts of inlet structures on channel location. Coast. Eng. Proc. 1 (25). doi:10.9753/icce.v25.%p
Seabergh, W. C., and Kraus, N. C. (2003). Progress in management of sediment bypassing at coastal inlets: Natural bypassing, weir jetties, jetty spurs, and engineering aids in design. Coast. Eng. J. 45, 533–563. doi:10.1142/S0578563403000944
Siefken, S., Ettema, R., Posner, A., Baird, D., Holste, N., Dombroski, D. E., et al. (2021). Optimal configuration of rock vanes and bendway weirs for river bends: Numerical-model insights. J. Hydraulic Eng. 147. doi:10.1061/(ASCE)HY.1943-7900.0001871
Singhvi, A., Luijendijk, A. P., and van Oudenhoven, A. P. E. (2022). The grey – green spectrum: A review of coastal protection interventions. J. Environ. Manag. 311, 114824. doi:10.1016/j.jenvman.2022.114824
Smolders, S., João Teles, M., Leroy, A., Maximova, T., Meire, P., and Temmerman, S. (2020). Modeling storm surge attenuation by an integrated nature-based and engineered flood defense system in the scheldt estuary (Belgium). J. Mar. Sci. Eng. 8, 27. doi:10.3390/jmse8010027
Sutherland, J., Peet, A. H., and Soulsby, R. L. (2004). Evaluating the performance of morphological models. Coast. Eng. 51 (2004), 917–939. doi:10.1016/j.coastaleng.2004.07.015
Sutton-Grier, A. E., Wowk, K., and Bamford, H. (2015). Future of our coasts: The potential for natural and hybrid infrastructure to enhance the resilience of our coastal communities, economies, and ecosystems. Environ. Sci. Policy 51, 137–148. doi:10.1016/j.envsci.2015.04.006
Tomiczek, T., Sciaudone, E. J., Velasquez-Montoya, L., Smyre, E. J., Wargula, A., Fawcett, K., et al. (2022b). Investigation of barrier island highway and marsh vulnerability to bay-side flooding and erosion. J. Mar. Sci. Eng. 10, 734. doi:10.3390/jmse10060734
Tomiczek, T., Wargula, A., O’Donnell, K., LaVeck, K., Castagno, K., and Scypher, S. (2022a). Vessel-generated wake attenuation by Rhizophora mangle in key west, Florida. J. Waterw. Port, Coast. Ocean Eng. 148 (3). doi:10.1061/(ASCE)WW.1943-5460.0000704
Toso, C., Madricardo, F., Molinaroli, E., Fogarin, S., Kruss, A., Petrizzo, A., et al. (2019). Tidal inlet seafloor changes induced by recently built hard structures. PloS one 14 (10), e0223240. doi:10.1371/journal.pone.0223240
USACE (U.S. Army Corps of Engineers) (1995). Design of coastal revetments, seawalls and bulkheads. EM-1110-2-1614. Vicksburg, MS: U.S. Army Corps of Engineers Engineer Research and Development Center.
USACE (U.S. Army Corps of Engineers) (2001). Manteo (shallowbag) bay North Carolina. Supplement No. 2 final supplement No. III. Environmental impacts statement. Wilmington, NC: USACE Wilmington District.
U.S. Department of Agriculture, Forest Service, National Technology and Development Program (2003). A soil bioengineering guide for streambank and lakeshore StabilizationFS-683P. San Dimas, CA.
Velasquez-Montoya, L., Sciaudone, E. J., Harrison, R. B., and Overton, M. F. (2021). Land cover changes on a barrier island: Yearly changes, storm effects and recovery periods. Appl. Geogr. 135, 102557. doi:10.1016/j.apgeog.2021.102557
Velasquez-Montoya, L., and Overton, M. F. (2017). Impacts of seasonal forcings on the hydrodynamics of Oregon Inlet, NC. Helsingør, Denmark: Coastal Dynamics.
Velasquez-Montoya, L., Overton, M. F., and Sciaudone, E. J. (2020). Natural and anthropogenic-induced changes in a tidal inlet: Morphological evolution of Oregon Inlet. Geomorphology 350, 106871. doi:10.1016/j.geomorph.2019.106871
Vila-Concejo, A., Ferreira, O., Morris, B. D., Matias, A., and Dias, J. M. A. (2004). Lessons from inlet relocation: Examples from southern Portugal. Coast. Eng. 51, 967–990. doi:10.1016/j.coastaleng.2004.07.019
Wang, P., and Beck, T. (2012). Morphodynamics of an anthropogenically altered dual-inlet system: John's Pass and Blind Pass, west-central Florida, USA. Mar. Geol. 291-294, 162–175. doi:10.1016/j.margeo.2011.06.001
Wargula, A., Sciaudone, E., Velásquez-Montoya, L., Fawcett, K., Amodeo, M., Smyre, E., et al. (2021). Marsh erosion processes near a coastal highway on the outer banks. NCSavannah, Georgia: GEO-EXTREME 2021.
Waryszak, P., Gavoille, A., Whitt, A. A., Kelvin, J., and Macreadie, P. I. (2021). Combining gray and green infrastructure to improve coastal resilience: Lessons learnt from hybrid flood defenses. Coast. Eng. J. 63 (3). doi:10.1080/21664250.2021.1920278
Webb, B., Dix, B., Douglass, S., Asam, S., Cherry, C., and Buhring, B. (2019). Nature-Based Solutions for Coastal Highway Resilience: An Implementation Guide. Washington, DC: Report FHWA-HEP-19-042, 229.
Wentworth, C. K. (1922). A scale of grade and class terms for clastic sediments. J. Geol. 20, 377–392. doi:10.1086/622910
Westerink, J. J., Luettich, R. A., Feyen, J. C., Atkinson, J. H., Dawson, C., Roberts, H. J., et al. (2008). A basin to channel scale unstructured grid hurricane storm surge model applied to southern Louisiana. Mon. Weather Rev. 136, 833–864. doi:10.1175/2007MWR1946.1
Wilber, P. (1992). Thin-layer disposal: concepts and terminology environmental effects of dredging information exchange bulletin D-92-1. Vicksburg, MS: U.S. Army Engineer Waterways Experiment Station.
Willmott, C. J. (1981). On the validation of models. Phys. Geogr. 2, 184–194. doi:10.1080/02723646.1981.10642213
Winkler, M. F. (2003). Defining angle and spacing of bendway weirs. Technical report, CHETN-IX-12. Vicksburg, MS: U.S. Army Corps of Engineers Engineer Research and Development Center.
Keywords: estuarine shoreline, erosion mitigation, engineering with nature, gray to green engineering spectrum, numerical modeling of tidal inlets
Citation: Velasquez-Montoya L, Wargula A, Nangle J, Sciaudone E, Smyre E and Tomiczek T (2022) Hydrodynamics of a tidal inlet under gray to green coastal protection interventions. Front. Earth Sci. 10:991667. doi: 10.3389/feart.2022.991667
Received: 11 July 2022; Accepted: 09 September 2022;
Published: 03 October 2022.
Edited by:
Juan Camilo Restrepo, Universidad del Norte, ColombiaReviewed by:
Carmen Zarzuelo Romero, Sevilla University, SpainRodolfo Silva, National Autonomous University of Mexico, Mexico
Copyright © 2022 Velasquez-Montoya, Wargula, Nangle, Sciaudone, Smyre and Tomiczek. This is an open-access article distributed under the terms of the Creative Commons Attribution License (CC BY). The use, distribution or reproduction in other forums is permitted, provided the original author(s) and the copyright owner(s) are credited and that the original publication in this journal is cited, in accordance with accepted academic practice. No use, distribution or reproduction is permitted which does not comply with these terms.
*Correspondence: Liliana Velasquez-Montoya, dmVsYXNxdWVAdXNuYS5lZHU=
† These authors have contributed equally to this work and share first authorship