 Linqiang Wu
 Tao Zhang2*
95% of researchers rate our articles as excellent or good
Learn more about the work of our research integrity team to safeguard the quality of each article we publish.
Find out more
ORIGINAL RESEARCH article
Front. Earth Sci. , 02 September 2022
Sec. Economic Geology
Volume 10 - 2022 | https://doi.org/10.3389/feart.2022.990562
This article is part of the Research Topic Gas Hydrate Appearance Accumulation, Exploration and Exploitation in Continental Margins - Volume 2 View all 15 articles
Natural gas hydrate (NGH) is a worldwide strategic and prospecting commercial resource in the 21st century. The industrialization of NGH has great strategic significance for the achievement of peak carbon dioxide emissions and carbon neutrality. Prior to its industrialization, an economic evaluation of production capacity for each well per day should be conducted to determine whether it is profitable at different given gas prices. In this study, a new hybrid method based on the discounted cash flow (DCF) method and the energy return on investment (EROI) method is used to estimate the economic production rate of NGH exploitation at four different gas price scenarios. The results show that the lowest production rate to make NGH exploitation economic ranges from 1.96 to 29.60 × 10⁴ m3/d/well. With the change in the number of wells, gas–water ratio, gas price, decreasing rate in production cost, and sensitivity analysis are carried out. It shows that all these key factors have a significantly negative effect on the economic production rate initially, and then the sensitivity to the economic production rate will become lower and lower with the rising value of each key factor.
Over the past two centuries, industrial civilization has brought about substantial progress but also caused increasingly severe environmental and climate problems. A low carbon transformation of energy use is the key pillar to reducing CO2 emissions toward a carbon neutral world. Renewable energy like solar and wind energy may dominate our energy mix completely in the future, but considering its tiny contribution to energy supply at present, the timing is still very uncertain (Michael and Arthur, 2019). According to the BP Statistical Review of World Energy, renewable energy accounts for only about 18% of the world's total primary energy consumption in 2021 (BP, 2022). In the transition to a low-carbon energy future, natural gas is considered a clean, efficient energy source that will likely become an important alternative to coal and oil and a transitional fuel for renewable energy (Javed, 2016; Zheng et al., 2016). With rapid global industrialization, the world’s demand for natural gas will grow sharply in the coming decades and will reach 4.9 trillion cubic meters (tcm) by 2040 (Sanja, 2021).
As conventional natural gas resources become depleted, exploration for unconventional gas resources is becoming increasingly important (Vedachalam et al., 2015; Kong et al., 2018). Natural gas hydrate (NGH), an ice-like carrier substance for natural gas formed by gas molecules and water molecules under high-pressure and low-temperature conditions (Sloan and Koh, 2007), is an unconventional gas resource and contains the largest gas resources remaining on the Earth. It is estimated that the gross carbon reserve of NGH is about twice as much as the total reserve of all the other fossil energy including oil, coal, and natural gas (Makogon, 1981; Kvenvolden, 1988; Englezos, 1993). NGH has been discovered worldwide in polar regions, normally associated with onshore and offshore permafrost, and in the sediment of outer continental and insular margins, with 90% of the ocean serving as potential areas for NGH deposits (Kvenvolden, 1993). In theory, when appropriate hydrate expansion factors are considered, 1 m3 of NGH contains up to 164 m3 of natural gas at standard conditions (Kvenvolden, 1993). According to preliminary estimates, the total global NGH reserve is approximately 1.5 × 10⁴ tcm (Makogon et al., 2005), which is large enough to replace the increasingly depleted traditional oil and gas resources. As a result, NGH is a worldwide strategic and prospecting commercial resource concerned by many countries in the 21st century (Makogon et al., 2005), and its industrialization has great significance for the world’s energy mix optimization, green development, and the achievement of peak carbon dioxide emissions and carbon neutrality.
Natural gas from NGH deposits can be theoretically produced by one or a combination of three main methods (Moridis and Sloan, 2007): 1. depressurization, in which the pressure is reduced below the equilibrium value at the system temperature; 2. thermal stimulation, in which the temperature is raised above the equilibrium value at the system pressure; and 3. injection of inhibitors such as salt and/or alcohol, by which the thermodynamic hydrate stability boundary is shifted to lower temperatures and higher pressures, thus inducing dissociation and gas release. Depressurization is thought to be the most technically efficient means of production from NGH deposits (Walsh et al., 2009; Michael and Arthur, 2019).
Over the last two decades, China has been attaching great importance to research on gas hydrate and has found a total amount of approximately 84 tcm of NGH reserves onshore and offshore, including the South China Sea, the East China Sea, and the Qinghai–Tibet Plateau, nearly 77% of which is distributed in the South China Sea (Tan et al., 2016). In 2013 and 2016, two NGH reserves with natural gas resources of more than 100 billion m3 each were discovered in the eastern offshore area of the Perl River Mouth basin and Shenhu area in the South China Sea (Yang et al., 2017). The NGH industrialization consists of five general stages, namely, the theoretical research and simulation experiment, the exploratory production test, the experimental production test, the productive production test, and the commercial production stages (Hao, 2022). In 2017, China successfully conducted its first offshore exploratory production test from clayey silt reservoirs, the most widely distributed NGH reservoirs in the world. It lasted for 60 days continuously and stably, yielding cumulative gas production of 30.9 × 10⁴ m3 (Li et al., 2018). Three years later, the second major leap was evidenced by the experimental production test in 2020. This time it achieved 30 days of continuous gas production and set a new world record for cumulative gas production of 86.14 × 10⁴ m3 (Ye et al., 2020). Because of these great successes, China has now entered the stage of productive production test and is accelerating its steps to achieve commercial development of NGH by 2030.
Like other conventional and unconventional resources, prior to NGH industrialization, it is necessary to conduct an economic evaluation to determine whether it is profitable or not (Chen et al., 2022a). There exist a lot of factors that can affect the economic feasibility of an NGH exploitation project. Meanwhile, economic production is rare and may be the most important one (Wu et al., 2020). Unfortunately, since now, only a few quantitative analyses of the economic production rate have been carried out. Based on previous studies on NGH industrialization (Yamamoto et al., 2014; Yang et al., 2014; Li et al., 2018; Ye et al., 2020), Wu et al. (2020) proposed that the economic production rate for terrestrial NGH industrial exploitation is 30 × 104 m3/d/well, while for marine reservoirs, it should be no less than 50 × 104 m3/d/well. Compared with several trial productions before, both capacities are still two or three orders of magnitude higher than those of pilot production tests (Figure 1). However, the economic production rate for profitable NGH industrial exploitation is not always fixed, and it may decrease with the development of low-cost exploitation technologies.
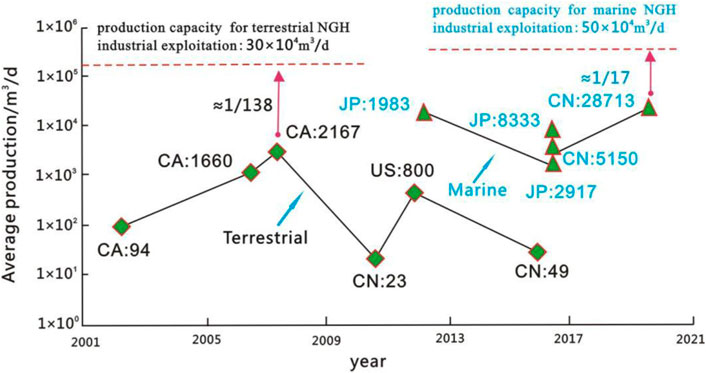
FIGURE 1. Average production capacity of NGH production tests in the world and the economic production rate for terrestrial and marine NGH industrial exploitation (Wu et al., 2020). CN means China, JP means Japan, CA means Canada, and US means the United States. The number after the country abbreviation represents the average daily production capacity of gas hydrates’ production tests.
In recent years, some scholars have started to try to conduct economic evaluations of NGH exploitation, mostly with the method of energy return on investment (EROI) or the method of discounted cash flow (DCF). Kong et al. (2018) carried out an estimation of China’s production efficiency of NGH in the South China Sea based on different production capacities. The results show if the production rate for a single well can reach 2.3 × 10⁴ m3/d with a 12-year production life, the standard energy return on investment is 1.25, indicating the net energy delivered to society by NGH production is positive. Chen et al. (2022b) calculated each EROI of four NGH exploitation technologies to evaluate the economic potential. She illustrated that compared with thermal simulation, chemical injection, and CO2 replacement, depressurization is the most economically feasible, with the lowest economic production rate of about 16–25 × 104 m3/d per well. Walsh et al. (2009) presented a preliminary report on the economics of gas production from NGH with the method of discounted cash flow (DCF). According to the results, $12/Mscf (about $10.6/MMBtu) is the lowest gas price that would allow economically viable production from gas hydrates in the absence of associated free gas, while an underlying gas deposit will reduce the viability price estimate to $7.50/Mscf (about $6.62/MMBtu). The results also reported that the production cost for marine hydrate is $3.5–4.00/Mscf (about $3.1–3.5 MMBtu) more expensive than a conventional gas project given a 15% internal rate of return (IRR). Deepak et al. (2019) undertook a techno-economic study of a defined deepwater hypothetical gas hydrate accumulation in the Krishna–Godavari (KG) Basin located along the eastern margin of India. The economic evaluation suggested that when the predicted production rate reaches 600 × 104 m3/d, the production cost will be $9/MMBtu, which means economically viable. Based on the currently assumed production system and gas production behavior, the MH21-S R&D consortium (MH21-S, 2019) described the criteria for NGH commercial production after conducting the economic evaluation of hypothetical hydrate accumulations located in the Nankai Trough, Japan. The calculation results presented that when the LNG price is $10/MMBtu, the production rate per well required for commercial production is about 15 × 104 m3/d or more. Since the technology for commercial exploitation of NGH has not been established yet, exploring the economic production rate is critical to understanding the gap between pilot production tests and the final realization of commercialization. Notably, few studies focusing on the evaluation of the economic production rate for NGH industrial exploitation in the South China Sea have been conducted till now due to the lack of enough field data.
The objective of this article is to estimate the economic production rate required for the industrialization of gas hydrate at different gas prices from an economic point of view and to figure out the key factors affecting production capacity. For evaluation of the economics, calculating capital expenditure (CAPEX) and operating expenditure (OPEX) data are the two fundamental prerequisites. Although the exploitation of marine NGH is similar in many respects to that of offshore conventional gas, there are still some differences in a number of ways, some of which will have a significant effect on the overall economics (Walsh et al., 2009). Unlike conventional gas that can be produced by natural flow, NGH should be first dissociated into a fluid phase (gas and water) that can consume energy (Yamamoto and Nagakubo, 2021). In addition, because the water production from a gas hydrate reservoir could be highly variable, a gas hydrate development will require artificial lift such as electric submersible pumps (ESPs) or gas lift, which will also increase front-end costs in most cases, as well as operating costs over the life of the field (Walsh et al., 2009). On this basis, when the method of discounted cash flow (DCF) is applied, OPEX fully refers to an offshore gas project just as many of the evaluations reviewed previously may cause a large deviation. As for the energy return on investment (EROI) method, it is pretty hard to reasonably calculate CAPEX and OPEX data in energy terms due to the lack of enough available data for trial production tests. As an alternative solution, the authors use a hybrid model, which is widely used in the energy sector (Li and Zhang, 2018, Li and Zhang, 2019) and which combines both discounted cash flow (DCF) and energy return on investment (EROI) to estimate the economic production rate required for NGH industrial exploitation at different gas prices. Section 2 describes the method of discounted cash flow (DCF) and energy return on investment (EROI) and proposes a novel DCF-EROI hybrid model. Section 3 makes a range of assumptions for economic evaluation and gives data estimation of key parameters used in the model. Based on Section 3, Section 4 presents the study results and discussion in four different gas price scenarios. Section 5 carries out sensitivity analyses to reduce the uncertainty resulting from the limited data, and Section 6 states the conclusion.
Discounted cash flow (DCF) analysis values of cash flows by bringing them to the present, and its result is known as the net present value (NPV), which is probably the most popular and most sophisticated economic valuation technique to determine whether a project yields a return in excess of the alternative equal risk investment in trade securities (Žižlavský, 2014; Hou, 2016). NPV compares the value of net cash flows today to the value of the same net cash flows in the future, taking inflation and returns into account (Donald, 2012; Bosri, 2019). Here, in this research, expenditure and sales revenue were estimated for hypothetical NGH reservoirs in Shenhu area of the northern South China Sea (Figure 2).
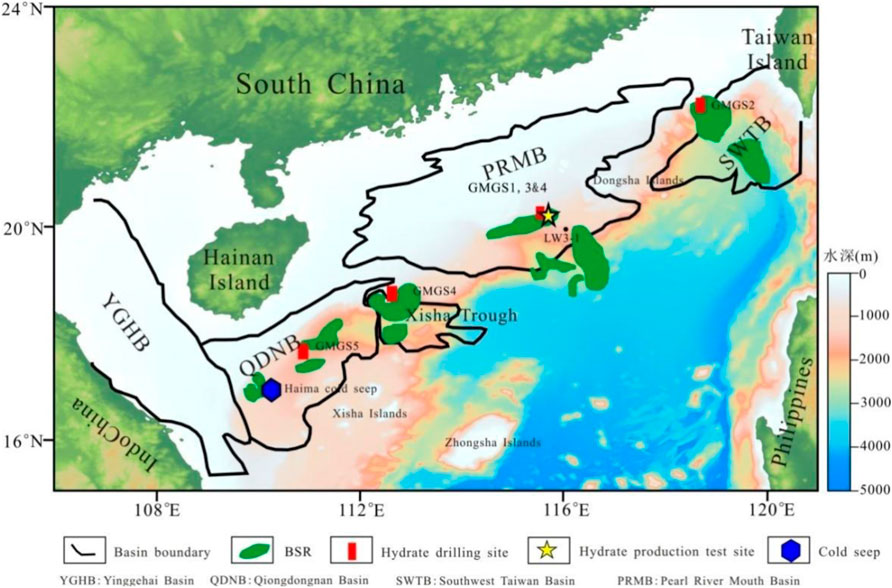
FIGURE 2. Depositional basins and gas hydrate surveying in the northern South China Sea. BSR, bottom simulating reflector (modified from Wu and Wang (2018) and Liang et al. (2019))
The equation of NPV can be expressed as follows:
where NPV = net present value; CI = cash inflow; CO = cash outflow; (CI − CO)t = net cash flow generated by innovation project in year t; r = discount rate.
The future net cash flows are computed by subtracting the capital expenditure (CAPEX), operating expenditure (OPEX), and taxes (Tax) from the gas sales revenue (RgPg), a product of gas production (Rg) and gas price (Pg). The field tests in China and Japan have demonstrated that conventional offshore gas production facilities can be used for gas hydrate exploitation (Yamamoto et al., 2014; Li et al., 2018; Ye et al., 2020). Therefore, it is reasonable to refer CAPEX, including the cost of production platforms (Cplatform), well drilling and completions (Cwell), subsea system (Csubsea), pipeline construction (Cpipeline), and field abandonment (Cabandonment), to those of offshore gas. As mentioned earlier, OPEX can’t be fully referred to the cost of offshore gas. It should constitute OPEX1, referring to the operating cost of offshore gas (Coperation) and OPEX2, including dissociation costs (Cdissociation) and artificial lift costs (Clift).
Then, the NPV becomes
Here, the economic production rate, which means the minimum production that is needed to make NGH exploitation financially profitable, is calculated when the final net present value can then be estimated either as zero given a certain discount rate. Then, the economic production rate equals Rg when
The concept of energy return on investment (EROI) was first proposed by Hall and Cleveland (1981). Rather than purely monetarily, the EROI is a useful measure to examine the energetic efficiency of energy processes and systems (Cleveland et al., 1984; Cleveland, 1992).
The equation of EROI can be expressed as follows:
Since energy costs (energy outputs and energy inputs) can be converted into currency costs (cash inflow and cash outflow) by dividing the energy intensity, the energy consumed for NGH dissociation (Edissociation) and artificial lift (Elift) can be obtained by theoretical estimation.
Edissociation resulted from NGH dissociation is described by energy consumption for each cubic meter of gas produced, which differs for different production methods. For the depressurization method, the energy input is caused by an electric submersible pump (ESP) to lower the pressure during gas production, which can be estimated by Chen et al. (2022b):
where Tp = total production time; PESP = ESP power; Helec = heating value per KWh of electricity.
Elift is lifting energy input for produced fluid. It is a product of the drainage discharge, vertical depth, and corresponding consumption factor (Zeng et al., 2015), as expressed by Kong et al. (2018):
where Mwater = the amount of water; Dwell = lifting height, which equals water depth plus well depth; Helec = heating value per KWh of electricity; IESP = effective power of the electrical submersible pump.
Therefore, according to all the previous equations, OPEX2 can be estimated by
where EI = energy intensity.
As the longest gas production period of a marine NGH production test was approximately 2 months in the world (Ye et al., 2020), the long-term gas production behavior is still uncertain, which means there remain various levels of uncertainties such as the number of production wells and the capacity of production facilities for future commercial production. Therefore, for economic evaluation, it is necessary to make a range of assumptions to supplement such uncertain parameters (Table 1).
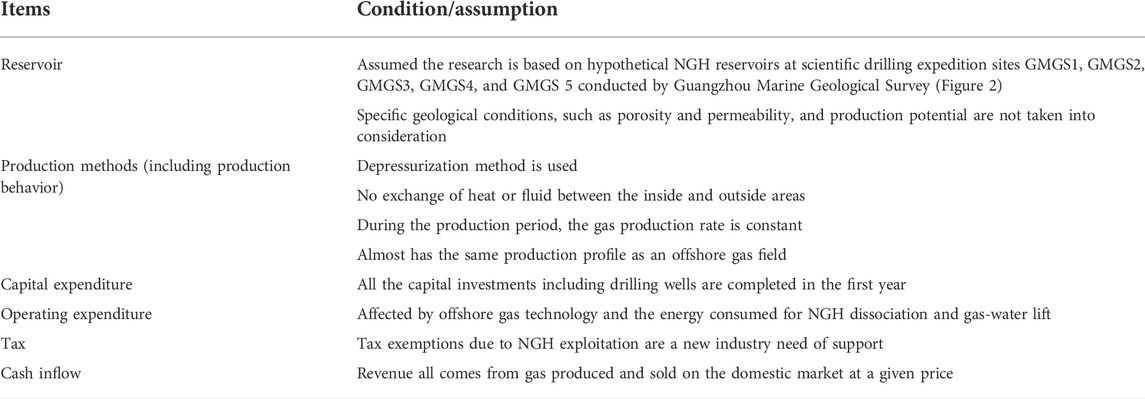
TABLE 1. Conditions/assumptions for economic evaluation.
As discussed previously, CAPEX and operating expenditure OPEX1 can be referred to an offshore gas project, and they are generated using IHS Energy Que$tor™ planning software and costing database. For OPEX2, it can be estimated by converting energy consumed for NGH decomposition and water lifting into currency. All the key parameters used in this study are referred to simulation and experimental results in the literature (Table 2, 3).
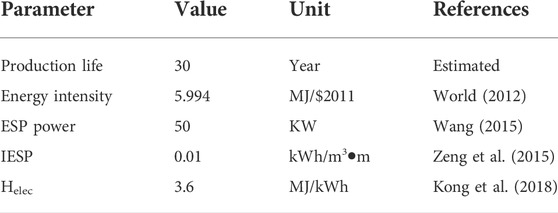
TABLE 2. Key parameters used in DCF-EROI analysis.
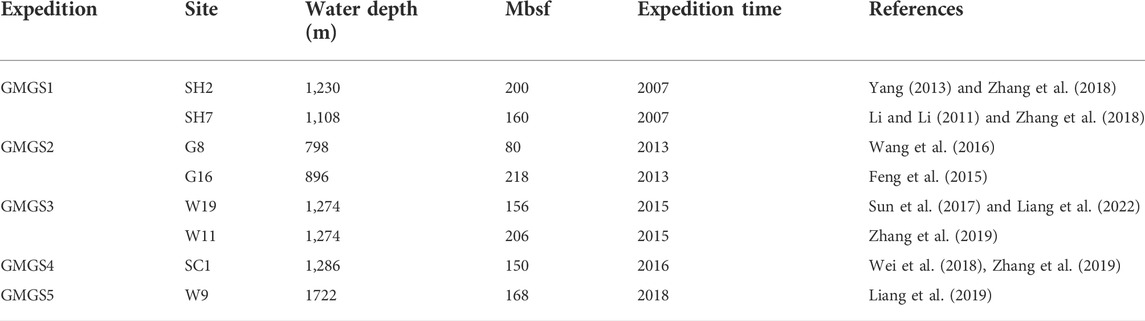
TABLE 3. Key parameters for hypothetical NGH reservoirs.
For economic evaluation of gas hydrate exploitation, the economic production rate for each well is one of the most important factors, and it is obviously affected by the market gas price, which has a significant impact on total sales revenue (cash inflows). Due to the variability, it is pretty difficult to predict future gas prices. In this study, four gas price scenarios are assumed with the gas–water ratio set at 100, which is close to the data observed in the first offshore production test of methane hydrates in the eastern Nankai Trough (Yamamoto et al., 2014). The first scenario is at the gas price of $6.15/MMBtu, the average price of China’s imported pipeline gas in December 2021. The second scenario is assumed at the price of $10/MMBtu, the LNG price used by the MH21-S R&D consortium for economic evaluation. The third one is at $18.93/MMBtu, representing the average price of China’s imported LNG in December 2021. The last scenario is at the price of $35.4/MMBtu, the CIF price of China’s imported spot LNG in August 2022. Table 4 summarizes the economic production rates at sites GMGS1, GMGS2, GMGS3, GMGS4, and GMGS5 in the South China Sea, changing with the number of production wells in these four scenarios. Compared with the previous economic evaluations resulting from the literature reviewed earlier (Deepak et al., 2019; MH-21S, 2019; Wu et al., 2020), the calculation results are nearly within the same order of magnitude, which implies the economic production rates estimated could be regarded reasonable.
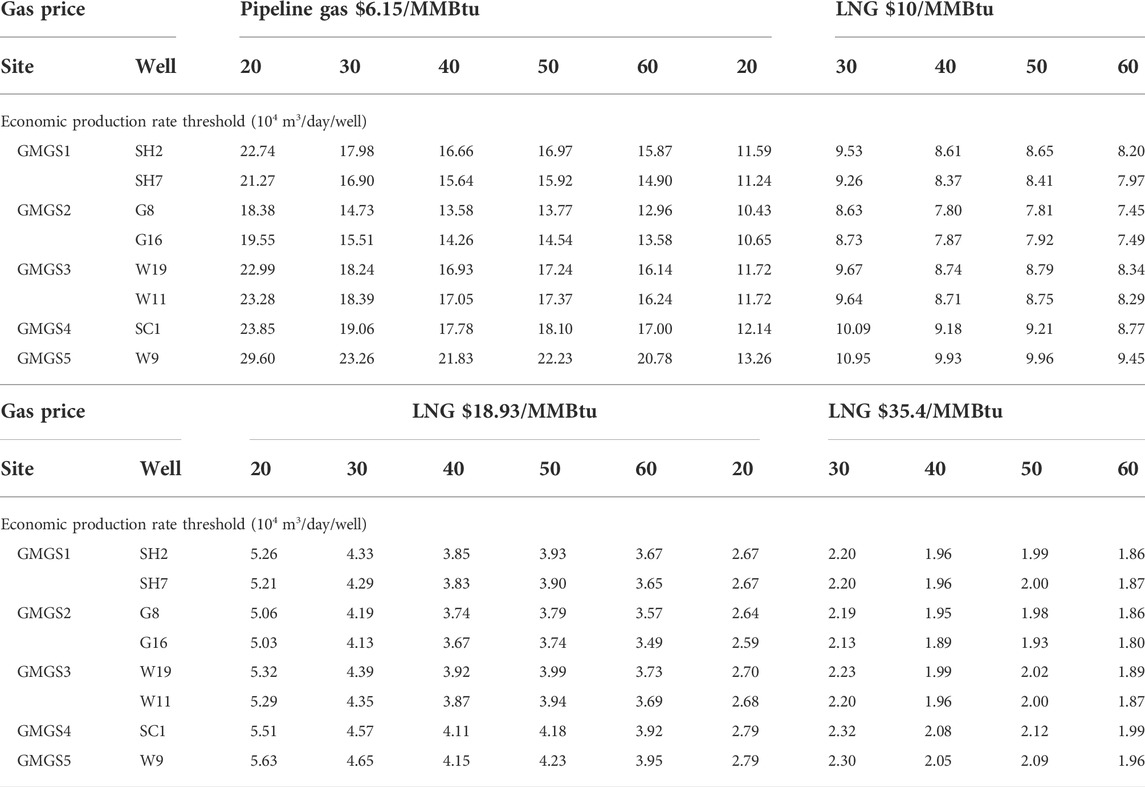
TABLE 4. Economic production rates for NGH industrial exploitation at different natural gas prices, changed with the number of production wells.
As shown in Table 4, under the same conditions of production life and gas–water ratio, economic production rates in the South China Sea are highly dependent on the gas price, ranging from 1.96 to 29.60 × 10⁴ m3/d/well. Given a certain gas price, the economic production rate needed differs at different sites but not very significantly. This is because the eight NGH sites are located in the similar geological condition with near water depth, costing similar capital expenditure and operating expenditure. In addition, all economic production rates at these sites will decrease with the increase of production wells, which may be resulted from the lower marginal costs for each well. Additionally, Table 4 also shows the effect of gas price and the number of wells on the economic production rate vary from site to site. Here, the GMGS4-SC1 site and GMGS5-W9 are taken for example. In most cases, the economic production rate at the GMGS4-SC1 site is a little lower than that at the GMGS5-W9 site with the same gas price and the number of wells, but this situation will reverse when the LNG price is $35.4/MMBtu, and the number of wells is more than 30. The reason causing such an interesting phenomenon is maybe the sensitivity of gas price and well number on economic production rate changes when these two key factors change by themselves, which will be analyzed in Section 5.
In the case of an actual pipeline gas price of $6.15/MMBtu in late 2021, the gas produced from NGH is certainly not competitive against imported pipeline gas at the current stage. In this scenario, the average economic production rate per well should be about 12.96–29.6 × 10⁴ m3/d, almost 4–10 times higher than the rate recorded in the second production test in Shenhu area, South China Sea (Ye et al., 2020). In other words, there is still a big gap between the gas production efficiency of actual production tests and that required for commercial production.
Based on the LNG price of $10/MMBtu, the economic production rates range from 7.45 to 13.26 × 10⁴ m3/d/well, lower than 15 × 104 m3/d/well estimated by the MH21-S R&D consortium (MH-21S, 2019). This may be caused by the different expected well production life in the two models. In this study, the production life for each well is 30 years, while the parameter used by the MH21-S R&D consortium is 8 years. Considering that most of the life span investigated for simulation of gas hydrate exploitation is about 20–30 years or even longer (Cleveland, 1992; Walsh et al., 2009; Yamamoto and Nagakubo, 2021; Chen et al., 2022a; Chen et al., 2022b), it is more reasonable to assume a longer production life span of about 30 years for economic evaluation.
In the scenario of the LNG price of $18.93/MMBtu, it may look pretty promising to exploit gas hydrate with the economic production rate per well 3.67–5.63× 10⁴ m3/d, which can be achieved by some enhancement recovery methods like dual horizontal wells, etc. (MH-21S, 2019; Wu et al., 2020). In addition, when the LNG price is as high as $35.4/MMBtu, it means gas hydrate could be commercially developed with the lowest production rate needed of only 1.86 × 10⁴ m3/d. However, considering the longest production life in trial tests to now is just about 60 days (Li et al., 2018), and the maximum gas produced from production tests over the last two decades is only a total of 8.6 × 10⁵ m3 (Ye et al., 2020), there is still a long way to extract natural gas from NGH at a production rate of 1.86 × 10⁴ m3/d for nearly 30 years, which will have a cumulative gas production of about 122.2 × 10⁸ m3.
High economic production rate results from high cash inflows and low cash outflows over the production life span. As discussed earlier, a lot of factors can affect cash flows, such as the number of wells, gas price, production life, gas-water ratio, etc. In this section, taking the GMGS1-SH2 site as an example for the discussion, a sensitivity analysis is conducted to better understand the effect of four key factors on economic production rate.
As shown in Figure 3, when the number of wells increases, all economic production rates would generally decrease. However, the degree of decline is quite different for different gas prices. The lower the gas price, the faster the economic production rate drops with the rising number of wells. This may be explained by the fact that lower gas price causes lower cash inflows, making the economic production rate more sensitive to cash outflows resulting from drilling more wells. Meanwhile, even at the same gas price, the economic production rate also varies at different levels. Initially, when the number of producing wells increases, the curve of the economic production rate will decline and become more and more flat. While, when the well number reaches about 40, the economic production rate suddenly goes up and then goes down again when the well number arrives at about 47. After that, the curve will become nearly horizontal very slowly. A reasonable interpretation for the variation is that if the number of production wells is less than 40, wells may share the same facilities such as platforms or FPSO (floating production storage and offloading), resulting in the marginal cost for drilling a new well becomes less. Once the well number hits the threshold, another new platform may be needed, and more expenditure will cost.
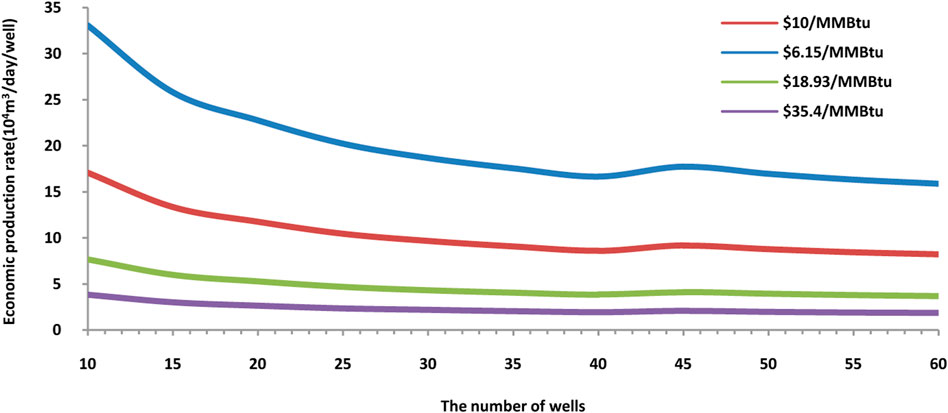
FIGURE 3. Sensitivity analysis of the number of wells on economic production rates at different gas prices with the gas–water ratio set at 100.
When the gas–water ratio changes, the energy input for the artificial lift will be different, causing the gas production cost to fluctuate. Similar to the sensitivity analysis on the number of wells, we refine the gas–water ratio to analyze its sensitivity to economic production rate. Figure 4 shows that with the rise of the gas–water ratio, the economic production rate will rapidly drop down from a very high peak and, then the magnitude of the decline becomes smaller and smaller. This is because when the assumed gas price is lower than the cost of lifting produced water, it is impossible to compensate the production cost by sales revenue, no matter how much natural gas is produced. On the other hand, if the gas price is higher than the unit production cost, the higher the gas–water ratio, the less impact it will have on the economic production rate. When the gas–water ratio is higher than 200, the impact is very low; if it is as high as 1,000 or more, the effect of the gas–water ratio can be negligible.
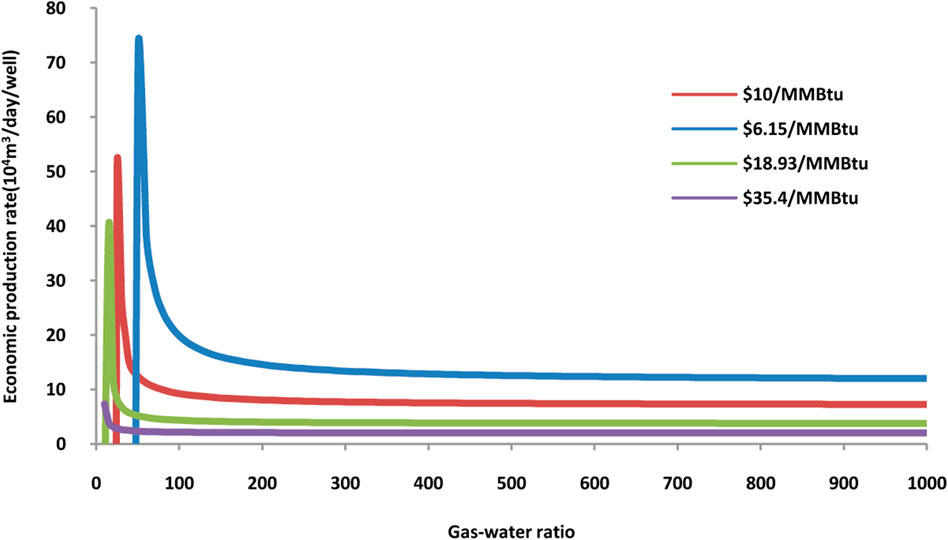
FIGURE 4. Sensitivity analysis of the gas–water ratio on economic production rate at different gas prices with the number of wells set at 30.
As discussed previously, gas price will directly determine cash inflows. A high gas price means a low economic production rate needed based on the same conditions. Figure 5 illustrates the negative correlation between the economic production rate and natural gas price. Apparently, with a lower number of wells, the gas price has a higher sensitivity to the economic production rate. However, when the number of production wells is more than 40, the gas price has no obvious effect on the economic production rate.
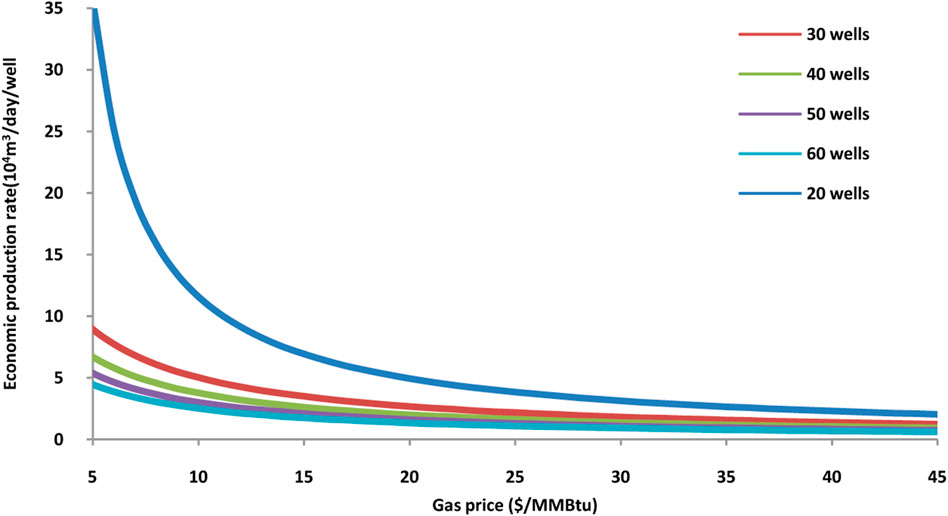
FIGURE 5. Sensitivity analysis of the gas price on economic production rate with the different number of wells with the gas–water ratio set at 100.
To accelerate the pace of hydrate industrialization, promoting production capacity and reducing the production cost through technological progress are the two main ways. Figure 6 describes the impact of different rates of decreasing production costs on the economic production rate. Gas price fluctuations make the economic production rate go down at different rates. Similar to the gas–water ratio and the number of wells, the lower gas price has stronger negative correlations with the economic production rate. Based on the previous analysis, it is reasonable to conclude that at a lower natural gas price, it is more necessary to develop gas hydrate exploitation technology to reduce production costs.
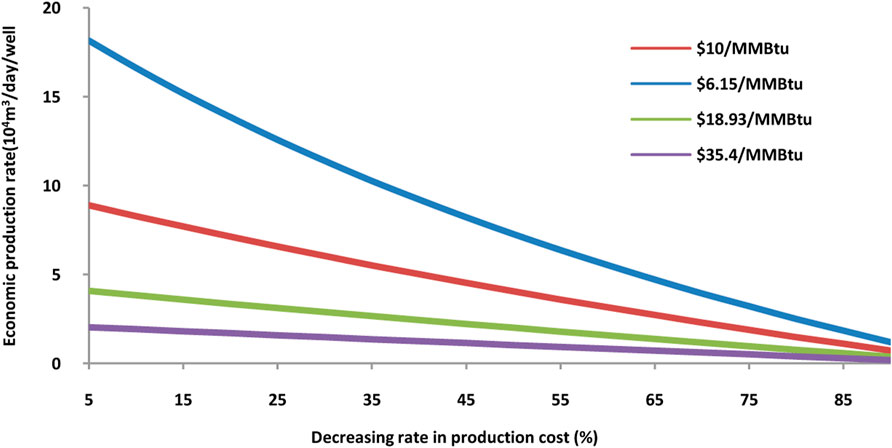
FIGURE 6. Sensitivity analysis of the decreasing rate on economic production rate at different gas prices with the gas–water ratio and the number of wells set at 100 and 30, respectively.
NGH is a strategic resource with a huge natural gas production potential. The industrialization of NGH has great significance for the achievement of peak carbon dioxide emissions and carbon neutrality. Economic evaluation is a prerequisite for NGH industrial exploitation. In this study, the economic production rate for industrial exploitation of NGH in different parameter scenarios, such as gas price, the number of wells, gas–water ratio, and decreasing rate in production cost, is estimated with a new hybrid method based on the discounted cash flow (DCF) method and the energy return on investment (EROI) method, and the following results are obtained:
1) The economic production rate of natural gas hydrate at sites GMGS1, GMGS2, GMGS3, GMGS4, and GMGS5 in the South China Sea is quantified in four scenarios with different gas prices. Changing the number of wells from 20 to 60, the economic production rate ranges from 1.96 to 29.60 × 10⁴ m3/d/well.
2) In a low gas price market, drilling more wells can decrease the economic production rate quickly at first, but when the number of wells reaches a certain number, it has little effect on the economic production rate.
3) Gas–water ratio has a limited impact on economic production when it is higher than 200. To make gas hydrate exploitation profitable, the lowest gas price must be higher than the cost for lifting produced water.
4) Gas price has a strong negative correlation with the economic production rate. Higher gas prices usually mean more cash inflows and lower economic production rate needed.
5) Reducing gas production costs is necessary to make gas hydrate exploitation competitive against other kinds of natural gas, especially at a low gas price.
The original contributions presented in the study are included in the article/Supplementary Material; further inquiries can be directed to the corresponding author.
LW: methodology, formal analysis, and writing—original draft. TZ: review and editing. HZ: supervision. YS: figure drawing. XY: editing and supervision. MM: figure drawing.
This work was supported by the Geological Survey Project of the China Geological Survey (No. DD20221828) and the Think-tank Project of the China University of Geosciences (No. 505104004).
The authors would like to express their sincere appreciation to the editor and reviewers for the suggestions and other assistance in improving this manuscript.
Authors LW, TZ, YS, and MM were employed by the Development and Research Center, China Geological Survey, China Geological Survey, and Oil and Gas Survey, China Geological Survey.
The remaining authors declare that the research was conducted in the absence of any commercial or financial relationships that could be construed as a potential conflict of interest.
All claims expressed in this article are solely those of the authors and do not necessarily represent those of their affiliated organizations, or those of the publisher, the editors, and the reviewers. Any product that may be evaluated in this article, or claim that may be made by its manufacturer, is not guaranteed or endorsed by the publisher.
Chen, X. J., Lu, H. L., Gu, L. J., Shang, S. L., Zhang, Y., Huang, X., et al. (2022a). Preliminary evaluation of the economic potential of the technologies for gas hydrate exploitation. Energy 243, 123007. doi:10.1016/j.energy.2021.123007
Chen, X. J., Lu, H. L., Zhang, J., Ye, J., and Xie, W. (2022b). Economic critical resources for the industrial exploitation of natural gas hydrate. Acta Geol. Sin. (Beijing) 96, 663–673. doi:10.1111/1755-6724.14927
Cleveland, C. J., Costanza, R., Hall, C. A., and Kaufmann, R. (1984). Energy and the US economy: a biophysical perspective. Science 225, 890–897. doi:10.1126/science.225.4665.890 http://www.jstor.org/stable/1693932
Cleveland, C. J. (1992). Energy quality and energy surplus in the extraction of fossil fuels in the U.S. Ecol. Econ. 6, 139–162. doi:10.1016/0921-8009(92)90010-P
Deepak, M., Kumar, P., Singh, K., and Yadav, U. S. (2019). Techno-economic forecasting of a hypothetical gas hydrate field in the offshore of India. Mar. Pet. Geol. 108, 741–746. doi:10.1016/j.marpetgeo.2018.11.016
Englezos, P. (1993). Clathrate hydrates. Ind. Eng. Chem. Res. 32 (7), 1251–1274. doi:10.1021/ie00019a001
Feng, J. C., Wang, Y. Z., Li, X. S., Li, G., Zhang, Y., and Chen, Z. Y. (2015). Production performance of gas hydrate accumulation at the GMGS2-site 16 of the pearl river mouth basin in the South China sea. J. Nat. Gas. Sci. Eng. 27, 306–320. doi:10.1016/j.jngse.2015.08.071
Hall, C. A., and Cleveland, C. J. (1981). Energy return on investment for United States petroleum, coal, and uranium.
Hao, Z. G. (2022). Exploring natural gas hydrates toward a carbon-neutral world. China Geol. 5, 1–4. doi:10.31035/cg2022022
Hou, X. Y. (2016). Adaptability of hydrate reservoir developing method and economic evaluation. MA thesis: China University of Petroleum East China. (In Chinese with English abstract).
Javed, A. (2016). Analysis of energy security, environmental emission and fuel import costs under energy import reduction targets: a case of Pakistan. Renew. Sustain. Energy Rev. 65, 1065–1078. doi:10.1016/j.rser.2016.07.037
Kong, Z. Y., Jiang, Q. Z., Dong, X. C., Wang, J., and Wan, X. (2018). Estimation of China's production efficiency of natural gas hydrates in the south china Sea. J. Clean. Prod. 203, 1–12. doi:10.1016/j.jclepro.2018.08.262
Kvenvolden, K. A. (1993). Gas hydrates—Geological perspective and global change. Rev. Geophys. 31, 173–187. doi:10.1029/93RG00268
Kvenvolden, K. A. (1988). Methane hydrate — a major reservoir of carbon in the shallow geosphere? Chem. Geol. 71, 41–51. doi:10.1016/0009-2541(88)90104-0
Li, G., and Li, X. S. (2011). Numerical simulation for gas production from hydrate accumulated in shenhu area, south china sea, using huff and puff method. CIESC J. 62, 459–468. (In Chinese with English abstract)
Li, J. F., Ye, J. L., Qin, X. W., Wu, N. Y., Hu, H. L., Xie, W. W., et al. (2018). The first offshore natural gas hydrate production test in South China Sea. China Geol. 1, 5–16. doi:10.31035/cg2018003
Li, P., and Zhang, J. S. (2018). A new hybrid method for China’s energy supply security forecasting based on ARIMA and XGBoost. Energies 11, 1687. doi:10.3390/en11071687
Li, P., and Zhang, J. S. (2019). Is China’s energy supply sustainable? New research model based on the exponential smoothing and GM(1, 1) methods. Energies 12, 236. doi:10.3390/en12020236
Liang, J., Meng, M. M., Liang, J. Q., Ren, J. F., He, Y. L., Li, T. W., et al. (2022). Drilling cores and geophysical characteristics of gas hydrate-bearing sediments in the production test region in the shenhu sea, south China sea. Front. Earth Sci. (Lausanne). 10, 911123. doi:10.3389/feart.2022.911123
Liang, J. Q., Zhang, W., Lu, J. G., Wei, J. G., Kuang, Z. G., and He, Y. L. (2019). Geological occurrence and accumulation mechanism of natural gas hydrates in the eastern qiongdongnan basin of the South China Sea: insights from site GMGS5-W9-2018. Mar. Geol. 418, 106042. doi:10.1016/j.margeo.2019.106042
Makogon, Y. F., Holditch, S. A., and Makogon, T. Y. (2005). Natural gas-hydrates a potential energy source for the 21st century. J. Pet. Sci. Eng. 56, 14–31. doi:10.1016/j.petrol.2005.10.009
Mh-21S, (2019). Japan's methane hydrate R&D program,comprehensive report of phase 2 & 3 research results.
Michael, D. M., and Arthur, H. J. (2019). Exploration and production of oceanic natural gas hydrate: Critical factors for commercialization. Second Edition. Switzerland: Springer.
Moridis, G. J., and Sloan, E. D. (2007). Gas production potential of disperse low-saturation hydrate accumulations in oceanic sediments. Energy Convers. Manag. 48, 1834–1849. doi:10.1016/j.enconman.2007.01.023
Sanja, P. (2021). Rystad energy: 2020 gas production exceeded demand. https://www.offshore-energy.biz/rystad-energy-2020-gas-production-exceeded-demand/.
Sun, J. X., Zhang, L., Ning, F. L., Lei, H. W., Liu, T. L., Hu, G. W., et al. (2017). Production potential and stability of hydrate-bearing sediments at the site GMGS3-W19 in the South China sea: a preliminary feasibility study. Mar. Pet. Geol. 86, 447–473. doi:10.1016/j.marpetgeo.2017.05.037
Tan, Z. F., Pan, G., and Liu, P. K. (2016). Focus on the development of natural gas hydrate in China. Sustainability 8, 520. doi:10.3390/su8060520
Vedachalam, N., Srinivasalu, S., Rajendran, G., Ramadass, G., and Atmanand, M. (2015). Review of unconventional hydrocarbon resources in major energy consuming countries and efforts in realizing natural gas hydrates as a future source of energy. J. Nat. Gas. Sci. Eng. 26, 163–175. doi:10.1016/j.jngse.2015.06.008
Walsh, M. R., Hancock, S. H., Wilson, S. J., Patil, S. L., Moridis, G. J., Boswell, R., et al. (2009). Preliminary report on the commercial viability of gas production from natural gas hydrates. Energy Econ. 31, 815–823. doi:10.1016/j.eneco.2009.03.006
Wang, X. W. (2015). Efficiency optimization design of oil production system using electric submersible pumps. Petroleum Eng. Constr. 41, 29–32. (In Chinese with English abstract). doi:10.3969/j.issn.1001-2206.2015.02.008
Wang, Y., Feng, J. C., Li, S., Zhang, Y., and Li, G. (2016). Evaluation of gas production from marine hydrate deposits at the GMGS2-site 8, pearl River Mouth basin, South China sea. Energies 9, 222. doi:10.3390/en9030222
Wei, J. G., Fang, Y. X., Lu, H. L., Lu, H. F., Lu, J. G., Liang, J. Q., et al. (2018). Distribution and characteristics of natural gas hydrates in the Shenhu sea area, South China sea. Mar. Pet. Geol. 98, 622–628. doi:10.1016/j.marpetgeo.2018.07.028
Wu, N. Y., Li, Y. L., Wang, Y. Z., Sun, J. Y., and Huang, L. (2020). Prospect of marine natural gas hydrate stimulation theory and technology system. Nat. Gas. Ind. 40, 100–115. (In Chinese with English abstract). doi:10.3787/j.issn.1000-0976.2020.08.008
Yamamoto, K., and Nagakubo, S. (2021). Review of energy efficiency of the gas production technologies from gas hydrate-bearing sediments. Front. Energy Res. 9. doi:10.3389/fenrg.2021.741715
Yamamoto, K., Terao, Y., Fujii, T., Ikawa, T., Seki, M., and Matsuzawa, M. (2014). “Operational overview of the first offshore production test of methane hydrates in the Eastern Nankai Trough,” in Paper presented at the offshore technology conference.
Yang, S. W., Lang, X. M., Wang, Y. H., Wen, Y. G., and Fan, S. S. (2014). Numerical simulation of Class 3 hydrate reservoirs exploiting using horizontal well by depressurization and thermal co-stimulation. Energy Convers. Manag. 77, 298–305. doi:10.1016/j.enconman.2013.09.046
Yang, S. W. (2013). Simulation and energy efficiency analysis of gas production from hydrates. PhD dissertation. Guangzhou: South China University of Technology. (In Chinese with English abstract).
Yang, S. X., Liang, J. Q., Liu, C. G., and Sha, Z. B. (2017). Progresses of gas hydrate resources exploration in sea area. Geol. Surv. China 4, 1–8. doi:10.19388/j.zgdzdc.2017.02.01
Ye, J. L., Qin, X. W., Xie, W. W., Lu, H. L., Qiu, H. j., et al. (2020). The second natural gas hydrate production test in the South China Sea. China Geol. 3, 197–209. doi:10.31035/cg2020043
Zeng, Y. B., Liao, Y. H., Jia, H., Yu, Z. Q., and Wu, S. W. (2015). Marine oil production exectirc submersible pump production opitmization method and its application. Petrochem. Technol. 22 (05), 105–106.
Zhang, W., Liang, J. Q., He, J. X., Cong, X. R., Su, P. B., et al. (2018). Differences in natural gas hydrate migration and accumulation between GMGS1 and GMGS3 drilling areas in the Shenhu area, northern South China Sea. Nat. Gas. indursty 38, 138–149. (In Chinese with English abstract). doi:10.3787/j.issn.1000-0976.2018.03.017
Zhang, W., Liang, J. Q., Wei, J. G., Su, P. P., Lin, L., Huang, W., et al. (2019). Origin of natural gases and associated gas hydrates in the Shenhu area, northern South China Sea: results from the China gas hydrate drilling expeditions. J. Asian Earth Sci. 183, 103953. doi:10.1016/j.jseaes.2019.103953
Zheng, R. C., She, H. B. Y., Babu, P., Linga, P., and Li, X. S. (2016). Review of natural gas hydrates as an energy resource: Prospects and challenges. Appl. Energy 162, 1633–1652. doi:10.1016/j.apenergy.2014.12.061
Keywords: natural gas hydrate (NGH), economic evaluation, discounted cash flow (DCF), energy return on investment (EROI), economic production rate
Citation: Wu L, Zhang T, Zhang H, Sui Y, Yu X and Miao M (2022) Economic evaluation of production capacity for natural gas hydrate industrial exploitation in the South China Sea. Front. Earth Sci. 10:990562. doi: 10.3389/feart.2022.990562
Received: 10 July 2022; Accepted: 25 July 2022;
Published: 02 September 2022.
Edited by:
Pibo Su, Guangzhou Marine Geological Survey, ChinaReviewed by:
Pin Li, Shanghai Jiao Tong University, ChinaCopyright © 2022 Wu, Zhang, Zhang, Sui, Yu and Miao. This is an open-access article distributed under the terms of the Creative Commons Attribution License (CC BY). The use, distribution or reproduction in other forums is permitted, provided the original author(s) and the copyright owner(s) are credited and that the original publication in this journal is cited, in accordance with accepted academic practice. No use, distribution or reproduction is permitted which does not comply with these terms.
*Correspondence: Tao Zhang, enRkcmNAc2luYS5jb20=
Disclaimer: All claims expressed in this article are solely those of the authors and do not necessarily represent those of their affiliated organizations, or those of the publisher, the editors and the reviewers. Any product that may be evaluated in this article or claim that may be made by its manufacturer is not guaranteed or endorsed by the publisher.
Research integrity at Frontiers
Learn more about the work of our research integrity team to safeguard the quality of each article we publish.