 Yao-Zong Teng
 Xiu-Liang Chen1
 Liang Chen
94% of researchers rate our articles as excellent or good
Learn more about the work of our research integrity team to safeguard the quality of each article we publish.
Find out more
ORIGINAL RESEARCH article
Front. Earth Sci., 26 September 2022
Sec. Geohazards and Georisks
Volume 10 - 2022 | https://doi.org/10.3389/feart.2022.989874
This article is part of the Research TopicAdvancement in Quantitative Risk Analysis of Geological Disaster in Reservoir AreasView all 8 articles
To study how gap-graded soil reinforced with fibers of different types restrains suffusion in embankment dams, the hydraulic response of fiber-reinforced soil (FRS) containing polypropylene fibers (PPF), coir fibers (CF) or basalt-tape fibers (BTF) was investigated in one-dimensional seepage tests. The critical hydraulic gradient and fine-particle loss of the FRS were analysed quantitatively by changing the fiber type, fiber content, and reinforcement-layer thickness. The test results show that the three types of FRS all had restraining effect on the development of suffusion. The netting reinforcement effect of PPF was the best, followed by the water absorption and expansion of CF to reduce pore volume, and finally the effect of BTF was to block migration channels under the same reinforcement conditions. With increasing fiber content and the reinforcement-layer thickness, the critical onset hydraulic gradient (
Internal erosion is divided into four failure modes: 1) backward erosion (i.e., general piping), 2) suffusion (i.e., segregation), 3) contact erosion, and 4) concentrated leak erosion (Fry 2012; Fell and Fry 2013). As a typical form of internal erosion, suffusion refers mainly to the seepage-induced migration and loss of fine particles along the pores between coarse grains with no change in volume of soils (Fannin and Slangen 2014). Soils susceptible to suffusion are considered as internally unstable soils, these generally being broadly graded or gap-graded soils (Wan and Fell 2008). In gap-graded soil, when fine particles migrate along the pore channels provided by coarse particles under the action of water flow, the internal particle arrangement of soil changes, resulting in the change of hydraulic and mechanical properties. Gap-graded soil in dams and levees can cause suffusion failure and affect safety (Fell et al., 2003; Zhang and Chen 2006; Zhang et al., 2013, 2016). Given their importance in conserving water, the safety and stability of embankment dams cannot be ignored. An investigation and statistical analysis of global embankment diseases and breaches showed that internal erosion has been responsible for roughly half of all global dike failures and breaches (Richards and Reddy 2007). Therefore, solving the problem of permeability stability of gap-graded soil is an important way to restrain internal erosion, maintain safe operation of the embankment and protect the lives and property of people downstream.
With the development of fiber materials in recent years, soil properties can now be improved effectively by mixing such as natural fiber (coir, jute, basalt etc.,) or synthetic fiber (polypropylene, polyester, glass etc.,) with soil randomly and uniformly, thereby filling the pores between the particles and forming isotropic bodies. Many studies have performed triaxial compression tests, unconfined tensile tests and direct shear tests to assess the strength of fiber-reinforced soil (FRS) (Ahmad et al., 2010; Das and Viswanadham 2010; Lovisa et al., 2010; Zheng et al., 2019; Lian et al., 2020; Han et al., 2021; Xu et al., 2021). After soil is mixed with fibers, the fibers fill the pores, and the contact mode of the soil changes from particle–particle to particle–fiber–particle; as the contact force between particles changes, so does the strength.
FRS is similar to soil reinforced by plant roots (Diambra et al., 2010; Divya et al., 2014), and adding fibers can be effective for improving the critical hydraulic gradient and reducing the seepage velocity. Given all of the above, various investigations of the hydraulic properties of FRS have been performed. By large-scale model tests and laboratory test, the effectiveness of FRS in enhancing permeability stability and resistance to suffusion was confirmed (Furumoto et al., 2002; Sivakumar Babu and Vasudevan, 2008; Das et al., 2009; Akay et al., 2016; Yang et al., 2017). Estabragh et al. (2014, 2016) performed comparative analysis on the restraining effects of polypropylene and polyester fibers on piping, and regression analysis was used to establish a model that was effective in predicting the seepage velocity and force for a randomly reinforced silty soil. FRS was considered as an effective way to improve bearing capacity and stability, enhance cohesion, increase piping resistance and reduce internal erosion (Santoni et al., 2001; Collins et al., 2015; Li and Senetakis, 2017; Mirzababaei et al., 2017), it has been used in geotechnical engineering widely (Laborel-Préneron et al., 2016; Bordoloi et al., 2017; Gowthaman et al., 2018).
However, there have been few studies of the hydraulic properties of natural fibers, as well as few systematic studies to compare and evaluate the reinforcement modes and restraining effects of different types of fibers. To study the differences and advantages of the anti-permeability of different types of fibers considering the different effects due to the reinforcement-layer thickness, in the study reported herein, three typical types of fibers were selected, i.e., polypropylene fibers (PPF), coir fibers (CF), and basalt-tape fibers (BTF), as well as three fiber content and reinforcement-layer thickness schemes. PPF are representative of artificial fibers in engineering applications, CF are used widely as highly durable natural fibers, and the tape structure and toughness of BTF produced by minerals give them good mechanical properties. The main aims of this study were as follows: 1) to analyse the suffusion development process and reinforcement mode of the three types of fibers through one-dimensional seepage tests and microscopy observations; 2) to study comparatively the hydraulic response of FRS under different fiber content and the reinforcement-layer thickness and evaluate the restraining effect; 3) to analyse the influence of fiber content and reinforcement-layer thickness on the suffusion restraining effect. By analysing the suffusion failure process and the results of suffusion and by comparing the suffusion restraining effects of the different types of FRS, the best fiber type, fiber content, and reinforcement-layer thickness were obtained, which have reference value for eliminating risk and protecting embankment dams by using FRS.
The test instrument was a self-designed one-dimensional seepage device that could self-circulate the water resources. As shown in Figure 1, it had four main parts: 1) a hydraulic head lifting device, 2) the soil specimen, 3) a fine-particle collecting and weighing device, and 4) data-acquisition equipment. The water reservoir was connected to the crank by wire rope, and the crank was turned to achieve different heights of hydraulic head. The soils were loaded in a transparent acrylic cylindrical cell, ensuring that the movement of fine particles can be observed through the containing wall. The soil specimen was divided into four layers labelled 1–4 from top to bottom and the glass beads were placed on bottom to buffer the water flow. A permeable plate and filter screen were placed between the glass beads and the soil layer and filter screen was affixed to the outlet of the fine-particle collecting to ensure water permeability and prevent the loss of fine particles. The data-acquisition equipment mainly includes pore-pressure sensors, paperless recorder, signal converter, and flow meter. The pore-pressure sensors save the pore pressure values in different time periods on the paperless recorder through the electrical signal. The flow meter requires a signal converter to convert the pulse signal into an electrical signal to be stored on the paperless recorder. The tautness meter inputs the changes in fine-particle loss mass to the paperless recorder in the form of electrical signals.
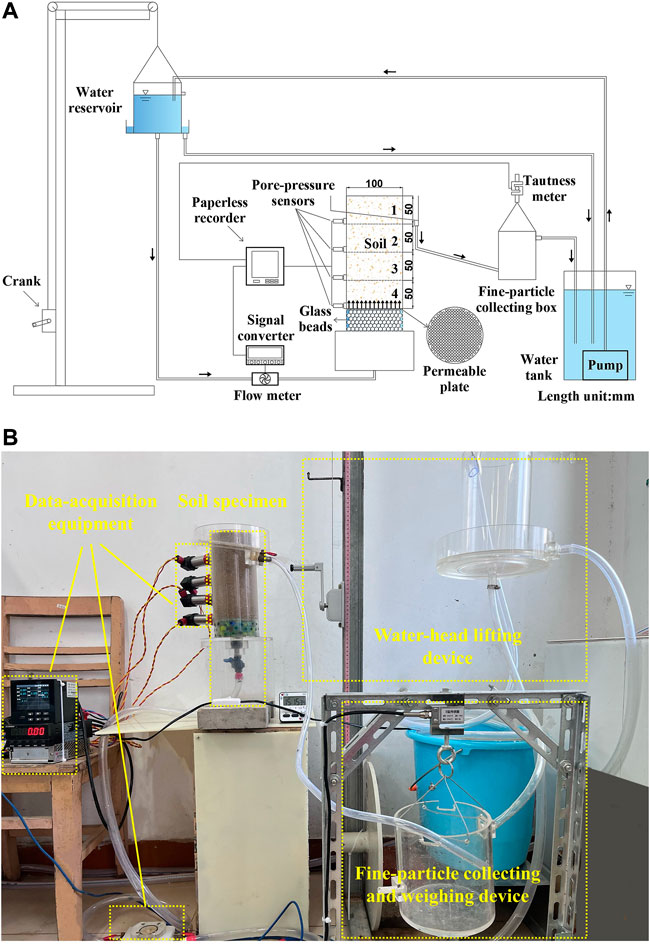
FIGURE 1. Experimental apparatus: (A) schematic; (B) photograph.
As the water reservoir height changes, the hydraulic gradient between any two pore-pressure sensors under different hydraulic head can be calculated as
where
Before a test, the fine-particle collecting box was filled with water at its overflow port and hung on the tautness meter. As shown schematically in Figure 2, the mass loss of fine particles was calculated as
where
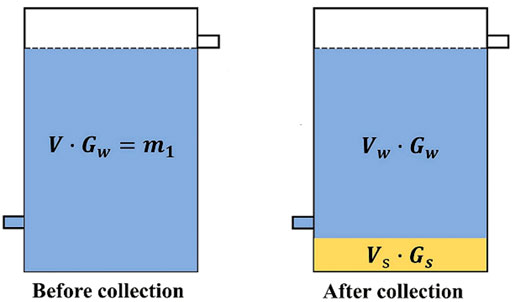
FIGURE 2. Schematic of calculation of fine-particle loss.
For a better evaluation of the loss degree of fine particles in the soil, the restraint rate of fine-particle loss (RF) is proposed, which is calculated as
where
Silica sand from the lower reaches of the Yangtze river in China was used in the tests, with sub-angular particle shapes. The specific weight of coarse particles was 2.71 and that of fine particles was 2.69, accounting for 82% and 18%, respectively. The particle grading curve is shown in Figure 3, and the soil properties are given in Table 1. The internal stability of the soil was evaluated using four typical criteria (Istomina 1957; Kézdi 1979; Kenney and Lau 1986; Li and Fannin 2008). By calculating, the basis for discriminant and results for the internal stability of the present soil specimens are given in Table 2.
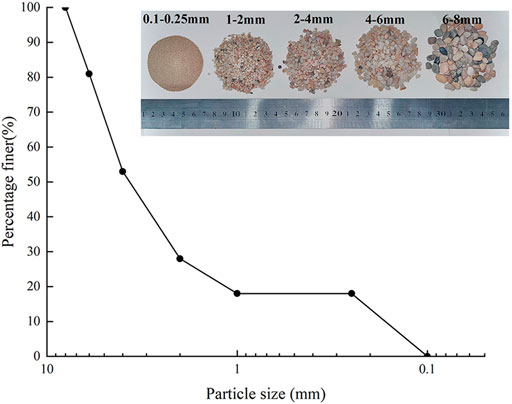
FIGURE 3. Particle size distribution curve and photographs of soils.
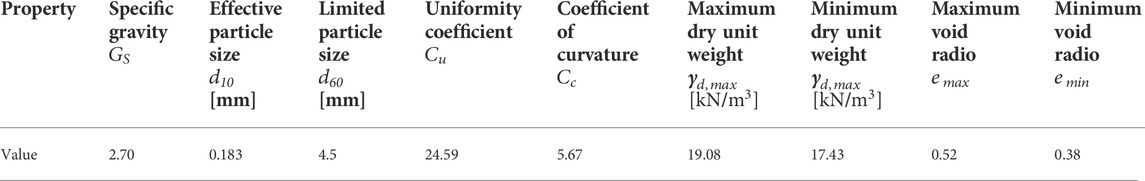
TABLE 1. Soil properties.
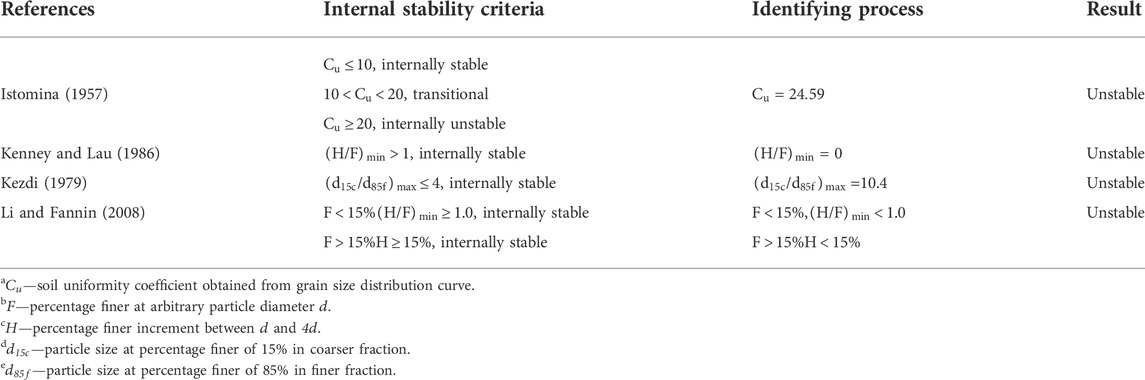
TABLE 2. Evaluation of internal instability of tested soils.
PPF, CF, and BTF were chosen for the seepage tests. According to the classification by Mohajerani et al. (2019), PPF are polymeric (i.e., plastic) fibers, CF are natural plant fibers, and BTF are natural mineral fibers. PPF are used widely in soil reinforcement: they are effective for improving the mechanical properties of soil and have the advantages of being relatively inexpensive and easy to transport. Previous results show that PPF are good at preventing internal erosion of soils (Diambra et al., 2010; Estabragh et al., 2014; Yang et al., 2017). CF are found widely in tropical areas, and their surfaces are rough and they bend easily; they have a high lignin content, degrade slowly and have high water-absorption and expansion characteristics (Hejazi et al., 2012; Gowthaman et al., 2018). BTF are used widely for they were cost-effective and have become substitutes for glass fibers (Zheng et al., 2019). Figure 4 shows photographs of the three types of fibers, and Table 3 gives their properties. In previous studies, the authors mainly took fiber content and fiber length as variables to study the restraining effect of fiber, and fiber length and restraining effect generally had a positive and linear increasing relationship. Meanwhile, the suffusion phenomenon of PPF is most obvious at 19 mm and can be better compared with the other two fibers (Yang et al., 2019). Herein, the influence of fiber length is not considered, so all the fiber lengths are 19 mm.
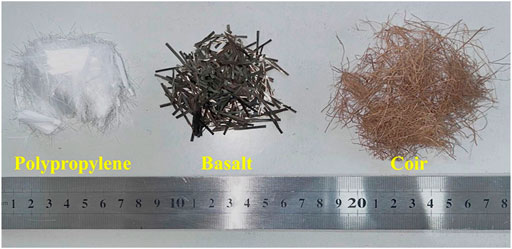
FIGURE 4. Photographs of three types of fibers.
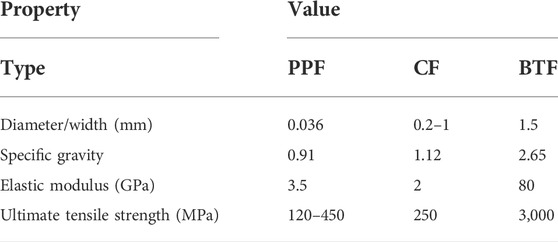
TABLE 3. Fiber properties.
Table 4 lists the test schemes and results. Twenty-eight tests were carried out on the three types of fibers with different reinforcement-layer thickness and fiber content, one of which was on soil with no fibers for comparison. The three cases for the reinforcement-layer thickness were 1) fibers in the first layer (quarter), 2) fibers in the first and second layers (half) and 3) fibers from the first to forth layers (all). The volumetric fiber content was 0.2%, 0.4%, and 0.6%, respectively. The name of the test schemes indicates the type of fiber, the reinforcement-layer thickness, and the fiber content in this group. For example, Pq-0.2 indicates the incorporation of polypropylene fiber with volumetric content of 0.2 in the first layer of soil specimen.

TABLE 4. Summary of test results.
To prepare a specimen, it was divided into four 5-cm-thick layers and loaded with a relative density of
where
The range of soil restrained by unit volume of fiber is limited. If gravimetric fiber content is used, the range of soil controlled by fiber will be different due to the different specific gravity of fiber (Das and Viswanadham 2010), which is not conducive to the comparison of restraining effects. However, by using the volumetric fiber content, in the same specimen, even if the fiber is different, the fiber volume in the unit volume of soil is the same, so that the control range is the same. The volumetric fiber content
where
To prevent uneven mixing of coarse and fine particles and fibers, the wet specimen method was used. First, the soil and fibers were weighed according to the density and fiber content of each scheme, then ca. 2% water was added and the mixture was stirred. Second, Vaseline was applied evenly on the containing wall of the soil specimen before loading to prevent the formation of potential migration channels that otherwise would have affected the test results. Third, the moist soil-fiber mixture was filled in four layers. Filling in three or four times every layer was to ensure the uniformity of the soil-fiber mixture through the entire specimen. Each layer was tamped with a metal hammer to the appropriate height and density. The soil specimen was loaded and tamped to the design elevation of 20 cm.
Before the formal start of a test, the water tank was raised to a liquid level of 1 cm above the top of the specimen for no less than 24 h of saturation. In the initial stage, to better capture the change of critical hydraulic gradient, the water reservoir was raised by 1 cm every 2.5 min and then by 2 cm every 5 min after reaching 10 cm, and the hydraulic head holding time at each stage is 5 min to allow suffusion to develop fully. After the hydraulic head had been raised to 50 cm and maintained for 5 min, the valve was closed to end the test. During the experiment, a camera was used to record the state of particles at different stages.
The onset of suffusion is affected by four main factors: 1) seepage condition, 2) geometric condition, 3) physical condition, and 4) stress condition. As one of the seepage conditions, the critical hydraulic gradient is an evaluation criterion for the onset of suffusion. It was affected by the geometric and physical conditions of soil and the surrounding stress conditions. In FRS, the fiber mixing changes the geometric condition of the pore size between particles, and the restraining effect can be evaluated quantitatively by the hydraulic gradient. Yang et al. (2019) defined three critical hydraulic gradients from 1) the phenomenon of fine-particle migration at the top of the specimen, 2) changes in soil permeability or flow conditions, and 3) mass loss of fine particles. On this basis, the critical onset hydraulic gradient (
From analysing the pore water pressure, seepage velocity, the loss of fine-particle and other results, the reinforcement modes and restraining effects of the different types of fibers are discussed under different fiber content and different reinforcement-layer thickness. The i–v curves were used to discuss the relations between hydraulic gradient and seepage velocity and analyse the suffusion process and restraining effect for further comparison.
To compare the restraining effects of the different types of fibers, the present experimental design used volumetric fiber content so that the soil volume affected by fibers per unit volume was the same. It is concluded that compacting the sand–fiber mixture causes the fibers to approach horizontal during specimen preparation (Diambra et al., 2007). Therefore, without the influence of fiber distribution direction, the restraining effect under the same fiber content and reinforcement-layer thickness is related mainly to the reinforcement mode. The interaction between the three types of fibers and the soil particles is analysed from Figure 5. Figure 5A mainly depicted the contact relationship and interaction between fibers and fine particles during the test, while Figure 5B illustrated the different pattern of restraining effect of fibers.
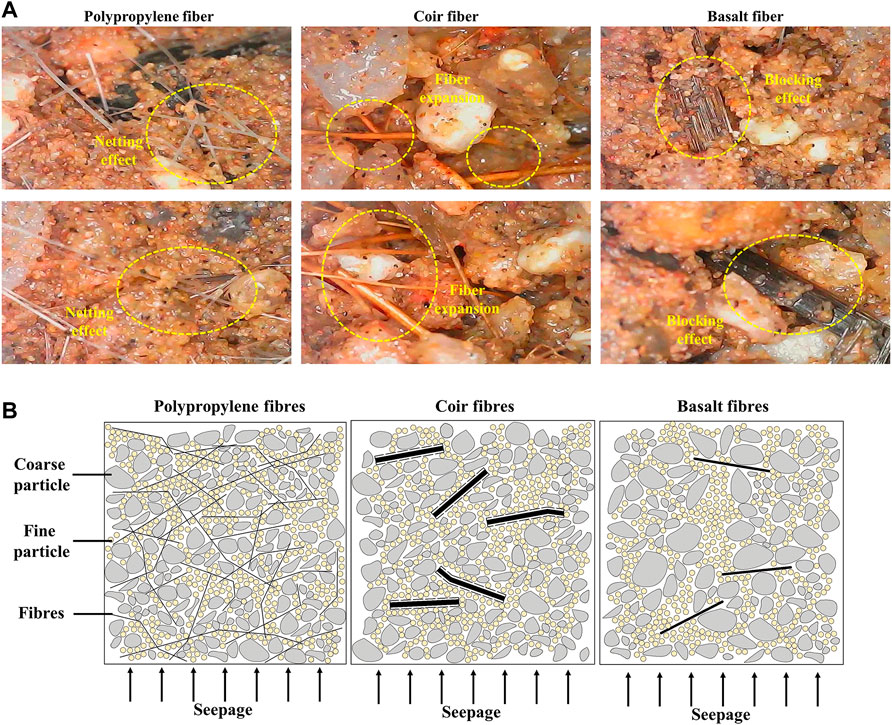
FIGURE 5. Reinforcement mechanisms: (A) microscope photographs; (B) schematics.
Under the same volumetric fiber content, PPF are thinner than the other two types of fibers, so there are more fiber number in per unit volume of soil and dense interweaving can be seen in the Figure 5A. Fibers cross-stack each other in the pores, forming a netting effect that is the same as the pattern in the study by Yang et al. (2019). This netting effect reduces the cross-sectional area of the migration channels, and the fine particles are blocked by the fiber mesh and cannot migrate easily out of the soil, thereby preventing the development of suffusion.
As natural plant fibers, CF are characterised by water absorption and expansion. Before a test, the CF were dried, then during specimen saturation and testing, they absorbed water and expanded, thereby reducing effectively the volume of migration channels. Figure 5A clearly shows that CF occupies the pore volume after expansion. Meanwhile, because of the coarse surfaces of CF, the contact between fine particles and CF will produce a certain friction that consumes the energy of particles moving out of the soil. As the migration of fine particles becomes more difficult, suffusion can be restrained.
BTF block the migration channels of fine particles mainly by their shape characteristics, because their tape structure blocks the cross section of the migration channels, thereby improving the seepage resistance. However, as the hydraulic gradient increases, fine particles move along the fibers and then migration occurs, bypassing the fibers. Figure 5A shows that fine particles migrate out from the edge of the BTF. With increasing fiber content and the reinforcement-layer thickness, the fine particles are blocked more in the migration process, thereby producing an effective restraining effect.
Because the suffusion process was similar for different specimens, four typical tests, i.e., G, Pa-0.4, Ch-0.4, and Bq-0.4, were selected to discuss the suffusion process in detail.
Figure 6 shows the i–v curve when no fibers were mixed with the soil (test G), and Figure 7 shows the corresponding experimental phenomenon during the development of suffusion. In the initial seepage stage, the i–v curve is relatively flat and the fine particles remain static. When the hydraulic gradient reaches i = 0.1, many fine particles bounce on the upper layer and surface of the specimen, but the phenomenon occurs in only a small local range. As the hydraulic gradient increases, the regions in which fine particles are in motion expand, and when the hydraulic gradient reaches 0.178, these regions were connected and the seepage velocity increases. Under the action of the seepage force, particles migrate out of the specimen along the channels, and fine particles begin to accumulate on the top surface of the specimen and are lost with the water flow. After the test, obvious suffusion outlets were observed on the surface. As shown in Figure 6, the slope of the i–v curve tended to steepen after fine-particle migration, indicating that the permeability coefficient increased gradually after fine-particle loss.
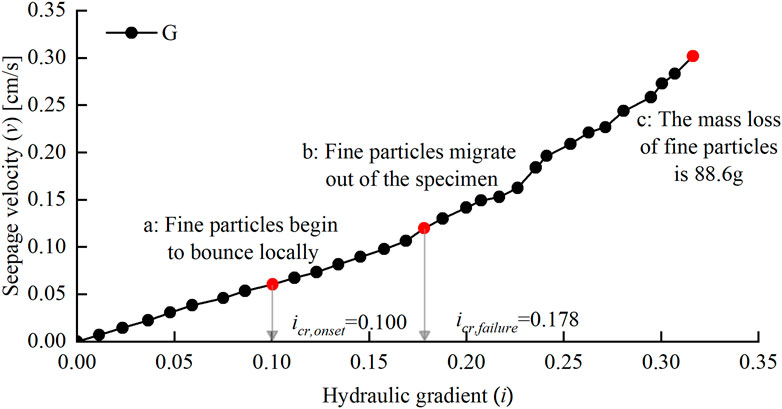
FIGURE 6. i–v curve for unreinforced gap-graded soil.
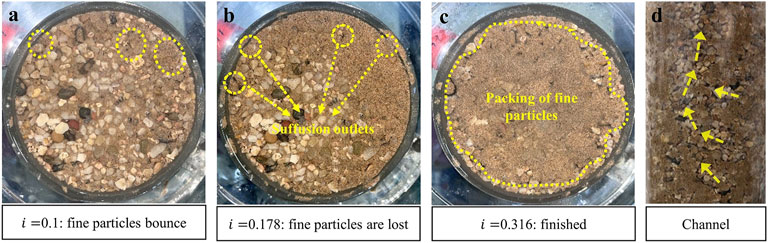
FIGURE 7. Test phenomena for unreinforced gap-graded soil (test G). (A) i = 0.1: fine particles bounce. (B) i = 0.178: fine particles are lost. (C) i = 0.316: finished. (D) Changed.
Figure 8 shows the i–v curve when all four layers are mixed with PPF and the content is 0.4%. Compared with test G,
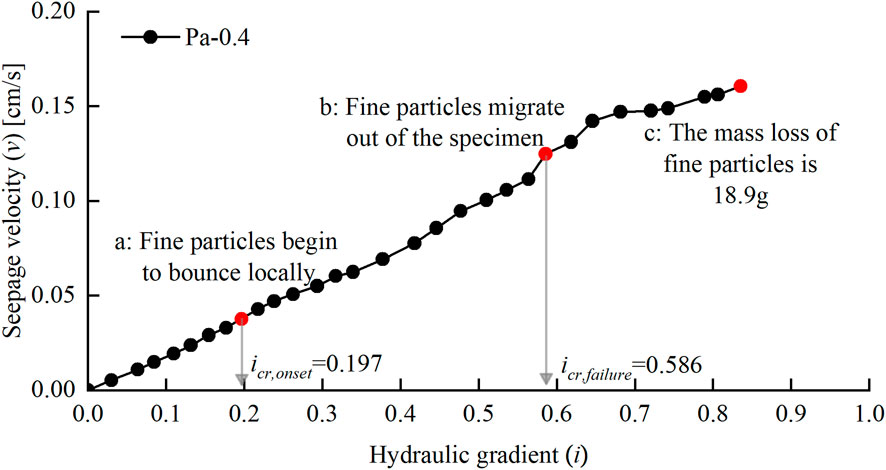
FIGURE 8. i–v curve for test Pa-0.4.
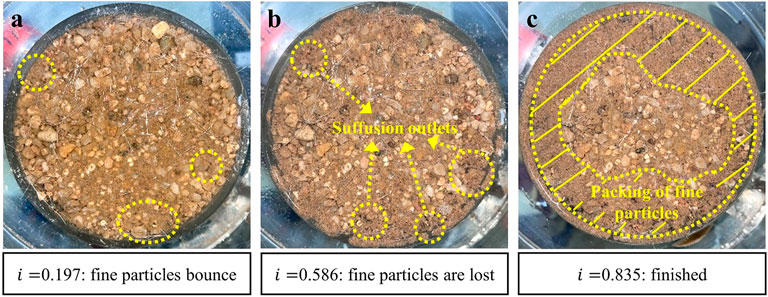
FIGURE 9. Phenomena in test Pa-0.4. (A) i = 0.197: fine particles bounce. (B) i = 0.586: fine particles are lost. (C) i = 0.835: finished.
Figure 10 shows the i–v curve for test Ch-0.4, in which the specimen had 0.4% CF in the first and second layers. The i–v curve for test Ch-0.4 is similar to that for test G. When the hydraulic gradient exceeds
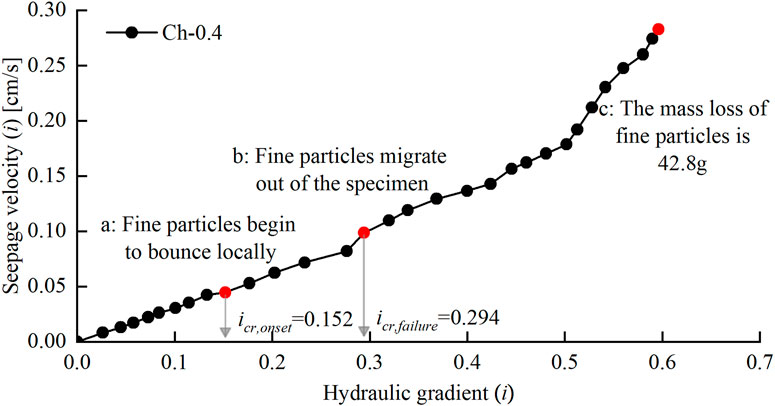
FIGURE 10. i–v curve for test Ch-0.4.
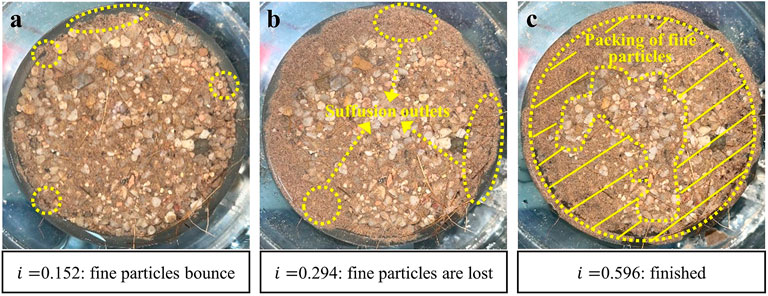
FIGURE 11. Phenomena in test Ch-0.4. (A) i = 0.512: fine particles bounce. (B) i = 0.294: fine particles are lost. (C) i = 0.596: finished.
Figure 12 shows the i–v curve for test Bq-0.4, in which BTF with a content of 0.4% were incorporated in only the first layer. Compared with test G, the i–v curve again steepens after
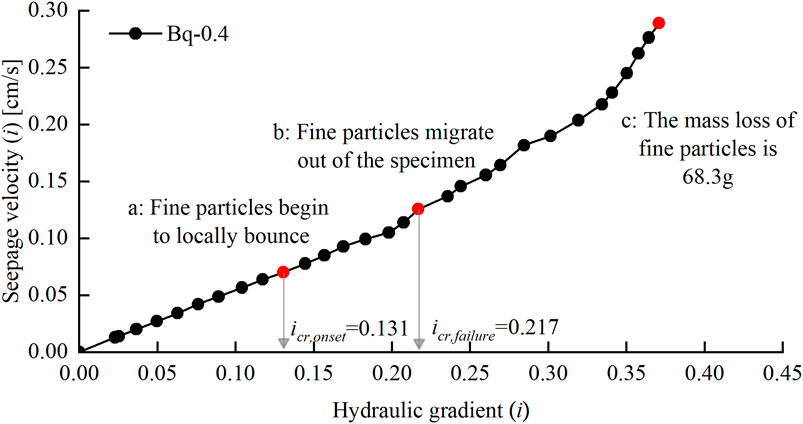
FIGURE 12. i–v curve for test Bq-0.4.
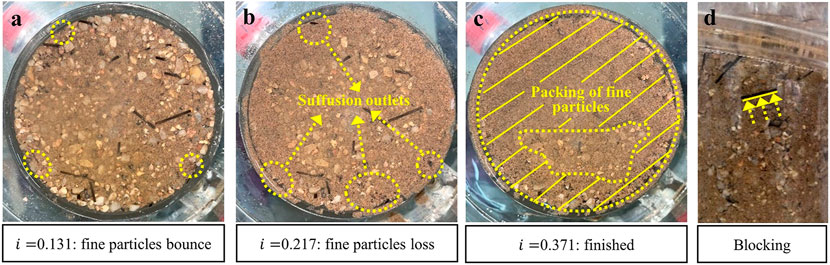
FIGURE 13. Phenomena in test Bq-0.4.(A) i = 0.131 fine particles bounce. (B) i = 0.217: fine particles loss. (C) i = 0.371: finished. (D) Blocking.
Table 4 and Figure 14 show that after the fibers were mixed with the soil,
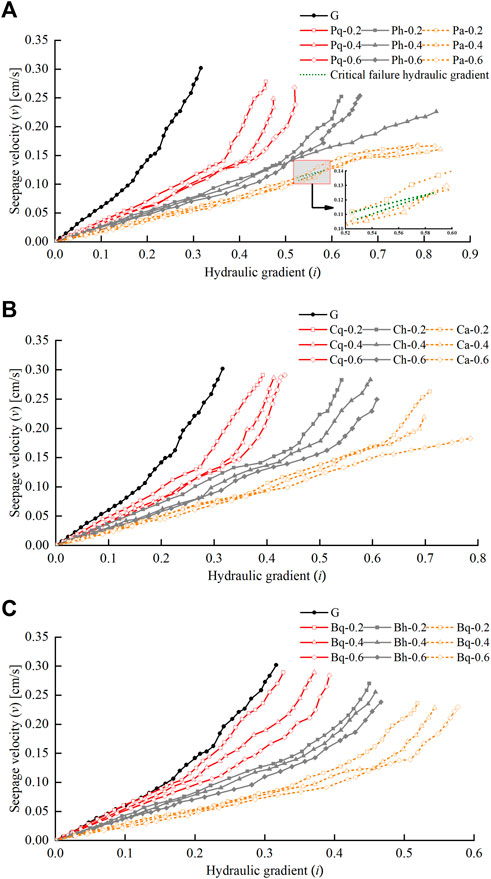
FIGURE 14. i–v curves for three types of fiber-reinforced soil: (A) PPF; (B) CF; (C) BTF.
The slope of the i–v curve reflects the change in the permeability coefficient. From Figure 14A, the critical failure hydraulic gradient line bends downward, and the permeability coefficient is higher when the PPF content is 0.6% than when it is 0.4%, mainly because there is slightly more PPF and it is difficult to distribute it evenly in the soil, resulting in clustering; this phenomenon was also noted by Das et al. (2009). The clustering of fibers provides channels for fine particles to migrate, thereby reducing the restraining effect. After reaching
From Figures 14B,C, the i–v curves of FRS were gradually slower than that of test G, indicating that the restraining effect of CF and BTF was gradually enhanced with the increase of fiber content and reinforcement-layer thickness. The permeability coefficient of Ca-0.6 varied slightly, indicating that the content of CF at this time can effectively restrain fine particles in the pores without loss.
Having lost fine particles, there is a lack of filling in the pores between coarse particles, and the overall strength decreases while also providing channels for migrating particles in the lower part, which is a vicious cycle until the channels are finally connected. There was no significant difference in the maximum values of RF among the three types of fibers, but for the minimum values, that for PPF was 1.6 and 3 times those for the other two types of fibers. The mass loss and RF values from each test are summarised in Table 4, and from analysing the changes in the critical hydraulic gradient, permeability coefficient and fine-particle loss, it is concluded that the order of the restraining effects of the three types of fibers is PPF > CF > BTF.
Figure 15 shows how fiber type, fiber content and reinforcement-layer thickness influence
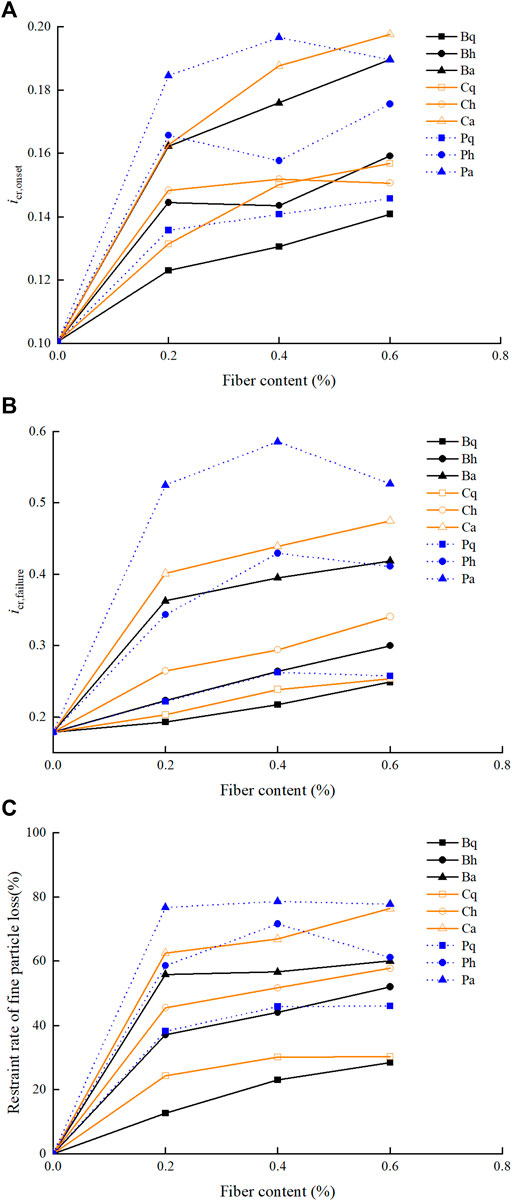
FIGURE 15. Influences of fiber parameters on
For a better comparison of the influence degrees of fiber content and reinforcement-layer thickness on each parameter, multiple linear regression analysis was used, and the results are given in Table 5. The values of B and β reflect the degree of influence on seepage parameters. R2 represents the quality of regression equation fitting, and the closer it is to 1, the better the fitting effect. Through the value of R2, it can be found that the regression curves fitting effect were better. The analysis shows that the fiber content and reinforcement-layer thickness have positive influences on the parameters. By comparing the values of B, it can be concluded that the influence degree of the reinforcement-layer thickness is greater than the fiber content. β reflects the influence of multiple independent variables on dependent variables, and its variation rule shows clearly that the reinforcement-layer thickness has a high degree of influence.
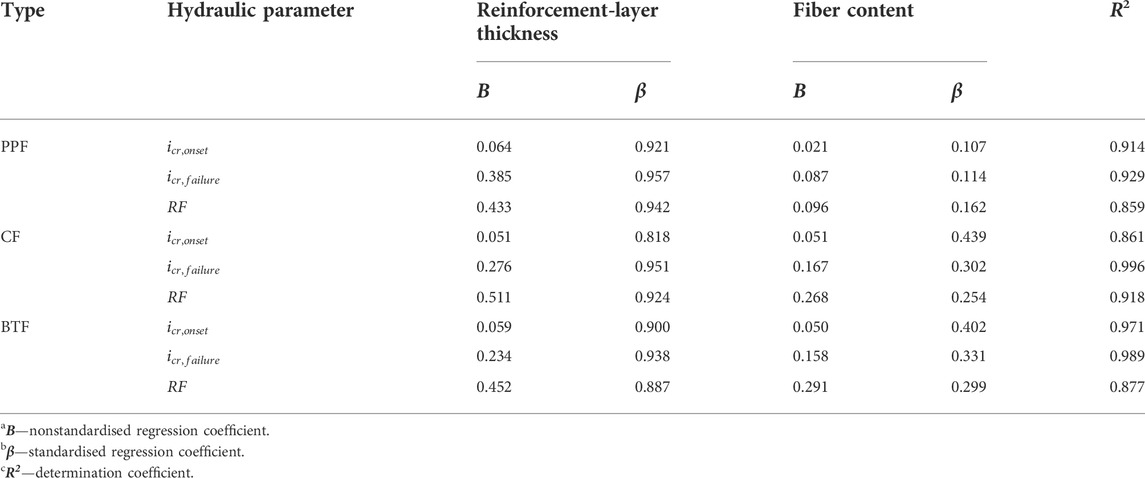
TABLE 5. Summary of linear regression parameters.
In the study reported herein, one-dimensional seepage tests were conducted on soil reinforced by PPF, CF, and BTF with differing content and reinforcement-layer thickness. The reinforcement modes were explored via microscopy observations of particle–fiber interactions, and the process of suffusion occurrence and development was analysed, as were the variation rules for the hydraulic gradient and fine-particle loss. The following conclusions are drawn.
1. PPF, CF, and BTF all play a positive role in restraining suffusion. The microscopy analysis shows that the reinforcement mode of PPF is netting reinforcement, CF reduce the channel spaces because of their water absorption and expansion, while BTF block the migration channels because of the large contact area of its tape structure.
2. The order of the restraining effects on suffusion is PPF > CF > BTF. The maximum change rate of
3. The increase of fiber content enhances the effect of reinforcement mode, and the increase of reinforcement-layer thickness extends the restraint distance for fine particles migration. Through multiple linear regression analysis, it was found that the influence degree of the reinforcement-layer thickness is greater than fiber content.
4. According to the analysis, the optimal fiber type and content for restraining suffusion are PPF and 0.4% when all the layer were reinforced, in which case RF is nearly 80%. When CF or BTF are used in FRS to restrain suffusion, it is best to reinforce all layers with a content of 0.6%. The present results offer theoretical guidance for preventing risk and protecting embankments.
The original contributions presented in the study are included in the article/supplementary material, further inquiries can be directed to the corresponding author.
All authors listed have made a substantial, direct, and intellectual contribution to the work and approved it for publication. Conceptualization, Y-Z T and LC; methodology, Y-Z T, Z-XY, and Z-ZL; validation, LC; formal analysis, X-LC; investigation, Y-Z T, LH, Z-XY, and Z-ZL; resources, LC and X-LC; data curation, J-HG.; writing-original draft preparation, Y-Z T and LH; writing-review and editing, Y-Z T; funding acquisition, LC and X-LC.
This research was funded by the National Key Research and Development Program of China (No. 2019YFC1510802), Open fund of Key Laboratory of Hydraulic Disaster Prevention and Mitigation of Zhejiang Province (FZJZSYS21002); Science and technology planning project of Water Resources Department of Zhejiang Province (RB 2027).
The authors declare that the research was conducted in the absence of any commercial or financial relationships that could be construed as a potential conflict of interest.
All claims expressed in this article are solely those of the authors and do not necessarily represent those of their affiliated organizations, or those of the publisher, the editors and the reviewers. Any product that may be evaluated in this article, or claim that may be made by its manufacturer, is not guaranteed or endorsed by the publisher.
Ahmad, F., Bateni, F., and Azmi, M. (2010). Performance evaluation of silty sand reinforced with fibres. Geotext. Geomembranes 28, 93–99. doi:10.1016/j.geotexmem.2009.09.017
Akay, O., Özer, A. T., Fox, G. A., and Wilson, G. V. (2016). “Behavior of fiber-reinforced sandy slopes under seepage,” in World Environmental and Water Resources Congress, May 22–26, 2016 (West Palm Beach, Florida: ASCE), 397–406. doi:10.1061/9780784479858
Bordoloi, S., Garg, A., and Sekharan, S. (2017). A review of physio-biochemical properties of natural fibers and their application in soil reinforcement. Adv. Civ. Eng. Mat. 6, 20160076–20160359. doi:10.1520/acem20160076
Collins, R., Zhang, M., Zhang, X., Hulsey, L., Ravens, T., and Van Veldhuizen, R. (2015). Evaluation of geofibers and nontraditional liquid additives on erodible slopes in Interior Alaska. Geotext. Geomembranes 43, 412–423. doi:10.1016/j.geotexmem.2015.04.015
Das, A., and Viswanadham, B. V. S. (2010). Experiments on the piping behavior of geofiber-reinforced soil. Geosynth. Int. 17, 171–182. doi:10.1680/gein.2010.17.4.171
Das, A., Jayashree, C., and Viswanadham, B. V. S. (2009). Effect of randomly distributed geofibers on the piping behaviour of embankments constructed with fly ash as a fill material. Geotext. Geomembranes 27, 341–349. doi:10.1016/j.geotexmem.2009.02.004
Diambra, A., Ibraim, E., Wood, D. M., and Russell, A. R. (2010). Fibre reinforced sands: Experiments and modelling. Geotext. Geomembranes 28, 238–250. doi:10.1016/j.geotexmem.2009.09.010
Diambra, A., Russell, A. R., Ibraim, E., and Muir Wood, D. (2007). Determination of fibre orientation distribution in reinforced sands. Géotechnique 57, 623–628. doi:10.1680/geot.2007.57.7.623
Divya, P. V., Viswanadham, B. V. S., and Gourc, J. P. (2014). Evaluation of tensile strength-strain characteristics of fiber-reinforced soil through laboratory tests. J. Mat. Civ. Eng. 26, 14–23. doi:10.1061/(asce)mt.1943-5533.0000772
Estabragh, A. R., Soltani, A., and Javadi, A. A. (2016). Models for predicting the seepage velocity and seepage force in a fiber reinforced silty soil. Comput. Geotechnics 75, 174–181. doi:10.1016/j.compgeo.2016.02.002
Estabragh, A. R., Soltannajad, K., and Javadi, A. A. (2014). Improving piping resistance using randomly distributed fibers. Geotext. Geomembranes 42, 15–24. doi:10.1016/j.geotexmem.2013.12.005
Fannin, R. J., and Slangen, P. (2014). On the distinct phenomena of suffusion and suffosion. Géotechnique Lett. 4, 289–294. doi:10.1680/geolett.14.00051
Fell, R., and Fry, J. J. (2013). “State of the art on the likelihood of internal erosion of dams and levees by means of testing,” in Erosion in geomechanics applied to dams and levees. 1–99. Editors S. Bonelli, and F. Nicot (Hoboken, NJ, United States: John Wiley & Sons).
Fell, R., Wan, C. F., Cyganiewicz, J., and Foster, M. (2003). Time for development of internal erosion and piping in embankment dams. J. Geotech. Geoenviron. Eng. 129, 307–314. doi:10.1061/(asce)1090-0241(2003)129:4(307)
Fry, J. (2012). “Introduction to the process of internal erosion in hydraulic structures: Embankment dams and dikes,” in Erosion of geomaterials. Editor S. Bonelli (London: ISTE Ltd).
Furumoto, K., Miki, H., Tsuneoka, N., and Obata, T. (2002). “Model test on the piping resistance of short fiber reinforced soil and its application to river levee,” in Proceedings of 7th international conference on geosynthetics (Pendergrass, GA, United States: Geosynthetics), 1241–1244.
Gowthaman, S., Nakashima, K., and Kawasaki, S. (2018). A state-of-the-art review on soil reinforcement technology using natural plant fiber materials: Past findings, present trends and future directions. Materials 11, 553. doi:10.3390/ma11040553
Han, C., He, Y., Tian, J., Zhang, J., Li, J., and Wang, S. (2021). Shear strength of polypropylene fibre reinforced clay. Road Mater. Pavement Des. 22, 2783–2800. doi:10.1080/14680629.2020.1798807
Hejazi, S. M., Sheikhzadeh, M., Abtahi, S. M., and Zadhoush, A. (2012). A simple review of soil reinforcement by using natural and synthetic fibers. Constr. Build. Mater. 30, 100–116. doi:10.1016/j.conbuildmat.2011.11.045
Kenney, T. C., and Lau, D. (1986). Internal stability of granular filters: Reply. Can. Geotech. J. 23, 420–423. doi:10.1139/t86-068
Kézdi, A. (1979). Soil physics - selected topics - developments in geotechnical engineering - 25. Amsterdam, Netherlands.: Elsevier.
Laborel-Préneron, A., Aubert, J. E., Magniont, C., Tribout, C., and Bertron, A. (2016). Plant aggregates and fibers in Earth construction materials: A review. Constr. Build. Mater. 111, 719–734. doi:10.1016/j.conbuildmat.2016.02.119
Li, H., and Senetakis, K. (2017). Dynamic properties of polypropylene fibre-reinforced silica quarry sand. Soil Dyn. Earthq. Eng. 100, 224–232. doi:10.1016/j.soildyn.2017.05.035
Li, M., and Fannin, R. J. (2008). Comparison of two criteria for internal stability of granular soil. Can. Geotech. J. 45, 1303–1309. doi:10.1139/t08-046
Lian, B., Peng, J., Zhan, H., and Cui, X. (2020). Effect of randomly distributed fibre on triaxial shear behavior of loess. Bull. Eng. Geol. Environ. 79, 1555–1563. doi:10.1007/s10064-019-01666-0
Lovisa, J., Shukla, S. K., and Sivakugan, N. (2010). Shear strength of randomly distributed moist fibre-reinforced sand. Geosynth. Int. 17, 100–106. doi:10.1680/gein.2010.17.2.100
Mirzababaei, M., Mohamed, M., and Miraftab, M. (2017). Analysis of strip footings on fiber-reinforced slopes with the aid of particle image velocimetry. J. Mat. Civ. Eng. 29, 04016243. doi:10.1061/(asce)mt.1943-5533.0001758
Mohajerani, A., Hui, S. Q., Mirzababaei, M., Arulrajah, A., Horpibulsuk, S., Abdul Kadir, A., et al. (2019). Amazing types, properties, and applications of fibres in construction materials. Materials 12, 2513. doi:10.3390/ma12162513
Richards, K. S., and Reddy, K. R. (2007). Critical appraisal of piping phenomena in Earth dams. Bull. Eng. Geol. Environ. 66, 381–402. doi:10.1007/s10064-007-0095-0
Santoni, R. L., Tingle, J. S., and Webster, S. L. (2001). Engineering properties of sand-fiber mixtures for road construction. J. Geotech. Geoenviron. Eng. 127, 258–268. doi:10.1061/(asce)1090-0241(2001)127:3(258)
Sivakumar Babu, G. L., and Vasudevan, A. K. (2008). Seepage velocity and piping resistance of coir fiber mixed soils. J. Irrig. Drain. Eng. 134, 485–492. doi:10.1061/(asce)0733-9437(2008)134:4(485)
Wan, C. F., and Fell, R. (2008). Assessing the potential of internal instability and suffusion in embankment dams and their foundations. J. Geotech. Geoenviron. Eng. 134, 401–407. doi:10.1061/(asce)1090-0241(2008)134:3(401)
Xu, D. S., Yan, J. M., and Liu, Q. (2021). Behavior of discrete fiber-reinforced sandy soil in large-scale simple shear tests. Geosynth. Int. 28, 598–608. doi:10.1680/jgein.21.00007
Yang, K. H., Adilehou, W. M., Jian, S. T., and Wei, S. B. (2017). Hydraulic response of fibre-reinforced sand subject to seepage. Geosynth. Int. 24, 491–507. doi:10.1680/jgein.17.00017
Yang, K. H., Wei, S. B., Adilehou, W. M., and Ho, H. C. (2019). Fiber-reinforced internally unstable soil against suffusion failure. Constr. Build. Mater. 222, 458–473. doi:10.1016/j.conbuildmat.2019.06.142
Zhang, L. M., and Chen, Q. (2006). Seepage failure mechanism of the Gouhou rockfill dam during reservoir water infiltration. Soils Found. 46, 557–568. doi:10.3208/sandf.46.557
Zhang, L. M., Peng, M., Chang, D. S., and Xu, Y. (2016). Dam failure mechanisms and risk assessment. New York: Wiley.
Zhang, L. M., Xu, Y., Liu, Y., and Peng, M. (2013). Assessment of flood risks in pearl river delta due to levee breaching. Georisk Assess. Manag. Risk Eng. Syst. Geohazards 7, 122–133. doi:10.1080/17499518.2013.790733
Keywords: fiber reinforcement, suffusion, hydraulic failure, gap-graded soil, critical hydraulic gradient, restraining effect
Citation: Teng Y-Z, Chen X-L, Chen L, Hu L, Gu J-H, Yin Z-X and Lu Z-Z (2022) Suffusion restraint in gap-graded soil reinforced with fibers. Front. Earth Sci. 10:989874. doi: 10.3389/feart.2022.989874
Received: 09 July 2022; Accepted: 07 September 2022;
Published: 26 September 2022.
Edited by:
Chao Zhou, China University of Geosciences Wuhan, ChinaCopyright © 2022 Teng, Chen, Chen, Hu, Gu, Yin and Lu. This is an open-access article distributed under the terms of the Creative Commons Attribution License (CC BY). The use, distribution or reproduction in other forums is permitted, provided the original author(s) and the copyright owner(s) are credited and that the original publication in this journal is cited, in accordance with accepted academic practice. No use, distribution or reproduction is permitted which does not comply with these terms.
*Correspondence: Liang Chen, Y2hlbmxpYW5nQGhodS5lZHUuY24=
Disclaimer: All claims expressed in this article are solely those of the authors and do not necessarily represent those of their affiliated organizations, or those of the publisher, the editors and the reviewers. Any product that may be evaluated in this article or claim that may be made by its manufacturer is not guaranteed or endorsed by the publisher.
Research integrity at Frontiers
Learn more about the work of our research integrity team to safeguard the quality of each article we publish.