 Davide Zaccagnino
 Luciano Telesca
 Carlo Doglioni
- 1Earth Sciences Department, Sapienza University, Rome, Italy
- 2Istituto di Metodologie per l’ Analisi Ambientale (CNR-IMAA), Tito Scalo, Italy
- 3Istituto Nazionale di Geofisica e Vulcanologia (INGV), Rome, Italy
Assessing the stability state of fault interfaces is a task of primary interest not only for seismic hazards, but also for understanding how the earthquake machine works. Nowadays it is well known that a relationship exists between slow and fast earthquakes; moreover, it is more and more evident that such a connection is quite diffuse all over the Earth. In this paper, we perform a spatial and temporal analysis of both geodetic and seismic—non-volcanic tremors, low-frequency events (LFEs), and regular earthquakes—time series. We focus on the relationship between the clustering of properties of the different kinds of seismicity and their response to stress perturbations. Earth tides and large earthquakes are used as a source of additional stress. Seismic activity hosted in the Cascadia subduction zone, Manawatu region in New Zealand, and Japan during the last two decades is considered. Our analysis suggests that tremors become more and more sensitive to Earth-tide perturbations as the fault interface is seismically locked. Therefore, tremors and regular events show a similar response to tidal stress perturbations. This feature is also accompanied by relatively lower spatial and temporal coefficients of variation. A series of recordings by several GNSS stations along the Hikurangi Trench, North Island, New Zealand, and along the Nankai coasts in Japan is taken into account for studying how large thrust-faulting earthquakes affect silent events and geodetic signals and vice versa. In the last section, a simple model for grasping a glimpse of the local stability condition of the Earth’s crust and for explaining previous observations is provided.
1 Introduction
Faults exhibit a wide range of behaviors encompassing large and destructive earthquakes, moderate seismic activity, microseismicity, slow slip events, and afterslip. The size and duration of each phase of the dynamic evolution of the fault system, like also their succession and mutual relationships, are partly controlled by its heterogeneity (Kopp, 2013; Sathiakumar and Barbot, 2021; Zaccagnino et al., 2022b). At coseismic time-scales, it is widely accepted that different slip modes are mostly controlled by the frictional stability, i.e., velocity-strengthening vs. velocity-weakening behaviors of rocks, and the effective normal stress controlled by the pore pressure on the fault (Liu and Rice, 2007), while the topological and structural properties of the fault systems drive the long-term evolution of seismic activity (Romanet et al., 2018). Understanding how different mechanical regimes are related to each other is an essential task for identifying transitions bringing to major widespread instability throughout the crustal volume, i.e., high sensitivity to stress perturbations which can trigger large seismic events. While large efforts have been devoted to gathering seismic precursors (Cicerone et al., 2009), i.e., detection of foreshocks, accelerated strain release, and recordings of electromagnetic and geochemical anomalies induced by fracturing processes, since the dawn of observational seismology, more recently it was pointed out that aseismic processes play an important role in stress release (Roeloffs, 2006; Hainzl et al., 2013). Slow slip events (SSEs) occur over long time intervals with respect to ordinary earthquakes (Beroza and Ide, 2011). They are caused by partial unlocking of fault interface due to frictional anisotropy, i.e., spatial variations of mechanical properties of rocks at the interface, or to its local roughness resulting in an accelerated slip front which propagates with minimal seismic waves radiation or without it (Segall et al., 2010). The existence of SSEs was hypothesized in Beroza and Jordan (1990) by the observation of anomalous free oscillations of the Earth. They were localized for the first time in Japan (Heki et al., 1997; Hirose et al., 1999) using GPS networks, and in a few years silent events have been recorded worldwide along almost all the subduction zones (Schwartz and Rokosky, 2007; Kobayashi and Tsuyuki, 2019; Plata-Martínez et al., 2021), so that it is now clear that they are a ubiquitous process which is just one of the possible manifestations of seismic dynamics. A large amount of evidence suggests a deep connection between complete and partial ruptures (i.e., events producing dislocation throughout the whole seismogenic source or within its small segments respectively) and silent events; however, it is not clear whether slow slips can act as a trigger for failure cascades or they simply release a part of stress stored at the interface so that, on the contrary, they suppress the probability of abrupt and devastating earthquakes. In favor of the first hypothesis, lots of large quakes were found to be triggered by localized or diffuse slow slip with or without foreshocks (e.g., Ruiz et al. (2014); Radiguet et al. (2016); Ozawa (2017); Uchida et al. (2020); Nishimura (2021)); the other way round (Wallace et al., 2017), there were also cases in which slow slip indisputably impedes extensive rupture (Rolandone et al., 2018) promoting afterslip.
However, the spatial and temporal organization of different modes of fault slip, i.e., LFEs, tremors, SSEs, and earthquakes, although rather broadly investigated and well known in its essential features, still remains evasive. The crux of the matter is that the dynamics of seismic phenomena is ultimately controlled by the heterogeneity of fault systems, gradients of rheological parameters, and by the state of stress accumulated over very long periods of time. In practice, the ignorance of the pre-existing stress conditions and the poor quality of the seismic catalogs, together with the heterogeneous properties of the brittle crust, makes it almost impossible to predict the evolution of the system (Geller et al., 1997). In this view, the attempt to include aseismic processes in the search for earthquake precursors is one of the themes that has been fascinating to the scientific community since their discovery. Unfortunately, the lack of radiative seismic patterns makes the high-resolution characterization of SSEs even more tricky than for earthquakes, even though their observation is becoming more and more effective thanks to the impressive advances of observational techniques, e.g., InSAR (Rouet-Leduc et al., 2021). A comprehensive analysis of large-scale properties of seismic and aseismic processes may allow new insights into how seismicity and silent slip act on each other, but it cannot provide valuable information on the state of instability of the crust. In the present work, we both consider regular earthquakes and silent events, in particular low-frequency earthquakes and non-volcanic tremors. LFEs represent a peculiar class of seismic events featured by smaller slip rate and longer duration than regular earthquakes of equivalent magnitude, while non-volcanic tremors are weak events diffuse along subduction zones connected with reduced friction at slipping faults associated with fluid circulation (Beroza and Ide, 2011). In this respect, it may be interesting to evaluate how stress perturbations act on the system as silent and seismic events head fault dynamics, so that unstable or critical states may be highlighted (Zaccagnino et al., 2022a). A widely used approach consists in perturbing a system placed in an energy state H0 and studying how it reacts to a small perturbation ɛH. If the system is in a mechanically stable state, it does not undergo significant changes, so that Hpert ≈ H0. On the contrary, it will outdistance from equilibrium and if the initial state is highly unstable, then the system quickly will move away from it. Applying this simple idea to seismicity, one can consider a small perturbation in fault stress and analyze how seismic activity is modified when a source of stress is added. Solid-Earth tides provide a well-known source of stress acting on a large spectrum of frequencies and amplitudes and their effect has been widely discussed in seismology and tectonics (Métivier et al., 2009; Tanaka, 2012; Ide and Tanaka, 2014; Varga and Grafarend, 2019; Zaccagnino et al., 2020; Varga and Fodor, 2021) also concerning silent events (Cochran et al., 2004; Hawthorne and Rubin, 2010; Yabe et al., 2015). Another widely used class of perturbations is the static stress variation produced by large earthquakes (Reasenberg and Simpson, 1992; King et al., 1994). This kind of information is routinely applied to assess the strength and the critical stress state on the fault (e.g., Harris, 1998; Toda et al., 2012; Nanjo, 2020). In the present paper, we jointly consider the response of faults to stress sources and the clustering properties of seismicity discovering a close relationship between them. Such features can be associated with a stress transfer process between fault patches at different stress levels and with variable memory persistence of past seismic events. Regarding the first relationship, we develop a toy model to explain why significant tidal ΔCFS is observed in critically loaded segments; while, concerning the latter one, memory loss with time is found to change for different kinds of seismic activity. This feature suggests that, even though the dynamics of response to perturbation is qualitatively the same, quantitative differences are expected in the spectrum of modes of fault slip.
2 Methods
2.1 Tidal stress calculation
Tidal stress is calculated following the procedure described in Zaccagnino et al. (2021). Starting from displacements induced by tidal potential W (r, θ, ϕ)
where g(r) is the gravitational constant as a function of depth (R − r), R is the radius of the Earth, h2(r) and l2(r) can be calculated by integrating with the fourth order Runge − Kutta method a system of six coupled ordinary differential equations starting from a set of suitable boundary conditions (Takeuchi and Saito, 1972). Strain is obtained by derivation, so that stress components are
where the Lame’s coefficients can be obtained starting from the speed of the seismic P and S waves as a function of depth (Dziewonski and Anderson, 1981).
ρ(r) is the density of internal Earth at depth R − r. The angle of dip and the angle of strike are measured via focal mechanisms in the case of large earthquakes, while the mean value of available dip and strike angles is associated with seismic events whose moment tensor is not known. The uncertainties of the dip and strike angles are obtained from the rule of mean values. Then, fault orientation is taken into account for getting shear σ, normal (σn), and confinement stress components (Varga and Grafarend, 1996). Given the strike α and the angle of dip δ, the tangential stress (Lambert et al., 2009) is given by
And the principal components are
Respectively the shear stress, the normal stress, and the confining stress. At last, the variation of Coulomb failure stress can be estimated as
where μ ∼ 0.4–0.8. The correlation between the magnitude of seismic events and tidal Coulomb failure stress acting on the fault is calculated over fixed time intervals Δt according to the following formula:
where Nt is the number of failures occurred from t and t + Δt. ΔCFS is got for each event that occurred within the selected region whose magnitude is above the completeness magnitude.
2.2 Clustering and correlation analysis
A practical tool for understanding how much time series show persistence and memory of their own past is to evaluate the scaling of the autocorrelation function associated with the series. The spatial autocorrelation function for the distance from the hypocenter ρ(n), is given by
where
Temporal and spatial clustering can be easily evaluated using, respectively, the global coefficient of variation CV defined by Kagan and Jackson (1991)
where ⟨T⟩ is the mean value of the inter-event time and σT is its standard deviation and by the normalized spatial coefficient of variation
where ⟨L⟩ is the average value of the Eulerian distance between successive events in the same region and Lmax is the maximum observed value. The physical meaning of the coefficient of variation is the following: if CV < 1, then the dynamics is regular; on the contrary, if CV > 1, the time series is clustered. The condition CV = 1 stands for a completely random, Poisson process (Telesca et al., 2016). A similar classification holds for the spatial coefficient, although in this case the value is normalized with respect to the size of the longest interaction in the system. Therefore, elevated values of the CVS coefficient stand for spatially clustered seismicity, while low ones mean that the epicenters of earthquakes tend to diffuse locally.
3 Results
In the next paragraphs, we investigate three different compressive regions: the Cascadia subduction zone, the Manawatu region in New Zealand, and the Japanese area, with particular attention to the Nankai Trough in Southwest Japan, where fault activity shows wide variability. Our analysis aims at understanding how fault stress variations affect slip dynamics and the statistical features of seismic activity. The correlation between seismicity, silent events, and Earth tides is investigated. Results are compared with the spatial and temporal properties of the different modes of slip featuring fault dynamics; in particular, how earthquakes, LFEs, and tectonic tremors occur along fault segments, how they react to remote and near stress changes and with respect to each other using the methods described above. While the analysis of the correlation between seismicity and tidal stress has been diffusely applied in the selected regions (Cochran et al., 2004; Tanaka, 2012; Ide et al., 2016), the response to tides has never been related to the clustering properties of seismic activity. Therefore, we focus on this relationship in the present paper. We also study how fault slip evolves over time along trenches as a function of the position along dips, along strikes, and depending on the distance from the epicenters of large earthquakes. We considered two large quakes: the Great Tohoku-Oki earthquake (11/3/2011, Mw 9.0) and the Kaikoura earthquake (13/11/2016, Mw 7.8), which were able to trigger SSEs and seismicity both locally and in distance (compare with the next section and figures therein). In order to achieve our goal, we take into account several GNSS stations along the dip direction in regions in which episodic tremor and slip (ETS) is periodically observed. Our results are also interpreted in the light of a toy-model which explains the significant correlation between tidal stress and seismic nucleation rates during the interseismic phase, while it is suggested to have a drop as the stress is released through aftershocks (compare with Section 3).
3.1 Fault stress perturbations and seismicity
The Cascadia subduction zone off the west coast of Northern California, Oregon, Washington, and British Columbia is the convergent tectonic boundary where the Juan de Fuca plate moves towards the North American plate. Episodic tremors and slip slowly dissipate tectonic stress usually over days or weeks producing displacements measured by GNSS stations being alternated with huge, blessedly rare megathrust events. Figure 1 shows tectonic tremors and earthquakes recorded in Cascadia between 2009 and 2021 (full catalog, no lower cut-off is introduced); each colored point represents a seismic event occurred while the fault underwent a tidal shear stress whose value can be estimated according to the color-bar. Tremors mainly take place in the region of Vancouver Island and around 41° N, in the southernmost segment of the subduction, where they are also more responsive to tidal stress (Figure 2) with respect to surrounding regions. A possible interpretation is that ETS works as a trigger of thrust-faulting seismicity and also controls crustal seismic activity through a zone featured by elevated internal stress conditions situated nearby locked continental faults. ETS is sensitive to seasonal and tidal stress perturbations (Wang et al., 2013) and also seismicity is weakly but positively correlated with them (Figure 2). In order to understand better this property and, above all, how it is distributed in time and space, we study how seismic response to Solid-Earth tidal modulations changes along the shallower section of the subduction zone. We identify some segments showing average values of ΔCFS for tremors significantly different from zero, denouncing the correlation between seismic activity and tidal stress perturbations. We call them “high-stress transfer zones” (henceforth, HST zones). In the case of the Cascadia subduction zone, we highlight four segments that show this property at least between 2009 and 2021: the Northernmost and Southernmost patches and two intermediate areas approximately located at 44.5° and 46° N. While the first couple is at the margins of the compressive plate boundary, the latter is featured by relatively low seismic and tremor rates (Figure 2A); they are also characterized by lower CV values and spatial coefficient of variation, showing a regular alternation of quiescence and tremor activity (Figures 3A–D). One-week-long time windows are used for the analysis, which is possible thanks to the large number of events provided by the PNSN catalog (∼ 500′000 events); however, a check is applied to guarantee that at least a few hundred events are included in each point estimation. Surrounding fault patches, on the other hand, are less responsive to tidal stress and tremors occur clustered in space and time with continuous stress release. Our interpretation is that, due to the local properties of the fault systems, HST segments are driven in an edge-of-instability state, so that they are featured by repeated small partial ruptures, whose slip dissipates stress provided by the surrounding areas. They are characterized by recurrent slip alternated with quiescence and, globally, weaker tremor activity and fault locking along dip than contiguous regions (Figures 1A, Figure 2B). The number of tremors shown in Figure 1 is positively correlated with the geodetically inferred locking state of the megathrust (Li et al., 2018; Lindsey et al., 2021); moreover, a roughly positive correlation is found between the values of the coefficients of variation and geodetic locking, while a qualitatively negative correlation is found between mean ΔCFS and long-term fault slip rates. The poor resolution of the along-strike variations of the locking state due to inadequate geodetic data, above all in the sea regions, prevents a detailed analysis of the relationships between seismicity and geodetic information. So, only considering data about regular earthquakes and tremors analyzed in this paper, HST zones appear to be almost continuously loaded by regions where non-volcanic tremors are routinely detected. Hence, they seem to be located in between areas featured by diffuse tremor activity, working as triggers of nearby widespread instability. This condition may be the reason why tremors in the semi-locked interfaces also show pronounced diffusive spreading along the strike, compared with Figure 2B. All this adds up to suggest that HST zones play a key role in stress dissipation along plate boundaries. We emphasize that understanding the response of partially locked areas to additional stress perturbations may be really useful for disclosing the state of stability of silent asperities and also providing evidence of where the nucleation of future large events may take place. Moreover, we find that seismic activity becomes more and more sensitive to perturbations as stress accumulates, so that seismicity tends to occur, on average, at the highest tidal stress values after periods featured by low silent slip and seismic activity, coherently with the results in Zaccagnino et al. (2022a). In this regard, we analyze the correlation between the variation of Coulomb failure stress induced by the action of Earth-tidal perturbations and the energy rate of seismic activity (ML ≥ 4.5) in Japan (latitude 35°–40° N and longitude 140°–145° E), which is found to increase before large earthquakes, in particular before the Giant Tohoku-Oki event, (11/03/2011, Mw 9.0). Our results are compatible with those by Tanaka (2012) (Figure 4). On the contrary, no clear correlation is found between LFEs and earthquake activity in southwest Japan (Nankai region, latitude 30°–35° N and longitude 130°–140° E, data from Idehara et al. (2014); Supino et al. (2020); Kurihara and Obara (2021)). The region where LFEs occur is hit by fewer regular earthquakes with respect to the northern territories (Figure 5D). Also, in this case, silent events show significant responsiveness to tidal stress (Figure 5A, Figure 6) which turns out to be negatively correlated with spatial and temporal coefficients of variation (Figures 5B,C). Our analysis reaches the same conclusion already discussed for the Cascadia subduction zone.
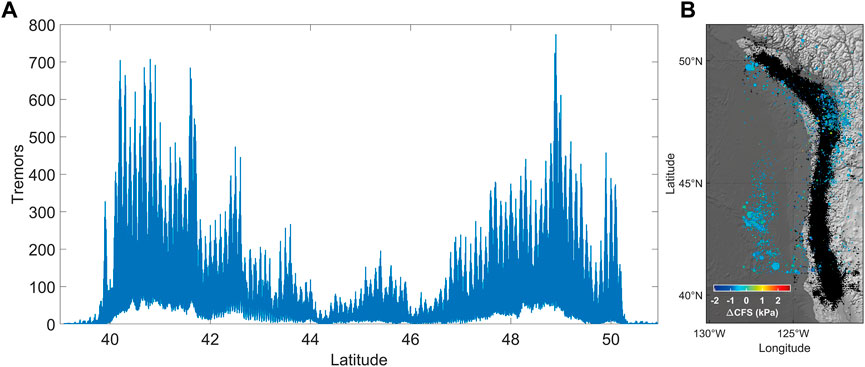
FIGURE 1. (A) Continuous distribution of tectonic tremors along the Cascadia subduction zone as a function of latitude. (B) Distribution of tectonic tremors, black points along the strike of the Cascadia subduction zone (data from the PNSN Catalog, 2009 − 2021, respectively available at http://pnsn.org).
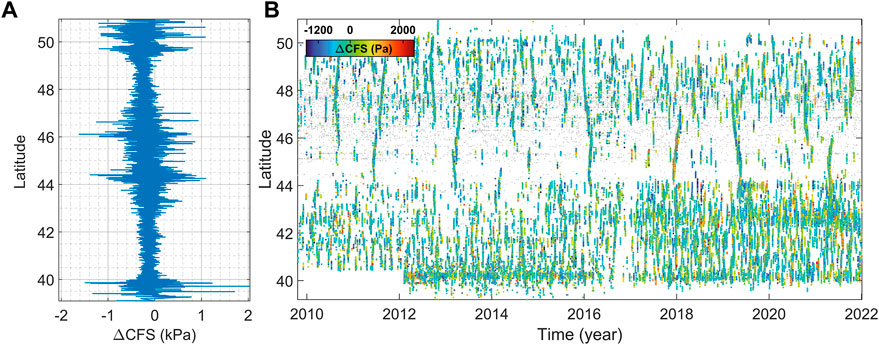
FIGURE 2. Seismicity and stress produced by Earth tides along the Cascadia subduction zone. (A) Temporal average ΔCFS for the occurrence of tremors between 2009 and 2021 as a function of latitude (data from PNSN and EPS Catalogs, 2009 − 2021, respectively available at http://pnsn.org). (B) Temporal evolution of tremors (points are colored according to the value of ΔCFS). We highlight four fault segments that show mean tidal stress values significantly different from zero for the occurrence of tremors: the Northernmost and Southernmost patches of the subduction zone and two intermediate areas approximately located at 44.5° and 46° N.
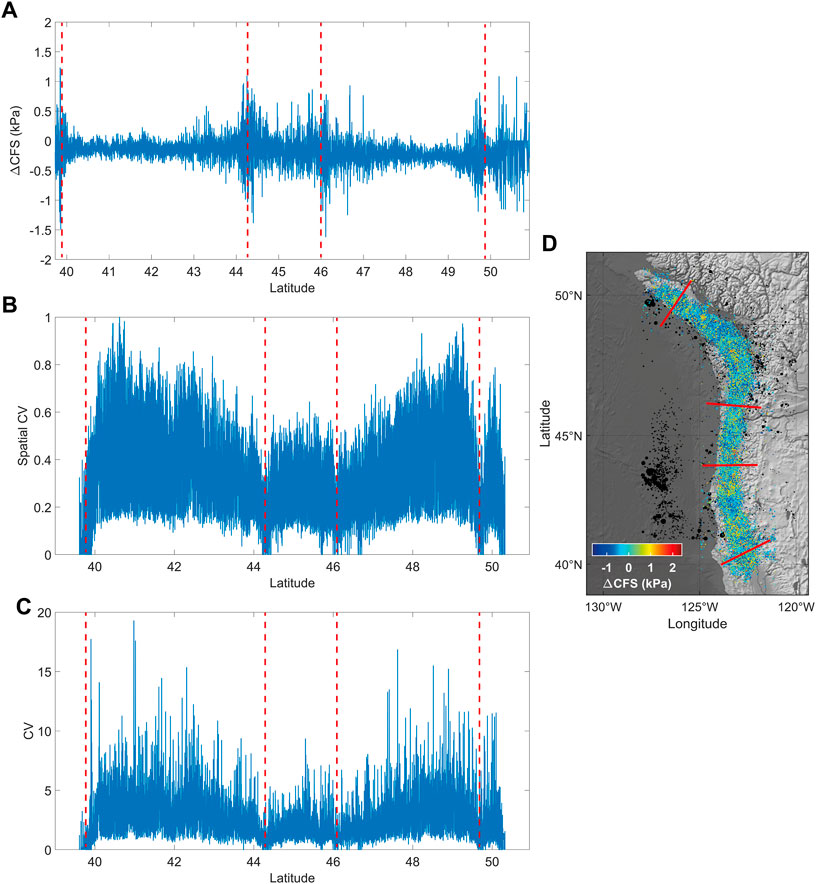
FIGURE 3. (A) ΔCFS for tremors along the Cascadia subduction zone as a function of epicentral latitude. We highlight four fault segments that show elevated mean tidal stress values for the occurrence of tremors: the Northernmost and Southernmost patches of the subduction zone and two intermediate areas approximately located at 44.5° and 46° N (red lines in the map and dashed red lines in panels a, b and c). (B) Spatial coefficient of variation for tremors along the ETS zone. Two minima are observed in correspondence with the maxima of the average ΔCFS plotted in (A). (C) Coefficient of variation of tremor time series between 2009 and 2021 as a function of latitude (data from PNSN and EPS Catalogs, 2009 − 2021, respectively available at http://pnsn.org). Two minima are observed in correspondence with the maxima of the average ΔCFS plotted in (A) and the minima points of the spatial coefficient of variation. (D) Map of tremors along the Cascadia ETS zone. Black points represent regular earthquakes, their size is proportional to the magnitude.
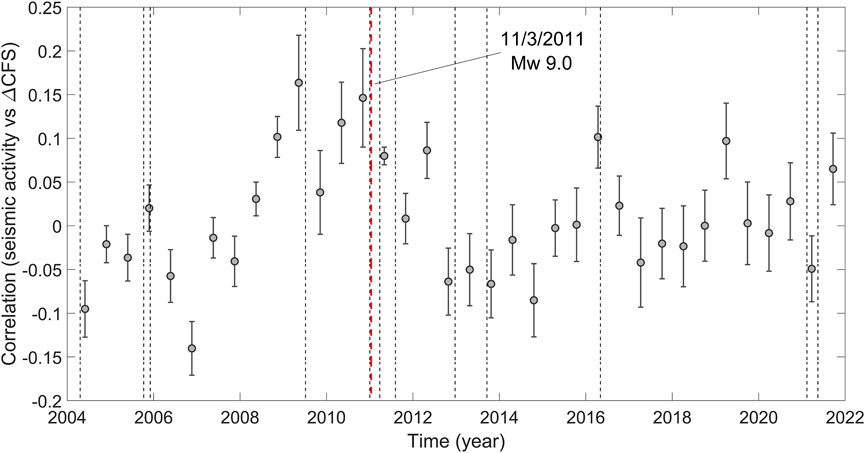
FIGURE 4. Correlation between ΔCFS and seismicity in Southern Japan, between 2004 and 2021. The scatter plot is realized by taking into account earthquakes that happened at latitude 35°–40°N, longitude 140°–145°E, and -2–50 km deep, ML ≥ 4.5, USGS Catalog. A preseismic phase featured by an increase of the correlation, although weak, is detected before the Tohoku-Oki seismic sequence, mainshock 11/3/2011, Mw 9.0. The dashed lines represent earthquakes with Mw ≥ 7.0.
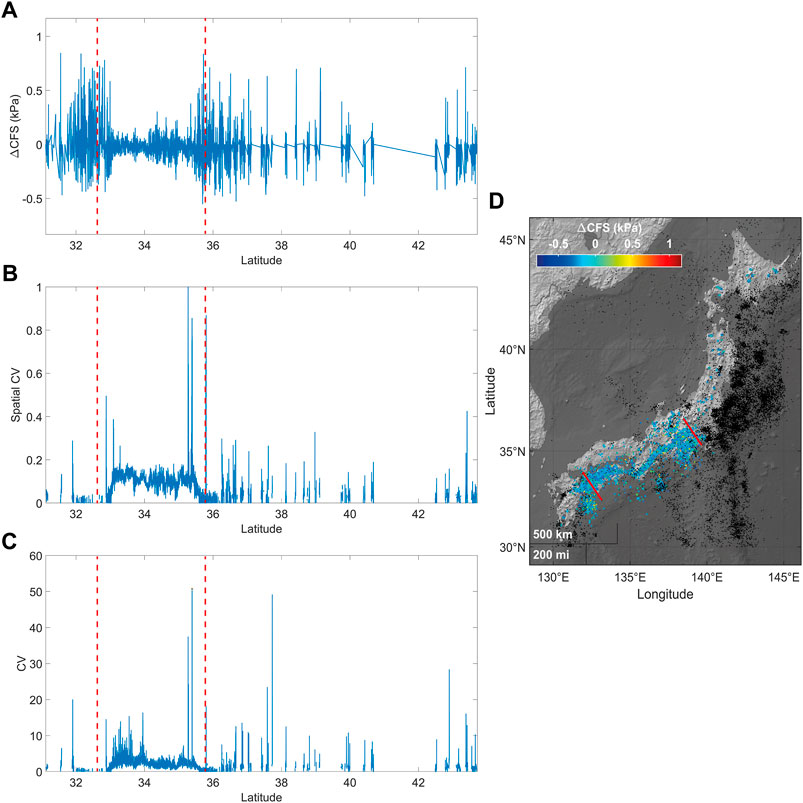
FIGURE 5. (A) ΔCFS for tremors along the Nankai Trough as a function of epicentral latitude. We highlight two segments hosting tremors with significant responsiveness to tides approximately located at 33° and 36° N (red lines in the map and dashed red lines in panels a, b, and c). (B) Spatial coefficient of variation for tremors along the ETS zone. (C) Coefficient of variation of tremor time series between 2005 and 2018 as a function of latitude [data from Idehara et al. (2014); Supino et al. (2020)]. Two minima are observed in correspondence with the maxima of the average ΔCFS plotted in (A) and the minima points of the spatial coefficient of variation. (D) Map of tremors in Nankai and LFEs in 52 volcanic areas in Japan. Kurihara and Obara (2021). Black points represent regular earthquakes (USGS catalog, 2005–2021, ML ≥ 4.0), and their size is proportional to the magnitude.
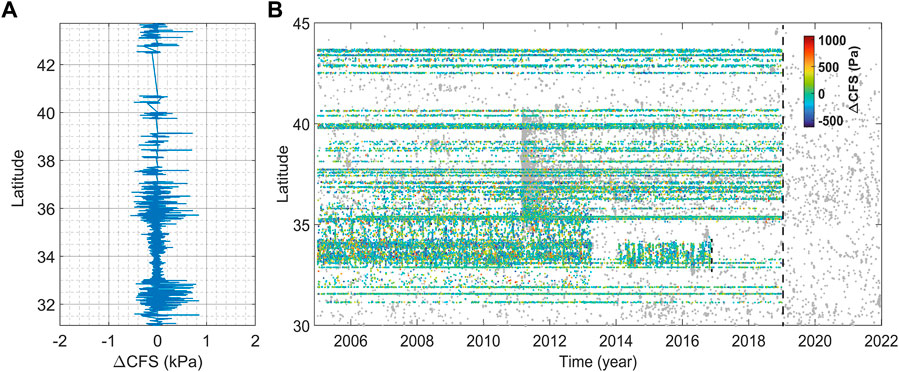
FIGURE 6. Seismicity and stress produced by solid-Earth tides in Japan. (A) Temporal average ΔCFS for the occurrence of LFEs between 2005 and 2021 as a function of latitude [data from Idehara et al. (2014); Supino et al. (2020)]. (B) Temporal evolution of LFEs (points are colored according to the value of ΔCFS).
3.2 Stress transfer from remote subduction zone segments
We also consider the impact of sizeable stress perturbations on the stability of fault patches located at variable distances. Large earthquakes affect slip modes of remote fault systems and vice versa. We performed a spatial and temporal analysis of seismicity in two regions: the Hikurangi subduction zone, New Zealand that is well-equipped with seven GNSS stations located along its dip direction (Figure 7) and the Nankai Through, Southern Japan where five GNSS stations are located along its strike. In both areas, silent slip frequently occurs (Figure 8). In Figure 9 residual GNSS time series and their spectrograms show the effects of the Kaikoura earthquake, 13/11/2016, Mw 7.8, that hit the southernmost segment of the Malborough Trench in between South Island and Nord Island. GNSS stations are placed 400–500 km north of the epicenter, in Manawatu, a region of North Island where silent events have been detected, e.g., Wallace et al. (2012). In particular, HAST and KERE GNSS stations, located near the east coast a few dozen kilometers from the trench, do not show a significant displacement due to the Kaikoura earthquake, while traces of SSEs occurred offshore are clearly visible. BSHT, VGMO, and VGMT besides the Manawatu ETS zone recorded a gap and bursts likely caused by a series of accelerated slips triggered by the 2016 earthquake. Like in the previous stations, the GNSS time series of VGPK contains silent slip events before and after the Kaikoura event; however, the last part of the recording is featured by afterslip: it is not surprising since VGPK is located beyond the Matuyama ETS region, where the subduction zone undergoes creep dissipating stress, as it is proven by the fact that earthquakes do not occur massively at this level of the subduction interface, e.g., compare with McCaffrey et al. (2008). Afterslip dominates the spectrum of NYPT, which is located near the West coast of North Island, after November 2016, while SSEs are completely missing because the underlying subduction interface is mainly unlocked. Figure 10 shows the detail concerning geodetic residual displacement, spectrogram, and silent slips of the GNSS station VGMT, which is got in position downline of the Manawatu ETS zone. In the Nankai region, afterslip effects produced by the Giant Tohoku-Oki event suppress locally accelerated slips in the northern considered area, while to the south they are still observed, Figure 11. In fact, the GNSS time series of USUD is dominated by afterslip as a consequence of the Tohoku-Oki Earthquake (11/03/2011, Mw 9.0). Further south, the displacements of G116, G117, and SMST are all strongly affected by the aforementioned seismic events, but also triggered slips are observed which are compatible with SSEs, while G120 shows iterated silent slip occurrences and is marginally affected by afterslip.
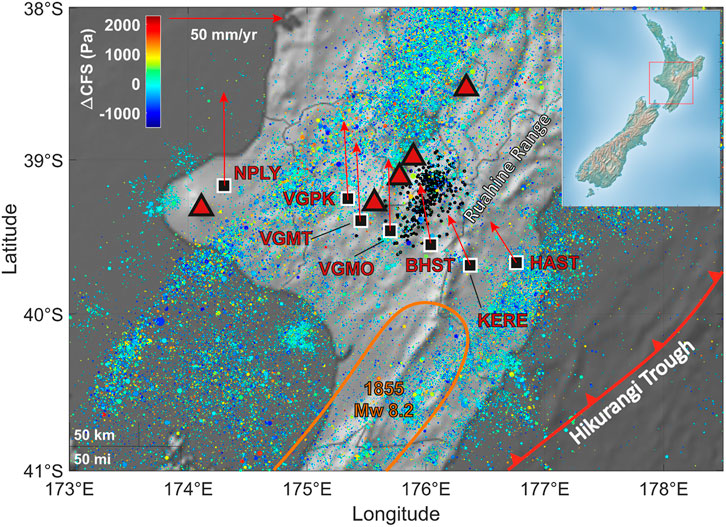
FIGURE 7. Map of seismicity in Manawatu, North Island, New Zealand, GNS Science earthquake catalog at https://quakesearch.geonet.org.nz (last accessed July 2022), 2000–2021, ML ≥ 2.5. Each earthquake is represented as a point whose color depends on the value of the ΔCFS at which it occurred, according to the color bar. Black points are tremors. Seven GNSS stations located along the dip with respect to the Hikurangi subduction zone are plotted on the map with the local vector velocity (red arrows) provided by NGL [MIDAS components, Blewitt et al. (2018)]. Red triangles represent volcanoes, while orange contours qualitatively highlight fault patches broken by large earthquakes.
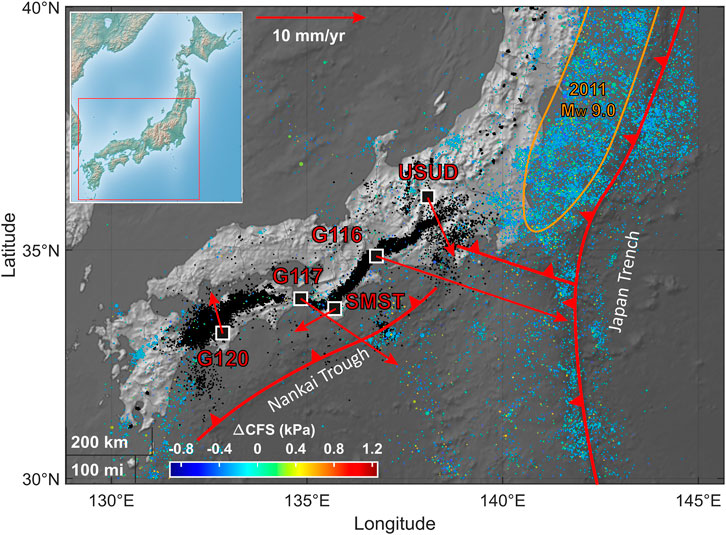
FIGURE 8. Map of seismicity in Southern Japan, USGS Catalog, 2005 − 2021, ML ≥ 4.0. Each earthquake is represented as a point whose color depends on the value of the ΔCFS at which it occurred, according to the color bar. Black points are LFEs [Idehara et al. (2014); Supino et al. (2020); Kurihara and Obara (2021)]. Five GNSS stations located along the strike with respect to the Nankai subduction zone are plotted on the map with the local vector velocity (red arrows) provided by NGL [MIDAS components, Blewitt et al. (2018)]. Orange contours qualitatively highlight fault patches broken by large earthquakes. Modified from Zaccagnino and Doglioni (2022).
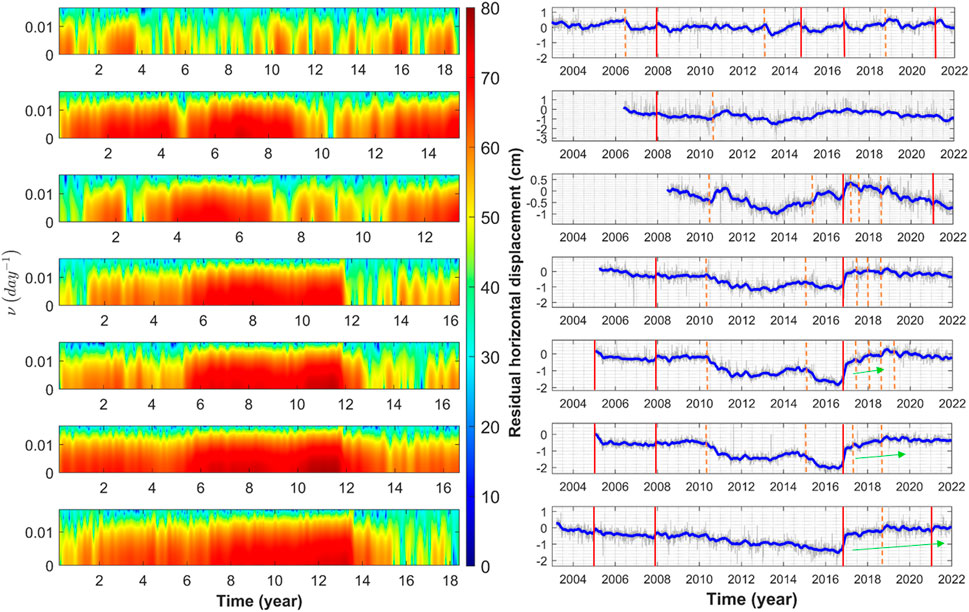
FIGURE 9. Spectrograms and residual horizontal geodetic time series of seven GNSS stations in Manawatu. From top to bottom: HAST, KERE, BSHT, VGMO, VGMT, VGPK, and NYPT. SSEs are observed, moreover, the spectral amplitudes are noticed to increase before the Kaikoura Earthquake (13/11/2016, Mw 7.8) downline of the Manawatu ETS zone in the recordings of NYPT, VGPK, and VGMT. The red lines stand for large earthquakes which caused a measurable displacement of the GNSS stations, while the orange dashed lines represent slow slip events. The green arrows highlight afterslip. Modified from Zaccagnino and Doglioni (2022).
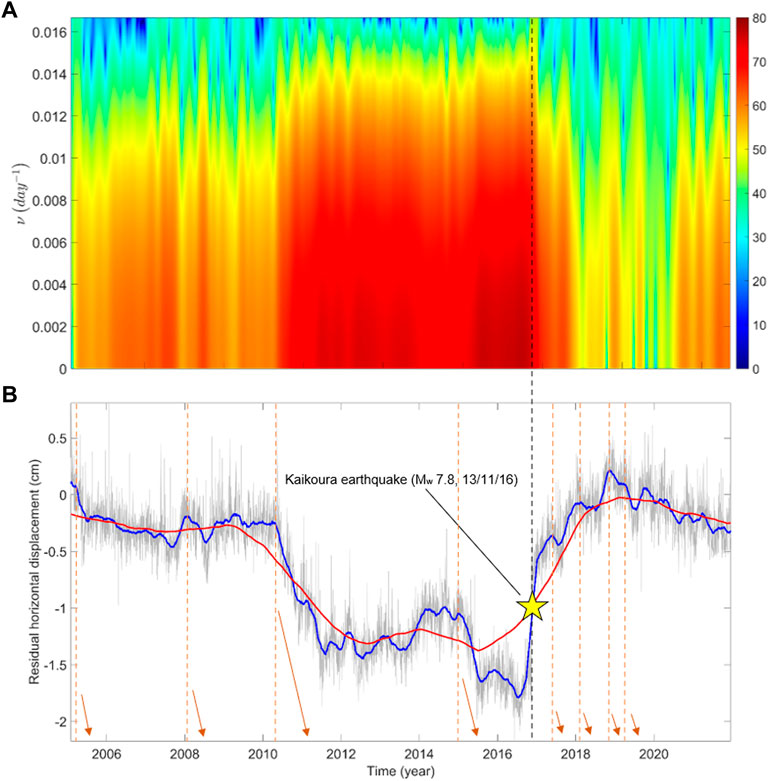
FIGURE 10. (A) Spectrogram of GNSS time series of VGMT. Large low frequencies have been recorded from 2011, after a one-year-long slow slip, to 2016, when the Kaikoura event occurred. VGMT is 424.3 km far from the epicenter of Mw 7.8, 13/11/2016 earthquake (NLG). (B) Residual horizontal displacement of VGMT, showing both the movements due to SSEs occurred in the Manawatu region in 2005, 2008, 2010, 2011, 2012, 2013, 2015, and 2019, whose starting timing is marked by orange vertical dashed lines, and the effect of the slip propagated remotely from the Kaikoura region, where the large earthquake hit in November 2016.
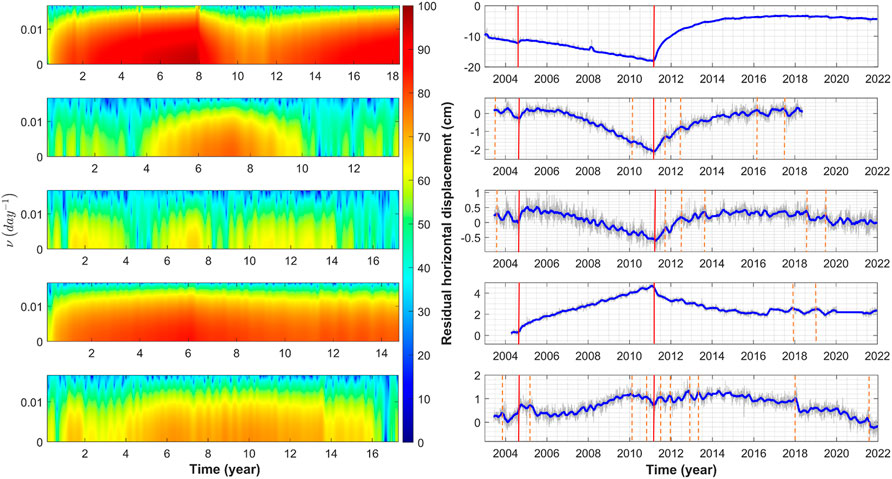
FIGURE 11. Spectrograms and detrended horizontal geodetic time series of five GNSS stations in the Nankai region. From top to bottom: USUD, G116, G117, SMST, and G120. SSEs are observed (2004, 2010, and 2019); moreover, the spectral amplitudes are noticed to increase before the Giant Tohoku-Oki Earthquake (11/03/2011, Mw 9.0) in the recordings of stations to the north and nearer to the trench with respect to others. The red lines stand for large earthquakes which caused a measurable displacement of the GNSS stations, while the orange dashed lines represent slow slip events. The gaps produced by the Tohoku-Oki earthquake are removed for improving readability.
3.3 Triggering power and clustering properties
Earthquakes occur in spatial and temporal clusters. While temporal clustering is described by Omori’s power-law (Utsu and Ogata, 1995), spatial clustering is driven by stress diffusion (Huc and Main, 2003). Our results described in the previous paragraph suggest that a relationship exists between the spatial and temporal properties of clustering and responsiveness to additional stress. Figure 12 shows the decrease of memory in spatial and magnitude aftershocks series following the Tohoku-Oki megathrust earthquake (orange), background seismicity (green), and LFEs (blue) in the Nankai region. Data show that for large-magnitude events the spatial autocorrelation (compare with the definition) is power-law decaying
where α ≈ 0.1–0.5 for background seismicity and aftershocks respectively. If the correlation is calculated within the epicentral region; the exponent is higher after intermediate or large-magnitude reference events. It means that the spatial correlation is elevated above all after megaquakes, while it is more rapidly suppressed after smaller ones. Memory effects of background seismic activity are also characterized by spreading dispersion due to local memory effects. This phenomenon is common both to small events and intense aftershocks, even though in the latter case it appears belatedly. α ∼ 10–2 − 10–1 for slow events, which marks their tendency to occur in spatial clusters with extremely enduring memory. However, spatial autocorrelation for LFEs time series is also featured by a clear violation of the power-law trend as time goes on. This effect depends on the spatial migration of silent events. Similar features are also found concerning magnitude time series: LFEs show limited variability in energy distribution within the same cluster. Then, even though their size is still power-law distributed as a whole (Wech et al., 2010), locally they are characterized by typical patterns of magnitude and localization likely constrained by the rheological properties of the fault interface. Therefore, clustering effects and pure stress transfer occur at the same time. However, the first is certainly dominant in regions shaken by microseismicity and slow slip events, while the second prevails where seismic sequences take place. Energy correlations are also power-law distributed: also in this regard, LFEs show the slowest decay rate (α ∼ 10–2), aftershocks follow a power law attenuation in memory with an exponent which is smaller than for low magnitude seismicity.
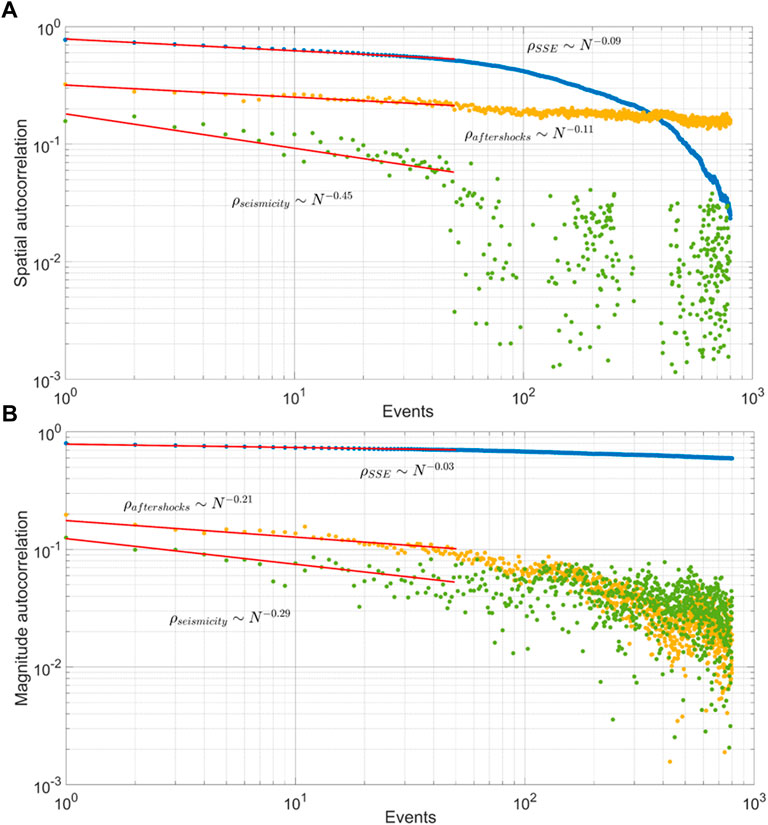
FIGURE 12. Power law memory loss of distance from the first epicenter (A) and magnitude (B) time series is observed after major seismic events, while a faster decrease occurs after moderate magnitude ones. In this figure the aftershocks of the Tohoku-Oki megathrust earthquake are considered (orange points) and background seismicity in the Nankai region also (green points). Ultra-slow decay is a peculiar feature of LFEs, which is characterized by strong spatial localization and diffusive behavior along strike (blue points). The spatial autocorrelation for LFEs time series is also featured by a clear violation of the power-law trend as time goes on. This effect depends on the spatial migration of silent events.
4 Discussion
Earthquakes occur because of stress accumulation in the Earth’s crust. Stress arises from the progressive deformation of rocks on a large spatial scale, which is ultimately too large to be sustained causing fault slip. Elevated stress values result in a wide range of possible dynamic evolution along weak interfaces. Depending on local physical properties, faults show different levels of locking. Significant interseismic coupling is usually observed in spatial heterogeneous patches surrounded by partially unlocked creeping surfaces. High temperature and pore-pressure values as well as the abundance of rocks with low friction coefficients promote aseismic creep. On the other hand, fast strain changes and low normal stress encourage faulting. Nowadays, space geodesy and remote sensing allow accurate monitoring of fault zones. Thanks to the large amounts of information provided by recording, the partitioning of stress dissipation over a long-term time scale can be inferred. The interseismic coupling χ is a key property for facing this issue; it is defined as the ratio between the deficit of slip in the interseismic period and the long-term slip u according to the following definition (Avouac, 2015)
where us represents the coseismic cumulative displacement and ua is the cumulative aseismic displacement that occurred during transients such as slow slip events and afterslip. By definition, 0 ≤ χ ≤ 1. When χ ∼ 1, almost all the displacement occurs as a consequence of faulting, on the contrary, if χ ∼ 0, then aseismic creep dominates stress dissipation. As time goes on, a deficit of seismic moment mounts at a rate
where T is the Green’s stress interaction function, a four-index tensor, mapping displacements into stress changes, the slip rate v(x) at x, which reads
where f (σn, t) is a general function describing stress dissipation, which can be written as the sum of three different contributions coming respectively from interseismic creep (1 − χ), coseismic stress drop at time t = tfailure and transient slip occurring whenever stress rate overcomes a minimum value Γ, i.e., the critical stress rate. μ represents the shear modulus. Considering this all together, an explicit formula for slip rate reads
where k1 and k2 are suitable amplitude coefficients, δ(t − t0) is the delta function and θ(t − t0) is the step or Heaviside function. We notice that during the interseismic phase the second coefficient of f is zero; moreover, the third coefficient is negligible in creeping zones and the first and the third constituents are both zero in completely locked areas. We can now introduce our stress source: the natural stress candidate is the variation of Coulomb failure stress produced by tides (Rinaldi et al., 2020)
where
where μT and μL are supposed to be spatially homogeneous respectively within the interfaces of the HST and locked zones and respectively during the whole seismic cycle for the sake of simplicity. δΔCFS(x,t)
Therefore, unlocked patches actively contribute to asperity overload via stress transfer during the interseismic phase. Moreover, locked segments feel the effect of perturbations more than low-coupling ones, which is coherent with our results. On the contrary, δΔCFS(x,t)
It implies that in the meanwhile and after stress is released by an earthquake, the failure volume induces instability in the surrounding unlocked areas, as expected. Hence, this model is coherent with the observations discussed in the previous paragraphs. Therefore, we suggest that the response to stress perturbations of seismicity occurring in regions in between creeping and locked areas can be useful to mark unstable fault segments by studying the spatial distribution of responsiveness to additional stress.
5 Conclusion
In the present article, we investigate the dynamics of seismicity in the Cascadia subduction zone, the Manawatu region in New Zealand, and the Nankai Trough in Southwest Japan, where a wide range of slip modes happen. The correlation between seismic activity, silent events, and Earth tides is analyzed. We find that seismic activity becomes more and more sensitive to perturbations as stress accumulates, so that earthquakes tend to occur, on average, at more elevated tidal stress after periods featured by low silent slip and seismic activity. We identify partially locked interfaces that show permanently elevated values of correlation between seismic activity and stress perturbations. We also study how fault slip evolves over time along the trench as a function of the position along the dip and along the strike and distance from the epicenter of the earthquake. We consider two large events in particular: the Tohoku-Oki earthquake (11/3/2011, Mw 9.0) and the Kaikoura earthquake (13/11/2016, Mw 7.8), which were able to trigger silent events and seismicity both locally and in distance. In order to achieve our goal, we take into account of several GNSS stations along the dip direction of the subductions in regions in which SSEs are periodically observed. Our results are also interpreted in the light of a toy-model which explains spatial patterns in the correlation between tidal stress and seismic nucleation rates during the interseismic phase, while it is suggested to have a drop as the stress is released through aftershocks. Our case studies show that rheology controls how strain is reached as a consequence of a remote stress source: subductions are almost locked near the trench, accelerated silent slip activity is recorded in intermediate territories, while afterslip dominates at farther distances. SSEs appear to be remotely triggered by major seismic events only at intermediate distances from the through, where partial locking is observed, while their occurrence does not appear to change in segments featured by highly brittle behavior or clearly visco-plastic regimes. Different scaling properties of clustering and magnitudes are highlighted for slow and fast earthquakes: tremors and LFEs are more clustered and keep the memory of the magnitude of past occurrences for a long time; on the other hand, fast earthquakes show power law decays of memory after the largest ones, while an exponential suppression is observed after moderate ones. This implies that earthquakes are likely to be triggered at the edge of episodic tremor and slip (ETS) regions and not far away from them, on the contrary, SSEs can be triggered remotely, which is coherent with current literature, (e.g., Fry et al., 2011). Moreover, energy nucleation rates become more and more correlated with tidal stress before major failures, with outputs compatible with previous results, e.g., Tanaka (2012). At last, the responsiveness of seismicity to additional stress sources is negatively related to the temporal and spatial variation coefficients, so that the highest sensitivity to tidal stress modulations is observed in partially locked fault regions regularly alternating stable phases to diffuse seismic activity.
Data availability statement
Publicly available datasets were analyzed in this study. This data can be found here: https://pnsn.org/tremor (last access 6/2022), https://pnsn.org/events?custom_search=true (last access 6/2022), https://zenodo.org/record/5348597#.YshQaoRBy3A (last access 6/2022), http://www-solid.eps.s.u-tokyo.ac.jp/∼idehara/wtd0/Welcome.html (last access 6/2022), http://geodesy.unr.edu/NGLStationPages/GlobalStationList (last access 6/2022).
Author contributions
Conceptualization, DZ and CD; Methodology, DZ and LT; Data analysis, DZ; Writing—original draft preparation, writing—review and editing, CD, LT, and DZ; Supervision, CD and LT. All authors have read and agreed to the published version of the manuscript.
Funding
This research was funded by INGV. The authors declare no conflict of interest. The funders had no role in the design of the study; in the collection, analyses, or interpretation of data; in the writing of the manuscript, or in the decision to publish the results.
Acknowledgments
The authors are indebted to P. Romanet for his priceless comments and suggestions.
Conflict of interest
The authors declare that the research was conducted in the absence of any commercial or financial relationships that could be construed as a potential conflict of interest.
Publisher’s note
All claims expressed in this article are solely those of the authors and do not necessarily represent those of their affiliated organizations, or those of the publisher, the editors and the reviewers. Any product that may be evaluated in this article, or claim that may be made by its manufacturer, is not guaranteed or endorsed by the publisher.
Abbreviations
CFS, Coulomb failure stress; ETS, episodic tremor and slip; GNSS, global navigation satellite system; HST, high-stress transfer (zone); LFE, low-frequency earthquake; SSE, slow-slip event.
References
Avouac, J.-P. (2015). From geodetic imaging of seismic and aseismic fault slip to dynamic modeling of the seismic cycle. Annu. Rev. Earth Planet. Sci. 43, 233–271. doi:10.1146/annurev-earth-060614-105302
Beroza, G. C., and Ide, S. (2011). Slow earthquakes and nonvolcanic tremor. Annu. Rev. Earth Planet. Sci. 39, 271–296. doi:10.1146/annurev-earth-040809-152531
Beroza, G. C., and Jordan, T. H. (1990). Searching for slow and silent earthquakes using free oscillations. J. Geophys. Res. 95, 2485–2510. doi:10.1029/jb095ib03p02485
Blewitt, G., Hammond, W. C., and Kreemer, C. (2018). Harnessing the gps data explosion for interdisciplinary science. Eos 99, 485. doi:10.1029/2018eo104623
Cicerone, R. D., Ebel, J. E., and Britton, J. (2009). A systematic compilation of earthquake precursors. Tectonophysics 476, 371–396. doi:10.1016/j.tecto.2009.06.008
Cochran, E. S., Vidale, J. E., and Tanaka, S. (2004). Earth tides can trigger shallow thrust fault earthquakes. Science 306, 1164–1166. doi:10.1126/science.1103961
Dziewonski, A. M., and Anderson, D. L. (1981). Preliminary reference Earth model. Phys. earth Planet. interiors 25, 297–356. doi:10.1016/0031-9201(81)90046-7
Fry, B., Chao, K., Bannister, S., Peng, Z., and Wallace, L. (2011). Deep tremor in New Zealand triggered by the 2010 mw8. 8 Chile earthquake. Geophys. Res. Lett. 38. doi:10.1029/2011gl048319
Geller, R. J., Jackson, D. D., Kagan, Y. Y., and Mulargia, F. (1997). Earthquakes cannot be predicted. Science 275, 1616. doi:10.1126/science.275.5306.1616
Hainzl, S., Zakharova, O., and Marsan, D. (2013). Impact of aseismic transients on the estimation of aftershock productivity parameters. Bull. Seismol. Soc. Am. 103, 1723–1732. doi:10.1785/0120120247
Harris, R. A. (1998). Introduction to special section: Stress triggers, stress shadows, and implications for seismic hazard.
Hawthorne, J. C., and Rubin, A. M. (2010). Tidal modulation of slow slip in cascadia. J. Geophys. Res. 115, B09406. doi:10.1029/2010jb007502
Heki, K., Miyazaki, S., and Tsuji, H. (1997). Silent fault slip following an interplate thrust earthquake at the Japan trench. Nature 386, 595–598. doi:10.1038/386595a0
Hirose, H., Hirahara, K., Kimata, F., Fujii, N., and Miyazaki, S. (1999). A slow thrust slip event following the two 1996 hyuganada earthquakes beneath the bungo channel, southwest Japan. Geophys. Res. Lett. 26, 3237–3240. doi:10.1029/1999gl010999
Huc, M., and Main, I. G. (2003). Anomalous stress diffusion in earthquake triggering: Correlation length, time dependence, and directionality. J. Geophys. Res. 108. doi:10.1029/2001jb001645
Ide, S., and Tanaka, Y. (2014). Controls on plate motion by oscillating tidal stress: Evidence from deep tremors in Western Japan. Geophys. Res. Lett. 41, 3842–3850. doi:10.1002/2014gl060035
Ide, S., Yabe, S., and Tanaka, Y. (2016). Earthquake potential revealed by tidal influence on earthquake size–frequency statistics. Nat. Geosci. 9, 834–837. doi:10.1038/ngeo2796
Idehara, K., Yabe, S., and Ide, S. (2014). Regional and global variations in the temporal clustering of tectonic tremor activity. Earth Planet. Sp. 66, 66–10. doi:10.1186/1880-5981-66-66
Kagan, Y. Y., and Jackson, D. D. (1991). Long-term earthquake clustering. Geophys. J. Int. 104, 117–134. doi:10.1111/j.1365-246x.1991.tb02498.x
King, G. C., Stein, R. S., and Lin, J. (1994). Static stress changes and the triggering of earthquakes. Bull. Seismol. Soc. Am. 84, 935–953.
Kobayashi, A., and Tsuyuki, T. (2019). Long-term slow slip event detected beneath the shima peninsula, central Japan, from gnss data. Earth Planets Space 71, 60–67. doi:10.1186/s40623-019-1037-3
Kopp, H. (2013). Invited review paper: The control of subduction zone structural complexity and geometry on margin segmentation and seismicity. Tectonophysics 589, 1–16. doi:10.1016/j.tecto.2012.12.037
Kurihara, R., and Obara, K. (2021). Spatiotemporal characteristics of relocated deep low-frequency earthquakes beneath 52 volcanic regions in Japan over an analysis period of 14 years and 9 months. JGR. Solid Earth 126, e2021JB022173. doi:10.1029/2021jb022173
Lambert, A., Kao, H., Rogers, G., and Courtier, N. (2009). Correlation of tremor activity with tidal stress in the northern cascadia subduction zone. J. Geophys. Res. 114, B00A08. doi:10.1029/2008jb006038
Li, S., Wang, K., Wang, Y., Jiang, Y., and Dosso, S. E. (2018). Geodetically inferred locking state of the cascadia megathrust based on a viscoelastic Earth model. J. Geophys. Res. Solid Earth 123, 8056–8072. doi:10.1029/2018jb015620
Lindsey, E. O., Mallick, R., Hubbard, J. A., Bradley, K. E., Almeida, R. V., Moore, J. D., et al. (2021). Slip rate deficit and earthquake potential on shallow megathrusts. Nat. Geosci. 14, 321–326. doi:10.1038/s41561-021-00736-x
Liu, Y., and Rice, J. R. (2007). Spontaneous and triggered aseismic deformation transients in a subduction fault model. J. Geophys. Res. 112, B09404. doi:10.1029/2007jb004930
McCaffrey, R., Wallace, L. M., and Beavan, J. (2008). Slow slip and frictional transition at low temperature at the hikurangi subduction zone. Nat. Geosci. 1, 316–320. doi:10.1038/ngeo178
Métivier, L., de Viron, O., Conrad, C. P., Renault, S., Diament, M., and Patau, G. (2009). Evidence of earthquake triggering by the solid Earth tides. Earth Planet. Sci. Lett. 278, 370–375. doi:10.1016/j.epsl.2008.12.024
Nanjo, K. (2020). Were changes in stress state responsible for the 2019 ridgecrest, California, earthquakes? Nat. Commun. 11, 3082. doi:10.1038/s41467-020-16867-5
Nishimura, T. (2021). Slow slip events in the kanto and tokai regions of central Japan detected using global navigation satellite system data during 1994–2020. Geochem. Geophys. Geosyst. 22, e2020GC009329. doi:10.1029/2020gc009329
Ozawa, S. (2017). Long-term slow slip events along the nankai trough subduction zone after the 2011 tohoku earthquake in Japan. Earth Planets Space 69, 56–13. doi:10.1186/s40623-017-0640-4
Plata-Martínez, R., Ide, S., Shinohara, M., Garcia, E., Mizuno, N., Dominguez, L., et al. (2021). Shallow slow earthquakes to decipher future catastrophic earthquakes in the guerrero seismic gap. Nat. Commun. 12, 3976–3978. doi:10.1038/s41467-021-24210-9
Radiguet, M., Perfettini, H., Cotte, N., Gualandi, A., Valette, B., Kostoglodov, V., et al. (2016). Triggering of the 2014 mw7.3 papanoa earthquake by a slow slip event in guerrero, Mexico. Nat. Geosci. 9, 829–833. doi:10.1038/ngeo2817
Reasenberg, P. A., and Simpson, R. W. (1992). Response of regional seismicity to the static stress change produced by the loma prieta earthquake. Science 255, 1687–1690. doi:10.1126/science.255.5052.1687
Rinaldi, A. P., Improta, L., Hainzl, S., Catalli, F., Urpi, L., and Wiemer, S. (2020). Combined approach of poroelastic and earthquake nucleation applied to the reservoir-induced seismic activity in the val d’agri area, Italy. J. Rock Mech. Geotechnical Eng. 12, 802–810. doi:10.1016/j.jrmge.2020.04.003
Roeloffs, E. A. (2006). Evidence for aseismic deformation rate changes prior to earthquakes. Annu. Rev. Earth Planet. Sci. 34, 591–627. doi:10.1146/annurev.earth.34.031405.124947
Rolandone, F., Nocquet, J.-M., Mothes, P. A., Jarrin, P., Vallée, M., Cubas, N., et al. (2018). Areas prone to slow slip events impede earthquake rupture propagation and promote afterslip. Sci. Adv. 4, eaao6596. doi:10.1126/sciadv.aao6596
Romanet, P., Bhat, H. S., Jolivet, R., and Madariaga, R. (2018). Fast and slow slip events emerge due to fault geometrical complexity. Geophys. Res. Lett. 45, 4809–4819. doi:10.1029/2018gl077579
Romanet, P., and Ide, S. (2019). Ambient tectonic tremors in manawatu, cape turnagain, marlborough, and puysegur, New Zealand. Earth Planets Space 71, 59–9. doi:10.1186/s40623-019-1039-1
Rouet-Leduc, B., Jolivet, R., Dalaison, M., Johnson, P. A., and Hulbert, C. (2021). Autonomous extraction of millimeter-scale deformation in insar time series using deep learning. Nat. Commun. 12, 1–11. doi:10.1038/s41467-021-26254-3
Rubinstein, J. L., La Rocca, M., Vidale, J. E., Creager, K. C., and Wech, A. G. (2008). Tidal modulation of nonvolcanic tremor. Science 319, 186–189. doi:10.1126/science.1150558
Ruiz, S., Metois, M., Fuenzalida, A., Ruiz, J., Leyton, F., Grandin, R., et al. (2014). Intense foreshocks and a slow slip event preceded the 2014 iquique mw 8.1 earthquake. Science 345, 1165–1169. doi:10.1126/science.1256074
Rundle, J. B., Rundle, P. B., Donnellan, A., Li, P., Klein, W., Morein, G., et al. (2006). Stress transfer in earthquakes, hazard estimation and ensemble forecasting: Inferences from numerical simulations. Tectonophysics 413, 109–125. doi:10.1016/j.tecto.2005.10.031
Rundle, P. B., Rundle, J. B., Tiampo, K. F., Martins, J. S. S., McGinnis, S., and Klein, W. (2001). Nonlinear network dynamics on earthquake fault systems. Phys. Rev. Lett. 87, 148501. doi:10.1103/physrevlett.87.148501
Sathiakumar, S., and Barbot, S. (2021). The stop-start control of seismicity by fault bends along the main himalayan thrust. Commun. Earth Environ. 2, 87–11. doi:10.1038/s43247-021-00153-3
Schwartz, S. Y., and Rokosky, J. M. (2007). Slow slip events and seismic tremor at circum-pacific subduction zones. Rev. Geophys. 45. doi:10.1029/2006rg000208
Segall, P., Rubin, A. M., Bradley, A. M., and Rice, J. R. (2010). Dilatant strengthening as a mechanism for slow slip events. J. Geophys. Res. 115, B12305. doi:10.1029/2010jb007449
Supino, M., Poiata, N., Festa, G., Vilotte, J.-P., Satriano, C., and Obara, K. (2020). Self-similarity of low-frequency earthquakes. Sci. Rep. 10, 6523–6529. doi:10.1038/s41598-020-63584-6
Tanaka, S. (2012). Tidal triggering of earthquakes prior to the 2011 Tohoku-Oki earthquake (Mw9.1). Geophys. Res. Lett. 39. doi:10.1029/2012gl051179
Telesca, L., Lovallo, M., Lopez, C., and Molist, J. M. (2016). Multiparametric statistical investigation of seismicity occurred at el hierro (canary islands) from 2011 to 2014. Tectonophysics 672, 121–128. doi:10.1016/j.tecto.2016.01.045
Toda, S., Stein, R. S., Beroza, G. C., and Marsan, D. (2012). Aftershocks halted by static stress shadows. Nat. Geosci. 5, 410–413. doi:10.1038/ngeo1465
Uchida, N., Takagi, R., Asano, Y., and Obara, K. (2020). Migration of shallow and deep slow earthquakes toward the locked segment of the nankai megathrust. Earth Planet. Sci. Lett. 531, 115986. doi:10.1016/j.epsl.2019.115986
Utsu, T., and Ogata, Y. (1995). The centenary of the omori formula for a decay law of aftershock activity. JPhysEarth. 43, 1–33. doi:10.4294/jpe1952.43.1
Varga, P., and Fodor, C. (2021). About the energy and age of the plate tectonics. Terra nova. 33, 332–338. doi:10.1111/ter.12518
Varga, P., and Grafarend, E. (1996). Distribution of the lunisolar tidal elastic stress tensor components within the Earth’s mantle. Phys. Earth Planet. Interiors 93, 285–297. doi:10.1016/0031-9201(95)03067-0
Varga, P., and Grafarend, E. (2019). Influence of tidal forces on the triggering of seismic events. Geodyn. Earth Tides Observations Glob. Micro Scale, 55–63.
Wallace, L. M., Beavan, J., Bannister, S., and Williams, C. (2012). Simultaneous long-term and short-term slow slip events at the hikurangi subduction margin, New Zealand: Implications for processes that control slow slip event occurrence, duration, and migration. J. Geophys. Res. 117. doi:10.1029/2012jb009489
Wallace, L. M., Kaneko, Y., Hreinsdóttir, S., Hamling, I., Peng, Z., Bartlow, N., et al. (2017). Large-scale dynamic triggering of shallow slow slip enhanced by overlying sedimentary wedge. Nat. Geosci. 10, 765–770. doi:10.1038/ngeo3021
Wang, T.-H., Cochran, E. S., Agnew, D., and Oglesby, D. D. (2013). Infrequent triggering of tremor along the san jacinto fault near anza, California. Bull. Seismol. Soc. Am. 103, 2482–2497. doi:10.1785/0120120284
Wech, A. G., Creager, K. C., Houston, H., and Vidale, J. E. (2010). An earthquake-like magnitude-frequency distribution of slow slip in northern cascadia. Geophys. Res. Lett. 37. doi:10.1029/2010gl044881
Yabe, S., Tanaka, Y., Houston, H., and Ide, S. (2015). Tidal sensitivity of tectonic tremors in nankai and cascadia subduction zones. J. Geophys. Res. Solid Earth 120, 7587–7605. doi:10.1002/2015jb012250
Yu, H.-z., Shen, Z.-k., Wan, Y.-g., Zhu, Q.-y., and Yin, X.-c. (2006). Increasing critical sensitivity of the load/unload response ratio before large earthquakes with identified stress accumulation pattern. Tectonophysics 428, 87–94. doi:10.1016/j.tecto.2006.09.006
Zaccagnino, D., and Doglioni, C. (2022). Earth’s gradients as the engine of plate tectonics and earthquakes. Riv. Nuovo Cim. 45, 801–881. doi:10.1007/s40766-022-00038-x
Zaccagnino, D., Telesca, L., and Doglioni, C. (2022a). Correlation between seismic activity and tidal stress perturbations highlights growing instability within the brittle crust. Sci. Rep. 12, 7109–7114. doi:10.1038/s41598-022-11328-z
Zaccagnino, D., Telesca, L., and Doglioni, C. (2021). Different fault response to stress during the seismic cycle. Appl. Sci. 11, 9596. doi:10.3390/app11209596
Zaccagnino, D., Telesca, L., and Doglioni, C. (2022b). Scaling properties of seismicity and faulting. Earth Planet. Sci. Lett. 584, 117511. doi:10.1016/j.epsl.2022.117511
Keywords: silent events, earthquakes clustering, locked fault segments, stress transfer, megaquakes, earth tides, triggering of seismicity
Citation: Zaccagnino D, Telesca L and Doglioni C (2022) Variable seismic responsiveness to stress perturbations along the shallow section of subduction zones: The role of different slip modes and implications for the stability of fault segments. Front. Earth Sci. 10:989697. doi: 10.3389/feart.2022.989697
Received: 08 July 2022; Accepted: 01 November 2022;
Published: 28 November 2022.
Edited by:
Peter Varga, ELKH Institute of Earth Physics and Space Research Seismological Observatory, HungaryReviewed by:
Vladimir G. Kossobokov, Institute of Earthquake Prediction Theory and Mathematical Geophysics (RAS), RussiaVladimir Tcheverda, Institute of Petroleum Geology and Geophysics (RAS), Russia
Copyright © 2022 Zaccagnino, Telesca and Doglioni. This is an open-access article distributed under the terms of the Creative Commons Attribution License (CC BY). The use, distribution or reproduction in other forums is permitted, provided the original author(s) and the copyright owner(s) are credited and that the original publication in this journal is cited, in accordance with accepted academic practice. No use, distribution or reproduction is permitted which does not comply with these terms.
*Correspondence: Davide Zaccagnino, ZGF2aWRlLnphY2NhZ25pbm9AdW5pcm9tYTEuaXQ=