 Ferhana Masood
 Zulfiqar Ahmad
 Yawar Amin1
- 1Department of Earth Sciences, Quaid-i-Azam University, Islamabad, Pakistan
- 2University of Wah, Wah Cantt, Pakistan
- 3Digital and Integration, Schlumberger, Pakistan
For economical production from a fractured reservoir, a characteristic analysis of the fracture parameters like its density and orientation within the reservoir is essential to improve the fluid flow during extraction. This study deals with the development of a proper anisotropic rock physics model for a media with multiple fracture sets to study the spatial distribution of important fracture parameters i.e., fracture density and orientation in the absence of sophisticated laboratory/wireline and pre-stack seismic data. The crest of hydrocarbon producing fault-bounded Balkassar Anticline in Northern Potwar, Upper Indus Basin, Pakistan is selected as a case study representing a potential zone for development of fractures at reservoir level (Sakesar Limestone). The methodology consists of the interpretation of 3D post-stack seismic and conventional wireline log data to demarcate the reservoir containing fractures. The Ant-tracking discrete fracture network (DFN) attribute is applied on 3D post-stack seismic data to obtain an initial estimate about the presence of fracture corridors and their orientations. Based on this initial estimate, a proper rock physics model has been developed utilizing inverse Gassmann relations, T-matrix approximation, and Brown and Korringa relations. The output from the developed rock physics model has been displayed in the form of 13 effective independent elastic stiffness constants (monoclinic symmetry–representing media comprising of multiple fracture sets) as a function of fracture densities and azimuthal fracture orientations. A clear decreasing trend in effective elastic stiffness constants with increasing fracture densities can be observed. Similarly, a periodic trend of effective elastic stiffness constants with fracture orientations can be observed. These trends are more or less expected, but they would have been difficult to quantify without a proper rock physics model. The use of independent effective elastic constants for the generation of synthetic seismic amplitude versus angle and azimuth (AVAZ) data and its correlation with observed seismic AVAZ data in a geostatistical sense has been discussed.
1 Introduction
Fractures are commonly found in carbonate reservoir rocks (Zhiqian et al., 2016; Bagni et al., 2020) and hold the key for the extraction of hydrocarbons from the reservoir. Prolific management of the fractured reservoirs involves effectively defining fluid flow pathways during production for which effective characteristic analysis of fracture systems is essential (Ali and Jakobsen, 2011a; Ali and Jakobsen, 2011b). Furthermore, fracture properties such as fracture density and azimuthal fracture orientation, when studied spatially, can assist in the optimization of fractured reservoir production (Sayers, 2009; Ali et al., 2015). However, despite the advancement in methodologies pertaining to subsurface data acquisition and processing, identification and adequate characteristic analysis of fractures crucial to production remain a task yet to be accomplished (Gholipour et al., 2016; Bagni et al., 2020).
The investigation of fractures within a carbonate reservoir can be carried out efficiently through sophisticated subsurface borehole data (Bagni et al., 2020). However, the fracture corridors within the carbonate reservoirs are typically extended over tens to hundreds of meters in terms of height and width while being regionally spread over a kilometer (Huang et al., 2017). Furthermore, the well-based petrophysical analysis used in the characterization of fracture properties (like fracture density) cannot be available throughout the reservoir (Jadoon et al., 2006; Bagni et al., 2020). Therefore, characterizing a fractured reservoir using borehole data may require drilling more wells, which is practically not feasible. In order to tackle this problem, a simple yet practical approach is to develop a proper rock physics model which can be utilized to generate synthetic (calculated) seismic amplitude versus angle and azimuth (AVAZ) data. This synthetic seismic AVAZ data can be correlated with observed seismic AVAZ data, if available, in a geostatistical sense to obtain the spatial distribution of important fracture parameters required to enhance fluid flow.
Rock physics modeling is a vital tool for studying the seismic-based characterization of a reservoir (Misaghi et al., 2010). The focus of rock physics concepts is to link the composition of a rock with its macroscopic properties (Wang et al., 2018). The use of an appropriate rock physics model can, therefore, delineate characteristics of a rock effectively (Wang et al., 2018). In terms of seismic fracture characterization, rock physics modelling offers a reduced number of unknown parameters, thus offering a relative advantage during seismic inversion (Ali and Jakobsen, 2014). Furthermore, a proper rock physics model delivers a better physical description of the subsurface provided that the model is able to relate the fracture parameters with the effective elastic stiffness constants (Ali and Jakobsen, 2014).
The reason for the difficulty in the prediction of subsurface fracture systems from seismic data is the lack of resolution at which these fractures can be mapped (Souque et al., 2019). The accurate prediction of the fracture systems requires sophisticated laboratory/wireline and pre-stack seismic data, including core cuttings, full bore formation micro imager (FMI) logs, and seismic amplitude versus angle and azimuth (AVAZ) data at the reservoir level. However, this data is not easily available. Therefore, it is a challenging task to develop a proper anisotropic rock physics model utilizing conventional wireline log and 3D post-stack seismic data.
This study proposes a practical approach for the development of a proper rock physics model in the case of a reservoir (Sakesar Formation in this study) containing multiple fracture sets in the absence of sophisticated laboratory/wireline data. The crest of the Balkassar anticline has been taken as the case study as it provides a geological advantage of high probability of presence of multiple fracture sets. Balkassar oil field is present in Potwar basin, a north-western part of Himalayan Mountain ranges (Gee and Gee, 1989; Kemal et al., 1991) as depicted in Figure 1. A compressional regime acting on the area led to the development of anticlinal structural traps bounded by reverse faults. Patala Shale and Pre-Cambrian Salt Range Formation are considered to be the main source rocks in the locality (Bender et al., 1995; Masood et al., 2017). The main reservoirs are the fractured carbonates of the Sakesar and Chorgali formations in the Balkassar oil field with the Chorgali Formation also acting as the seal rock (Khan et al., 1986).
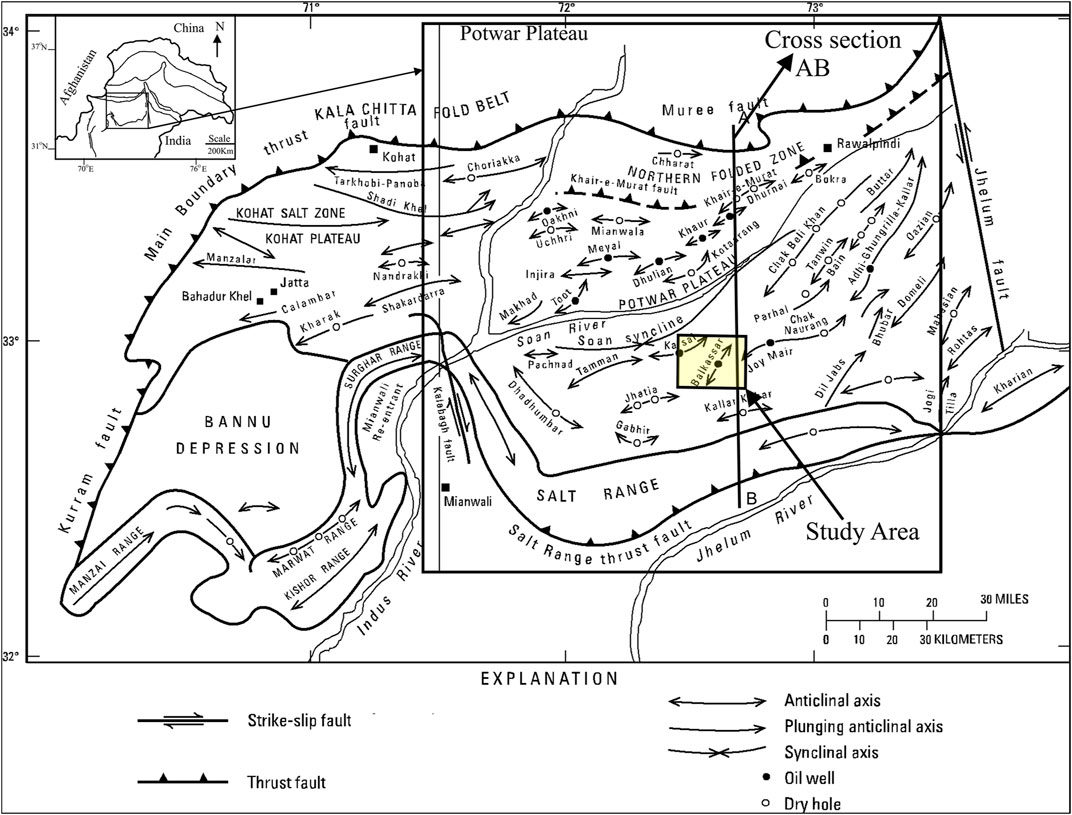
FIGURE 1. Location of Balkassar Area in Kohat-Potwar Plateau on a map depicting regional structures in detail (Gee and Gee, 1989).
The input data for developing the rock physics model is obtained from available conventional wireline log data (three tracks–lithology, resistivity, and porosity) of Well OXY-01 and 3D seismic post-stack data acquired at the Balkassar oil field. The workflow followed for the generation of such a rock physics model in the case of multiple fracture sets is displayed in Figure 2. section 2 of this paper focuses of the methodology followed to achieve the objective of developing a proper rock physics model. section 3 discusses the results obtained from each applied method including the output of the proposed rock physics model. Section 4 deals with the discussion and implication of the applied method, while section 5 concludes the study.
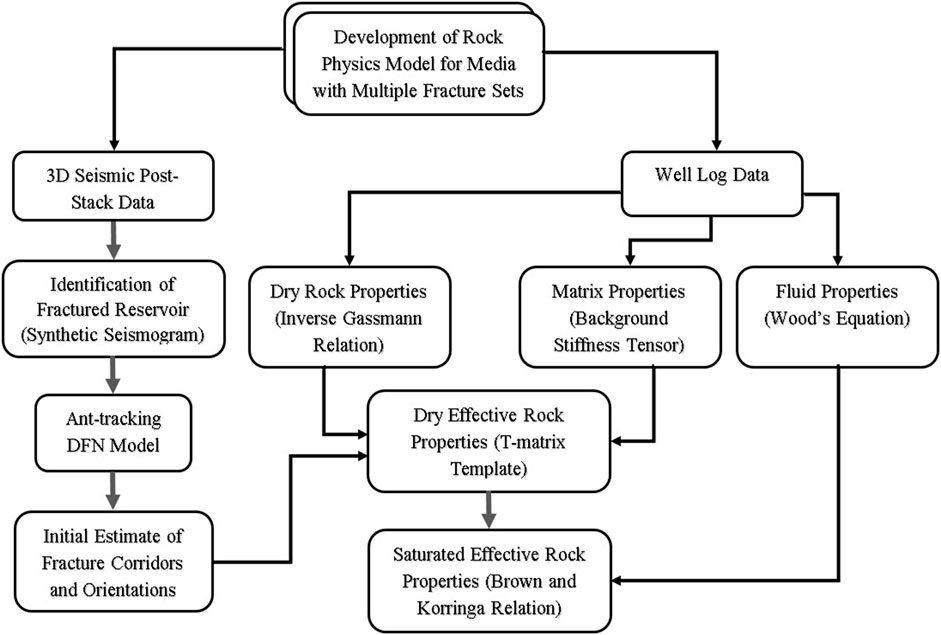
FIGURE 2. Workflow followed in the study for development of a rock physics model to characterize a medium with multiple fracture sets.
2 Methodology
2.1 Demarcation of fractured reservoir (Sakesar Limestone)
Interpretation of the 3D seismic line focuses on the extension of the formation as well as the demarcation of regional structures. In this study, 3D seismic data of Balkassar area with a dominant frequency of 35 Hz has been interpreted for the purpose of developing the discrete fracture network (DFN) model at the crest of Balkassar anticline (Figure 3). The important horizons including Chorgali, Sakesar, Patala, and Lockhart formations have been marked. The demarcation has been done with the help of synthetic seismogram (seismic to well tie tool) generated from the well log data of OXY-01 and wavelet extracted from the seismic traces nearest to the well. Faults have been marked on the basis of seismic discontinuities and background geological knowledge (Figure 3).
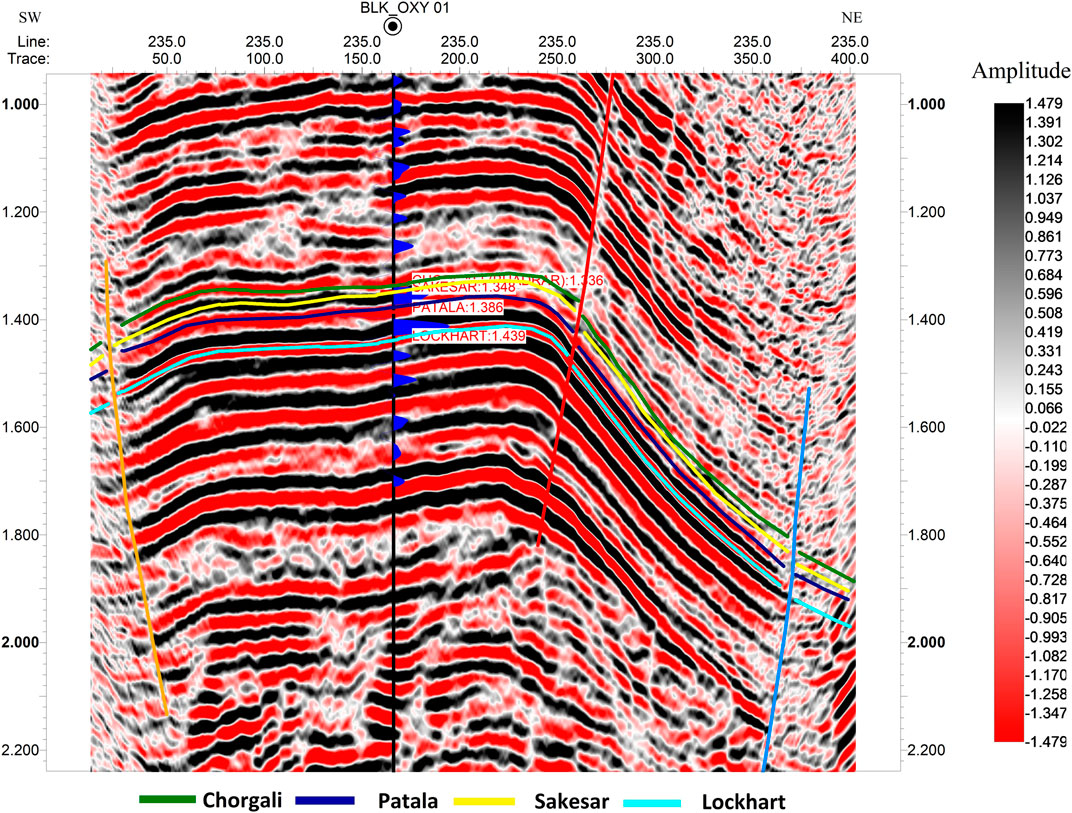
FIGURE 3. Interpretation of 3D seismic Inline 235 showing Balkassar Anticline bound by reverse faults. Formations have been marked on the basis of synthetic seismogram tied with OXY-01 well.
2.2 Discrete fracture network modeling
Model development of complete 3D characteristic profiling of fracture networks present within naturally fractured reservoirs (NFR) is essential for improving the supervision of a reservoir and consequently, the rate of recovery (Narr et al., 2006; Bisdom et al., 2014). DFN modeling is a proficient tool used for the depiction of the spatial distribution of fractures as well as the details of properties like location, size, density, orientation, and conductivity of individual fractures within an NFR (Tran et al., 2006). It takes into account the geometry of fractures, their conductive ability, and interconnection to construct a fracture network (Aydin and Akin, 2019). Furthermore, DFN ensures the contribution of each fracture as a separate entity unlike the continuum approach and dual-porosity modeling. It, therefore, establishes a more realistic display of fracture systems and paves a path to study response to the flow impact from properties of individual fractures (Aydin and Akin, 2019). This study makes use of the DFN model for Sakesar Formation in the Balkassar area to ensure the type of fractures present in the subsurface reservoir before proceeding to develop a rock physics model based on this priori information.
The Ant-Tracking algorithm has been utilized for the construction of the DFN model. The ant-tracking algorithm simulates a fracture pattern analogous to ants making pathways optimal for searching food (Hu et al., 2014). During their search for food, ants leave pheromones along the pathways to inform other ants about the possibly shortest passage to any located food (Silva et al., 2005). The same concept is used in the Ant-tracking algorithm for 3D seismic volume (Pedersen et al., 2002). Ant-tracking distributes a vast number of electronic “ants” over a seismic volume with each “ant” moving through a fractured surface-emitting “pheromone” for the rest to follow (Hu et al., 2014). Hence a large number of “ants” will trace planar surfaces like faults and fractures in a 3D seismic volume marked by the “pheromones” that the “ants” left compared to the non-structure element i.e., noise, which will be marked by a smaller number of “pheromones” (Cox and Seitz, 2007; Hu et al., 2014). Furthermore, deviation up to only 15° is allowed to “ants” from their original direction in order to improve and reinforce the tracing of planar structure (faults and fractures) rather than seismic irregularity due to noise (Fang et al., 2017).
Ant-tracking process uses a series of geophysical attributes which are inserted sequentially in a background program for the detection of faults and fractures on a 3D seismic volume (Ouenes, 2000). The general workflow to run the Ant-track volume is given in Figure 4. The final output is an attribute volume that shows faults and fracture zones in detail. In this workflow, amplitude contrast with dip guide has been used as an edge detection attribute. Two attributes have been computed in series from the result of the edge detection i.e., 3D edge enhancement and structural smoothing (Figure 5). Output from edge detection is subtracted from the input seismic data. The edge evidence attribute is computed on the output of edge enhancement which further enhances the discontinuities of interest. The final fault volume is obtained by multiplying the output of edge enhancement (A), with the output of edge evidence (B), by using the following syntax in the seismic calculator: if (A>0, A, 0)B. On Fault Cube, Ant track attribute slice is generated to extract regional faults visible on seismic data. The results obtained from the Ant track attribute applied to the seismic data are given in Figures 5A,B.
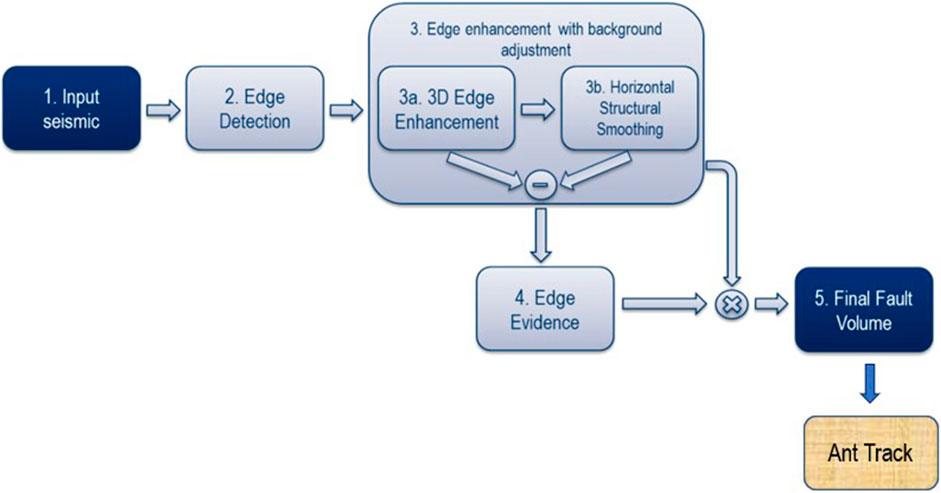
FIGURE 4. Generalized workflow followed for Ant-Tracking DFN model generation used for identification of fracture network system.
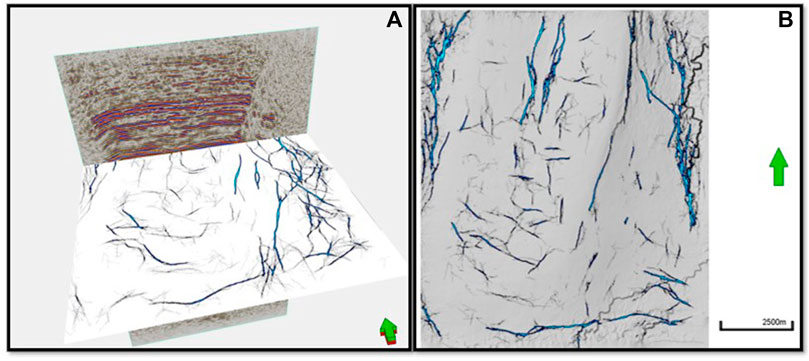
FIGURE 5. (A) Fracture analysis of Sakesar Formation using Ant-tracking attribute developed for 3D seismic volume at Balkassar anticline (B) The time-slice of the Ant-tracking attribute at Sakesar level depicting the presence of multiple fracture sets.
The application of DFN Ant-track algorithm on 3D seismic post-stack data at the crest of Balkassar anticline gives us an initial estimate of fracture distribution. This initial estimate helps in defining the conceptual model for fracture distribution at the reservoir level, within the Sakesar Formation, for which the effective anisotropic elastic properties can be obtained utilizing rock physics algorithms.
2.3 Rock physics modeling
In carbonates rocks, fractures play imperative role in providing a suitable pathway for flow of the hydrocarbons. The primary/secondary migration and alignment of these fractures to preferred orientation lead us towards the anisotropic behavior of subsurface rock formation (Ali and Jakobsen, 2011a; Ali and Jakobsen, 2011b). Therefore, in order to study the characteristics of fractures in fractured media, an anisotropic rock physics model has to be developed.
Multiple fracture sets in Sakesar Formation have been identified by means of a seismic Ant-tracking algorithm. On the basis of this observation, a monoclinic anisotropic rock physics model, taking fracture density and fracture orientation as the variables under observation has been developed. The workflow for rock physics modeling is shown in Figure 6. The monoclinic anisotropic system gives 13 independent effective elastic stiffness constants which have been plotted against the fracture densities and fracture orientations of the fractures sets. These effective elastic constants are required for the computation of AVAZ data at the reservoir level.
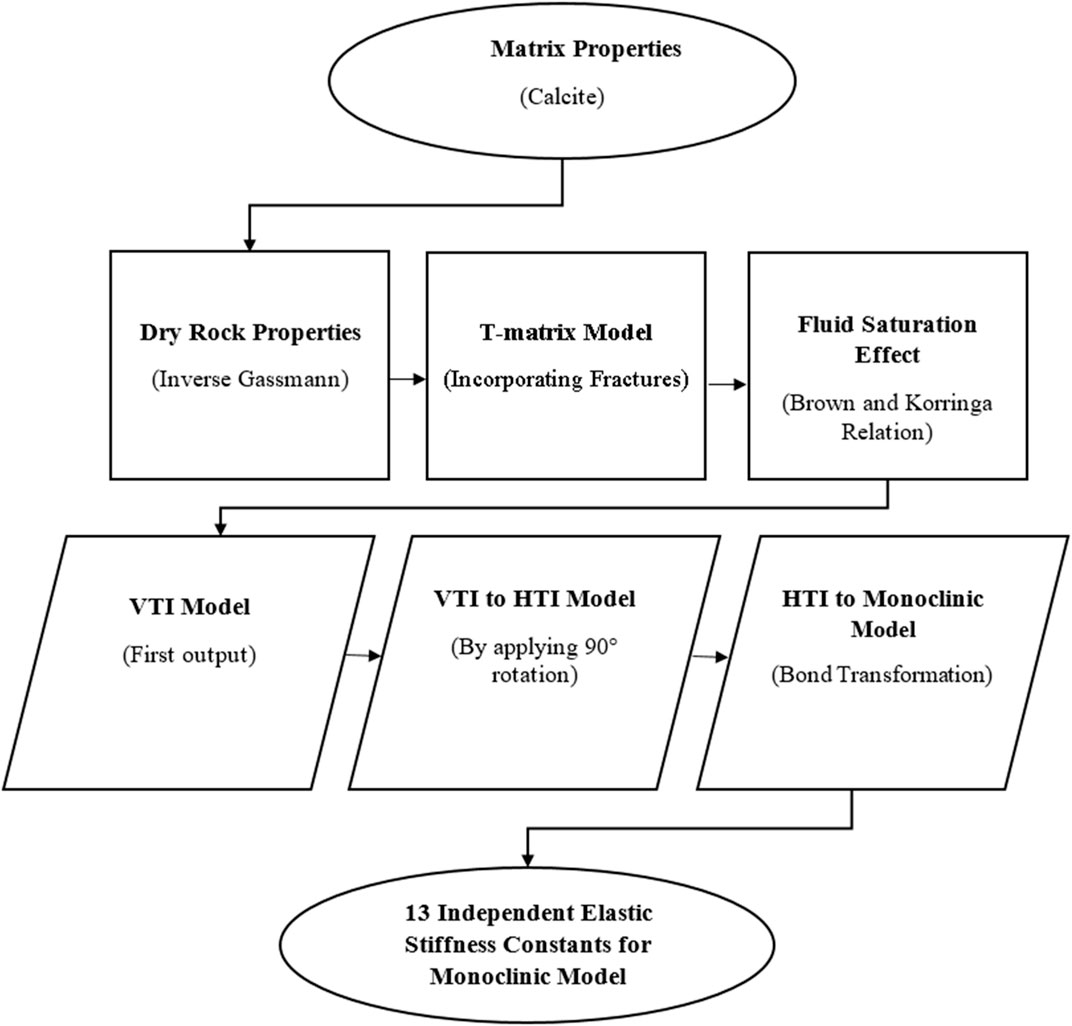
FIGURE 6. Scheme followed in this research for developing a rock physics model in case of multiple fracture sets.
2.3.1 Mineral properties
The Sakesar Formation acting as a reservoir in the study area consists of compact limestone as dominant lithology indicated by the petrophysical analysis of Well OXY-01, with shale volume of 4%, effective porosity of 5%, and water saturation of 27.7% (Table 1; Figure 7). The standard values of bulk and shear modulus of mineral (calcite) along with density is taken from (Mavko et al., 2009) listed in Table 1.
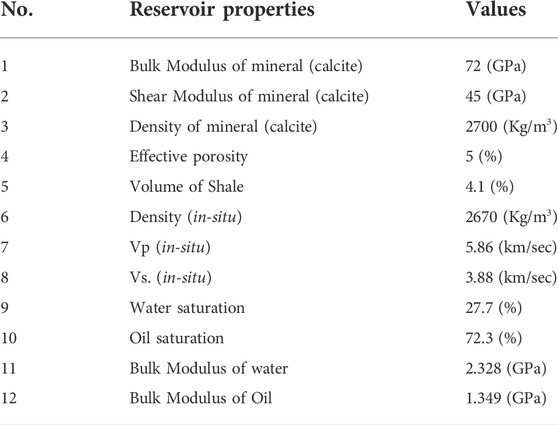
TABLE 1. Input data for rock physics algorithms obtained from petrophysical analysis of OXY-01 well at reservoir (Sakesar Formation) level (Figure 7). The bulk and shear modulus of mineral (calcite) along with density is taken from (Mavko et al., 2009). The in-situ velocities and density obtained from wireline log data helps to obtain saturated bulk modulus (
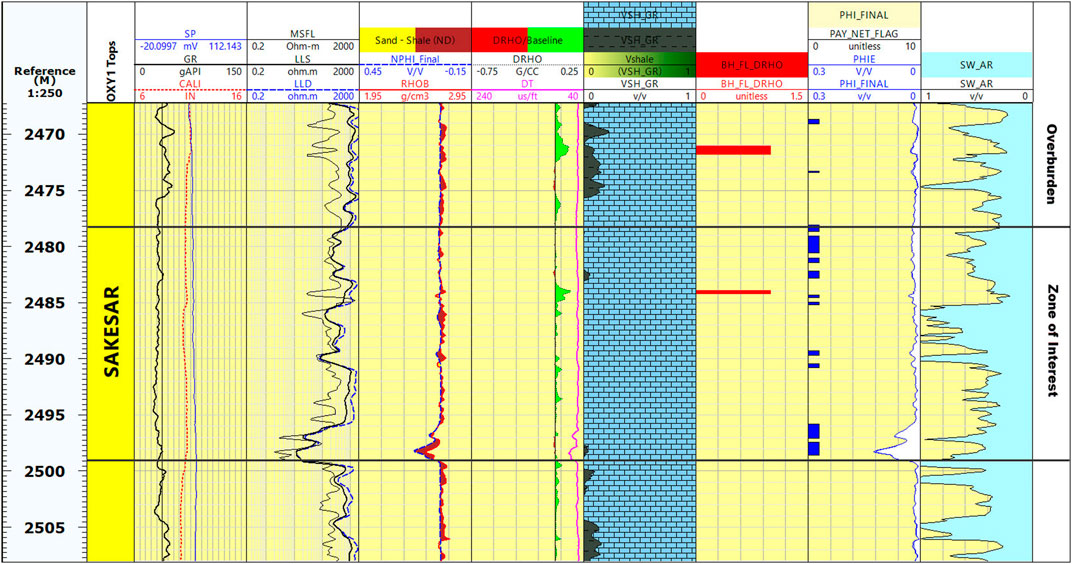
FIGURE 7. Petrophysical analysis of the Well OXY-01 depicting the zone of interest and the overburden zone within the compact Sakesar Formation.
2.3.2 Dry rock matrix properties (without fractures)
The bulk modulus for the frame (
Here,
where,
where,
2.3.3 T-matrix for incorporating the effect of fractures in poroelastic monoclinic model
For the dry case of the fractured porous medium, the dry effective stiffness tensor
where, ‘
where,
where,
Here,
where,
Here
The final product of rock physics modeling for two mesoscopic fracture sets with different fracture orientations and fracture densities for monoclinic symmetry is 13 independent effective elastic stiffness constants. These 13 independent constants in terms of Voigt index notation are
3 Results
3.1 Spatial extension of Sakesar Formation
A synthetic seismogram is generated using sonic and density logs of OXY-01 for the purpose of seismic-to-well-tie. With the help of this, the top and bottom of Sakesar Formation have been marked at 1.37 and 1.475 s respectively, by correlating the seismic (time domain) data to well (depth domain) data. The interpretation of seismic Inline 235 (Figure 3) shows a clear anticlinal structure which is called the Balkassar anticline. Reverse faults formed as a result of slippage caused by compressional regime bounding the anticline have also been interpreted (Figure 3).
3.2 Ant-tracking DFN model analysis
The DFN model effectively delineates the fractures present within the carbonate reservoir. Greater values displayed by Ant-tracking volume shows high fractured zone while low values correspond to the less fractured strata which can be related directly with secondary porosity evolution in carbonates (Figure 5A). Fractures are concentrated more towards the south within the anticline while in general, the highly populated fractures towards the east corresponds to the faulting phenomena towards the east of the anticline (Figure 5A). Two dominant fracture sets, almost orthogonal to one another, oriented in NE-SW and NW-SE direction can be observed in the formation (Figure 5B).
3.3 Rock physics model for monoclinic symmetry
A rock physics model for monoclinic symmetry has been developed for Sakesar Limestone reservoir in Balkassar locality. 13 elastic stiffness constants have been computed and displayed against fracture orientations (
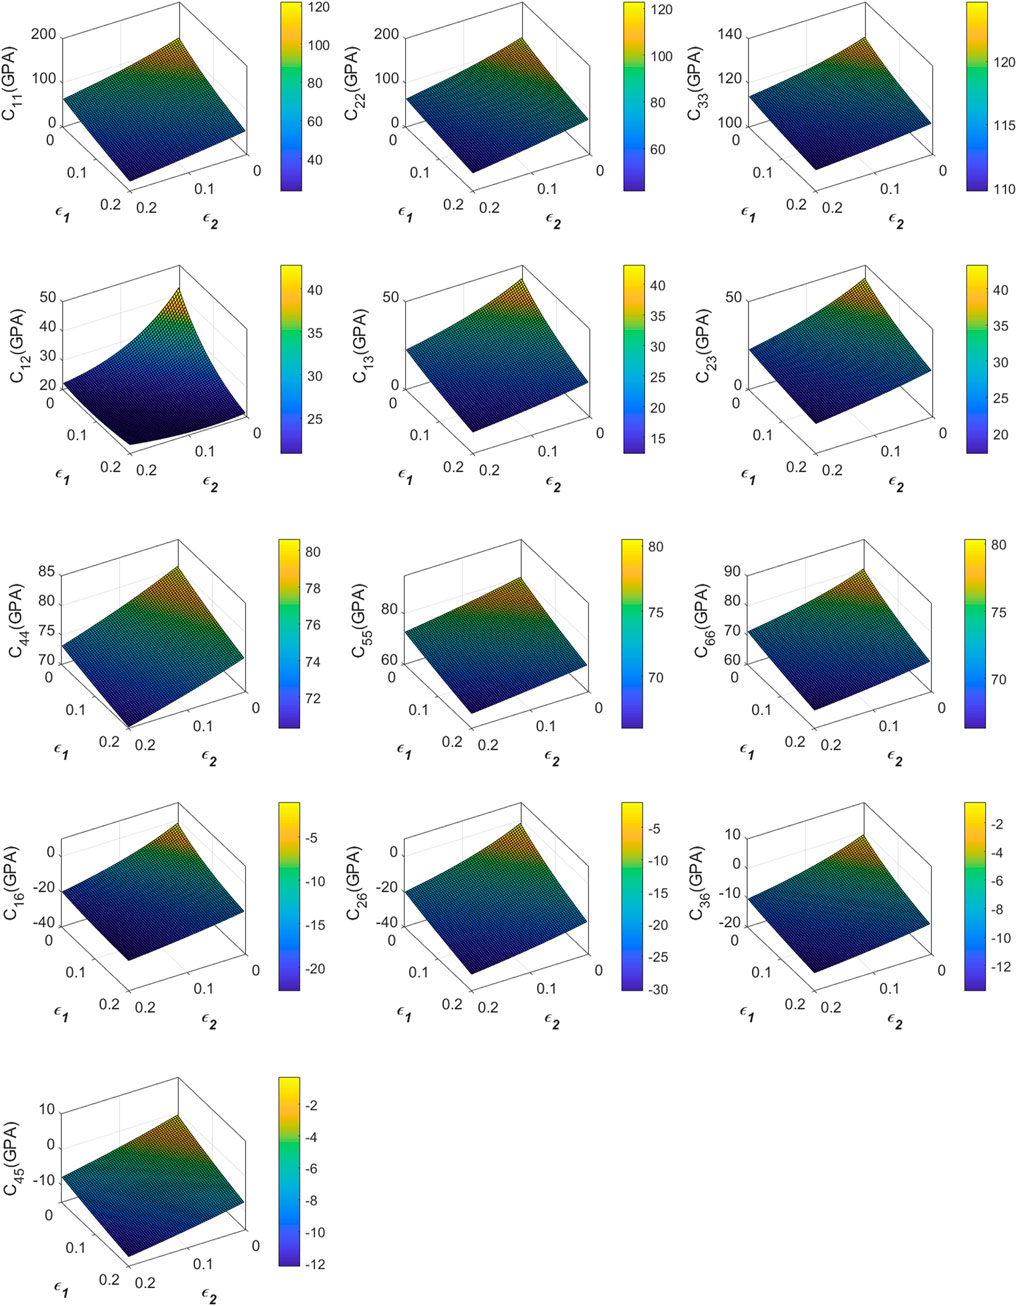
FIGURE 8. The 13 elastic stiffness constants from the monoclinic model plotted against the two sets of
In Figure 9, the 13 elastic stiffness constants have been plotted as a function of
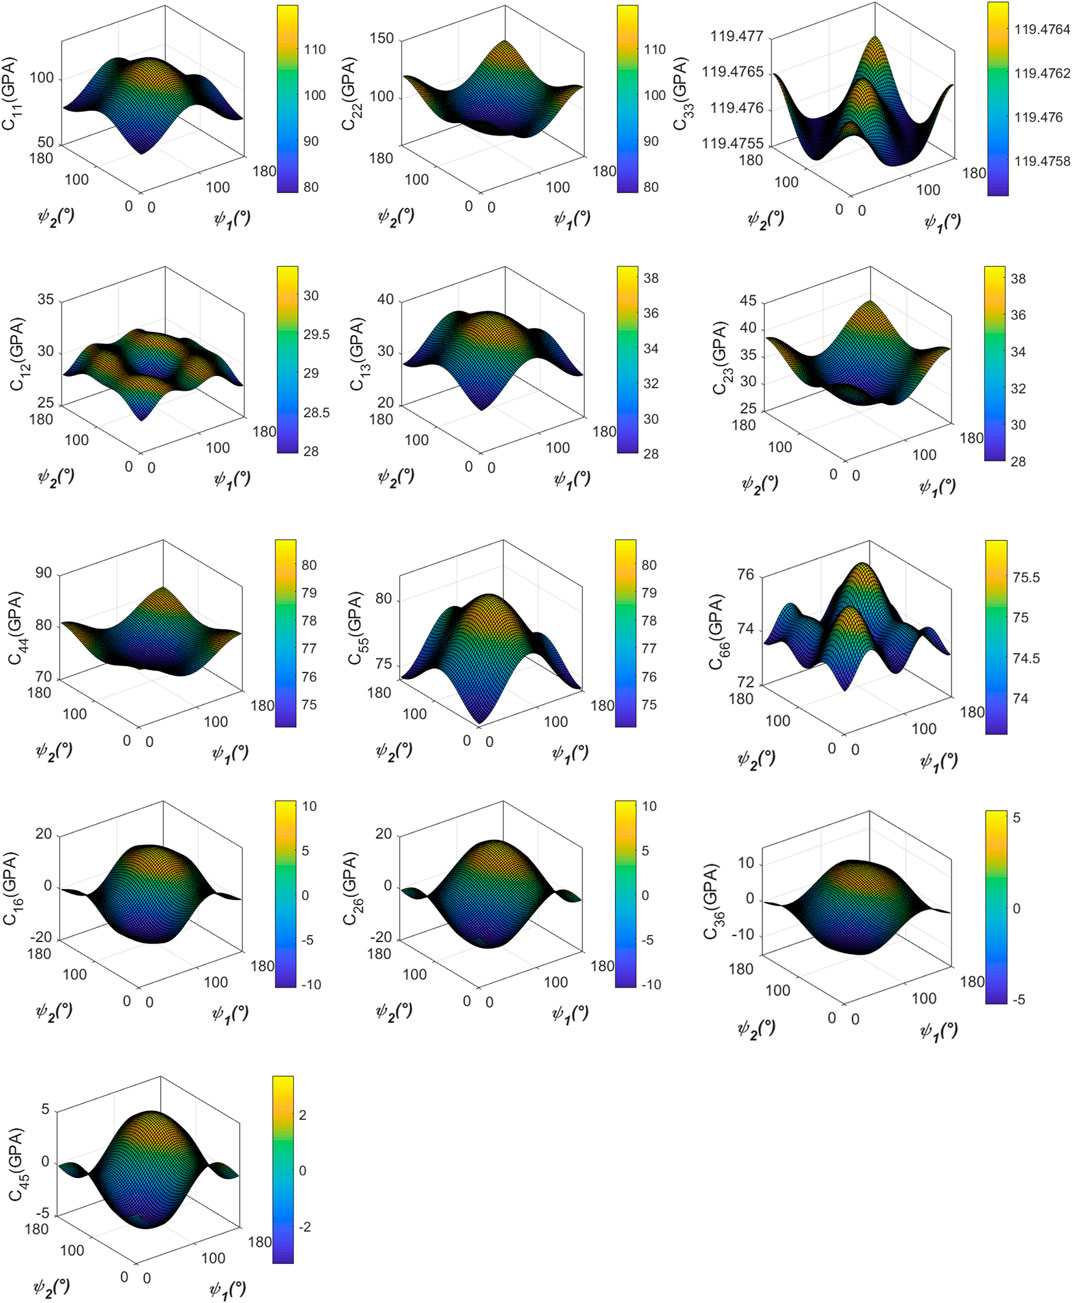
FIGURE 9. The 13 elastic stiffness constants obtained using monoclinic model plotted as a function of
4 Discussion
4.1 Seismic modeling using rock physics model for monoclinic symmetry
Once the saturated effective elastic properties of the porous fracture media have been calculated, the multiple fracture sets can then be characterized on the basis of seismic modeling. The variation of fracture based elastic properties within a rock can be detected based on sophisticated seismic attributes like seismic AVAZ, azimuthal variation of velocity in fractured interval, and shear wave birefringence analysis (Crampin et al., 1980; Lynn et al., 1995; Lynn et al., 1999; Zhu et al., 2004; Will et al., 2005). In this study, a practical method is presented for the development of rock physics model in case of a media containing multiple fracture sets utilizing conventional wireline log and 3D seismic post-stack data. The output from this rock physics model in terms of 13 independent effective elastic stiffness constants can be utilized for determination of monoclinic reflectivity given by Schoenberg and Protazio (1992):
Here,
Here,
4.2 Seismic inversion for porous media with multiple fracture sets
Inverse modeling targets the spatial estimation of fracture parameters, which influence the fluid flow during production (Ali et al., 2015). To obtain the modeled fracture parameters on a reservoir scale, the calculated seismic AVAZ data has to be matched with the field based observed seismic AVAZ data in order to minimize the error before the parameters under observation can be studied. The inverse problem in this particular case can be formulated as given in Eq. 15.
Here,
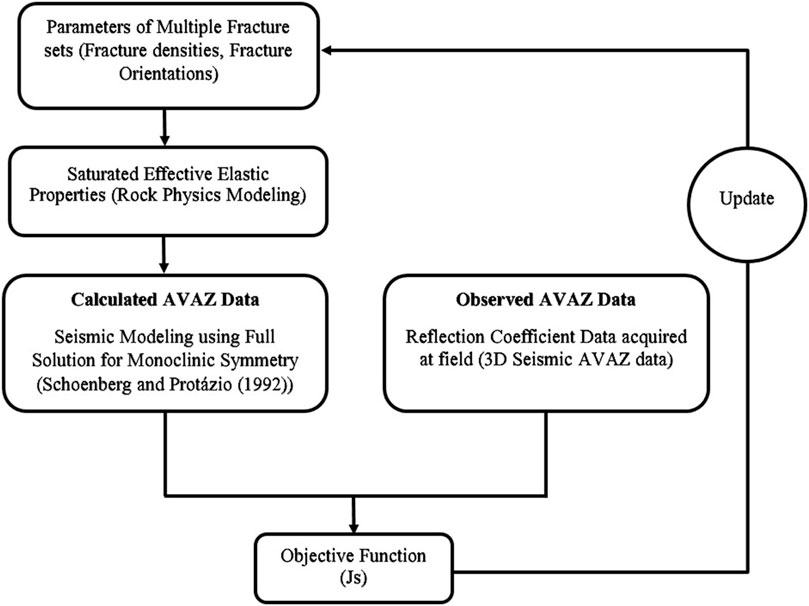
FIGURE 10. Workflow proposed by the study to invert for fracture parameters of multiple fracture sets by developing synthetic AVAZ volume using rock physics model for monoclinic symmetry which can be correlated with observed 3D seismic AVAZ data.
Correlation of the developed synthetic data with the pre-stack 3D seismic AVAZ data will lead to spataial mapping the parameters at reservoir scale, thus immensely assisting in reservoir characterization provided that the synthetic data has been modelled correctly. The plots for these parameters with 13 effective elastic stiffness constants helps to monitor the sensitivity of the forward model. Changing the forward model will change the outcome of the reflectivity. Therefore, the geostatistical correlation helps to select the best possible model to invert for the fracture parameters.
Due to limited availability of borehole data over large areas, a monoclinic rock physics model can be opted to spatially characterize the azimuthal fracture orientations and fracture densities of multiple fracture sets in a fractured reservoir. The challenge however is requirement of accurate priori information regarding petrophysical properties like fluid saturation, porosity, volume of shale etc.; matrix properties like matrix moduli, matrix density, and fracture geometry. The importance of rock physics model lies in its ability to inculcate a large number of input parameters. This however can turn out to be a problem provided an improper priori information is used. It is therefore essential to know the alignment of fracture sets present in a fractured reservoir before a rock physics model can be developed. The Ant-tracking DFN modeling proves to be a good tool for this purpose, however, core data analysis is always preferable. The aspect ratio for fractures used in this study was obtained from outcrop of the studied formation, but core sample analysis for aspect ratio determination is suggested as it affects the results of T-matrix model.
5 Conclusion
In the absence of sophisticated laboratory/wireline data, characterization of fracture parameters (like azimuthal orientation and density) of multiple fracture sets in a fractured media can be achieved using a suitable rock physics model. The accuracy of the developed model depends upon the precision of input parameters and awareness of background geological knowledge. The Ant-tracking DFN model gives a potential initial estimate of fractures, which can be used as a priori information for the development of the required rock physics model. Here, in this study, a proper rock physics model for a media comprising of multiple fracture sets (monoclinic symmetry) was developed using T-matrix approach, Wood’s equation, and Brown-Korringa relation. The output in the form of 13 independent effective elastic stiffness coefficients shows an inverse linear trend with
Author's note
This work is a part of FM's Ph.D thesis.
Data availability statement
The data analyzed in this study is subject to the following licenses/restrictions: The data was officially obtained after applying through the university to the Directorate General of Petroleum Concessions (DGPC) which has jurisdiction over handling the data. Requests to access these datasets should be directed to ZGdwY0BtcG5yLmdvdi5waw==.
Author contributions
FM implemented the methodology and carried out the research. ZA proof read the manuscript and contributed in finalizing the manuscript. YA provided technical support and assisted in carrying out the methodology. Zubair assisted in specialized technical support. AA put forward the idea and helped with the provision of methodology for this research as well as assessed the results of the study.
Acknowledgments
We would like to thank the Directorate General of Petroleum Concessions (DGPC), LMKR, Pakistan, for being a data source for this work and the Department of Earth Sciences, Quaid-i-Azam University (QAU), Islamabad, Pakistan, which provided the basic facilities for completing this work. We personally thank Tahir Hussain, Ph.D. Scholar, QAU, Muhammad Zahid, Chief Petrophysicist, Mari Petroleum Company Limited, and Ali Zulqarnain, Geophysicist, OGDCL, who provided help and support during this case study.
Conflict of interest
Author ZA is employed by the Digital and Integration, Schlumberger, Pakistan
The remaining authors declare that the research was conducted in the absence of any commercial or financial relationships that could be construed as a potential conflict of interest.
Publisher’s note
All claims expressed in this article are solely those of the authors and do not necessarily represent those of their affiliated organizations, or those of the publisher, the editors and the reviewers. Any product that may be evaluated in this article, or claim that may be made by its manufacturer, is not guaranteed or endorsed by the publisher.
References
Ali, A., and Jakobsen, M. (2011a). On the accuracy of rüger’s approximation for reflection coefficients in HTI media: Implications for the determination of fracture density and orientation from seismic AVAZ data. J. Geophys. Eng. 8, 372–393. doi:10.1088/1742-2132/8/2/022
Ali, A., Anwer, H. M., and Hussain, M. (2015). A comparisonal study in the context of seismic fracture characterization based on effective stiffness and compliance methods. Arab. J. Geosci. 8, 4117–4125. doi:10.1007/s12517-014-1478-8
Ali, A., and Jakobsen, M. (2014). Anisotropic permeability in fractured reservoirs from frequency-dependent seismic Amplitude versus Angle and Azimuth data. Geophys. Prospect. 62 (2), 293–314. doi:10.1111/1365-2478.12084
Ali, A., and Jakobsen, M. (2011b). Seismic characterization of reservoirs with multiple fracture sets using velocity and attenuation anisotropy data. J. Appl. Geophys. 75 (3), 590–602. doi:10.1016/j.jappgeo.2011.09.003
Aydin, H., and Akin, S. (2019). “Discrete fracture network modeling of alaşehir geothermal field,” in Proceedings of the 44th Workshop on Geothermal Reservoir Engineering, Stanford, California, 11-13 February (Stanford University). SGP-TR-214.
Bagni, F. L., Bezerra, F. H., Balsamo, F., Maia, R. P., and Dall'Aglio, M. (2020). Karst dissolution along fracture corridors in an anticline hinge, jandaíra formation, Brazil: Implications for reservoir quality. Mar. Petroleum Geol. 115, 104249. doi:10.1016/j.marpetgeo.2020.104249
Batzle, M., and Wang, Z. (1992). Seismic properties of pore fluids. Geophysics 57 (11), 1396–1408. doi:10.1190/1.1443207
Bender, F., Raza, H. A., and Bannert, D. N. (1995). Geology of Pakistan. Berlin, Stuttgart: Gebruder Borntraeger.
Bisdom, K., Gauthier, B. D. M., Bertotti, G., and Hardebol, N. J. (2014). Calibrating discrete fracture-network models with a carbonate three-dimensional outcrop fracture network: Implications for naturally fractured reservoir modeling. Am. Assoc. Pet. Geol. Bull. 98 (7), 1351–1376. doi:10.1306/02031413060
Brown, R. J. S., and Korringa, J. (1975). On the dependence of the elastic properties of a porous rock on the compressibility of the pore fluid. Geophysics 40, 608–616. doi:10.1190/1.1440551
Carcione, J. M. (1995). Constitutive model and wave equations for linear, viscoelastic, anisotropic media. Geophysics 60, 537–548. doi:10.1190/1.1443791
Cox, T., and Seitz, K. (2007). “May. Ant tracking seismic volumes for automated fault interpretation,” in CSPG CSEG convention (Oklahoma, United States: AAPG), 670571.
Crampin, S., McGonigle, R., and Bamford, D. (1980). Estimating crack parameters from observations of P-wave velocity anisotropy. Geophysics 45, 345–360. doi:10.1190/1.1441086
Fang, J., Zhou, F., and Tang, Z. (2017). Discrete fracture network modelling in a naturally fractured carbonate reservoir in the jingbei oilfield, China. Energies 10 (2), 183. doi:10.3390/en10020183
Gee, E. R., and Gee, D. G. (1989). Overview of the geology and structure of the Salt Range, with observations on related areas of northern Pakistan, 232. Boulder, Colorado: Geological Society of America Special Paper, 95–112.
Gholipour, A. M., Cosgrove, J. W., and Ala, M. (2016). New theoretical model for predicting and modelling fractures in folded fractured reservoirs. Pet. Geosci. 22, 257–280. doi:10.1144/petgeo2013-055
Hu, J. L., Kang, Z. H., and Yuan, L. L. (2014). “Automatic fracture identification using ant tracking in Tahe oilfield,” in Advanced materials research. Editors X. Lu, K-C. Lam, H. Xu, and Z. Jia (Freienbach, Switzerland: Trans Tech Publications Ltd), 962, 556–559.
Huang, S., Zhang, Y., Zheng, X., Zhu, Q., Shao, G., Cao, Y., et al. (2017). Types and characteristics of carbonate reservoirs and their implication on hydrocarbon exploration: A case study from the eastern tarim basin, NW China. J. Nat. Gas Geoscience 2 (1), 73–79. doi:10.1016/j.jnggs.2017.02.001
Jadoon, M. S. K., Jadoon, I. A. K., Bhatti, A. H., and Ali, A. (2006). Fracture characterization and their impact on the field development. Pak. J. Hydrocarbon Res. 16, 11–21. doi:10.2118/111053-MS
Jakobsen, M., Hudson, J. A., and Johansen, T. A. (2003a). T-Matrix approach to shale acoustics. Geophys. J. Int. 154, 533–558. doi:10.1046/j.1365-246x.2003.01977.x
Jakobsen, M., Johansen, T. A., and McCann, C. (2003b). The acoustic signature of fluid flow in complex porous media. J. Appl. Geophy. 54, 219–246. doi:10.1016/j.jappgeo.2002.11.004
Kemal, A., Balkwill, H. R., Stoakes, F. A., Ahmad, G., Zaman, A. S. H., and Humayon, M. (1991). “Indus basin hydrocarbon plays,” in International Petroleum Seminar on new directions and strategies for accelerating Petroleum Exploration and Production in Pakistan, 16–57.
Khan, M. A., Ahmed, R., Raza, H. A., and Kemal, A. (1986). Geology of petroleum in Kohat-Potwar depression, Pakistan. AAPG Bull. 70 (4), 396–414. doi:10.1306/9488571E-1704-11D7-8645000102C1865D
Kumar, D. (2006). A tutorial on Gassmann fluid substitution: Formulation, algorithm and matlab code. Geohorizons 11, 4–12.
Lynn, H. B., Beckham, W. E., Simon, K. M., Bates, C. R., Layman, M., and Jones, M. (1999). P-wave and S-wave azimuthal anisotropy at a naturally fractured gas reservoir, Bluebell-Altamont field, Utah. Geophysics 64, 1312–1328. doi:10.1190/1.1444636
Lynn, H. B., Simon, K. M., Bates, C. R., Layman, M., Schneider, R., and Jones, M. (1995). Use of anisotropy in P-wave and S-wave data for fracture characterization in a naturally fractured gas reservoir. Lead. Edge 14, 887–893. doi:10.1190/1.1437179
Masood, F., Ahmad, Z., and Khan, M. S. (2017). Moderate interpretation with attribute analysis and 3D visualization for deeper prospects of balkassar field, central potwar, upper Indus Basin, Pakistan. Int. J. Geosciences 8 (05), 678–692. doi:10.4236/ijg.2017.85037
Mavko, G., Mukerji, T., and Dvorkin, J. (2009). The rock physics handbook. Cambridge, United Kingdom: Cambridge University Press.
Misaghi, A., Negahban, S., Landrø, M., and Javaherian, A. (2010). A comparison of rock physics models for fluid substitution in carbonate rocks. Explor. Geophys. 41, 146–154. doi:10.1071/eg09035
Narr, W., Schechter, D. S., and Thompson, L. B. (2006). Naturally fractured reservoir characterization, 112. Richardson, Texas: Society of Petroleum Engineers.
Nguyen, P. K. T., and Nam, M. J. (2011). A review on methods for constructing rock physics model of saturated reservoir rock for time-lapse seismic. Geosystem Eng. 14 (2), 95–107. doi:10.1080/12269328.2011.10541336
Ouenes, A. (2000). Practical application of fuzzy logic and neural networks to fractured reservoir characterization. Comput. Geosci. 26 (8), 953–962. doi:10.1016/s0098-3004(00)00031-5
Pedersen, S. I., Randen, T., Sonneland, and L., and Steen, Ø. (2002). “Automatic fault extraction using artificial ants,” in SEG technical program expanded abstracts 2002 (Texas, United States: Society of Exploration Geophysicists), 512–515.
Sayers, C. M. (2009). Seismic characterization of reservoirs containing multiple fracture sets. Geophys. Prospect. 57 (2), 187–192. doi:10.1111/j.1365-2478.2008.00766.x
Schoenberg, M., and Protazio, J. (1992). Zoeppritz rationalized and generalized to anisotropy. J. Seism. Explor. 1, 125–144. doi:10.1121/1.2029011
Silva, C. C., Marcolino, C. S., and Lima, F. D. (2005). “Automatic fault extraction using ant-tracking algorithm in the marlim south field, campos basin,” in SEG technical program expanded abstracts (Texas, United States: Society of Exploration Geophysicists), 857–860.
Smith, T. M., Sondergeld, C. H., and Rai, C. S. (2003). Gassmann fluid substitutions: A tutorial. GEOPHYSICS 68 (2), 430–440. doi:10.1190/1.1567211
Souque, C., Knipe, R. J., Davies, R. K., Jones, P., Welch, M. J., and Lorenz, J. (2019). Fracture corridors and fault reactivation: Example from the chalk, isle of thanet, kent, england. J. Struct. Geol. 122, 11–26. doi:10.1016/j.jsg.2018.12.004
Tran, N. H., Chen, Z., and Rehman, S. S. (2006). Integrated conditional global optimisation for discrete fracture network modelling. Comput. Geosciences 32, 17–27. doi:10.1016/j.cageo.2005.03.019
Wang, B., Chen, Y., Lu, J., and Jin, W. (2018). A rock physics modelling algorithm for simulating the elastic parameters of shale using well logging data. Sci. Rep. 8 (1), 12151–12158. doi:10.1038/s41598-018-29755-2
Will, R., Archer, R., and Dershowitz, B. (2005). Integration of seismic anisotropy and reservoir performance data for characterization of naturally fractured reservoirs using discrete fracture network models, SPE Reserv. Eval. Eng. 8 (2), 132–142. doi:10.2118/84412-MS
Zhiqian, G., Zhongbao, L., Shanlin, G., Qunan, D., Shiqiang, W., and Shilin, L. (2016). Characteristics and genetic models of Lower Ordovician carbonate reservoirs in southwest Tarim Basin, NW China. J. Petroleum Sci. Eng. 144, 99–112. doi:10.1016/j.petrol.2016.03.007
Zhu, P., Wang, W., Yu, W., and Zhu, G. (2004). Inverting reservoir crack density from P-wave AVOA data. J. Geophys. Eng. 1, 168–175. doi:10.1088/1742-2132/1/2/010
Keywords: fractured reservoirs, ant-track attribute, anisotropic rock physics model, seismic AVAZ data, bayesian inversion, fracture density, fracture orientation
Citation: Masood F, Ahmad Z, Amin Y, Zubair and Ali A (2022) A practical approach to develop a proper anisotropic rock physics model for media comprising of multiple fracture sets in the absence of sophisticated laboratory/wireline data. Front. Earth Sci. 10:988258. doi: 10.3389/feart.2022.988258
Received: 07 July 2022; Accepted: 10 August 2022;
Published: 02 September 2022.
Edited by:
Ahmed Henaish, Zagazig University, EgyptReviewed by:
Lin Zhang, Hohai University, ChinaJunxin Guo, Southern University of Science and Technology, China
Copyright © 2022 Masood, Ahmad, Amin, Zubair and Ali. This is an open-access article distributed under the terms of the Creative Commons Attribution License (CC BY). The use, distribution or reproduction in other forums is permitted, provided the original author(s) and the copyright owner(s) are credited and that the original publication in this journal is cited, in accordance with accepted academic practice. No use, distribution or reproduction is permitted which does not comply with these terms.
*Correspondence: Ferhana Masood, ZmVyaGFuYUBnZW8ucWF1LmVkdS5waw==, ZmFyaGFuYS5tYXNvb2RAZ21haWwuY29t