 Chong Wang
 Wenhao Qi1,2*
- 1Key Laboratory of Earthquake Engineering and Engineering Vibration, Institute of Engineering Mechanics, China Earthquake Administration, Harbin, China
- 2Key Laboratory of Earthquake Disaster Mitigation, Ministry of Emergence Management, Harbin, China
- 3Geophysical Exploration Center, China Earthquake Administration, Zhengzhou, China
- 4Institute of Disaster Prevention, Sanhe, China
The basin effects alter the frequency content, amplitude and duration of seismic waves with different depth and shape basin. In this paper, we selected 2-D geophysical profiles spanning the Weihe Basin with large area and the Luoquanli Basin with small area. Based on the velocity structure data of the two geophysical profiles, 2-D finite element models were established to analyze the influences of the sedimentary layer in a broad basin and the basement geometry of a small basin on the basin effects using the spectral element method. The results showed that the sedimentary deposits in the basin could significantly amplify the ground motion, and the diffraction waves generated by the lateral inhomogeneity of the basin could prolong the duration of the ground motion. The highlight of this paper, our results showed that the amplification characteristics were controlled by the velocity mean in the vertical direction of sedimentary deposits (vp < 4.5 km/s) for a broad basin with small depth-to-width ratio as Weihe Basin, while the amplification characteristics were dominated by basement geometry of the small basin with large depth-to-width ratio as Luoquanli Basin. In this study, a high-resolution 2-D geophysical refraction profile was directly used to construct a finite element model to study the basin effects, which provided a new method of studying the basin effects.
1 Introduction
Typically, a basin is an area where the crystalline basement has been depressed for a long (geologic) period with respect to sea level, and sedimentary deposition and filling have occurred. Compared to the surrounding terrain, the interior of a basin is relatively flat and is protected by scenic mountains, so many human settlements have been constructed in the interior of basins, such as Beijing, Chengdu, Taipei, Mexico City, Tokyo, and Los Angeles. When a basin is affected by an earthquake, the basin’s structure exhibits special basin effects, which tend to aggravate earthquake damage. The earthquake damages to the corresponding basins caused by the Mexico earthquake, the Northridge earthquake, and the Hyogo-ken Nambu earthquake are well known to everyone, and as a special site effect, the basin effects are receiving more and more attention from seismologists (e.g., Kawase, 1996; Graves et al., 1998; Olsen, 2000; Komatitsch et al., 2004; Lee et al., 2008a; Lee et al., 2008b, Lee et al., 2009; Iyisan and Khanbabazadeh, 2013; Chaljub et al., 2015; Maufroy et al., 2017; Zhang et al., 2019; Zhang et al., 2020). The results of existing studies have shown that the factors affecting the basin effects are mainly the structure of the sedimentary layer, the geometry of the basin’s basement strata, and the seismic wave input orientation or source location, among which, the sediment structure (Field, 2000; Frankel et al., 2001, 2002; Fletcher and Wen, 2005; Roten et al., 2006; Hartzell et al., 2016) and geometry of the basin’s basement strata (Gao et al., 1996; Alex and Olsen, 1998; Davis et al., 2000; Baher and Davis, 2003; Stephenson et al., 2006; Shani-Kadmiel et al., 2012; Riga et al., 2016; Sahar and Narayan, 2016; Zhu, 2018) have the most significant effects on the ground motion.
Three methods are usually used to investigate basin effects. The first is to analyze the strong-motion records for the basin region. The second is to combine the information about the basin’s stratigraphic structure with strong-motion records to statistically derive the ground-motion prediction equations (GMPEs) of the basin region. The third is to construct a numerical model of the basin to simulate the basin effects. All three methods require an accurate velocity model as supporting data. The accurate velocity model can determine the thickness of the sedimentary layer, the burial depth of the basin’s basement, the geometry of the basement strata, and the structural heterogeneity of the subsurface, which are crucial to the seismic response of the basin.
The strong-motion records for a basin area can directly reflect the basin effects, for example, the amplification of low-frequency ground motions by sedimentary layers in the basin, the focusing effect, the edge effect and the resonance effect of the basin, and such records have shown that the amplification of ground motion by a basin is closely related to the burial depth of the basement in the basin. Lee and Anderson (2000) and Steidl and Lee (2000) investigated the amplification effect of the Southern California basin on ground motion using strong-motion records, and they concluded that the variation in the thickness of the sediments in the basin caused the error between GMPEs and the basin effects at the soil site. Fletcher and Wen (2005) analyzed the strong-motion records of the 1999 Mw7.6 magnitude earthquake in Jiji, Taiwan, and found that the peak value and duration of the ground motion were related to the basin’s basement depth. By analyzing the records from the San Jose array in California, Frankel et al. (2001) found that the seismic amplitude and the spectral ratios between the receivers inside the basin and a weakly weathered bedrock site receiver at the edge of the basin were higher in the western region of the Evergreen Basin than in the eastern region; they concluded that this was related to the deeper burial depth of the basement in the western region. Hartzell et al. (2016) found that the amplification factors for the longer periods (≥1 s) in the Livermore Valley were generally consistent with the variations in the depth of the basement in this basin.
To consider basin effects in GMPEs, the empirical relationship between the ground motion parameters and the thickness of the sedimentary layer in the basin is mostly established, but the determination of the thickness of the sedimentary layer in the basin varies. In determining the long-period portion of the GMPE, Campbell (1997) defined the depth to the crystalline rocks or metamorphic rocks as the sediment thickness. In calibrating the GMPE for Southern California, Field (2000) considered the basin amplification factor to be positively correlated with the basin depth and took the depth to the vs = 2.5 km/s horizon beneath the site as the basin depth. Several models of NGA-West2 consider basin terms, for example, the ASK14 (Abrahamson et al., 2014), BSSA14 (Boore et al., 2014), and CY14 (Chiou and Youngs, 2014) GMPEs use the depth to the vs = 1.0 km/s horizon beneath the site to model sediment-depth and basin effects, while CB14 (Campbell and Bozorgnia, 2014) uses the depth to the vs = 2.5 km/s horizon beneath the site. When Denolle et al. (2014) determined the relationship between the peak ground motion and the depth of the Kanto Basin in Japan, the depth to the vs = 3.2 km/s horizon beneath the site was taken as the depth of the basin. Therefore, the sediment thickness or basement burial depth of the basin is important basic data for building GMPEs.
The resolution of the velocity model can determine the accuracy of the numerical simulation. Theoretically, the finer the velocity structure of the subsurface geological body is, the higher the accuracy of the numerical simulation is. When using the spectral element method (SEM) to simulate 3-D ground motion in mountainous areas, He et al. (2015) combined fine meshes with a high-resolution velocity model, the frequency band of the ground motions simulated could be up to 8 Hz, and the simulation results were close to the seismic record. He et al. (2015) believed that the resolution of the velocity model directly determines the simulation accuracy of the wave propagation. Most researchers have come to the same conclusion through 3-D ground motion simulation studies (e.g., Lee et al., 2009; Bielak et al., 2010; Chaljub et al., 2015). A velocity structure with a high resolution more accurately represents the heterogeneity of the subsurface structure, which directly affects the distribution of the ground motion at the surface.
To simulate the basin effects reasonably, it is an effective approach to construct a finite element (FE) model to simulate the ground motion using geophysical profile data. From the above discussion, we can see that accurate velocity structure data are important to studying basin effects. The 2-D numerical simulation technique has also been used to study basin effects, but these studies tended to over-simplify the basin model, and over-simplification can be detrimental to the practicality and applicability of the research results since the homogeneous assumption is far from reality (Zhu, 2018). To obtain an accurate 2-D velocity model, direct drilling tests can be conducted to obtain more accurate data, but it is quite expensive to obtain the velocity structure of the entire cross-section of a broad basin. It is also impossible to obtain the velocity structure of the entire Cenozoic and deeper strata due to the limitation of the drilling depth. In contrast, the high-resolution refraction exploration method is a feasible and relatively cost-efficient approach. For basins that have large length/width ratios, V-shaped valleys, and U-shaped paleochannels, from the perspective of the long axis of the structure, they are approximately 2-D bodies, and high-resolution refraction exploration has been implemented across most of these areas, so accurate velocity models can be obtained. Therefore, it is acceptable to directly use these geophysical prospecting data to build a 2-D FE model to simulate the general characteristics of the ground motion. The direct use of 2-D geophysical prospecting profiles to construct FE models can accurately represent the real depositional environment and stratigraphic heterogeneity of the basin, and this approach can reflect the influence of the heterogeneity of the velocity structure on the ground motion well. Based on previous studies, it is clear that the basin’s basement depth and resolution of the velocity model have the most significant influence on the basin effects. Therefore, we chose two geophysical profiles across the basin. One of the profiles had a long span and large basement depth variations. Based on this profile, the influences of the basement depth and vertical velocity structure on the ground motion characteristics were studied. The other profile spanned a small-scale basin with a high-resolution velocity structure, and the arc-shaped basement of the basin could be identified. Based on this profile, the influences of the heterogeneity of the velocity structure and the geometric features of the basement on ground motion were studied.
2 Numerical technique
In this paper, we use the SEM (Komatitsch and Vilotte, 1998), which is popular for ground motion simulations. The SEM combines the advantages of the pseudo-spectral method and the FE method. It not only has the flexibility of the FE method in dealing with irregular structures, but it also has the high accuracy and fast convergence characteristics of the pseudo-spectral method. In this paper, the Ricker wavelet is used as the source time function. The Ricker wavelet is a narrow-band signal. Using the Ricker wavelet as the input motion can identify the main characteristics of the seismic response of the basin. It is an effective method that can be used to determine the causes and results of complex engineering problems (Bard and Bouchon, 1985; Gelagoti et al., 2012).
The expressions of the Ricker wavelet in the time domain and frequency domain are as follows:
where fp is the central or predominant frequency.
In studying the seismic response of a 2-D trapezoidal basin, Zhu (2018) found that only when the wavelength of the input seismic wave is equal to or smaller than the maximum thickness of the sedimentary layer in the basin will the basin have a 2-D seismic response. Therefore, for the wide Weihe Basin, which contains a thick sedimentary layer, the Ricker wavelet with a dominant frequency of 1 Hz was selected as the source time function; while for the Luoquanli Basin, which is a small basin with a thin sedimentary layer, the Ricker wavelet with a predominant frequency of 4 Hz was selected as the source time function. The two source time functions are shown in Figure 1.
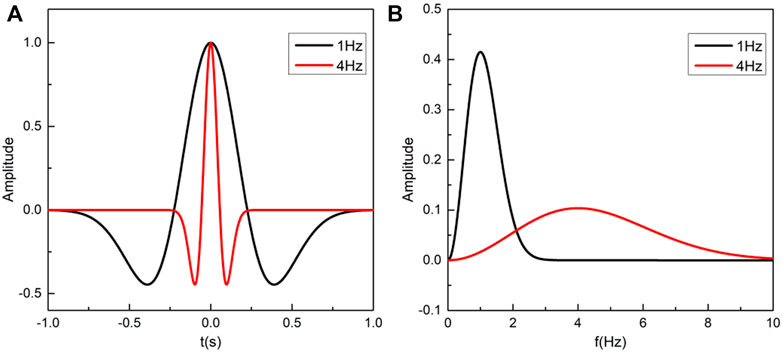
FIGURE 1. Ricker wavelets: (A) time history of Ricker pulse and (B) corresponding Fourier amplitude spectrum.
3 Basin model
3.1 Two geophysical prospecting profiles
The first profile selected in this paper is a high-resolution refraction detection section across the Weihe Basin in China. The Weihe Basin lies in the middle and lower reaches of the Weihe River between latitudes 34°00′ and 35°10′ N and longitudes 107°00′ and 110°20′ E. It adjoins the Ordos basin in the north, Qinling Mountains in the south and west, Yellow river in the east. The total area of the Weihe Basin is 3.9 × 10⁴ km2, with a length of 360 km from west to east and a width of 30–85 km from north to south. Sedimentary within the region are generally between 1,000 and 5,000 m in thickness, but maxima exceeds 7,000 m. The bottom to top strata are continuously deposited from the Paleogene through the Neogene to the Quaternary, and the strata have sedimentary characteristics such as large formation thickness, obvious north-south differentiation of the phase zone, and rapid change of lithological composition (Li et al., 2021). The geologic map and the location of the prospecting profile are shown in Figure 2. This study only focused on the amplification effect of the basin’s structure on the ground motion without considering the topographic effect. The data above the elevation of the credible velocity structure data of the profile were removed, and only the data below an elevation of 0.5 km were retained. The velocity structure of the geophysical profile is shown in Figure 3. The profile shows that the velocity contour line between 50 and 160 km is concave, forming a basin structure. The velocity value in the basin is significantly lower than the velocity values on both sides. The depth of the basin’s basement is about 8.0 km, and the basin structure corresponds to the depression of the Pre-Sinian crystalline basement in this region, this is consistent with the geological profile. The geophysical profile shows that the velocity structure and sedimentary thickness of the profile vary greatly laterally, and the bedrock is exposed near 40 km. However, in the Weihe Basin, the deposition of the strata above −2 km is relatively stable, and the strata below −2 km exhibit obvious anisotropy.
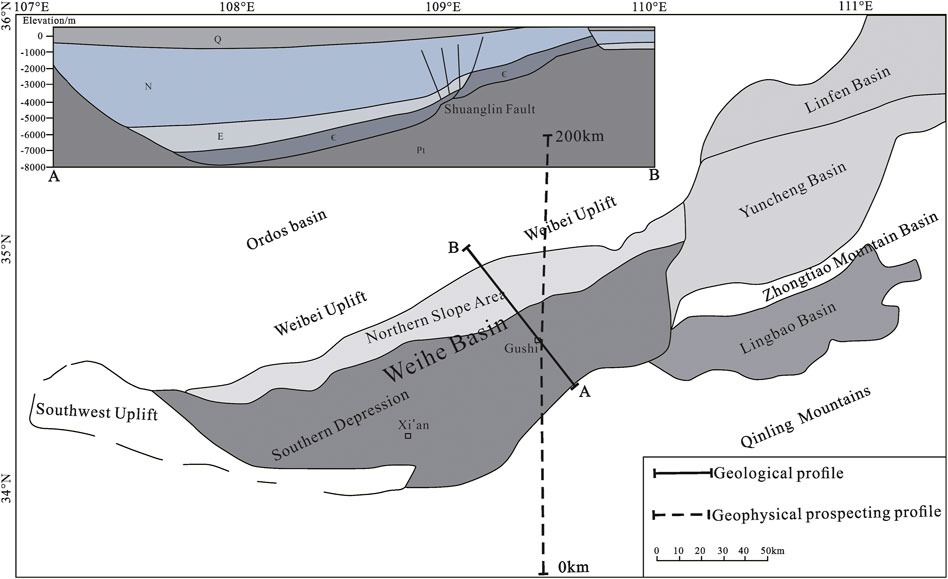
FIGURE 2. The geologic map of Weihe basin (Li et al., 2021).
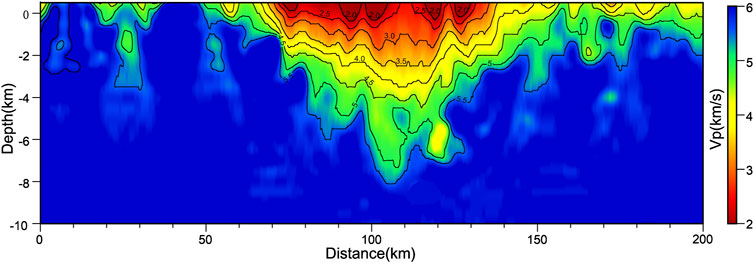
FIGURE 3. The velocity structures of geophysical profile of Weihe basin.
To study the response of the ground motion in small basins, the second profile selected in this paper is a high-resolution refraction detection section passing through the Luoquanli meteorite crater, with a section length of 3.0 km. The crater is located at 40°21′55″ N, 123°27′34″ E in the northern part of Liaodong Peninsula of northern China. It is a simple bowl-shaped crater located in a low mountain-hill region, which was formed in the Early Proterozoic metamorphic rockseries composed of leucoleptite, hornblendite, gneiss, and marble (Qin et al., 2001). The crater is an approximately pentagonal structure with a rim-to-rim diameter of about 1800 m. The rim crest and both sides of rim are mostly covered with weathering soil, eluvial and diluvial deposits up to several meters thick. A few spots with exposed basement rocks (mainly leucoleptite) emerge from the rim walls (Chen et al., 2010). The crater floor is covered with Quaternary lacustrine sediments, with organic-rich lacustrine sediments in the upper part and loose brecciated rock debris and shock breccia accumulation in the lower part. The geologic map is shown in Figure 4, and the sketch of geological profile of the crater is shown in Figure 5. This basin exhibited an obvious seismic intensity anomaly during the Haicheng earthquake in 1975. The seismic intensity around the basin was 6 degree, while the seismic intensity inside the basin was 8 degree. The classification standard of the seismic intensity is consistent with the standard of the United States.
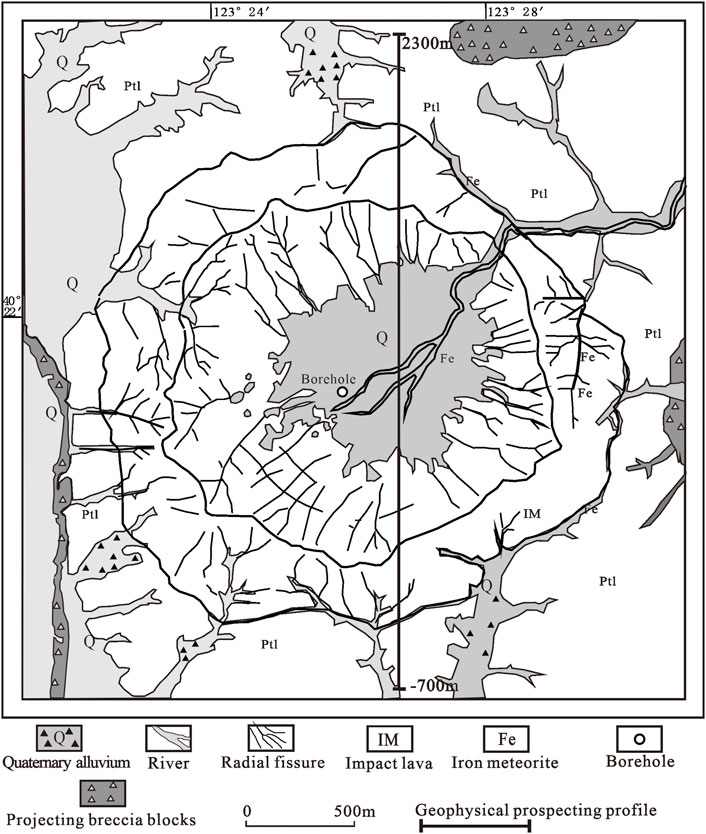
FIGURE 4. The geologic map of Luoquanli basin (Qin et al., 2001).
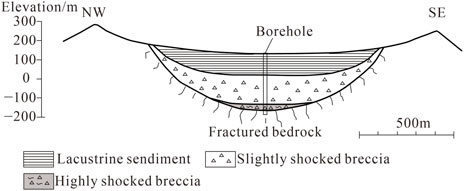
FIGURE 5. The sketch of geological profile of Luoquanli basin (Chen et al., 2010).
The location of the profile is shown in Figure 4, and the velocity structure of the geophysical profile is shown in Figure 6. It can be seen that in the lateral direction of the profile, the upper part of the profile shows that the velocity in the middle of the basin is low (minimum of approximately 1.4 km/s), and the velocity at the edge of the basin is high (up to 4.3 km/s), this corresponds to the weakly weathered bedrock surrounding the basin, as shown in Figure 4. In the vertical direction, the velocity variation range in the middle of the basin is larger (from 1.4 to 7.0 km/s), and the velocity variation range at the edge of the basin is smaller (from 4.3 to 7.0 km/s). The profile reveals the bowl shape of the basin, this is consistent with the sketch of geological profile, as shown in Figure 5. The deepest depth of the basement in the basin is approximately 830 m, with a velocity of approximately 7.0 km/s, which is rare in the stratum at the same depth. Is it the typical bowl-shaped structure that caused the anomalous intensity in the Luoquanli Basin? In this paper, we conduct related research to answer this question.
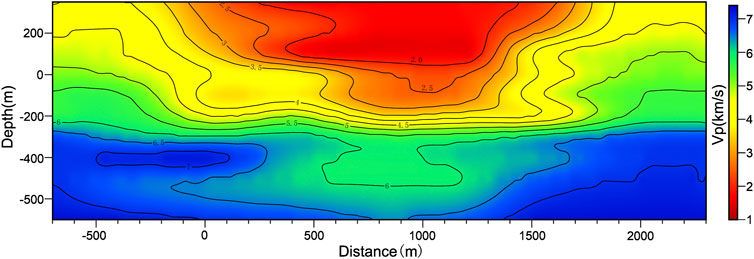
FIGURE 6. The velocity structures of geophysical profile of Luoquanli basin.
3.2 Finite element model
For the Weihe Basin profile, to reflect the inhomogeneity of the geophysical profile and save computational time, we divided the mesh by setting the mesh size of the deep homogeneous high-wave-speed structure to 400 m and the mesh size of the low-wave-speed structure with strong heterogeneity at shallow depths to 50 m. For the Luoquanli Basin profile, we set the mesh size to 10 m.
In the numerical simulation using the SEM, to ensure the accuracy of the simulation results, it is required that at least five Gauss-Lobatto-Legendre integration points be contained in each seismic wave wavelength, which means that the relationship between the mesh size of the model, the order of the Lagrange polynomial, and the shortest wavelength of the seismic waves is satisfied by the following condition:
where d is the mesh size, n is the order of the Lagrange polynomial, 4≤n≤8, and λm is the shortest wavelength of seismic waves.
For the Ricker wavelet source time function, we can obtain λm using the following equation, in which vs is the S-wave velocity in the medium, and fp is the predominant frequency of the Ricker wavelet:
The empirical relationship between the S-wave velocity (vs), P-wave velocity (vp), and Poisson’s ratio (σ) is as follows:
The geophysical profile reveals that the minimum P-wave velocity in the basin is approximately 1,500 m/s. According to experience, Poisson’s ratio of the sedimentary soil in this layer is approximately 0.33. According to Eq. 5, the minimum S-wave velocity is approximately 750 m/s. When the predominant frequency of the input Ricker wavelet is 1 and 4 Hz, the S-wave wavelength is approximately 300 and 75 m, respectively. Based on Eq. 3, the mesh size meets the computational accuracy requirements.
When conducting a ground motion simulation, many researchers usually deliberately divide the stratum into several layers, with obvious boundaries between each layer, and the medium properties of each layer adopt equivalent values or values that gradually increase with depth. However, the former technique artificially causes abrupt changes in the properties of the different strata, and the latter technique ideally assumes a gradual increase in the properties of the strata with depth, both of which are inconsistent with the real depositional processes in basins. The deposition of sedimentary layers in a basin is complex, that is, the strata are crisscrossed, and there may be interlayers or lenticular bodies. As is shown in the geophysical profiles in Figures 3, 6, there is generally no obvious medium interface. Therefore, in this paper, based on the velocity structure characteristics of the refraction profile, when we assign the medium parameters to the model, we assign the nearest velocity value of each mesh to the corresponding mesh. This approach can reflect the influence of the heterogeneity of the subsurface structure on the ground motion well.
The velocity value in the velocity structure of the geophysical profile is the P-wave velocity value, and the S-wave velocity value can be obtained using Eq. 5. The Poisson’s ratio of the soil layer can be set as 0.33 according to the empirical value. The Poisson’s ratio of the deep rock structure is determined according to Eq. 6, and the density is determined according to Eq. 7 based on previous research results (Brocher, 2005):
For the Weihe Basin profile, we directly construct the FE model according to the size of the profile. When studying the basin amplification effect, we construct a homogeneous model with the same size as a comparison to eliminate the influence of the boundary effect. For the Luoquanli Basin profile, we place the boundaries of the FE model far away from the basin to eliminate the influence of the boundary effect.
4 Discussion
For the Weihe Basin profile model, the time step is set as 0.0005 s. To simulate the basin effects completely, 200,000 steps are calculated, and the total calculation time is 100 s. For the Luoquanli profile model, the time step is set as 0.0001 s, 100,000 steps are calculated, and the calculation time is 10 s.
4.1 Seismic response characteristics of the Weihe Basin profile
4.1.1 Time history characteristics
In this paper, 401 receivers are set on the surface of the 200 km long geophysical profile model. To facilitate the analysis of the impact of the velocity structure on the ground motion, the geophysical profile is also drawn under the time history arrangement diagram (Figure 7). It can be seen from Figure 7 that the initial arrival time of the seismic waves in the 3–15 and 38–48 km sections where bedrock is exposed at the surface is earlier than at the other receivers, and the time history of seismic waves in these two sections shows that the high frequency of the ground motion is predominant, especially in the 38–48 km section where the bedrock penetrates from the bottom of the profile to the surface. The sections with low-wave-speed sedimentary layers exert a filtering effect on the high-frequency ground motion, such as the 16–38 km section and the 50–160 km section in the Weihe Basin. Moreover, the Weihe Basin section exerts a significant amplification effect on the low-frequency ground motion. The lateral heterogeneity of the medium in the Weihe Basin leads to an abundance of surface waves within the basin, and the surface waves generated at the basin’s edge form an X shape in the middle of the basin as they propagate laterally into the interior of the basin, which is consistent with the effects of a simple ideal 2-D basin model (Riga et al., 2016; Zhu, 2018). However, because the basin is wide and the sedimentary layers in the basin are soft, the surface wave attenuates rapidly when it propagates laterally, and there is no back and forth oscillating surface wave in the middle of the basin.
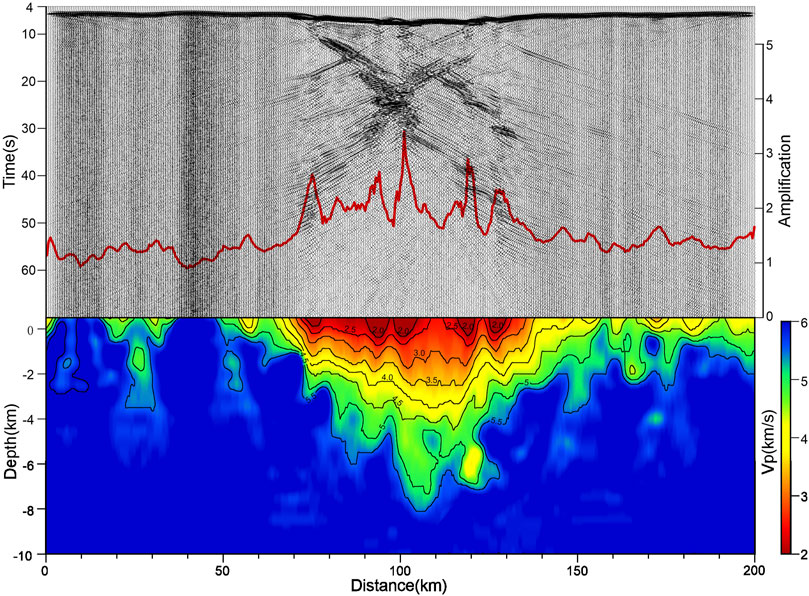
FIGURE 7. The acceleration time history of the Weihe Basin profile model and the velocity structure profile.
In this paper, the amplitude ratios of the acceleration time history of the receivers at the same location in the geophysical profile model and the homogeneous bedrock model are calculated (red line in Figure 7). The coordinate axis of the amplification factor is shown on the right side of the figure. As can be seen from this curve, the profile section with relatively soft sedimentary layers amplifies the ground motion significantly, and the shape of the amplification factor curve is a mirror image of the velocity structure contour of the geophysical profile, which is consistent with the results of previous studies (Aki and Larner, 1970; Field, 2000; Frankel et al., 2002; Fletcher and Wen 2005). In this paper, we only study the duration of the ground motion in the 50–150 km section in the Weihe Basin (Figure 8), from which we can see that due to the diffraction of the seismic waves off the edge of the basin, the duration of the ground motion at the edge of the basin is relatively long; while in the central part of the basin, the duration of the ground motion is shorter due to the absorption effect of the relatively soft sedimentary layers.
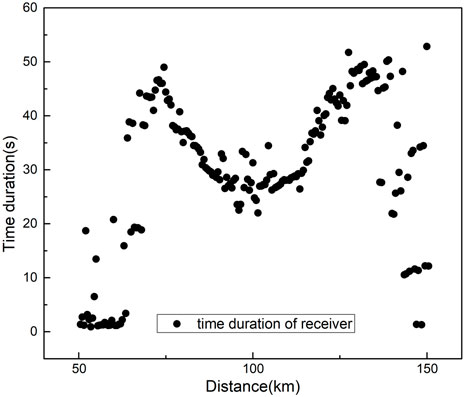
FIGURE 8. The acceleration time history duration lengthening of the receivers in the Weihe Basin.
4.1.2 Amplifying effect of the Weihe Basin geophysical profile on ground motion
In this paper, we use the spectral ratios of 401 receivers at the same locations in the two models to study the basin’s amplification effect.
It can be seen from the spectral ratio results that the basin section (50–160 km) is mainly used to amplify the spectral value of the period band (0.7–2 s). The spectral ratio results for some of the receivers are shown in Figure 9, and the data in the upper right corner of the graph indicate the receiver location. It can be seen from Figure 9 that the basin section does not produce greater amplification of the spectral value of the long-period section, which may be due to the following three reasons. First, when the periods of the seismic waves propagating vertically upward are greater than the threshold value, the long-period seismic waves are suppressed because their wavelength is greater than the thickness of the basin’s sedimentary layer (Day et al., 2005). Second, in such a wide basin with a small depth/width ratio, the surface waves generated at the edge will decay and disappear after a long distance of lateral propagation, and they cannot form a back and forth oscillating surface wave. Therefore, the surface waves cannot be superimposed many times and thus produce a greater amplification of the long-period ground motion. Third, the wave-speed of the sedimentary layers in the basin section that is revealed by the geophysical profiles is large, and the nonlinear characteristics of the sedimentary layers are not shown.
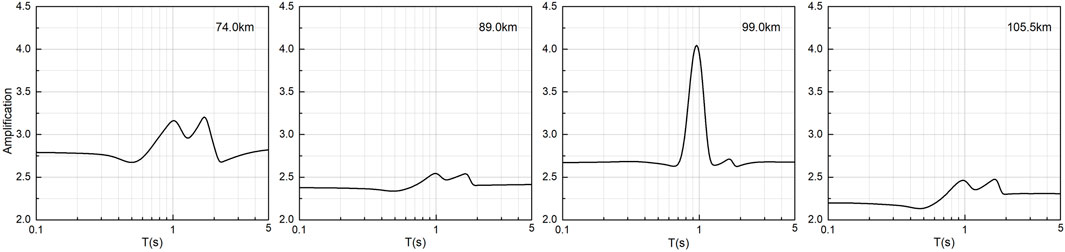
FIGURE 9. The spectral ratios of some of the receivers in the Weihe Basin profile model.
According to Field’s method (Field, 2000), the depth to the vs = 2.5 km/s horizon beneath the site is used as the basement depth of the basin. According to Eq. 5, the depth to the vp = 4.5 km/s horizon beneath the site (written as Zvp = 4.5) can be used as the basement depth of the basin. The functional relationship between the spectral ratio y1 and the burial depth x1 of the basement in the basin is established:
The least squares method is used to fit the data from the 401 receivers. The fitting parameters of several periods are presented in Table 1, and the fitting results are shown in Figure 10, from which it can be seen that the correlation between the spectral ratio and the basement burial depth is strong, which is consistent with numerous previous research results (e.g., Frankel et al., 2001; Hartzell et al., 2016). Therefore, for a wide basin, the depth of the basin plays a dominant role in the amplification of the ground motion. From the fitted relationship curve, it can be seen that the value of the spectral ratio increases gradually as the buried depth of the basement increases, and it starts to decrease slowly when the value of the spectral ratio increases to a certain value. It can be concluded that when the burial depth of the basement is relatively shallow, the sedimentary layer plays a leading role in the amplification of the ground motion. When the burial depth of the basement exceeds a certain depth, the relatively soft sedimentary layer will absorb more of the seismic wave energy and increase the attenuation of the ground motion. Therefore, this fitting curve is consistent with the propagation attenuation law of seismic waves, and this fitting curve is reasonable.
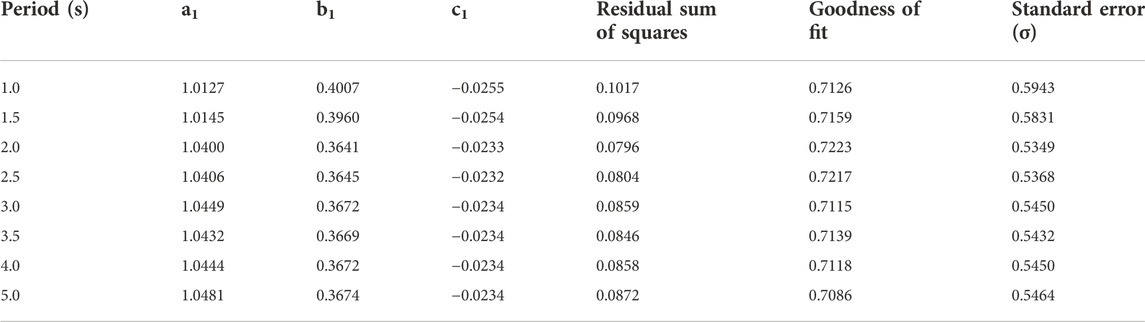
TABLE 1. Parameters of the fitting relationship between the spectral ratio and basement burial depth.

FIGURE 10. The relationship between the spectral ratio and basement burial depth.
Based on the distribution of the sample points of the basement burial depth and spectral ratio, the distribution of the sample points is scattered, and the spectral ratios corresponding to some basement burial depths differ greatly (e.g., the spectral ratios corresponding to basement burial depths of 3 and 7 km), which may be due to the differences in the velocity structure in the vertical direction within the same basement burial depth range.
Therefore, in this paper, we also fit the relationship between the average velocity within Zvp = 4.5 x2 and the spectral ratio y2. The following equation is the fitting equation, the fitting parameters for several periods are presented in Table 2, and the fitting results are shown in Figure 11:
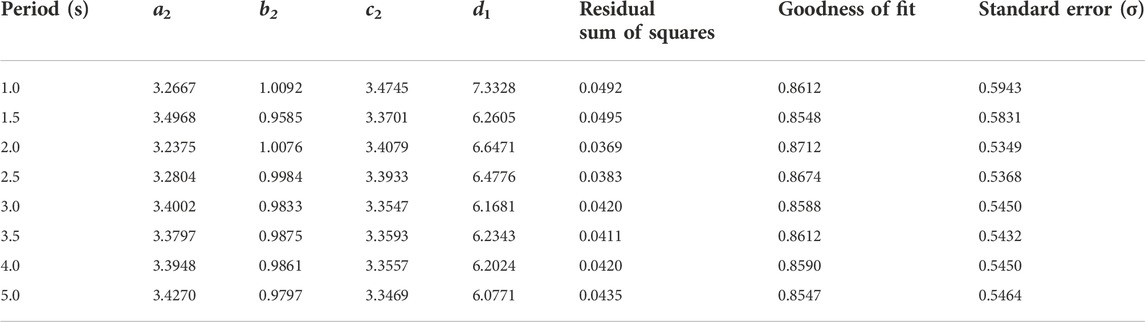
TABLE 2. Parameters of the fitting relationship between the spectral ratio and the velocity value.
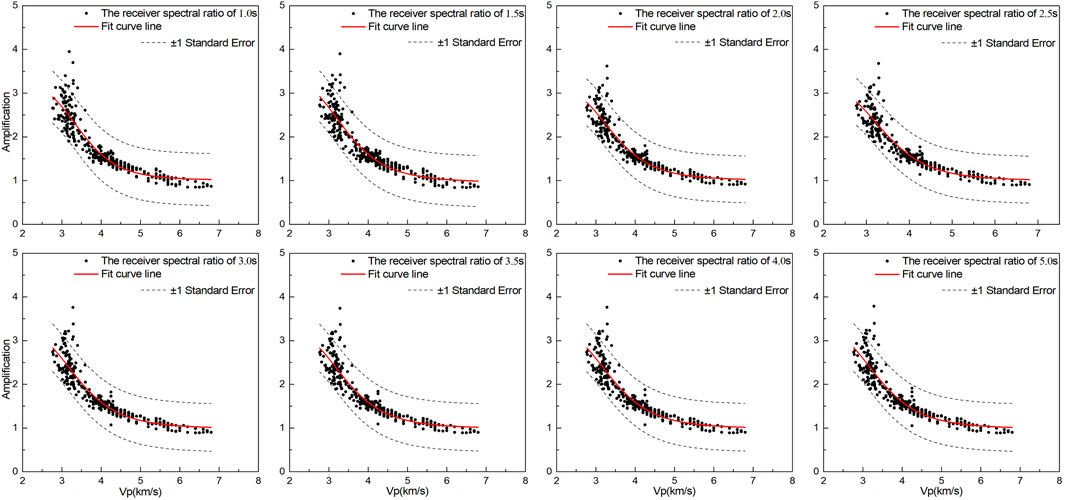
FIGURE 11. The relationship between the spectral ratio and the velocity.
The fitting relationship shows that the spectral ratio is more strongly correlated with the vertical velocity structure, and the goodness of fit is better than the fit of the previous relationship. The fitted curve shows that the fitted curve value tends to be 1 when the average velocity is greater than 6 km/s. This is consistent with the similar velocity values of the bedrock exposed in the Weihe Basin profile model and the homogeneous model. Therefore, this fitting curve is reasonable. In fact, due to the complexity of the depositional environment, the demarcation of the stratigraphic interface is not very obvious, so it may be more meaningful to statistically analyze the relationship between the spectral ratio and the mean value of the velocity in the vertical direction within a certain depth range when an accurate velocity structure profile is available.
4.2 Seismic response characteristics of the Luoquanli Basin profile
4.2.1 Time history characteristics
The time history arrangement diagram and geophysical profile are shown in Figure 12. It can be seen from the figure that the Luoquanli Basin has an obvious amplification effect on the ground motion, and the heterogeneity inside the basin produces obvious diffraction waves. The diffraction waves generated at the edge of the basin often appear as surface waves propagating toward the center of the basin. However, because the refraction geophysical profile can only reveal the high-wave-speed values in the basin, and the thickness of the sedimentary layers and the horizontal size of the basin are small, the surface waves and body waves are nearly completely mixed. Unlike in the wide Weihe Basin, the surface waves and body waves are slowly separated as they propagate toward the center of the basin, so the surface waves can be distinguished. It can be seen from Figure 12 that the initial arrival of the seismic waves and the lateral velocity structure distribution of the profile are closely related, and the initial arrival of the seismic waves is the latest in the central part of the basin, which has the smallest wave-speed values.
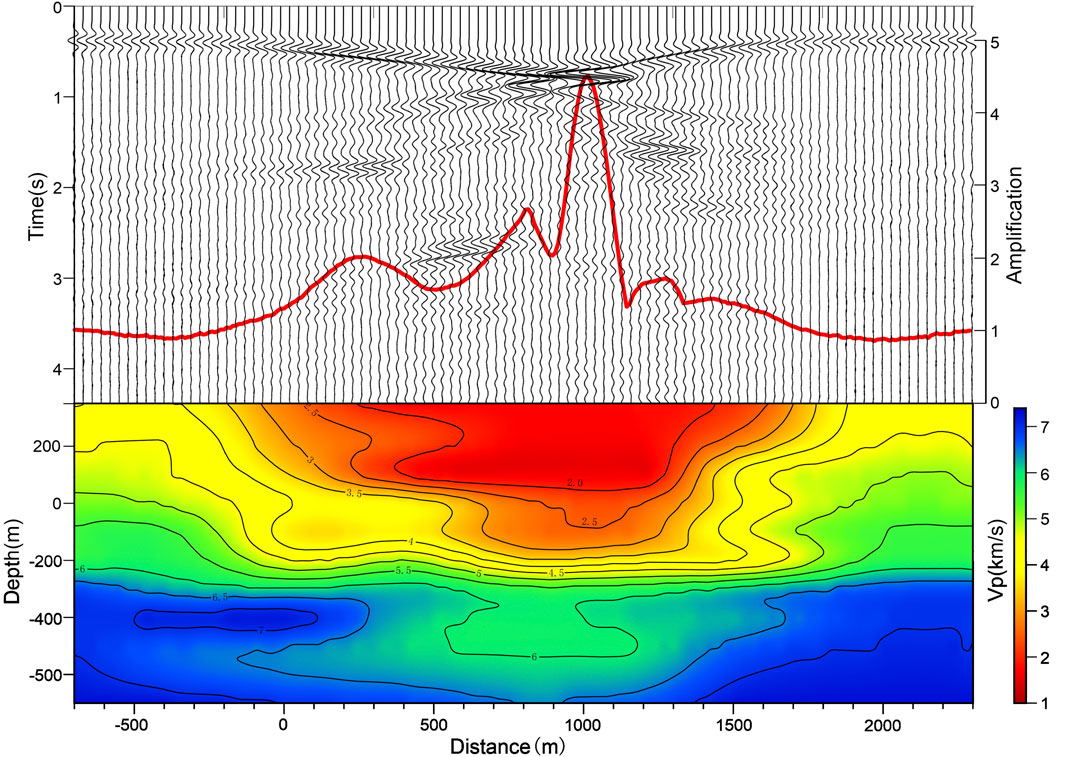
FIGURE 12. The acceleration time history of the Luoquanli Basin profile model and the velocity structure profile.
The amplitude of the time history of each receiver is normalized based on the amplitude of the receiver at the right edge of the basin (red line in Figure 12). The coordinate axis of the amplification factor is shown on the right side of Figure 12. It can be seen that the amplitude in the right-middle part of the basin is the largest. This abnormal amplification may be caused by the focusing effect of the bowl-shaped basin. In addition, from the time history waveform of the ground motion, we can see that the resolution of the velocity structure is important to the ground motion simulation. A velocity structure with a higher resolution can reveal the small subsurface heterogeneities, and these small heterogeneous geological bodies can diffract the seismic waves, thus prolonging the duration of the ground motion.
4.2.2 Amplifying effect of the Luoquanli Basin geophysical profile on ground motion
Since this paper adopts the vertical incidence of plane waves, the effect of the difference in the propagation path on the distribution of the ground motion can be ignored. We adopt the standard spectral ratio method to study the amplification effect in the Luoquanli Basin and investigate the cause of the seismic intensity anomaly in the center of the Luoquanli Basin by calculating the spectral ratio between the receivers inside the basin and a weakly weathered bedrock site receiver at the edge of the basin.
From the spectral ratio results, it can be seen that the profile section (0–1,500 m) amplifies the spectral value of the period band (0.2–0.5 s) more significantly. The spectral ratios of some of the receivers are shown in Figure 13, and the data in the upper right corner represents the locations of the receivers. There may be two reasons for this. First, this special bowl-shaped structure tends to produce a focusing effect on the seismic waves, and this focusing effect amplifies the high-frequency ground motion more significantly (Davis et al., 2000; Sahar and Narayan, 2016). Second, when the vertical upward propagating seismic wave period is greater than the threshold value, the long-period seismic wave is suppressed because the wavelength is larger than the thickness of the sedimentary layer in the basin.
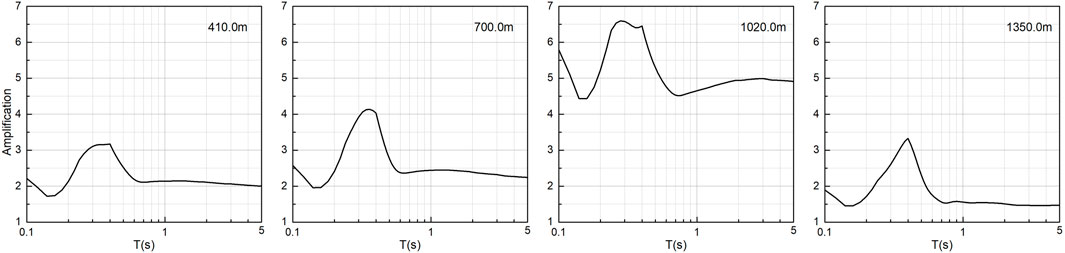
FIGURE 13. The spectral ratios of some of the receivers in the Luoquanli Basin profile model.
The relationship between the spectral ratio and Zvp = 4.5 is shown in Figure 14. It can be seen from Figure 14 that there is a tendency for the spectral ratios to increase as the basement depth increases when the basement depth is less than 500 m, but the increase is relatively slow. When the basement depth is greater than 500 m, that is, mainly near the center of the basin, the spectral ratios of the receivers above the bottom of the bowl with a burial depth of approximately 600 m vary greatly (from 2.06 to 6.59). It can be seen that the spectral ratios at the center of this small basin have little to do with the burial depth of the basin’s basement, and the amplification of the ground motion is mainly related to the lateral velocity structure of the basin or the geometric characteristics of the basin’s basement. For this basin, the anomalous amplification of the ground motion by the center of the basin may be due to the focusing effect of this bowl-like structure on the seismic waves, which is consistent with the results of previous studies (Aki and Larner, 1970; Gao et al., 1996; Alex and Olsen, 1998; Davis et al., 2000; Baher and Davis, 2003; Stephenson et al., 2006; Sahar and Narayan, 2016). This may be the reason for the anomaly in seismic intensity in the Luoquanli Basin.
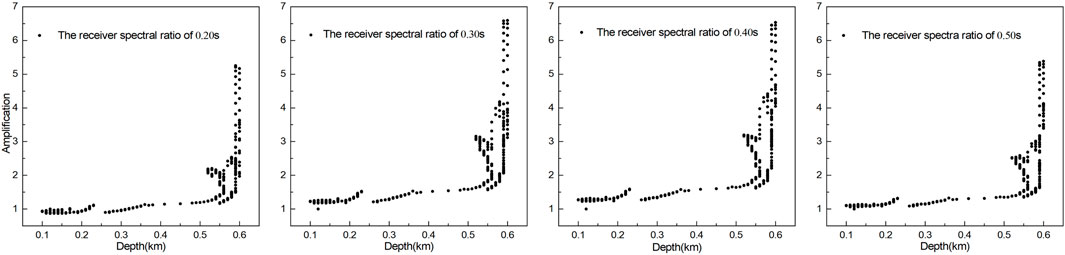
FIGURE 14. The relationship between the spectral ratio and the burial depth of the basement.
5 Conclusion and perspectives
Based on two 2-D geophysical profiles for two basins with different structures, in this study, we analyzed the seismic response characteristics of a broad 2-D basin model and a small bowl-shaped basin model. For the wide Weihe Basin, compared with Zvp = 4.5, the average velocity within Zvp = 4.5 in the vertical direction is more closely related to the amplification factor of the response spectrum. Therefore, the thickness of the sedimentary layer and the mean velocity value in the vertical direction tend to dominate the basin effects and play a dominant role in the amplification of the basin in wide basins. For the small Luoquanli Basin, the arc-shaped basement produces additional amplification of the ground motion. In the case of small basins, the special geometry of the basin’s basement tends to dominate the basin amplification effect.
This study is the first attempt to simulate ground motion based on 2-D geophysical profiles, and there are many shortcomings. For example, only the vertical incidence of the plane wave was considered, and the influence of the loose soft soil layer on the ground motion was not considered. The results obtained do not have strong engineering significance. Therefore, these factors should be considered in the next stage of this research.
Data availability statement
The original contributions presented in the study are included in the article/Supplementary Materials, further inquiries can be directed to the corresponding author.
Author contributions
CW: investigation, data curation, and writing—original draft preparation. WQ, JB, and FW: conceptualization and investigation. SW: investigation. HX: visualization and editing.
Funding
Scientific Research Fund of Institute of Engineering Mechanics, China Earthquake Administration (Grant No. 2019C06).
Acknowledgments
We thank LetPub (www.letpub.com) for its linguistic assistance during the preparation of this manuscript.
Conflict of interest
The authors declare that the research was conducted in the absence of any commercial or financial relationships that could be construed as a potential conflict of interest.
Publisher’s note
All claims expressed in this article are solely those of the authors and do not necessarily represent those of their affiliated organizations, or those of the publisher, the editors and the reviewers. Any product that may be evaluated in this article, or claim that may be made by its manufacturer, is not guaranteed or endorsed by the publisher.
Abbreviations
SEM, spectral element method; Zvp = 4.5, the depth to the vp = 4.5 km/s horizon beneath the site; FE, finite element; GMPE, ground-motion prediction equation.
References
Abrahamson, N. A., Silva, W. J., and Kamai, R. (2014). Summary of the ASK14 ground motion relation for active crustal regions. Earthq. Spectra 30 (3), 1025–1055. doi:10.1193/070913EQS198M
Aki, K., and Larner, K. L. (1970). Surface motion of a layered medium having an irregular interface due to incident planeSHwaves. J. Geophys. Res. 75, 933–954. doi:10.1029/JB075i005p00933
Alex, C. M., and Olsen, K. B. (1998). Lens-effect in santa monica? Geophys. Res. Lett. 25 (18), 3441–3444. doi:10.1029/98GL52668
Baher, S. A., and Davis, P. M. (2003). An application of seismic tomography to basin focusing of seismic waves and Northridge earthquake damage. J. Geophys. Res. 108 (B2), 1610. doi:10.1029/2001JB001610
Bard, P. Y., and Bouchon, M. (1985). The two-dimensional resonance of sediment-filled valleys. Bull. Seismol. Soc. Am. 75 (2), 519–541. doi:10.1785/BSSA0750020519
Bielak, J., Graves, R. W., Olsen, K. B., Taborda, R., RamÃrez-Guzmán, L., Day, S. M., et al. (2010). The ShakeOut earthquake scenario: Verification of three simulation sets. Geophys. J. Int. 180 (1), 375–404. doi:10.1111/j.1365-246X.2009.04417.x
Boore, D. M., Stewart, J. P., Seyhan, E., and Atkinson, G. M. (2014). NGA-West2 equations for predicting PGA, PGV, and 5% damped PSA for shallow crustal earthquakes. Earthq. Spectra 30 (3), 1057–1085. doi:10.1193/070113EQS184M
Brocher, T. M. (2005). Empirical relations between elastic wavespeeds and density in the Earth's crust. Bull. Seismol. Soc. Am. 95 (6), 2081–2092. doi:10.1785/0120050077
Campbell, K. W., and Bozorgnia, Y. (2014). NGA-West2 ground motion model for the average horizontal components of PGA, PGV, and 5% damped linear acceleration response spectra. Earthq. Spectra 30 (3), 1087–1115. doi:10.1193/062913EQS175M
Campbell, K. W. (1997). Empirical near-source attenuation relationships for horizontal and vertical components of peak ground acceleration, peak ground velocity, and pseudo-absolute acceleration response spectra. Seismol. Res. Lett. 68 (1), 154–179. doi:10.1785/gssrl.68.1.154
Chaljub, E., Maufroy, E., Moczo, P., Kristek, J., Hollender, F., Bard, P. Y., et al. (2015). 3-D numerical simulations of earthquake ground motion in sedimentary basins: Testing accuracy through stringent models. Geophys. J. Int. 201 (1), 90–111. doi:10.1093/gji/ggu472
Chen, M., Xiao, W., Xie, X., Tan, D., and Cao, Y. (2010). Xiuyan crater, China: Impact origin confirmed. Chin. Sci. Bull. 55 (17), 1777–1781. doi:10.1007/s11434-010-3010-1
Chiou, B. S. J., and Youngs, R. R. (2014). Update of the Chiou and Youngs NGA model for the average horizontal component of peak ground motion and response spectra. Earthq. Spectra 30 (3), 1117–1153. doi:10.1193/072813EQS219M
Davis, P. M., Rubinstein, J. L., Liu, K. H., Gao, S. S., and Knopoff, L. (2000). Northridge earthquake damage caused by geologic focusing of seismic waves. Science 289 (5485), 1746–1750. doi:10.1126/science.289.5485.1746
Day, S. M., Bielak, J., Larsen, S., Graves, R. W., Pitarka, A., and Olsen, K. B. (2005). 3D ground motion simulation in basins. Final report to Pacific earthquake engineering research center. Final Report.
Denolle, M. A., Miyake, H., Nakagawa, S., Hirata, N., and Beroza, G. C. (2014). Long-period seismic amplification in the Kanto basin from the ambient seismic field. Geophys. Res. Lett. 41 (7), 2319–2325. doi:10.1002/2014GL059425
Field, E. H. (2000). A modified ground-motion attenuation relationship for southern California that accounts for detailed site classification and a basin-depth effect. Bull. Seismol. Soc. Am. 90 (6B), S209–S221. doi:10.1785/0120000507
Fletcher, J. B., and Wen, K. L. (2005). Strong ground motion in the Taipei basin from the 1999 Chi-Chi, Taiwan, earthquake. Bull. Seismol. Soc. Am. 95 (4), 1428–1446. doi:10.1785/0120040022
Frankel, A., Carver, D., Cranswick, E., Bice, T., Sell, R., and Hanson, S. (2001). Observations of basin ground motions from a dense seismic array in San Jose, California. Bull. Seismol. Soc. Am. 91 (1), 1–12. doi:10.1785/0120000071
Frankel, A. D., Carver, D. L., and Williams, R. A. (2002). Nonlinear and linear site response and basin effects in Seattle for the M 6.8 Nisqually, Washington, earthquake. Bull. Seismol. Soc. Am. 92 (6), 2090–2109. doi:10.1785/0120010254
Gao, S., Liu, H., Davis, P. M., and Knopoff, L. (1996). Localized amplification of seismic waves and correlation with damage due to the Northridge earthquake: Evidence for focusing in santa monica. Bull. Seismol. Soc. Am. 86 (1B), S209–S230. doi:10.1785/BSSA08601BS209
Gelagoti, F., Kourkoulis, R., Anastasopoulos, I., and Gazetas, G. (2012). Nonlinear dimensional analysis of trapezoidal valleys subjected to vertically propagating SV waves. Bull. Seismol. Soc. Am. 102 (3), 999–1017. doi:10.1785/0120110182
Graves, R. W., Pitarka, A., and Somerville, P. G. (1998). Ground-motion amplification in the Santa Monica area: Effects of shallow basin-edge structure. Bull. Seismol. Soc. Am. 88 (5), 1224–1242. doi:10.1785/BSSA0880051224
Hartzell, S., Leeds, A. L., Ramirez-Guzman, L., Allen, J. P., and Schmitt, R. G. (2016). Seismic site characterization of an urban sedimentary basin, Livermore Valley, California: Site response, basin-edge-induced surface waves, and 3D simulations. Bull. Seismol. Soc. Am. 106 (2), 609–631. doi:10.1785/0120150289
He, C. H., Wang, J. T., Zhang, C. H., and Jin, F. (2015). Simulation of broadband seismic ground motions at dam canyons by using a deterministic numerical approach. Soil Dyn. Earthq. Eng. 76, 136–144. doi:10.1016/j.soildyn.2014.12.004
Iyisan, R., and Khanbabazadeh, H. (2013). A numerical study on the basin edge effect on soil amplification. Bull. Earthq. Eng. 11 (5), 1305–1323. doi:10.1007/s10518-013-9451-6
Kawase, H. (1996). The cause of the damage belt in kobe: "the basin-Edge effect," constructive interference of the direct S-wave with the basin-induced diffracted/Rayleigh waves. Seismol. Res. Lett. 67 (5), 25–34. doi:10.1785/gssrl.67.5.25
Komatitsch, D., Liu, Q., Tromp, J., Suss, P., Stidham, C., and Shaw, J. H. (2004). Simulations of ground motion in the Los Angeles basin based upon the spectral-element method. Bull. Seismol. Soc. Am. 94 (1), 187–206. doi:10.1785/0120030077
Komatitsch, D., and Vilotte, J. P. (1998). The spectral element method: An efficient tool to simulate the seismic response of 2D and 3D geological structures. Bull. Seismol. Soc. Am. 88 (2), 368–392. doi:10.1785/BSSA0880020368
Lee, S. J., Chan, Y. C., Komatitsch, D., Huang, B. S., and Tromp, J. (2009). Effects of realistic surface topography on seismic ground motion in the Yangminshan region of Taiwan based upon the spectral-element method and LiDAR DTM. Bull. Seismol. Soc. Am. 99 (2A), 681–693. doi:10.1785/0120080264
Lee, S. J., Chen, H. W., and Huang, B. S. (2008a). Simulations of strong ground motion and 3D amplification effect in the Taipei Basin by using a composite grid finite-difference method. Bull. Seismol. Soc. Am. 98 (3), 1229–1242. doi:10.1785/0120060098
Lee, S. J., Chen, H. W., Liu, Q., Komatitsch, D., Huang, B. S., and Tromp, J. (2008b). Three-dimensional simulations of seismic-wave propagation in the Taipei basin with realistic topography based upon the spectral-element method. Bull. Seismol. Soc. Am. 98 (1), 253–264. doi:10.1785/0120070033
Lee, Y., and Anderson, J. G. (2000). Potential for improving ground-motion relations in southern California by incorporating various site parameters. Bull. Seismol. Soc. Am. 90, S170–S186. doi:10.1785/0120000509
Li, K., Xu, S., Li, W., and Ma, Y. (2021). Restoration of Neogene sedimentary paleoenvironment in gushi sag, Weihe basin. Chin. J. Geol. 56, 1134–1146. doi:10.12017/dzkx.2021.061
Maufroy, E., Chaljub, E., Theodoulidis, N. P., Roumelioti, Z., Hollender, F., Bard, P. Y., et al. (2017). Source-related variability of site response in the mygdonian basin (Greece) from accelerometric recordings and 3D numerical simulations. Bull. Seismol. Soc. Am. 107 (2), 787–808. doi:10.1785/0120160107
Olsen, K. B. (2000). Site amplification in the Los Angeles basin from three-dimensional modeling of ground motion. Bull. Seismol. Soc. Am. 90 (6B), S77–S94. doi:10.1785/0120000506
Qin, G., Lu, D., and Ou, Q. (2001). The discovery of PGE anormaly and platina from Luoquanli impact crater. Earth Sci. Front. 8 (2), 333–338.
Riga, E., Makra, K., and Pitilakis, K. (2016). Aggravation factors for seismic response of sedimentary basins: A code-oriented parametric study. Soil Dyn. Earthq. Eng. 91, 116–132. doi:10.1016/j.soildyn.2016.09.048
Roten, D., Fäh, D., Cornou, C., and Giardini, D. (2006). Two-dimensional resonances in Alpine valleys identified from ambient vibration wavefields. Geophys. J. Int. 165 (3), 889–905. doi:10.1111/j.1365-246X.2006.02935.x
Sahar, D., and Narayan, J. P. (2016). Quantification of focusing effects of the semi-spherical and semi-cylindrical synclinal basement topography on ground motion characteristics. J. Seismol. 20 (1), 167–183. doi:10.1007/s10950-015-9518-8
Shani-Kadmiel, S., Tsesarsky, M., Louie, J. N., and Gvirtzman, Z. (2012). Simulation of seismic-wave propagation through geometrically complex basins: The Dead Sea basin. Bull. Seismol. Soc. Am. 102 (4), 1729–1739. doi:10.1785/0120110254
Steidl, J. H., and Lee, Y. (2000). The SCEC Phase III strong-motion database. Bull. Seismol. Soc. Am. 90 (6B), S113–S135. doi:10.1785/0120000511
Stephenson, W. J., Frankel, A. D., Odum, J. K., Williams, R. A., and Pratt, T. L. (2006). Toward resolving an earthquake ground motion mystery in west Seattle, Washington State: Shallow seismic focusing may cause anomalous chimney damage. Geophys. Res. Lett. 33 (6), 5037. doi:10.1029/2005GL025037
Zhang, W., Zhang, Z., Fu, H., Li, Z., and Chen, X. (2019). Importance of spatial resolution in ground motion simulations with 3-D basins: An example using the tangshan earthquake. Geophys. Res. Lett. 46 (21), 11915–11924. doi:10.1029/2019GL084815
Zhang, X., Peng, X., Li, X., Zhou, Z., Mebarki, A., Dou, Z., et al. (2020). Seismic effects of a small sedimentary basin in the eastern Tibetan plateau based on numerical simulation and ground motion records from aftershocks of the 2008 Mw7.9 Wenchuan, China earthquake. J. Asian Earth Sci. 192, 104257–104265. doi:10.1016/j.jseaes.2020.104257
Keywords: geophysical prospecting profile, ground motion simulation, spectral ratio, the thickness of the basin sedimentary layer, basement geometry
Citation: Wang C, Qi W, Bo J, Wang F, Wang S and Xin H (2023) Research on basin effect based on 2-D geophysical prospecting profile. Front. Earth Sci. 10:987510. doi: 10.3389/feart.2022.987510
Received: 06 July 2022; Accepted: 14 September 2022;
Published: 09 January 2023.
Edited by:
Ahmed M. Eldosouky, Suez University, EgyptCopyright © 2023 Wang, Qi, Bo, Wang, Wang and Xin. This is an open-access article distributed under the terms of the Creative Commons Attribution License (CC BY). The use, distribution or reproduction in other forums is permitted, provided the original author(s) and the copyright owner(s) are credited and that the original publication in this journal is cited, in accordance with accepted academic practice. No use, distribution or reproduction is permitted which does not comply with these terms.
*Correspondence: Wenhao Qi, cXdodGt5QDE2My5jb20=