- 1State Key Laboratory of Severe Weather, Chinese Academy of Meteorological Sciences, Beijing, China
- 2Guangzhou Institute of Tropical and Marine Meteorology, Guangzhou, China
- 3Shantou Meteorological Bureau, Shantou, China
In this study, an experiment based on the Dynamical-Statistical-Analog Ensemble Forecast model for Landfalling Typhoon Gale (DSAEF_LTG model) was conducted to predict tropical cyclone (TC)-induced potential maximum gales in South China for the first time. A total of 21 TCs with maximum gales greater than or equal to 17.2 m/s (at least one station) during 2011–2018 were selected for this experiment. Among them, 16 TCs in 2011–2015 were selected as the training samples aimed at identifying the best forecast scheme, while 5 TCs in 2016–2018 were selected as the independent samples to verify the best forecast scheme. Finally, the forecast results were compared with four numerical weather prediction (NWP) models (i.e., CMA, ECMWF, JMA and NCEP) based on four forecasting skill scores (Threat Score, False Alarm Ratio, Missing Ratio and Bias Score) at thresholds above Beaufort Scale 7 and 10, and two more indicators (Mean Absolute Error and pearson correlation coefficient). The results revealed encouraging forecasting ability in South China for the DSAEF_LTG model. In general, the DSAEF_LTG model showed higher forecasting skill than the NWP models above the critical thresholds. While the DSAEF_LTG model was prone to false alarms, the NWP models were prone to missing alarms, especially for an intense scale (≥Beaufort Scale 10). In addition, the DSAEF_LTG model also performed best with the smallest forecasting error. Furthermore, the DSAEF_LTG model had distinct advantages in predicting target TCs with typical tracks and widespread gales, both in terms of the wind field pattern and the magnitude of central wind speeds. However, for sideswiping TCs with small-scale gales, the DSAEF_LTG model tended to over-predict and held no advantage over the NWP models, which could perhaps be improved by introducing more reasonable ensemble forecast schemes in further research.
1 Introduction
A tropical cyclone (TC, also known as a typhoon in the western North Pacific) refers to a low-pressure system with a warm core that forms over tropical and subtropical warm oceans (Roy and Rita, 2012). China is one of the countries frequently affected by TC-related disasters in the world, with about 15 TCs affecting it each year and about 7 making landfall in coastal areas (Chen and Meng, 2001). Landfalling TCs are associated with heavy rainfall, strong winds and damaging storm surges (Peduzzi et al., 2012), of which strong winds is a non-negligible disaster-causing factor that triggers storm surges and further aggravates heavy-rain disasters (Powell and Reinhold, 2011). For example, the strong winds generated by super typhoon Rammasun in 2014 caused a huge number of casualties and the direct economic losses reached approximately CNY 26.55 billion (equivalent to approximately USD 4.2 billion) in South China (Wan et al., 2016). Therefore, accurate and timely forecasting of TC gales is of great significance in the prevention and mitigation of TC-related disasters.
At present, the main approaches to the prediction of TC-induced gales include empirical forecasts, statistical forecasts, numerical weather prediction (NWP) and their interpretations (Dong, 2014). Empirical forecasting is based on synoptic principles and the experience of forecasters, and an example would be the empirical model developed by Kaplan and DeMaria (1995) for predicting the decay of TC gales after landfall. More recently, the application of satellite cloud imagery (Chen and Zhang, 2008) and radar images (Zhi and Huang, 2020) have enhanced the reliability of empirical forecasts in short-impending predictions. Statistical forecasting utilizes large amounts of historical TC data as well as effective statistical methods to obtain objective and quantitative predictions. For instance, Li et al. (2016) proposed a quantitative forecast model for predicting the potential TC maximum gust in South China by exploring the relationship between observations and the main characteristics of TCs. In addition, Knaff et al. (2007) established a statistical-parametric model that adopted climatology and persistence to predict TC wind radii. Relying on the integration of atmospheric dynamic equations under certain initial conditions, NWP plays a key role in the forecasting of TC gales, and many forecasting institutions around the world have developed relevant products (e.g., high-resolution gridded forecasts of wind speed and TC wind speed probability) (Demaria et al., 2013; Lin et al., 2015). The interpretations of NWP indicate further analysis and modification on NWP outputs by statistical, dynamic or artificial intelligence methods are needed; for example, He et al. (2018) provided a model for predicting TC gust by introducing improved fruit fly optimization algorithm into fuzzy support vector machine to raise the applicability of WRF outputs.
Although the approaches mentioned above have shown encouraging results in research and operations, they still face complex challenges and need to overcome certain shortcomings for further improvements. For example, empirical forecasting is not objective enough, while statistical forecasting lacks consideration of TC physical mechanisms, and NWP as well as its interpretation are limited by the descriptions of physical processes (Li et al., 2021). Considerable attention has been paid in recent decades to improving the performance of TC forecasts, significantly, based on statistical methods and dynamical models (Zhang et al., 2016). The statistical–dynamical approach combines forecast information from dynamical model within a statistical framework to make the forecast (Charney et al., 1969; Carter et al., 1989). Knaff et al. (2017) developed a statistical–dynamical model to predict TC wind structure in terms of wind radii, which not only compared well with NWP, but its inclusion boosted the skill of consensus forecast. At the same time, there is a notable absence in existing models of applying the statistical–dynamical approach to provide forecast guidance on TC-induced potential maximum gales, which contributes to estimating the intensity and affected area of TC-related disasters about strong winds (Wang et al., 2017). With this deficiency in mind, Chen (2021) developed the Dynamical–Statistical–Analog Ensemble Forecast model for Landfalling Typhoon Gales (i.e., TC-induced potential maximum gale) (hereafter abbreviated to the DSAEF_LTG model), based on the DSAEF theory proposed by Ren et al. (2020). Preliminary application in a simulation experiment on Mangkhut in 2018 demonstrated that the DSAEF_LTG model was able to accurately simulate the pattern and central wind speeds of the potential maximum gale, performing better than NWP models.
Completed simulation experiments with single sample and large number of samples have both confirmed that the DSAEF_LTG model did well in simulating the intensity and spatial distributions of the potential maximum gale. Nevertheless, more attention needs to be paid to whether the model can show high forecast skill in operational application. Hence, it is necessary to carry out multi-sample forecast experiments to examine the forecasting ability of the DSAEF_LTG model, which is the motivation behind our study. Accordingly, 21 TCs that severely affected South China during the period 2011–2018 were selected to conduct forecast experiment in this paper.
Following this introduction, Section 2 presents the data and methods, including the forecasting procedures of the DSAEF_LTG model. Section 3 introduces the experimental design and how the best forecasting scheme was obtained and its performance verified. Section 4 compares the forecasting results of the DSAEF_LTG model to those from four select dynamic models. The summaries and discussions are given in Section 5.
2 Data and methods
2.1 Data
Based on revised NWP model outputs, the observed and predicted information of the target TCs in our experiment, including their tracks and intensity, were obtained from the National Meteorological Information Center (NMIC) of China Meteorological Administration (CMA). Historical TC best-track data, comprising the TC position and intensity at 6-h intervals since the 1960s (Ying et al., 2014), and Beaufort scale of wind speeds were both obtained from Shanghai Typhoon Institute of CMA (available from https://tcdata.typhoon.org.cn/).
Historical observed maximum 2-min average wind speeds of 10-m above the surface at 1-h intervals were provided by the NMIC of CMA from 1980 to 2018. For consistency, the stations with a cumulative absence time of more than 24 months were discarded, as were the stations above the mean station height of 894.7-m, in order to reduce the interference of alpine stations in separating TC-induced gales. Ultimately, the original data with 140 stations in South China (Guangdong, Guangxi and Hainan provinces) were retained in this study, and their geographical distribution is shown in Figure 1. Furthermore, the TC-induced potential maximum gale refers to the peak value of hourly maximum 2-min-averaged wind speed within a certain TC’s life for each station.
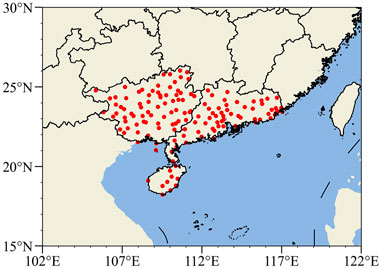
FIGURE 1. Spatial distribution of 140 stations in South China (Guangdong, Guangxi and Hainan provinces).
The gridded forecast datasets of 10-m zonal (u) and meridional (v) winds from The Observing System Research and Predictability Experiment (THORPEX) Interactive Grand Global Ensemble (TIGGE) control forecasts (available from https://apps.ecmwf.int/datasets/data/tigge/) were used to evaluate the forecasting performance of the DSAEF_LTG model. Specifically, the datasets were derived from following forecast centers: CMA, European Centre for Medium-Range Weather Forecasts (ECMWF), Japan Meteorological Agency (JMA) and National Centers for Environmental Prediction (NCEP), available on 1 × 1 grids with lead times of about 1–10 days at 6-h intervals and an initial time of 1200 UTC. For comparison, the resultant u and v wind speeds at each grid point were firstly calculated and then interpolated to the 140 stations mentioned above. Correspondingly, the TC-induced potential maximum gales of the NWP models refer to the maximum value of resultant wind speed at 6-h intervals within a certain TC’s life for each station.
2.2 DSAEF_LTG model
Figure 2 is a flowchart of how to apply the DSAEF_LTG model, which is composed of following four forecasting steps: 1) obtain the forecast track of the target TC; 2) construct generalized initial values (GIVs), including TC track, landfall date and current TC intensity; 3) identify the similarity of the GIVs constructed in the previous step between target and historical TCs; and 4) make an ensemble prediction about the potential maximum gale of target TCs. Table 1 lists the eight parameters and their physical significances involved in the DSAEF_LTG model (referring to the DSAEF_LTP model improved by Jia et al. (2020). For better understanding, values 16–20 of the similarity region (P2) in the parameters are shown in Figure 3. According to Table 1, each parameter has multiple values and they can combine randomly between different parameters. One combination is referred to as a forecast scheme and, as a result, 2,880,000 forecast schemes can be generated from eight parameters under idealized conditions.
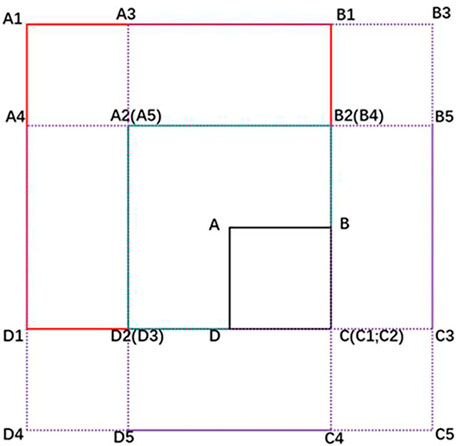
FIGURE 3. Schematic diagram of the 16th–20th similarity region (P2). C is the TC position at the initial time and A is the TC position at the maximum lead time, with ABCD denoting the first value of P2. The 16th value is a square (A1B1C1D1) with C as the southeastern vertex and a side length of 2000 km. B2 is the midpoint of B and B1, while D2 is the midpoint of D and D1, and A2B2C2D2 is a medium-sized rectangle as the 17th value of P2. Shifting A1B1C1D1 to the right by the distance of D1D2, down by the distance of B1B2, right by the distance of D1D2, and down by the distance of B1B2, simultaneously, produces A3B3C3D3, A4B4C4D4, and A5B5C5D5 as the 18th–20th values of P2, respectively.
The forecasting procedures of the DSAEF_LTG model can be summarized in more detail as follows: 1) first, the observed track before the initial time (P1) and the forecast track after the initial time, both obtained from NMIC of CMA, were merged into a complete track as the target TC track. 2) Next, the objective TC Track Similarity Area Index (TSAI) was calculated between the target TC track and all the historical TC tracks (before the target TC since 1980) in an established similarity region (P2), and then sorted in ascending order. A smaller TSAI implies a higher track similarity. In other words, P2, P3 and P4 codetermined the TC track similarity in this part. 3) based on the TC track similarity, the TC landfall season (P5) and TC intensity (P6) similarities were identified to eliminate the historical TCs that differed greatly from the target TC in landfall time and intensity. 4) Finally, an optimized ensemble forecast scheme (P8) was adopted to assemble the TC wind fields of the remaining top N historical TCs (where N was determined by P7), and the predicted potential maximum gale of the target TC was obtained.
2.3 Other methods
2.3.1 Track similarity area index
The TSAI is an objective technique to select analogous tracks from historical TC data (Ren et al., 2018). The principle of TSAI is to calculate the area enclosed by any 2 TC tracks—namely, the target TC and the historical TC in this study. The smaller the area value, the higher the similarity.
2.3.2 The improved objective synoptic analysis technique for landfalling TC-induced gale (OSAT_LTG)
The OSAT_LTG is used to separate and obtain TC-induced gales (i.e., wind speeds reaching 10.8 m/s and above) (Lu et al., 2016) and includes four steps as follows: 1) divide the gales into independent natural wind fields; 2) identify the potential TC wind field; 3) separate the gales for each station; and 4) combine the complete TC wind field. In this study, OSAT_LTG was also employed to obtain the list of historical TCs (i.e., experimental samples) with TC-induced gales in South China.
2.3.3 Forecast evaluations and skill scores
In this paper, four skill scores including Threat Score (TS), False Alarm Ratio (FAR), Missing Ratio (MR) and Bias Score (BS) are applied to compare the forecasting skill of the models above two critical thresholds. Meanwhile, two more indicators including Mean Absolute Error (MAE) and pearson correlation coefficient (R) are used to get a more complete evaluation of the forecast performances. Their calculation formulae are as follows:
The value of “hits” indicates the number of stations at which the prediction and observation both reach a certain magnitude; and“false alarms” is the number of stations where the prediction reaches a certain magnitude but the observation does not; while “misses” is the number of stations where the observation reaches a certain magnitude but the prediction does not. The TS, FAR and MR vary from 0 to 1. The closer the TS is to 1, the higher the forecast skill. However, for FAR and MR, higher values denote more serious false alarms and missing alarms, respectively. For better comparisons, all the BS values in this study were reduced by 1, and they further indicate whether the forecast results have tendencies to over-predictions (BS>0) or under-predictions (BS<0) (Wang et al., 2020).
The MAE and R are defined as where
3 Experimental design
3.1 The target TCs
Considering that the “landfalling typhoon” in the DSAEF_LTG model refers to the TC that had serious impacts caused by TC-induced gales on China, we set a primary inclusion criterion for a target TC—namely, a TC having maximum gale ≥17.2 m/s for at least one station in South China.
To keep a moderate sample size for the first forecasting application of the DSAEF_LTG model, together considering that 2018 is the last year for available historical observed wind speeds, 2011–2018 was selected as the analysis period of the target TCs. Specifically, the target TCs consist of training samples and independent samples, for the simulation and forecast experiments, respectively. For the forecast experiment, archived TIGGE data of NWP models is required for comparison. Then, considering that none of the target TCs in 2015 has archived TIGGE data, 16 TCs in 2011–2015 and 5 TCs in 2016–2018 were selected as training samples (Figure 4A) and independent samples (Figure 4B), respectively.
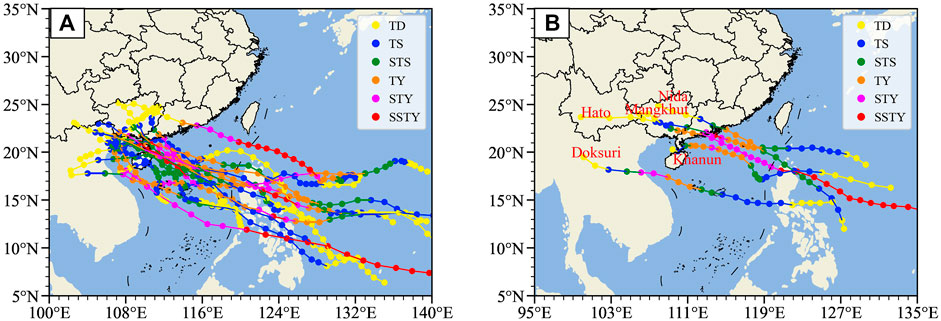
FIGURE 4. Tracks of the target TCs, including (A) 16 training samples in 2011–2015 and (B) five independent samples in 2016–2018. The names of the independent samples are also shown in (B).
3.2 Experimental design of the DSAEF_LTG model
We conducted both simulation and forecast experiment to explore the forecasting ability of the DSAEF_LTG model in predicting the TC-induced potential maximum gale in South China. The simulation experiment based on the training samples was aimed at identifying the best forecast scheme suitable for South China—in other words, the optimal value of each parameter in Table 2 with the best forecast performance. The purpose of the forecast experiment based on the independent samples was to verify the best forecast scheme. Meanwhile, we also compared the forecast results with those of the NWP models (CMA, ECMWF, JMA and NCEP) to gain a comprehensive and objective understanding of the DSAEF_LTG model.
Specifically, there are two steps to determine the best forecast scheme: firstly, screen the forecast schemes, applicable to all the training samples, from the forecast schemes generated by the simulation experiment; then, set an appropriate criterion to pick out the best forecast scheme. Significantly, some training samples aren’t able to be fully valued on certain parameters, such as the initial time (P1) and the similarity region (P2), so the number of forecast schemes will be equal to or less than 2,880,000.
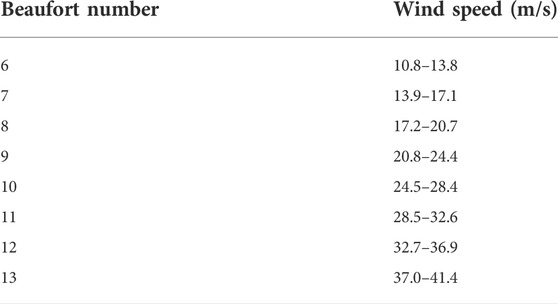
The Beaufort Wind Scale is commonly used in research and operations. In this study, we concentrated on TC-induced gales greater than Beaufort Scale 6 (the wind speeds of Beaufort Scale from 6 to 13 are listed in Table 3). As shown in Figure 5, the TC-induced gales in the training samples mainly ranged within Beaufort Scale 6–8, the proportion being more than 80%. Thus, in order to pick out the best forecast scheme with high efficiency, we calculated the TS values above the thresholds of Beaufort Scale 6 and 8 (hereafter TS6 and TS8, respectively), and the forecast scheme with maximal TSsum (i.e., TSsum = TS6 + TS8) was selected as the best forecast scheme. However, the TC warnings issued by operational centers pay more attention to Beaufort Scale 7 and 10, due to the fact that Beaufort Scale 7 is related to TC scale and Beaufort Scale 10 is a critical reference for TC defense (Sampson and Knaff, 2015; Xiang et al., 2016). Hence the TS, FAR, MR and BS were calculated above the thresholds of Beaufort Scale 7 and 10 to evaluate the forecasting performances in the forecast experiment.
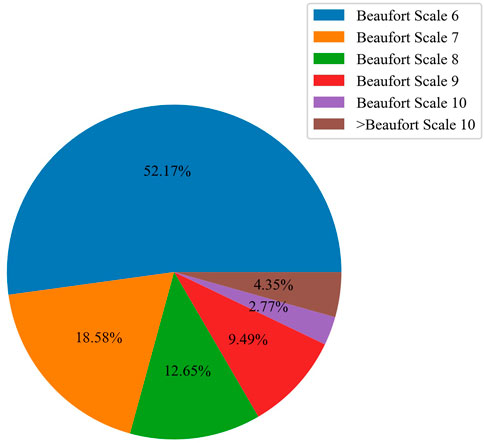
FIGURE 5. Proportions of different wind speed magnitudes of the TC-induced gales in 16 training samples.
4 Results
4.1 Simulation experiment of training samples
The results of the simulation experiment indicated that there were 241,186 forecast schemes for the 16 training samples, which are shown in Figure 6 by the black scatter points. Taking TS6 as the x-axis and TS8 as the y-axis, each scatter point in Figure 6 represents a forecast scheme, and the red scatter point denotes the best forecast scheme determined by TSsum (i.e., TS6 = 0.4063 and TS8 = 0.4389). Furthermore, the values of eight parameters in the best forecast scheme are listed in Table 4.
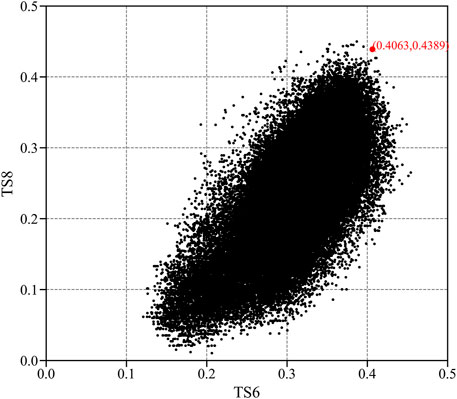
FIGURE 6. Scatter plots of the threat scores (TS6–TS8) from 241,186 forecast schemes generated by the simulation experiment. TS6 and TS8 represent the threat scores for predicting the potential maximum gale of ≥ Beaufort Scale 6 and ≥ Beaufort Scale 8, respectively. The red scatter point indicates the best forecast scheme with maximal TSsum (TS6 + TS8).
4.2 Forecast experiment of independent samples
Based on the average forecast skill scores (i.e., TS, FAR, MR and BS) of five independent samples under two critical thresholds—Beaufort Scale 7 and 10, Figure 7 further compares the best forecast scheme of the DSAEF_LTG model to the four NWP models (i.e., CMA, ECMWF, JMA and NCEP). For brevity, TS7 (FAR7, MR7 and BS7) and TS10 (FAR10, MR10 and BS10) denote the TS (FAR, MR and BS) at two thresholds above Beaufort Scale 7 and 10, respectively. Note that the average TS, FAR and MR were calculated only when the scores were greater than or equal to 0. In addition, the sum of average BS was defined as ± (|BS7|+|BS10|), where the symbol depended on the BS7+BS10.
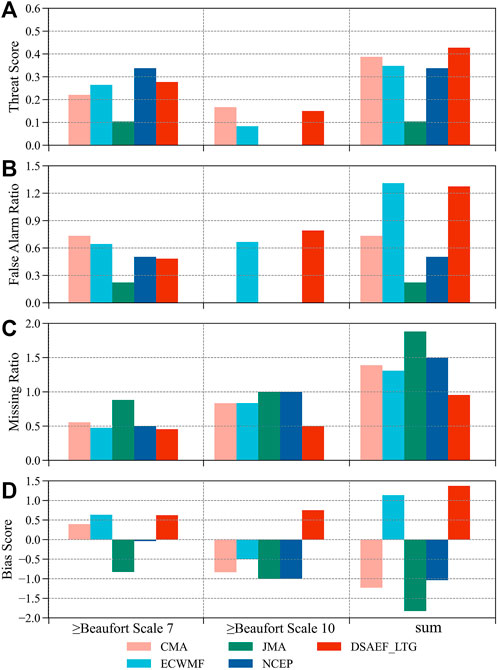
FIGURE 7. Comparison of the average forecast skill scores (i.e., (A) TS, (B) FAR, (C) MR and (D) BS) of different models (CMA, ECMWF, JMA, NCEP, and the best forecast scheme of the DSAEF_LTG model) at thresholds above Beaufort Scale 7 and 10. Note that all the BS values were reduced by 1 for better comparisons, and the sum of average BS was defined as ± (|BS7|+|BS10|), where the symbol depended on BS7+BS10.
According to Figure 7A, NCEP ranked first in the average TS7, followed by the DSAEF_LTG model; while in the average TS10, the DSAEF_LTG model was still in the second place, and CMA ranked first. Consequently, the DSAEF_LTG model outperformed the four NWP models in terms of the sum (i.e., TS7 + TS10), with a total score of 0.4273. As shown in Figures 7B,C, the DSAEF_LTG model ranked fourth in FAR7, first in FAR10, and its sum of average FAR was only slightly lower than CMA, which indicated the FAR of the DSAEF_LTG model was on the high side; but for the average MR, the minimums were calculated by the DSAEF_LTG model both in the average MR7 and MR10, confirming it has a distinct advantages over the NWP models in terms of missing alarms. Figure 7D compares the average BS of different models. The DSAEF_LTG model tends to over-predictions in BS7 and BS10, with scores of 0.6232 and 0.75, respectively; while the NWP models tend to under-predictions, especially for an intense scale (≥Beaufort Scale 10).
In conclusion, on the whole, the DSAEF_LTG model showed higher forecasting skill than the NWP models at two critical thresholds (i.e., Beaufort Scale 7 and 10). Moreover, according to the results of the average FAR, MR and BS, the DSAEF_LTG model was prone to false alarms, while the NWP models were prone to missing alarms, especially for an intense scale.
According to the scatter distribution between predicted and observed wind speeds of five independent samples and relevant statistical indicators (i.e., MAE and R), the forecasting deviation of each model can be compared directly. As all above presented in Figure 8, the forecasting deviations of all models were increased (i.e., the scatters were further away from the reference line) in the case of stronger wind speeds. Among the 5 models, the minimum of MAE and the maximum of R (passing the 0.01 significance test) were both derived from the best forecast scheme of the DSAEF_LTG model with the values of 2.8486 and 0.499, respectively. Thus in general, the DSAEF_LTG model performed best with smallest forecasting error.
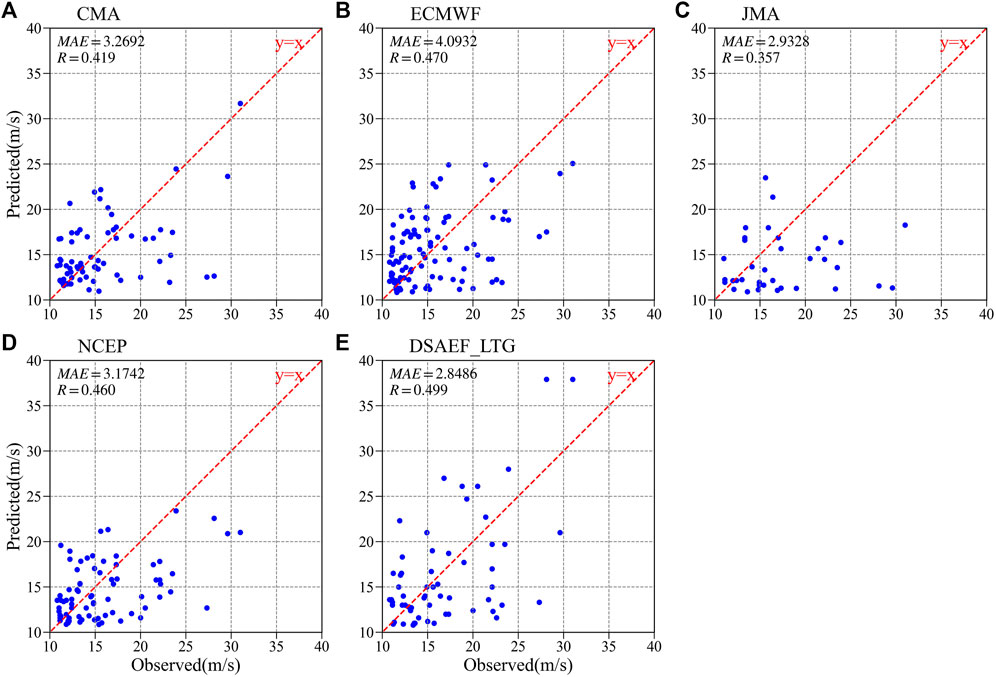
FIGURE 8. Scatter distributions of the predicted and observed wind speeds from five independent samples according to (A) CMA, (B) ECMWF, (C) JMA, (D) NCEP and (E) the DSAEF_LTG model. The MAE and R (passing the 0.01 significance test) of each model are also provided in the upper left. The red dotted line is a reference line where the prediction is equal to observation.
Figure 9 further show the TS7 and TS10 associated with individual independent samples forecasted by the different models mentioned above. As indicated by the black dotted line, the stronger the maximum gale (the largest value selected from the potential maximum gale of all stations for each TC), the better the forecasting performance at Beaufort Scale 7 for each model. However, this feature was not obvious at Beaufort Scale 10.
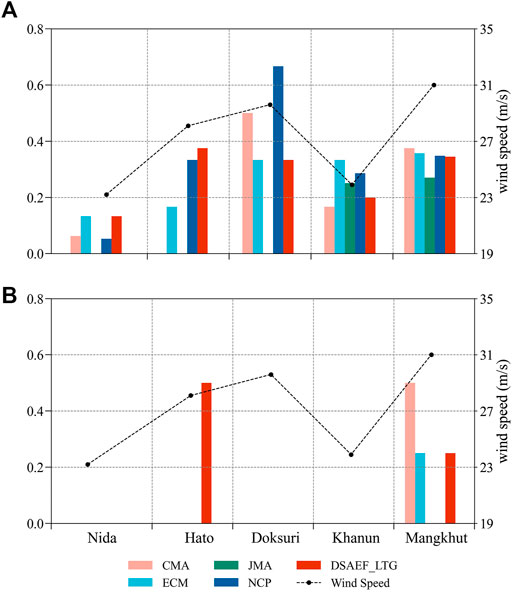
FIGURE 9. Comparison of the TS from different models associated with individual independent samples at the threshold above (A) Beaufort Scale 7 and (B) Beaufort Scale 10. The wind speed (black dotted line) is the largest value selected from the potential maximum gales of all stations for each TC (unit: m/s).
In terms of TS7 (Figure 9A), among all the independent samples, Mangkhut had the best forecast performance with scores above 0.25 for all models, while Nida performed the worst with scores below 0.15 for all models. From the perspective of comparing between different models, the DSAEF_LTG model had a prominent advantage over the four NWP models in its performance for Hato, with a score of 0.375, and was tied for first place with ECMWF for Nida. For the remaining 3 TCs (Doksuri, Khanun and Mangkhut), the DSAEF_LTG model ranked third or fourth, the biggest difference with the first-place model was for Doksuri, at 0.3334, and the smallest difference was for Mangkhut, at 0.0302.
From the black dotted line in Figure 9B, we can see that only the potential maximum gales of Hato, Doksuri and Mangkhut exceeded Beaufort Scale 10. The remaining 2 TCs (Nida and Khanun), without TS10 values, indicate that neither observations nor predictions have reached the threshold of Beaufort Scale 10. In addition, the TS10 values of Doksuri were unable to present positive forecast skills, with scores of 0 for all models. For the TS10 of Hato, none of the NWP models could provide satisfactory forecast results, whereas the DSAEF_LTG model still kept a high forecast level, with score as high as 0.5. With regard to the TS10 of Mangkhut, CMA had the highest score of 0.5; the DSAEF_LTG model tied with ECMWF for second place with a score of 0.25; while NCEP and JMA showed no forecasting capability.
4.3 Analysis of representative cases
To obtain a better insight into the forecasting capacity of the DSAEF_LTG model, two typical cases, Hato and Doksuri, were selected for further analysis (Figures 10, 11). They shared the common attribute that the largest value selected from the potential maximum gales of all stations was greater than Beaufort Scale 10, which was apt to trigger gale-related disasters and raise operational concerns. Their difference came in the forecasting performances of the DSAEF_LTG model compared with the NWP models: for Hato, the DSAEF_LTG model was in a superior position; but for Doksuri, it was at a disadvantage. Hence, it is worth trying to unpack the reasons behind this distinction.
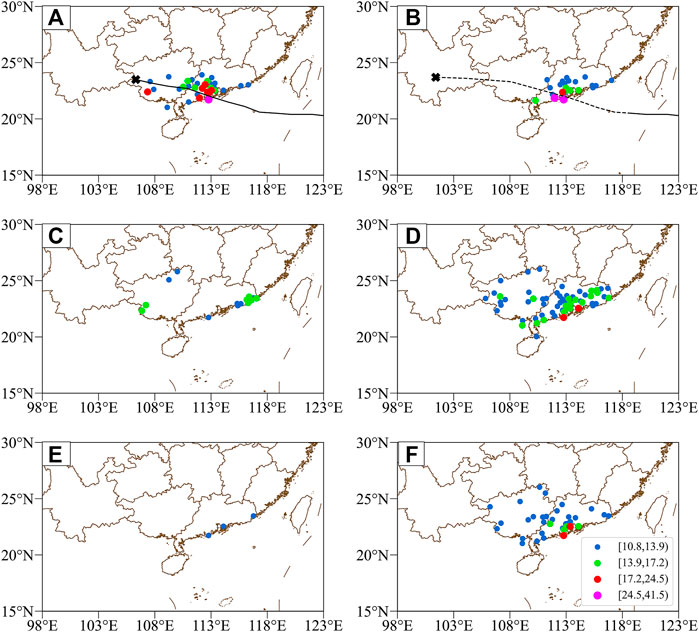
FIGURE 10. Spatial distributions of the potential maximum gale (m/s) associated with Hato according to (A) observations, (B) the DSAEF_LTG model, (C) CMA, (D) ECMWF, (E) JMA, and (F) NCEP. The observed and forecasted tracks are also plotted (black line and black dotted line, respectively). The marker “×” represents the end of the TC track.
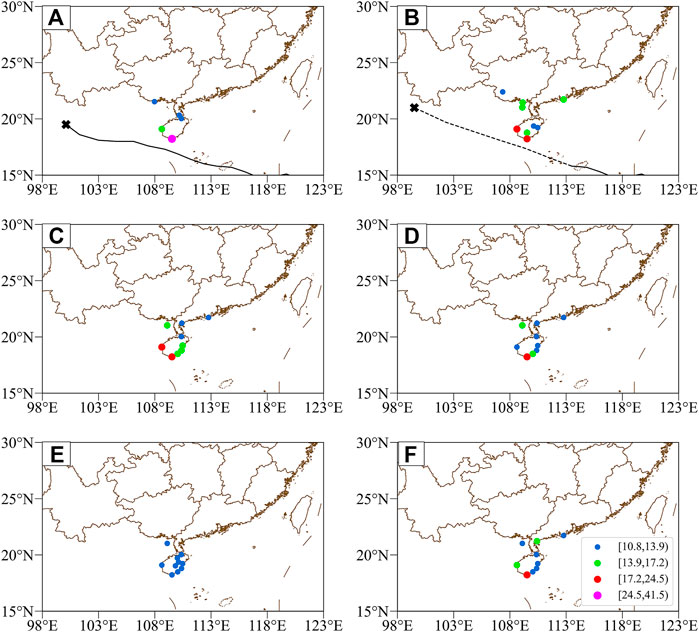
FIGURE 11. Spatial distributions of the potential maximum gale (m/s) associated with Doksuri according to (A) observations, (B) the DSAEF_LTG model, (C) CMA, (D) ECMWF, (E) JMA, and (F) NCEP. The observed and forecasted tracks are also plotted (black line and black dotted line, respectively). The marker “×” represents the end of the TC track.
For Hato, its gales were observed to be mainly concentrated on the right side of the TC track, including the Pearl River Delta region and south Guangxi, with the center located on the west bank of the Pearl River Estuary (Figure 10A). From the spatial distributions of the gales predicted by different models, the pattern of the DSAEF_LTG model (Figure 10B) was closest to observation among all models, but it missed the gales in Guangxi. Meanwhile, ECWMF (Figure 10D) and NCEP (Figure 10F) produced significant over-prediction with an overly large region, while the windy areas predicted by CMA (Figure 10C) and JMA (Figure 10E) were underestimated. In terms of the magnitude of the central wind speeds, the four NWP models were weaker than observed, but the deviation of the DSAEF_LTG model was negligible. Previous research (Zhang et al., 2018; Qin et al., 2019) suggested that Hato underwent rapid intensification twice in the offshore area after the initial time mentioned in Section 4.1 (i.e., 1200 UTC 22 August 2017), and its convection was asymmetric, both of which made it a harder task for the NWP models to make accurate prediction. Meanwhile, the track of Hato belonged to typical TC category in South China (i.e., westbound after making landfall) with observed gales nearby, contributing to the prediction of the DSAEF_LTG model whose merit is taking full advantage of TC track.
For Doksuri, the number of windy stations was less than for Hato: one station with wind speed exceeding Beaufort Scale 10 and four stations below Beaufort Scale 8, scattered over south Hainan, south Guangdong and south Guangxi (Figure 11A). All the models performed well in their predicted spatial distributions of gales, with their prominent differences manifesting in the predicted magnitude of wind speeds. Specifically, NCEP performed the best (Figure 11F); the DSAEF_LTG model (Figure 11B) and CMA (Figure 11C) were over-prediction; and ECWMF (Figure 11D) as well as JMA (Figure 11E) were underestimated. On the one hand, Doksuri did not make direct landfall in China [i.e., sideswiping TC (Feng et al., 2020)] and was accompanied by weak gales and small numbers of windy stations, thus partly accounting for the limited forecasting ability of the DSAEF_LTG model. On the other hand, according to the best forecast scheme mentioned in Section 4.1, the maximum was adopted to assemble the TC-induced wind fields of two analogous historical TCs, which may have resulted in the over-prediction of the DSAEF_LTG model. These two reasons may have led to the big gap in TS between the DSAEF_LTG model and NCEP, whose TS was ranked first.
From the above analysis of two representative TC cases, we can conclude that the DSAEF_LTG model had advantages over (for Hato) or was equivalent to (for Doksuri) dynamic models in the prediction of gale spatial distributions, and it could successfully capture the center with wind speeds above Beaufort Scale 10. Nevertheless, the overall wind speed scale of Doksuri forecasted by the DSAEF_LTG model was greater than observed. The status quo is likely to be improved by adding more reasonable ensemble forecast schemes and including more analogous historical TCs.
5 Summary and discussion
In this study, the DSAEF_LTG model was used to conduct an experiment for forecasting the TC-induced potential maximum gale in South China. Our major results can be summarized as follows:
1) As the first forecasting application of the DSAEF_LTG model, encouraging forecasting ability in South China was demonstrated. In this experiment, the best forecast scheme was crucial and can be described as follows: For TC track similarity, the initial time of the target TC was set at 1200 UTC on the day before TC-induced gales occurred on land and the historical TCs were screened in the 20th similarity region. For landfall time similarity, the analogous historical TCs could make landfall at any time of year (i.e., the landfall time was not restricted). For intensity similarity, the historical TCs with the same grade or one grade difference as target TC would be reserved, using the maximum intensity on the first windy day as a reference. After the screening via the above three similarity conditions, the maximum was adopted to assemble the analogous historical TCs in the top two.
2) In general, the DSAEF_LTG model had higher forecasting skills than the NWP models at the critical thresholds of Beaufort Scale 7 and 10, with a total average TS of 0.4273. The TS values also showed that, the stronger the maximum gale (the largest value selected from the potential maximum gales of all stations for each TC), the better the forecasting performance of TS7 for each model. However, this feature was not obvious in TS10. On the basis of the average FAR, MR and BS, the DSAEF_LTG model was prone to false alarms, while the NWP models were prone to missing alarms, especially for an intense scale (≥Beaufort Scale 10). Additionally, the DSAEF_LTG model also had the smallest forecasting error among five models, with the MAE of 2.8486 and the R of 0.499.
3) The analysis of two typical cases (Hato and Doksuri) further demonstrated that target TC with typical track and widespread gale (e.g., Hato) makes it easier for the DSAEF_LTG model to make accurate prediction which was superior to those of NWP models, both in the wind field pattern and magnitude of central wind speeds. However, for sideswiping TC with small-scale gales (e.g., Doksuri), the DSAEF_LTG model tends to over-predict and fails to achieve satisfactory forecasting results.
The results mentioned above illustrate that the DSAEF_LTG model is able to provide effective predictions of TC-induced potential maximum gales in South China, one of the regions most frequently affected by typhoons, and it is likely to offer a promising tool for local forecasters and hazard mitigation administrators to make decisions. Meanwhile, the weaknesses of the DSAEF_LTG model were also highlighted in our results, namely it was inclined to over-prediction and short in forecasting the target TC with weak and small-scale gales.
Consequently, further work should concentrate on how to further improve the forecasting performances of the DSAEF_LTG model. Some possible solutions are: 1) more reasonable ensemble forecast schemes to reduce the FAR; 2) constructing the GIV is an important step in the DSAEF_LTG model, so it is necessary to incorporate more physical variables related to TC-induced gales, including TC characteristics (e.g., size, translation speed) and environmental conditions (e.g., subtropical high, vertical wind shear); and 3) historical TC datasets with a longer period of time need to be adopted to identify more analogous historical TCs for the target TC.
Data availability statement
The original contributions presented in the study are included in the article/Supplementary Material, further inquiries can be directed to the corresponding author.
Author contributions
FR designed research. LL conceptualized the analysis and wrote the manuscript. All authors were involved in helpful discussions and contributions to the manuscript.
Funding
This work was supported by Guangdong Province Key Research and Development Project (Grant No. 2019B111101002) and Shenzhen Science and Technology Project (Grant No. KCXFZ2020122173610028).
Conflict of interest
The authors declare that the research was conducted in the absence of any commercial or financial relationships that could be construed as a potential conflict of interest.
Publisher’s note
All claims expressed in this article are solely those of the authors and do not necessarily represent those of their affiliated organizations, or those of the publisher, the editors and the reviewers. Any product that may be evaluated in this article, or claim that may be made by its manufacturer, is not guaranteed or endorsed by the publisher.
Supplementary material
The Supplementary Material for this article can be found online at: https://www.frontiersin.org/articles/10.3389/feart.2022.987001/full#supplementary-material
References
Carter, G. M., Paul, D. J., and Glahn, H. R. (1989). Statistical forecasts based on the national meteorological center's numerical weather prediction system. Weather Forecast. 4 (3), 401–412. doi:10.1175/1520-0434(1989)004<0401:sfbotn>2.0.co;2
Charney, J. G., Halem, M., and Jastrow, R. (1969). Use of incomplete historical data to infer the present state of the atmosphere. J. Atmos. Sci. 26 (5), 1160–1163. doi:10.1175/1520-0469(1969)026<1160:uoihdt>2.0.co;2
Chen, H. Y., and Zhang, M. (2008). Practical skill of using satellite cloud pictures in tropical cyclone forecasting. Meteorological Sci. Technol. 5 (7), 547–550. (in Chinese). doi:10.19517/j.1671-6345.2008.05.007
Chen, L. S., and Meng, Z. Y. (2001). Researches on tropical cyclones in China in the past decade. Chin. J. Atmos. Sci. 3, 420–432. (in Chinese). doi:10.3878/j.issn.1006-9895.2001.03.11
Chen, Y. X. (2021). Research on the dynamical-statistical-analog ensemble forecast model for landfalling typhoon gale (DSAEF_LTG). Chengdu: Chengdu University of Information Technology. in Chinese.
Demaria, M., Knaff, J. A., Brennan, M. J., Brown, D., Knabb, R. D., DeMaria, R. T., et al. (2013). Improvements to the operational tropical cyclone wind speed probability model. Weather Forecast. 28 (3), 586–602. doi:10.1175/waf-d-12-00116.1
Dong, Y. (2014). Research on distribution characteristics and forecast for tropical cyclone gale in Guangxi. Nanning: Guangxi Teachers Education University. in Chinese.
Feng, T., Ren, F. M., Zhang, D. L., Li, G., Qiu, W., and Yang, H. (2020). Sideswiping tropical cyclones and their associated precipitation over China. Adv. Atmos. Sci. 37 (7), 707–717. doi:10.1007/s00376-020-9224-5
He, C. F., Qian, K. B., and Jin, W. (2018). Precision forecasting of typhoon wind speed in WRF model based on IFOA-FSVM. J. Ningbo Univ. (Nsee) 31 (6), 20–26. in Chinese. doi:10.3969/j.issn.1001-5132.2018.06.004
Jia, L., Jia, Z., Ren, F., Ding, C., Wang, M., and Feng, T. (2020). Introducing TC intensity into the DSAEF_LTP model and simulating precipitation of super-typhoon Lekima (2019). Q. J. R. Meteorol. Soc. 146, 3965–3979. doi:10.1002/qj.3882
Kaplan, J., and DeMaria, M. (1995). A simple empirical model for predicting the decay of tropical cyclone winds after landfall. J. Appl. Meteor. 34 (11), 2499–2512. doi:10.1175/1520-0450(1995)034<2499:asemfp>2.0.co;2
Knaff, J. A., Sampson, C. R., and Chirokova, G. (2017). A global statistical–dynamical tropical cyclone wind radii forecast scheme. Weather Forecast. 32 (2), 629–644. doi:10.1175/waf-d-16-0168.1
Knaff, J. A., Sampson, C. R., DeMaria, M., Marchok, T. P., Gross, J. M., and McAdie, C. J. (2007). Statistical tropical cyclone wind radii prediction using climatology and persistence. Weather Forecast. 22 (4), 781–791. doi:10.1175/waf1026.1
Li, Q. L., Xu, P. C., Wang, X. B., Lan, H., Cao, C., Li, G., et al. (2016). An operational statistical scheme for tropical cyclone induced wind gust forecasts. Weather Forecast. 31 (6), 1817–1832. doi:10.1175/waf-d-16-0015.1
Li, Y., Liu, Y. B., and Xu, X. F. (2021). Advances and challenges for improving numerical weather prediction models and forecasting using deep learning. Adv. Meteorological Sci. Technol. 11 (3), 103–112. in Chinese. doi:10.3969/j.issn.2095-1973.2021.03.012
Lin, Z. P., Zhou, S. W., and Wen, J. C. (2015). Application of ECMWF thin-grid 10m wind fields in “tiantu” heavy wind forecast. Meteorological, Hydrological Mar. Instrum. 32 (3), 7–12. in Chinese. doi:10.19441/j.cnki.issn1006-009x.2015.03.002
Lu, Y., Zhu, W. J., and Ren, F. M. (2016). Changes of tropical cyclone high winds and extreme winds during 1980-2014 over China. Clim. Change Res. 12 (05), 413–421. in Chinese. doi:10.12006/j.issn.1673-1719.2016.030
Peduzzi, P., Chatenoux, B., Dao, H., De Bono, A., Herold, C., Kossin, J., et al. (2012). Global trends in tropical cyclone risk. Nat. Clim. Chang. 2 (4), 289–294. doi:10.1038/nclimate1410
Powell, M. D., and Reinhold, T. A. (2011). Predicting tropical cyclone destructive potential by integrated kinetic energy according to the Powell/Reinhold scale. US. US7970543 B2[P].
Qin, L., Wu, Q. S., and Zeng, X. T. (2019). Analysis on cause of rapid intensification of asymmetrical Typhoon Hato (1713) over the offshore of China. Torrential Rain Disasters 38 (3), 212–220. in Chinese. doi:10.3969/j.issn.1004-9045.2019.03.003
Ren, F. M., Ding, C., Zhang, D. L., Chen, D., Ren, H. l., and Qiu, W. (2020). A dynamical-statistical-analog ensemble forecast model: Theory and an application to heavy rainfall forecasts of landfalling tropical cyclones. Mon. Weather Rev. 148 (4), 1503–1517. doi:10.1175/mwr-d-19-0174.1
Ren, F. M., Qiu, W. Y., and Jiang, X. L. (2018). An objective track similarity index and its preliminary application to predicting precipitation of landfalling tropical cyclones. Weather Forecast. 33, 1725–1742. doi:10.1175/waf-d-18-0007.1
Roy, C., and Rita, K. (2012). Tropical cyclone track forecasting techniques ― A review. Atmos. Res. 9 (12), 40–69. doi:10.1016/j.atmosres.2011.09.012
Sampson, C. R., and Knaff, J. A. (2015). A consensus forecast for tropical cyclone gale wind radii. Weather Forecast. 30 (5), 1397–1403. doi:10.1175/waf-d-15-0009.1
Wan, J. H., Chen, W., and Zhang, B. W. (2016). Analysis on flood disaster characteristics and disaster mechanism caused by the super typhoon Rammasun in 2014. J. Catastrophology 31 (3), 78–83. in Chinese. doi:10.3969/j.issn.1000-811X.2016.03.013
Wang, S. S., Zhou, H. M., and Zhu, S. P. (2020). Station forecast calibration of daily precipitation using categorized rainfall regression. Meteorological Sci. Technol. 48 (3), 422–427. in Chinese. doi:10.19517/j.1671-6345.20190159
Wang, X. F., Xu, X. L., and Yang, X. C. (2017). The NWP models evaluation of landfall processes of the strong typhoon Fitow. Trans. Atmos. Sci. 40 (5), 609–618. in Chinese. doi:10.13878/j.cnki.dqkxxb.20170124001
Wilks, D. (2006). Statistical methods in the atmospheric sciences. Technometrics 102 (477), 380. doi:10.1198/jasa.2007.s163
Xiang, C. Y., Wu, L. G., and Tian, W. (2016). Applications of MTCSWA data to the characteristic analysis of tropical cyclone structure. Meteorol. Mon. 42 (11), 1316–1324. in Chinese. doi:10.7519/j.issn.1000-0526.2016.11.003
Ying, M., Zhang, W., Yu, H., Lu, X., Feng, J., Fan, Y., et al. (2014). An overview of the China Meteorological Administration tropical cyclone database. J. Atmos. Ocean. Technol. 31, 287–301. doi:10.1175/jtech-d-12-00119.1
Zhang, J., Shi, D. W., and Li, C. (2018). Analysis on the sudden change and its cause of Typhoon Hato. Mar. Forecasts 35 (2), 37–43. in Chinese. doi:10.11737/j.issn.1003-0239.2018.02.005
Zhang, W., Villarini, G., Vecchi, G. A., Murakami, H., and Gudgel, R. (2016). Statistical-dynamical seasonal forecast of Western North Pacific and East Asia landfalling tropical cyclones using the high-resolution GFDL FLOR coupled model. J. Adv. Model. Earth Syst. 8 (2), 538–565. doi:10.1002/2015ms000607
Keywords: landfalling tropical cyclone, potential maximum gale, DSAEF_LTG model, South China, forecasting
Citation: Li L, Chen Y, Ren F, Liu C, Ma Y and Wan Q (2022) Experiment with the dynamical–statistical–analog ensemble forecast model for landfalling typhoon gale over South China. Front. Earth Sci. 10:987001. doi: 10.3389/feart.2022.987001
Received: 05 July 2022; Accepted: 07 September 2022;
Published: 26 September 2022.
Edited by:
Liguang Wu, Fudan University, ChinaReviewed by:
Dong-Hyun Cha, Ulsan National Institute of Science and Technology, South KoreaEric Hendricks, National Center for Atmospheric Research (UCAR), United States
Copyright © 2022 Li, Chen, Ren, Liu, Ma and Wan. This is an open-access article distributed under the terms of the Creative Commons Attribution License (CC BY). The use, distribution or reproduction in other forums is permitted, provided the original author(s) and the copyright owner(s) are credited and that the original publication in this journal is cited, in accordance with accepted academic practice. No use, distribution or reproduction is permitted which does not comply with these terms.
*Correspondence: Fumin Ren, Zm1yZW5AMTYzLmNvbQ==
 Lifang Li
 Yuxu Chen3
 Fumin Ren


