 Cong Wang1
 Xingguo Huang
 Yue Li
 Kristian Jensen
- 1College of Instrumentation and Electrical Engineering, Jilin University, Changchun, China
- 2College of Communication Engineering, Jilin University, Changchun, China
- 3Metis Privatistskole, Bergen, Norway
In recent years, distributed optical fiber acoustic sensing (DAS) technology has been increasingly used for vertical seismic profile (VSP) exploration. Even though this technology has the advantages of high spatial resolution, strong resistance to high temperature and pressure variations, long sensing distance, DAS seismic noise has expanded from random noise to optical abnormal noise, fading noise and horizontal noise, etc. This seriously affects the quality of the seismic data and brings huge challenges to subsequent imaging, inversion and interpretation. Moreover, the noise is more complex and more difficult to simultaneously suppress using traditional methods. Therefore, for the purpose of effectively improving the signal-to-noise ratio (SNR) of DAS seismic data, we introduce a denoising network named attention-guided denoising convolutional neural network (ADNet). The network is composed of four blocks, including a sparse block (SB), a feature enhancement block (FEB), an attention block (AB) and a reconstruction block (RB). The network uses different kinds of convolutions alternately to enlarge the receptive field size and extract global feature of the input. Meanwhile, the attention mechanism is introduced to extract the hidden noise information in the complex background. The network predicts the noise, and denoised data are obtained by subtracting the predicted results from the noisy inputs. In addition, we uniquely construct a large number of complex forward models for pure seismic data training set to enhance the network suitability. The combination design improves the denoising performance and reduces computational cost and memory consumption. The results obtained from both synthetic- and field data illustrate that the network has the ability to denoise the seismic images and retrieve weak effective signals better than conventional methods and common networks.
1 Introduction
As an emerging signal detection technology, distributed optical fiber acoustic sensing (DAS) has been used to detect seismic signals. DAS records seismic waves using fiber optic cables that are continuously distributed from well head to bottom of the drill hole (Kobayashi et al., 2020). Compared to conventional seismic geophones, DAS has many advantages such as wide detection range, high spatial resolution, strong resistance to harsh environments, convenient layout (Ma et al., 2018). However, many challenges also result from the application of the method when it is used in seismic exploration from wells. The seismic data acquired by DAS technology have different types of effective signals and high-level noise with complex properties. The signals contain down-going direct waves, and up- and down-going reflected waves, which frequently suffer from a large amount of noise, including random noise, optical abnormal noise, fading noise and horizontal noise (Mateeva et al., 2014; Correa et al., 2017; Olofsson and Martinez, 2017). The noise may seriously decrease the signal-to-noise (SNR) of DAS seismic data, and subsequently leads to huge difficulties in imaging, inversion and interpretation. Methods for suppressing complex noise and improving SNR in geophysical data obtained from DAS are therefore desired.
In the past years, many denoising methods have been proposed and developed successively to suppress noise in seismic data. Examples include wavelet transform (Alali et al., 2018), band-pass filtering (Stein and Bartley, 1983), f-x deconvolution (Gulunay, 2017), median filtering (Huo et al., 2017; Chen et al., 2019), curvelet transform (Naghizadeh and Sacchi, 2018; Li et al., 2020), empirical mode decomposition (Gomez and Velis, 2016; Xue et al., 2019), variational mode decomposition (Yu and Ma, 2018; Feng et al., 2022) and singular value decomposition (Gan et al., 2015; Wang and Wang, 2021). These methods are effective when dealing with some random noise or Gaussian noise, but they all have limitations for DAS noise. For instance, band-pass filtering cannot separate the effective signals and noise in the same frequency bands. The sparse representation methods such as wavelet transform and curvelet transform depend on threshold functions and the need for choosing the threshold value manually. In recent years, some denoising methods have been proposed to suppress specific DAS data noise. For example, optical abnormal noise can be suppressed by median filtering and horizontal noise can be removed by dip filtering (Binder et al., 2020). However, these denoising methods have only achieved good denoising results for one or two types of noise. In addition, their application is limited by noise level and the effective signals are easy loss. When multiple types of noise exist together, the denoising results are usually unsatisfactory.
Deep learning has great potential and remarkable performance in many fields owing to its flexible modular architectures and strong representation capability. A common deep learning algorithm, convolutional neural network (CNN), is a feed forward neural network that has great feature extract ability. Many CNN-based deep learning methods have been applied for seismic exploration fields, such as seismic event detection (Wu H. et al., 2019; Binder and Tura, 2020; Yang et al., 2021), first-arrival picking (Wu Y. et al., 2019; Yuan et al., 2020; Guo et al., 2021) and seismic inversion (Feng, 2020; Wang et al., 2020; Aleardi and Salusti, 2021). Furthermore, it is also an effective tool for seismic noise suppression. Zhao et al. (2019) applied denoising convolutional neural networks (DnCNNs) to suppress low-frequency random noise. Other recently proposed noise suppressing algorithms include deep residual encoder-decoder networks (Yao et al., 2022), deep-denoising autoencoders (Saad and Chen, 2020), and the use of a CNN framework with learned noise prior to random noise suppression (Cui et al., 2022). However, the existing CNN-based denoising methods still have drawbacks. The full convolution networks ignore the connection between shallow layers and deep layers, which is disadvantageous for sufficient feature extraction. Furthermore, if networks are too deep, they cannot make full use of the effects from the shallow layers on the deep layers. This leads to increased difficulty in achieving proper training of the network. Additionally, DAS data typically contain weak reflected signals and more complex multiple noise. Thus, the requirements for proper noise suppression and signal recovery are higher.
Attention mechanism has attracted a lot of attention in the current deep learning research field and the method is widely applied to image denoising tasks. Tian et al. (2020) proposed attention-guided denoising convolutional neural networks (ADNet) for suppressing blind noise and real noise of images and showed excellent deoising effect. However, the application of attention mechanism in seismic data processing is limited. Inspired by this, we apply ADNet for DAS seismic noise suppression. The denoising network ADNet utilizes different convolutions to learn noise and signal features from the noisy input data. This allows for discrimination between the effective signals and different types of noise, which improves the training efficiency and the denoising performance. The network fuses global and local features to enhance the expressive ability of network. The complex noise background of the input DAS data frequently hides features, which increases the difficulty of training the network. Thus, we employ an attention mechanism to extract noise information present in the complex noisy data background. Additionally, to train the network, we construct a great number of synthetic DAS training sets through forward modelling using different theoretical parameters, such as main frequency of the seismic signals, well depth, trace interval, and so on. Both synthetic and field experimental results show that the proposed network can suppress different types of noise and recover the seismic signals without almost any loss of DAS seismic data.
The structure of this paper is as follows. In Section 2 we introduce the architecture of ADNet, the construction of training sets and optimization of network parameters. In Section 3 we process the synthetic DAS seismic data and compared it with data obtained via traditional methods and a common network approach. Moreover, we process a field seismic record to verify the denoising performance of the network. Finally, Section 4 includes a discussion and conclusion of the paper.
2 Theory and methodology
2.1 Network architecture
In this section, we introduce the architecture of ADNet composed of 17 layers, and illustrated in Figure 1 It contains a sparse block (SB), a feature enhancement block (FEB), an attention block (AB) and a reconstruction block (RB). The SB is used to extract features from the noisy data to learn and distinguish between effective signals and noise. The FEB fuses the global and local features to enhance the robustness of the denoising model. The AB is used to mine noise information hidden in the complex background. And the RB predicts noise and constructs the denoised results.

FIGURE 1. Architecture of ADNet (According to Tian et al. (2020), we modified Figure 1).
The 12 forward layers are SB, and the architecture is shown in Figure 2. It consists of standard and dilated convolutions layers. The standard convolution layer contains convolution (Conv), batch normalization (BN), and activation function for a linear rectification function (Relu). BN can ensure that the input of each layer has an approximate distribution and accelerate the convergence speed of network loss function. Relu can implement gradient descent and back propagation. The standard convolution layers are set at the first, third, fourth, sixth, seventh, eighth, tenth, and eleventh layer in the SB. The dilated convolution layer includes dilated convolution with a dilated factor of 2, BN, and Relu. The dilated convolution layers are set at the second, fifth, ninth, and twelfth layer. All the convolution filter sizes of the SB are 3 × 3. The input channel of the first layer is 1, whereas other eleven layers are 64. Dilated convolution can enlarge the receptive field size and extract global input features, which is beneficial to reduce the complexity of network. The combination of two kinds of convolutions can improve the denoising performance and cut down the computational cost and memory consumption.
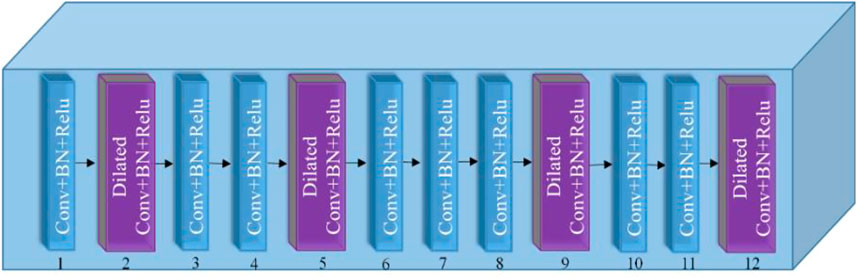
FIGURE 2. Architecture of the SB (According to Tian et al. (2020), we modified Figure 1).
To reduce the influence of the shallow layers on the deep layers and mine the robust features, an FEB is designed in the network. It consists of three standard convolution layers, a Conv and activation function Tanh. The standard convolutions are installed from 13 to 15 layers and the filter sizes are 64 × 3 × 3 × 64. The Conv is fitted at the sixteenth layer and its filter size is 64 × 3 × 3 × 1. The 4-layer FEB can enhance feature learning to better restore weak effective signals. Additionally, a concatenation operation is added to fuse the input noisy data and the output of the sixteenth layer to enhance the representation ability of the denoising model. It can merge the features extracted from the input into new features for enhancing the expressive ability of the denoising network. And Tanh is used to convert the obtained features into nonlinearity.
As mentioned earlier, DAS data have complex noise. The effective signals are frequently covered by noise and cannot be identified. Distinguishing between noise and effective signals is a prerequisite for noise suppression tasks. Therefore, an AB is added to the network to guide the denoising model training. It includes a Conv and the filter size is 2 × 1 × 1 × 1. This is used to guide the previous stage for learning the noise information and to better distinguish between noise and effective signals. The convolution of size 1 × 1 from the seventeenth layer compresses the obtained features into a vector as the weights to adjust the previous stage. Then AB utilizes the obtained weights to multiply the output of the sixteenth layer for extraction of more noise features.
Finally, an RB predicts the residual data and reconstructs the denoised data. The network adjusts network parameters by predicted residual results and actual noise data when training.
2.2 Network denoising principle
The optimization of deep learning methods is principally driven by the loss function. Noisy DAS data can be regarded as a linear superposition of pure data and noise (Li et al., 2017).
where
where
where
2.3 Quantitative analysis of denoising performance
SNR and structural similarity index (SSIM) (Wang et al., 2004) are important indicators to measure the quality of seismic data. To evaluate the denoising performance, we use SNR and SSIM to analyze the denoised results. The formula for SNR is as follows:
where
here
where
where
2.4 Training set construction and network parameter optimization
Adequate and accurate training sets can improve the performance of networks. The training sets of ADNet include a pure data set and a noisy data set. As there are no existing training sets for DAS data, we performed forward velocity modelling with many types of layers (flat, inclined, concave, convex, and so on) to generate ten models. The models were obtained through an implementation of the elastic wave equation utilizing seismic wavelet source functions. From the ten models, a pure DAS data set was generated based on analysis of the signal dominant frequency, apparent velocity, and wavelet type. The dominant signal frequencies ranged from 40 Hz to 80 Hz. The apparent velocities were 1,000 m/s–3,000 m/s and the velocities increased with formation depth. The wavelet type was a standard Ricker wavelet with a sampling frequency of 2,500 Hz and a sampling interval of 1 m. A 256 × 256 moving window was used to segment the records to generate 5,000 patches of the pure data samples.
The noisy data set are made by adding DAS noise to synthetic pure records randomly. To estimate noise accurately, and to separate signals and noise well, noise in the noisy data set must be as abundant as possible. Random noise and fading noise were acquired from passive DAS data. Horizontal noise and optical abnormal noise were taken from some real noisy DAS records. We randomly added different types and levels of noise to the synthetic pure records. The datasets were then divided into 5,000 patches noisy data samples by a 256 × 256 moving window.
The network randomly takes noisy data samples as the input and the corresponding pure data samples are regarded as labels of the network. The initial learning rate was 1e-3 and the number of epochs were 1,000. The learning rates of the 200th–500th epochs were 1e-4 and the learning rates of the final 500 epochs were 1e-5. Additionally, an Adam optimizer (Kingma and Ba, 2015) was implemented to optimize the network.
In the experiment, we verified the influence of different patch sizes for denoised results. The patch sizes were set to 16, 32, 64, 128, and 256, respectively, to train the network. We utilized a synthetic noisy dataset to verify the denoising performance, and a comparison of the results acquired through SNR and SSIM are showed in Figure 3. From the results, we can see that the network with patch size of 256 achieved the best denoising result. Thus, a patch size of 256 is an optimal choice for DAS seismic data denoising.
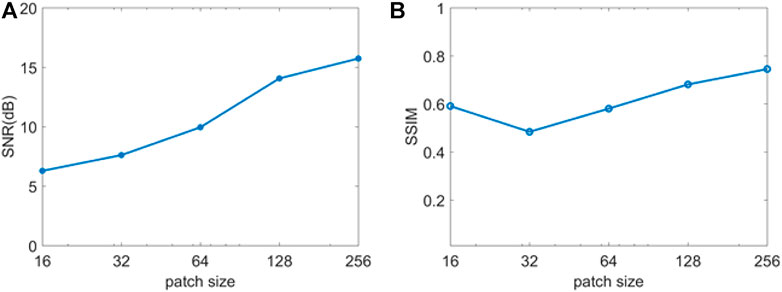
FIGURE 3. Comparison of denoised results when training the network with different patch sizes. (A) SNR comparison of denoised results, (B) SSIM comparison of denoised results.
We applied Tensorflow 1.8.0 and Python 3.6.1 to train and test the ADNet. All the experiments were conducted on a PC with Intel Core i5-7500 CPU at 3.40 GHz and an NVIDIA GeForce GTX 1050 Ti GPU.
3 Experiment results
3.1 Denoised results comparison of synthetic DAS data
In this section, we illustrate the results from the denoising performance of ADNet by processing the synthetic DAS data generated by a six-layer forward modeling. The 2-D geological model is shown in Figure 4, where the horizontal distance is 2,000 m, the well depth is 4,000 m, the inverted triangle represents the seismic source, and the vertical black line represents the fiber optic sensor. And the detailed parameters of the geological model are shown in Table 1. We constructed a synthetic DAS record with 2,000 traces and 1,000 ms, shown in Figure 5A. The wavelet type used is a zero-phased Ricker wavelet with a dominant frequency of 50 Hz. The trace interval was set to 1 m and the sampling frequency to 2,500 Hz.
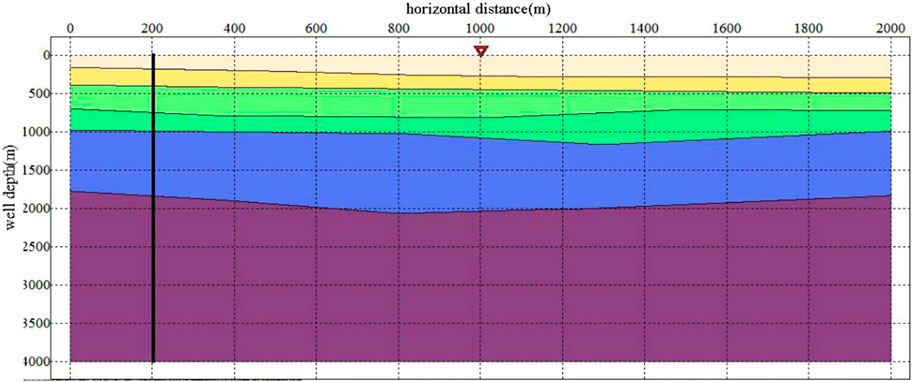
FIGURE 4. 2-D geological model.
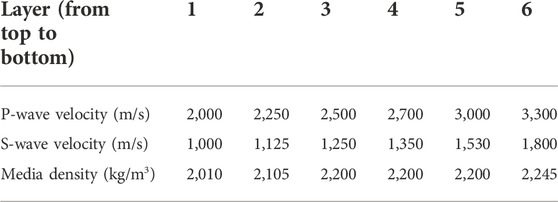
TABLE 1. Wave velocities and media densities of 2-D geological model.

FIGURE 5. Synthetic DAS records. (A) Synthetic pure DAS record, (B) real noise record and (C) synthetic noisy DAS record.
The synthetic noisy record was constructed by adding noise to the synthetic pure record. Figure 5B shows the real DAS noise record and Figure 5C shows the synthetic DAS record with added noise. We can see that most of effective signals are contaminated by noise and cannot be identified easily.
To verify the denoising performance of our method, we compare the ADNet-approach with variational mode decomposition (VMD), band-pass filtering, and DnCNNs. The denoised results are shown in Figure 6. VMD has four modes. Band-pass filtering is from 20 Hz to 110 Hz. The DnCNNs used the same network layers and basic parameters as the ADNet, as well as the same training sets. As shown in Figures 6A,B, VMD and band-pass filtering cannot suppress horizontal noise and fading noise well, which is marked with red box. Compared to conventional methods, DnCNNs has better noise suppression ability. However, there is a reflected signal lost in part of the image highlighted with the blue box, and some optical abnormal noise remains, as seen in Figure 6C. By contrast, ADNet can suppress almost all the noise, and the denoised result is closest to synthetic pure record seen in Figure 5A.
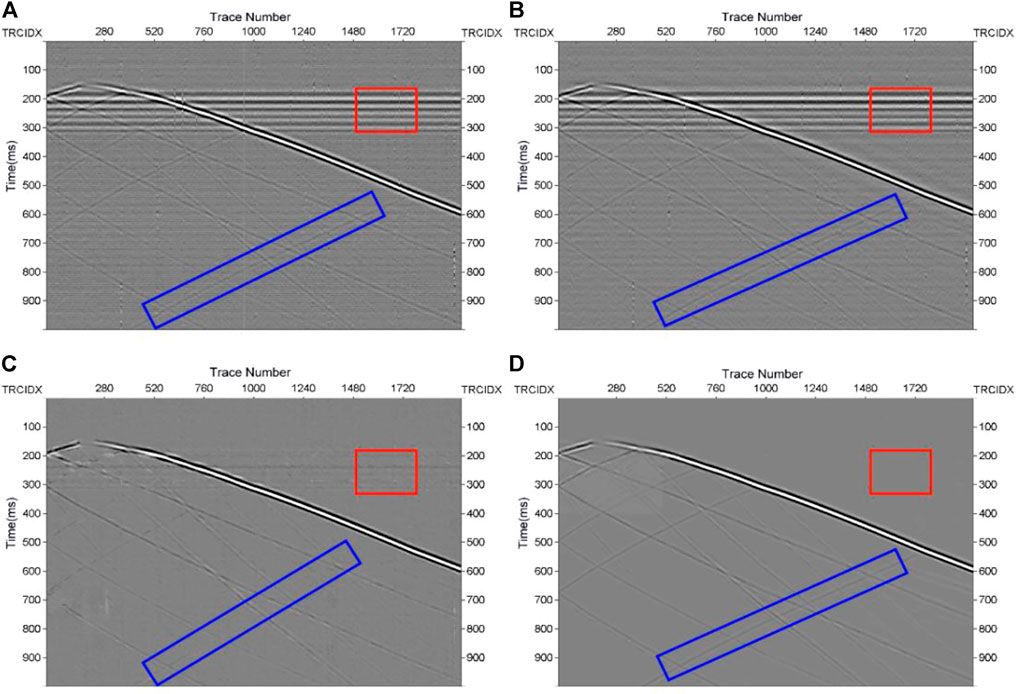
FIGURE 6. Comparison of different methods for synthetic denoising. (A) Denoised result of VMD, (B) denoised result of band-pass filtering, (C) denoised result of DnCNNs, (D) denoised result of ADNet.
To verify the signal recovery ability, we compared the differences between the noisy record and the denoise results obtained via the four denoising methods. The results are shown in Figure 7. In Figures 7A,B, the direct waves are muted. The difference map obtained from DnCNNs has a great number of reflected waves, which is shown in Figure 7C. Thus, all three methods lose effective signals, whereas in Figure 7D, we can see that difference map obtained via ADNet has almost no effective signal residual. This result is also closest to the noise example illustrated in Figure 5B. That demonstrates that ADNet has better noise suppression ability and stronger effective signals restoration ability.
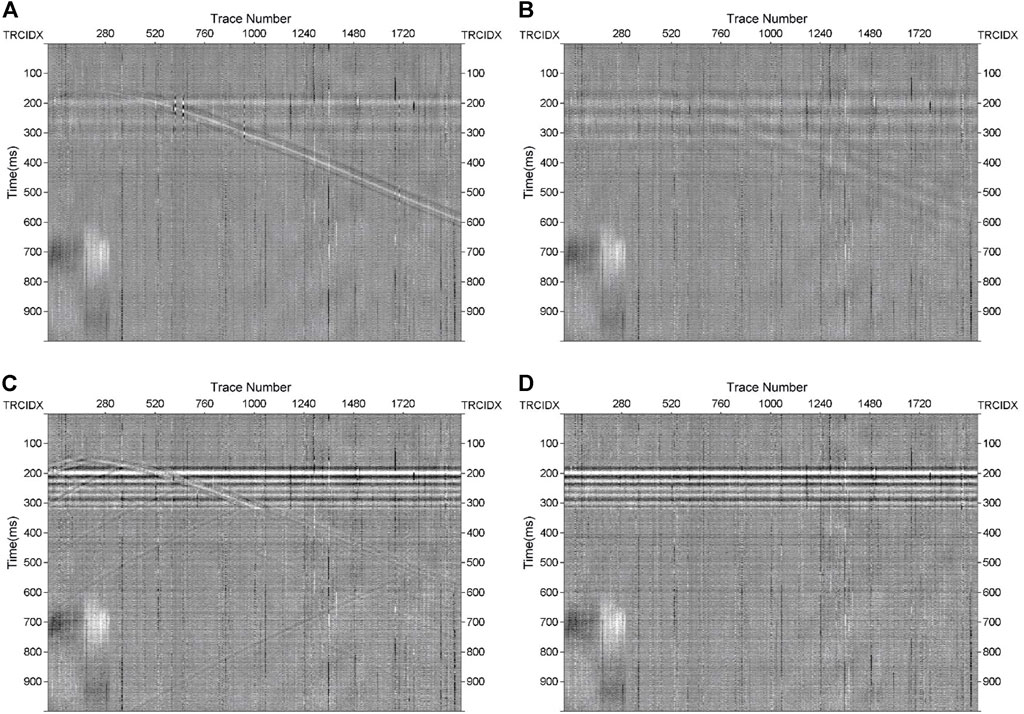
FIGURE 7. Difference maps from the four denoised results. (A) Difference map from VMD, (B) difference map from band-pass filtering, (C) difference map from DnCNNs, (D) difference map from ADNet.
Additionally, we analyzed the denoised results in the frequency domain. The f-k spectra of the denoised results are illustrated in Figure 8. From the f-k spectra shown in Figures 8C,D, we observe that the noise has a wide frequency band compared to the effective signals. The denoised results from VMD and band-pass filtering have plenty of noise residual. By contrast, the f-k spectra in Figures 8E,F are closer to the pure record spectrum. Furthermore, the f-k spectra of the difference maps are plotted in Figure 9. We see here that part of effective signals is left in Figures 9B,D. This again indicates the ADNet has the best denoising effect.

FIGURE 8. F-k spectra comparisons of denoised results. (A) F-k spectrum of Figure 5A, (B) f-k spectrum of Figure 5C, (C–F) f-k spectra of denoised results in Figure 6.

FIGURE 9. F-k spectra of difference maps. (A) F-k spectrum of Figure 5B, (B–E) F-k spectra of the difference maps in Figure 7.
To compare the denoising results in even more detail, we show the local SNR in Figure 10. The local SNR and global SNR have the same formula. From the results, we can see that local SNR of ADNet is closer to yellow, which indicates higher SNR. Additionally, to quantitatively analyze the denoising performance, we compare SNR, SSIM and training time in the Table 2. The denoised results from ADNet increases approximately 18 dB. The higher SNR and SSIM values indicate better denoising performance than the results obtained with the three other methods. In addition, the training time of ADNet is shorter than that of DnCNNs.
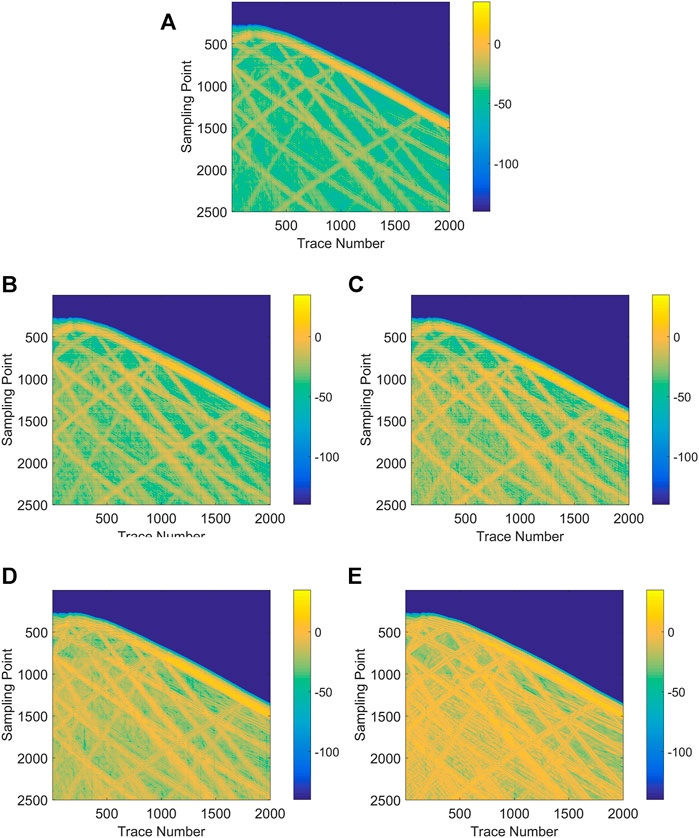
FIGURE 10. Local SNR comparison of denoised results. (A) Local SNR of Figure 5C, (B–E) local SNR of denoised results in Figure 6.
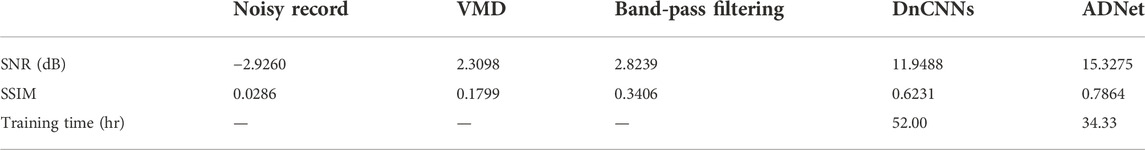
TABLE 2. Comparison of denoising performance of different methods.
3.2 Field DAS data denoised results
Next, we processed a field DAS record from the Tarim Basin of Xinjiang located in the northwest China to test the denoising performance of ADNet and compare the result with the denoised results of VMD, band-pass filtering and DnCNNs. Figure 11 shows the real DAS record. The red arrow represents the direct wave, and the yellow and blue arrows represent up-going reflected waves and down-going reflected waves, respectively. The record contains multiple types of noise and effective signals cannot be easily identified.
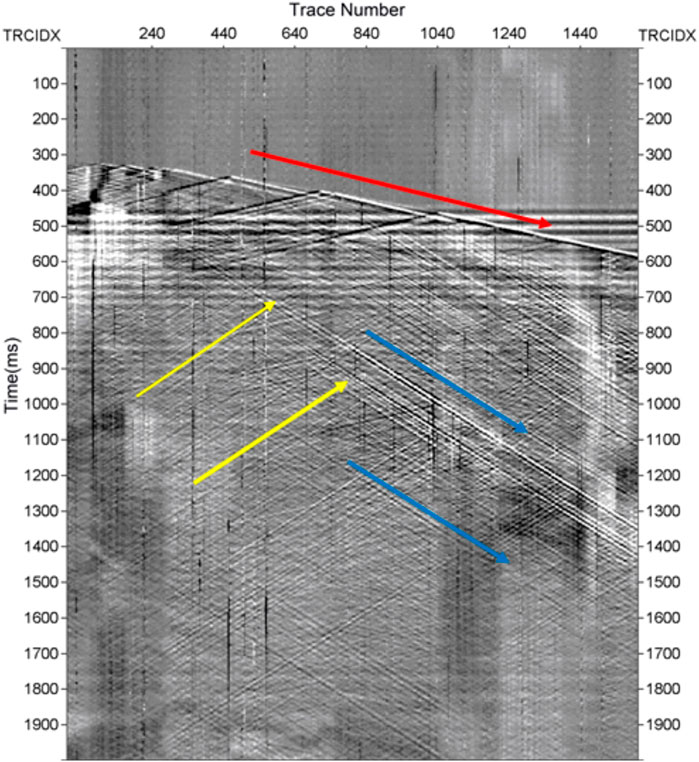
FIGURE 11. Real DAS record.
Figure 12 shows the denoised results from the four methods, and Figure 13 displays the corresponding difference maps. From Figure 12A, we can see that a large amount of noise is suppressed, but horizontal noise can still be seen, particularly within the yellow box. In Figure 12B, the continuity of the effective signals is poor, and the difference map obtained after band-pass filtering obtains many reflected waves. The denoised result of DnCNNs still contains horizontal noise and optical abnormal noise residual, which influences the effective signal identification. Besides, the difference map has plenty of effective signal loss, as illustrated in Figure 13C. On the contrary, the denoised result from ADNet contains very little noise residual, and the direct wave and reflected waves can be seen clearly. This indicates that ADNet is more suitable for DAS seismic data denoising and has better effective signal recovery ability.
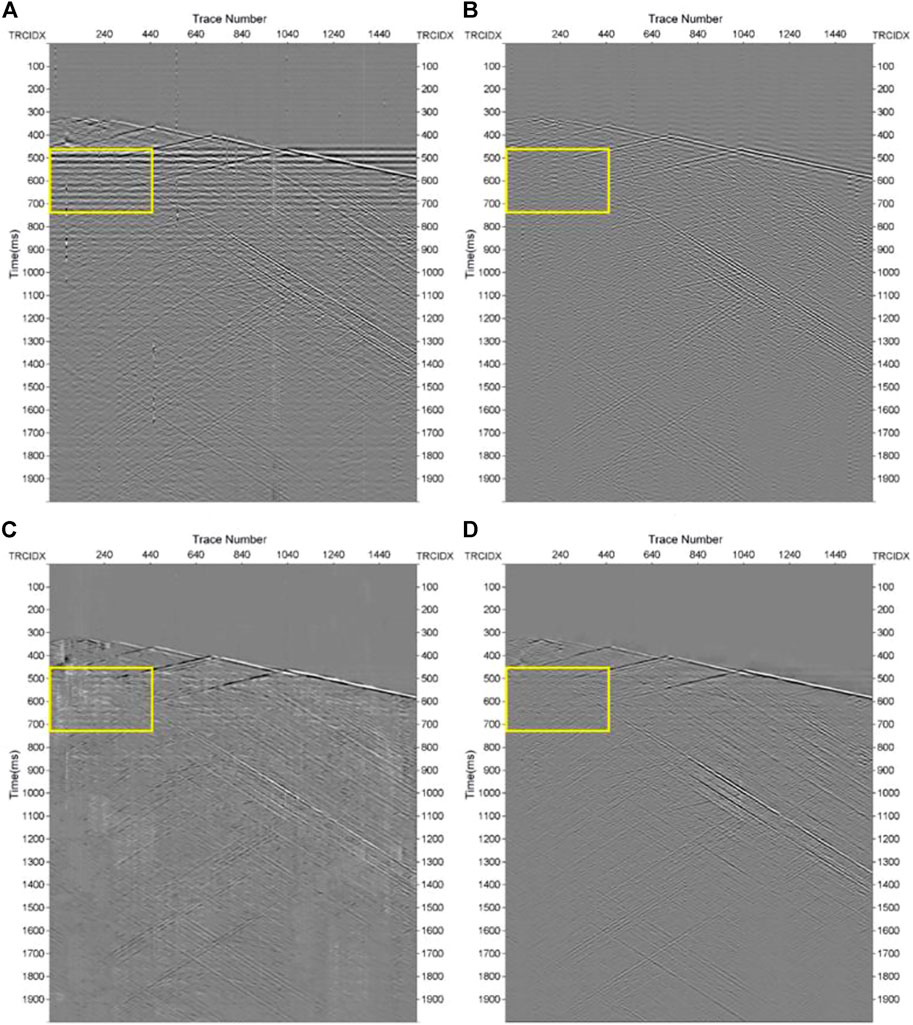
FIGURE 12. Field data: Denoising results. (A) Denoised result from VMD, (B) denoised result from band-pass filtering, (C) denoised result from DnCNNs, (D) denoised result from ADNet.
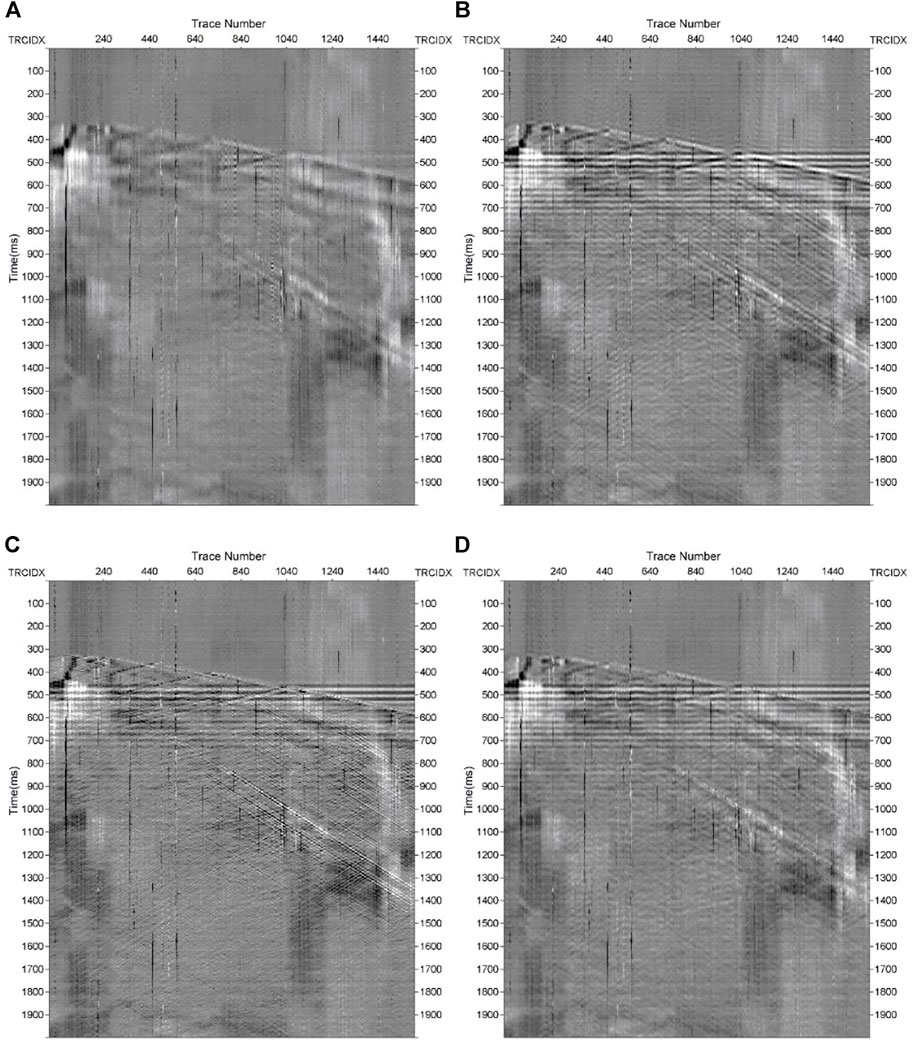
FIGURE 13. Difference maps from denoised results in Figure 12. (A) Difference map from real DAS record and denoised result from VMD, (B) difference map from real DAS record and denoised result from band-pass filtering, (C) difference map from real DAS record and denoised result from DnCNNs, (D) difference map from real DAS record and denoised result from ADNet.
4 Conclusion and discussion
DAS seismic data include multiple types of noise and this affects the identification of effective signals, such as the direct wave and reflected waves. In this paper we have introduced a CNN denoising network with attention mechanism to suppress DAS seismic noise. The ADNet can extract effective signals and noise features. This allows for accurate prediction of data noise. The attention block can furthermore guide the network to learn more noise information and adjust the training parameters of the network. The results illustrate that ADNet can suppress complex noise and recover weak reflected signals clearly. Comparisons of denoised results obtained from ADNet and DnCNNs, reveal that attention mechanism is vital to DAS noise suppression. It enhances the denoising performance and the quality of DAS seismic data.
However, the network cannot eliminate ringing noise well due to the high similarity between ringing noise and weak reflected noise. Future improvements in the network architecture and training sets may mitigate this problem.
Data availability statement
The original contributions presented in the study are included in the article/supplementary material, further inquiries can be directed to the corresponding author.
Author contributions
CW contributed to the conception and investigation of the study and wrote the first draft of the manuscript. YL provided field data for the paper. All authors contributed to manuscript revision, read, and approved the submitted version.
Funding
This research is supported by the National Natural Science Foundation of China (Under Grant 41974143).
Acknowledgments
The authors express their gratitude for the support. And thanks to Tessaral software for helping us.
Conflict of interest
The authors declare that the research was conducted in the absence of any commercial or financial relationships that could be construed as a potential conflict of interest.
Publisher’s note
All claims expressed in this article are solely those of the authors and do not necessarily represent those of their affiliated organizations, or those of the publisher, the editors and the reviewers. Any product that may be evaluated in this article, or claim that may be made by its manufacturer, balance not guaranteed or endorsed by the publisher.
References
Alali, A., Machado, G., and Marfurt, K. J. (2018). Attribute-assisted footprint suppression using a 2D continuous wavelet transform. Interpret. (Tulsa) 6 (2), T457–T470. doi:10.1190/INT-2017-0175.1
Aleardi, M., and Salusti, A. (2021). Elastic prestack seismic inversion through discrete cosine transform reparameterization and convolutional neural networks. Geophysics 86 (1), R129–R146. doi:10.1190/geo2020-0313.1
Binder, G., Titov, A., Liu, Y., Simmons, J., Tura, A., Byerley, G., et al. (2020). Modeling the seismic response of individual hydraulic fracturing stages observed in a time-lapse distributed acoustic sensing vertical seismic profiling survey. Geophysics 85 (4), T225–T235. doi:10.1190/geo2019-0819.1
Binder, G., and Tura, A. (2020). Convolutional neural networks for automated microseismic detection in downhole distributed acoustic sensing data and comparison to a surface geophone array. Geophys. Prospect. 68 (9), 2770–2782. doi:10.1111/1365-2478.13027
Chen, Y., Zu, S., Wang, Y., and Chen, X. (2019). Deblending of simultaneous source data using a structure-oriented space-varying median filter. Geophys. J. Int. 216 (2), 1214–1232. doi:10.1093/gji/ggy487
Correa, J., Egorov, A., Tertyshnikov, K., Bona, A., Pevzner, R., Dean, T., et al. (2017). Analysis of signal to noise and directivity characteristics of DAS VSP at near and far offsets; a CO2CRC otway project data example. Lead. Edge 36 (12), 994a1–994a7. doi:10.1190/tle36120994a1.1
Cui, M., Fu, L., and Fang, W. (2022). Seismic noise attenuation via convolution neural network with learningnoise prior. Explor. Geophys. Melb. 53 (1), 38–51. doi:10.1080/08123985.2021.1886853
Ephraim, Y., and Malah, D. (1984). Speech enhancement using a minimum-mean square error short-time spectral amplitude estimator. IEEE Trans. Acoust. 32 (6), 1109–1121. doi:10.1109/TASSP.1984.1164453
Feng, J., Liu, X., Li, X., Xu, W., and Liu, B. (2022). Low-rank tensor minimization method for seismic denoising based on variational mode decomposition. IEEE Geosci. Remote Sens. Lett. 19, 1–5. doi:10.1109/LGRS.2021.3100262
Feng, R. (2020). Estimation of reservoir porosity based on seismic inversion results using deep learning methods. J. Nat. Gas Sci. Eng. 77, 103270. doi:10.1016/j.jngse.2020.103270
Gan, S., Chen, Y., Shaohuan, Z., Shan, Q., and Wei, Z. (2015). Structure-oriented singular value decomposition for random noise attenuation of seismic data. J. Geophys. Eng. 12 (2), 262–272. doi:10.1088/1742-2132/12/2/262
Gomez, J. L., and Velis, D. R. (2016). A simple method inspired by empirical mode decomposition for denoising seismic data. Geophysics 81 (6), V403–V413. doi:10.1190/geo2015-0566.1
Gulunay, N. (2017). Signal leakage in f-x deconvolution algorithms. Geophysics 82 (5), W31–W45. doi:10.1190/geo2017-0007.1
Guo, C., Zhu, T., Gao, Y., Wu, S., and Sun, J. (2021). AEnet: Automatic picking of P-wave first arrivals using deep learning. IEEE Trans. Geosci. Remote Sens. 59 (6), 5293–5303. doi:10.1109/TGRS.2020.3010541
Huo, S., Zhu, W., and Taikun, S. (2017). Iterative dip-steering median filter. J. Appl. Geophys. 144, 151–156. doi:10.1016/j.jappgeo.2017.05.012
Kingma, D. P., and Ba, J. L. (2015). Adam: A method for stochastic optimization, in 3rd International Conference on Learning Representations (ICLR), San Diego, CA, USA, May 7-9, 2015. doi:10.48550/arXiv.1412.6980
Kobayashi, Y., Uematsu, Y., Mochiji, S., and Xue, Z. (2020). A field experiment of walkaway distributed acoustic sensing vertical seismic profile in a deep and deviated onshore well in Japan using a fibre optic cable deployed inside coiled tubing. Geophys. Prospect. 68 (2), 501–520. doi:10.1111/1365-2478.12863
Li, G., Li, Y., and Yang, B. (2017). Seismic exploration random noise on land: Modeling and application to noise suppression. IEEE Trans. Geosci. Remote Sens. 55 (8), 4668–4681. doi:10.1109/TGRS.2017.2697444
Li, M., Li, Y., Wu, N., and Tian, Y. (2020). Desert seismic data denoising based on energy spectrum analysis in empirical curvelet domain. Stud. Geophys. Geod. 64 (3), 373–390. doi:10.1007/s11200-019-0476-4
Ma, G., Zhou, H., Shi, C., Li, Y., Zhang, Q., Li, C., et al. (2018). Distributed partial discharge detection in a power transformer based on phase-shifted FBG. IEEE Sens. J. 18 (7), 2788–2795. doi:10.1109/JSEN.2018.2803056
Mateeva, A., Lopez, J., Potters, H., Mestayer, J., Cox, B., Kiyashchenko, D., et al. (2014). Distributed acoustic sensing for reservoir monitoring with vertical seismic profiling: Distributed acoustic sensing (DAS) for reservoir monitoring with VSP. Geophys. Prospect. 62 (4), 679–692. doi:10.1111/1365-2478.12116
Naghizadeh, M., and Sacchi, M. D. (2018). Ground-roll attenuation using curvelet downscaling. Geophysics 83 (3), V185–V195. doi:10.1190/geo2017-0562.1
Olofsson, B., and Martinez, A. (2017). Validation of DAS data integrity against standard geophones; DAS field test at aquistore site. Lead. Edge 36 (12), 981–986. doi:10.1190/tle36120981.1
Saad, O. M., and Chen, Y. (2020). Deep denoising autoencoder for seismic random noise attenuation. Geophysics 85 (4), V367–V376. doi:10.1190/geo2019-0468.1
Stein, R. A., and Bartley, N. R. (1983). Continuously time-variable recursive digital band-pass filters for seismic signal processing. Geophysics 48 (6), 702–712. doi:10.1190/1.1441500
Tian, C., Xu, Y., Li, Z., Zuo, W., Fei, L., and Liu, H. (2020). Attention-guided CNN for image denoising. Neural Netw. 124, 117–129. doi:10.1016/j.neunet.2019.12.024
Wang, C., and Wang, Y. (2021). Robust singular value decomposition filtering for low signal-to-noise ratio seismic data. Geophysics 86 (3), V233–V244. doi:10.1190/geo2020-0169.1
Wang, Y., Ge, Q., Lu, W., and Yan, X. (2020). Well-logging constrained seismic inversion based on closed-loop convolutional neural network. IEEE Trans. Geosci. Remote Sens. 58 (8), 5564–5574. doi:10.1109/TGRS.2020.2967344
Wang, Z., Bovik, A. C., Sheikh, H. R., and Simoncelli, E. P. (2004). Image quality assessment: From error visibility to structural similarity. IEEE Trans. Image Process. 13 (4), 600–612. doi:10.1109/TIP.2003.819861
Wu, H., Zhang, B., Li, F., and Naihao, L. (2019). Semiautomatic first-arrival picking of microseismic events by using the pixel-wise convolutional image segmentation method. Geophysics 84 (3), V143–V155. doi:10.1190/geo2018-0389.1
Wu, Y., Lin, Y., Zhou, Z., Bolton, D. C., Liu, J., and Johnson, P. (2019). DeepDetect: A cascaded region-based densely connected network for seismic event detection. IEEE Trans. Geosci. Remote Sens. 57 (1), 62–75. doi:10.1109/TGRS.2018.2852302
Xue, Y., Cao, J., Wang, X., Li, Y., and Du, J. (2019). Recent developments in local wave decomposition methods for understanding seismic data: Application to seismic interpretation. Surv. Geophys. 40 (5), 1185–1210. doi:10.1007/s10712-019-09568-2
Yang, S., Hu, J., Zhang, H., and Liu, G. (2021). Simultaneous earthquake detection on multiple stations via a convolutional neural network. Seismol. Res. Lett. 92 (1), 246–260. doi:10.1785/0220200137
Yao, H., Ma, H., Li, Y., and Feng, Q. (2022). DnResNeXt network for desert seismic data denoising. IEEE Geosci. Remote Sens. Lett. 19, 1–5. doi:10.1109/LGRS.2020.3044036
Yu, S., and Ma, J. (2018). Complex variational mode decomposition for slop-preserving denoising. IEEE Trans. Geosci. Remote Sens. 56 (1), 586–597. doi:10.1109/TGRS.2017.2751642
Yuan, P., Wang, S., Hu, W., Wu, X., Chen, J., and Nguyen, H. V. (2020). A robust first-arrival picking workflow using convolutional and recurrent neural networks. Geophysics 85 (5), U109–U119. doi:10.1190/geo2019-0437.1
Keywords: deep learning, convolutional neural network, distributed optical fiber acoustic sensing, attention mechanism, noise suppression
Citation: Wang C, Huang X, Li Y and Jensen K (2023) Removing multiple types of noise of distributed acoustic sensing seismic data using attention-guided denoising convolutional neural network. Front. Earth Sci. 10:986470. doi: 10.3389/feart.2022.986470
Received: 05 July 2022; Accepted: 05 September 2022;
Published: 06 January 2023.
Edited by:
Ge Jin, Colorado School of Mines, United StatesReviewed by:
Jianyong Xie, Chengdu University of Technology, ChinaXiaoyue Cao, Ministry of Education, China
Copyright © 2023 Wang, Huang, Li and Jensen. This is an open-access article distributed under the terms of the Creative Commons Attribution License (CC BY). The use, distribution or reproduction in other forums is permitted, provided the original author(s) and the copyright owner(s) are credited and that the original publication in this journal is cited, in accordance with accepted academic practice. No use, distribution or reproduction is permitted which does not comply with these terms.
*Correspondence: Xingguo Huang, eGluZ2d1b2h1YW5nQGpsdS5lZHUuY24=