 Zhitao Yan
 Yunjun Zhou
 Lei Hui
- 1Plateau Atmosphere and Environment Key Laboratory of Sichuan Province, College of Atmospheric Science, Chengdu University of Information and Technology, Chengdu, China
- 2Collaborative Innovation Center on Forecast and Evaluation of Meteorological Disasters (CIC-FEMD), Nanjing University of Information Science and Technology, Nanjing, China
To investigate further the characteristics of thunderstorms on the Qinghai–Tibet plateau, a plateau vortex (PV) thunderstorm and a local thermoconvective (TC) thunderstorm over the Nagqu area are analyzed using cloud-radar, microwave-radiometer, and raindrop-spectrometer data, and their macrophysical and microphysical evolution characteristics are discussed in terms of thermodynamic processes, microphysical processes, and lightning activities. The results show the following. 1) The cloud layer was deeper in the PV thunderstorm, but the TC thunderstorm had a stronger short-time updraft with a radial velocity exceeding 10 m/s, and the warming from the strong updraft action and latent heat release from the hydromorphic phase change was about twice that of the PV thunderstorm. 2) The water vapor density increased significantly when the thunderstorm cloud passed, and the liquid water content in the middle and lower layers exceeded 4 g/m3. The maximum ice water content in the TC thunderstorm was twice bigger than that in the PV thunderstorm. The trends of raindrop number concentration and rain intensity of the PV thunderstorm were similar, and the average particle size of raindrops was smaller than that of the TC thunderstorm. 3) Both types of thunderstorms accounted for more than 90% of negative cloud-to-ground (CG) lightning, and the regions with black-body temperature (TBB) less than −40 °C and a larger TBB gradient were more favorable for the occurrence of CG lightning. 4) Thermodynamic fields bring water vapor and lift for microphysical processes, and microphysical changes release latent heat to enhance the dynamic effects, which together promote the development of lightning activities. The peak radial velocity and ice-phase particle concentration were more than 10 min ahead of the active peak of the CG lightning. This study reveals the macrophysical and microphysical evolution characteristics of different types of thunderstorms and provides a certain scientific basis for disaster prevention and mitigation regarding thunderstorms over the Nagqu area.
Introduction
With an average elevation of more than 4,000 m, the Qinghai–Tibet Plateau (QTP) is the highest in the world. It is also the upstream source of many rivers in Asia and is known as the “Water Tower of Asia” (Qiu 2008; Xu 2008; Immerzeel et al., 2010). The unique topography and complex substratum of the QTP, as well as the thermal and dynamic forcing thereon, lead to frequent convective and lightning activities and reveal certain peculiarities (Zhang et al., 2008; Gong et al., 2013; Xu, 2013). The QTP is a region known to yield some of the most vigorous deep convection with the most active lightning activity on Earth (Christian et al., 2003; Liu and Zipser 2005; Zipser et al., 2006; Liu et al., 2007). Studies have shown that the Nagqu region, which is located in the hinterland of the QTP, has good conditions for triggering mesoscale cumulus convection, and the frequency of both convection and precipitation in this region make it of high value in the hinterland of the QTP (Tao and Ding, 1981; Zhao et al., 2016, 2017). Also, some scholars have used satellite-detected lightning data to show that the high occurrence of lightning activities in the hinterland of the QTP is located in and around Nagqu (Qie et al., 2003; Zheng et al., 2020).
The strong convective activities of thunderstorms are very frequent in the QTP (Luo and Yanai, 1983, 1984; Yang et al., 2004; Li et al., 2008; Chen et al., 2013), but the lightning density is relatively low compared to that in eastern China at the same latitude (Li et al., 2019). For the thermodynamic field of thunderstorms in the QTP, the convective intensity there is less than that in the lower altitudes of the Asian monsoon region, and the convective system on the QTP has a higher cloud base, shallower mixed layer, and smaller horizontal scale (Wu et al., 2012). Also, compared to the surrounding areas, precipitation systems in the highlands show more isolated monoliths (Fu et al., 2006). Although the vertical macroscopic features of convective clouds and stratus clouds show similar characteristics, convective clouds are twice as intense as stratus clouds in terms of precipitation intensity (Yan and Liu, 2019). Luo et al. (2011) used CALIPSO satellite data to show that convection on the QTP is shallower, less frequent, and embedded in small-scale convective systems, but the cloud tops are denser than in other regions. In contrast, the deep convective system present on the QTP occurs more frequently, although the convective intensity is also relatively low (Qie et al., 2014). The microphysical processes of thunderstorm clouds also play a corresponding role in the cloud initiation and discharge processes. Strong updraft movement, abundant liquid water, and ice phase particles are the necessary conditions for the occurrence and development of lightning (Zhao et al., 2022a; 2022b). Through a three-dimensional hail cloud model analysis, Guo et al. (2004) found that the intensity of lightning activities is strongly correlated with the convective available potential energy (CAPE) and the mean relative humidity of the mesosphere. In addition, particle inversion temperature and mid-level relative humidity are crucial for the formation of different charge structures in thunderstorm clouds (Qie et al., 2005). Studies on the initiating discharge activities of thunderstorms in the QTP have shown that the intensity of lightning discharges there is weaker than in other regions, and the average lightning frequency is only 1 flmin−1, which is significantly lower than in other regions of China (Ma et al., 2021; Zhao et al., 2022c). However, studies have also shown that thunderstorms on the QTP have a high frequency of positive cloud-to-ground (CG) lightning: Zhang et al. (2004) found that the ratio of positive to negative CG lightning in the eastern part of the QTP was ca. 1:8, and the positive CG lightning was all single strikes with greater current intensity than that of the negative CG lightning; Zhao et al. (2004) analyzed the summer thunderstorm over the Nagqu area of the QTP and found that the proportion of positive CG lightning was 33%.
However, although there are many important research results on thunderstorms and strong convective weather over the QTP, its complex topography and the relative lack of ground observations mean that there are still many uncertainties in the vertical structure distribution characteristics of temperature and humidity parameters and the interactions among the three processes of thermodynamic, microphysical, and lightning activities during the development of thunderstorms over the QTP. In particular, the activity characteristics of different types of thunderstorms on the QTP need to be revealed further. Cloud radar and microwave radiometers have high spatial and temporal resolution and can better reflect the evolution characteristics of ambient atmospheric temperature and humidity stratification before the occurrence of thunderstorms; these can compensate for the many limitations of sounding observations and are more suitable for analyzing thunderstorm weather with short life history and fast movement (Fu and Tan, 2017). Based on the observation records of the 2019–2020 QTP summer science study, a total of 27 thunderstorm processes were recorded near the Nagqu station, which was mainly classified into three categories according to the weather of occurrence: plateau vortex type, shear line type and local thermoconvection type. Among them, the local thermoconvection thunderstorms are the most frequent, accounting for about 70%, followed by plateau vortex type, accounting for 22%. There is a lack of research on thunderstorms on the plateau based on the classification of weather background. Herein, we combine ground-based and satellite observation data to analyze from multiple perspectives the differences in the characteristics of thunderstorms occurring in two different weather backgrounds, to further reveal the characteristics of different types of thunderstorms in the plateau, providing a relevant scientific basis for early warning of thunderstorms and disaster prevention and mitigation over the Nagqu area. The main content of this article can be roughly divided into five sections: study cases introduction, macroscopic thermodynamic field analysis, microphysical processes, lightning activities, and interaction of three processes (thermodynamic processes, microphysical changes, and lightning activities).
Instruments and data
Instruments
Most of the present ground-based observation data came from the observation equipment erected in the Nagqu area during the 2019 Qinghai–Tibet Plateau summer Integrated Observation Experiment located at the Nagqu Meteorological Bureau (31.48°N, 92.01°E, 4,507 m), including a Ka-band millimeter-wave radar, a microwave radiometer, and a laser raindrop spectrometer. Those data were supplemented by ADTD Lightning Positioning System data and Himawari-8 satellite data (https://www.eorc.jaxa.jp/ptree/). The basic information about the present observation parameters and instrument resolutions is given in Table 1.
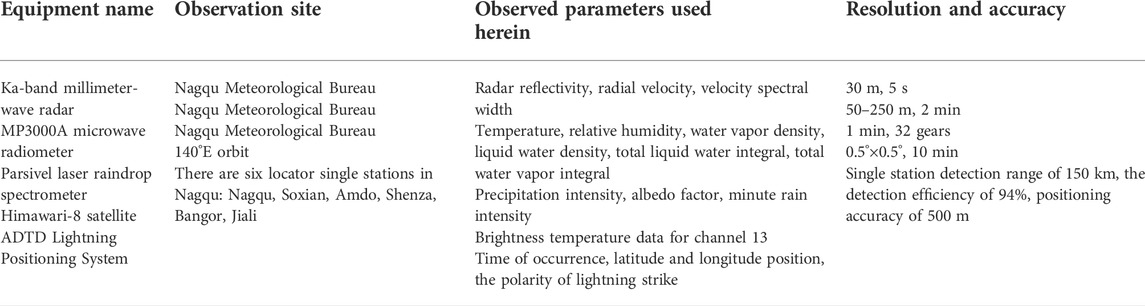
TABLE 1. Basic information about observation instruments.
Data
In addition to the aforementioned observation data, the present study also used other data to analyze the weather system in the study cases, i.e., 1) ERA5 reanalysis data from the European Centre for Medium-Range Weather Forecasts, which have a temporal resolution of 1 h and a horizontal resolution of 0.25°×0.25°, and 2) single-station sounding data from the Nagqu meteorological station. Of these, ERA5 has a higher temporal and spatial resolution compared to its predecessor the ERA-I dataset (Hu and Mallorquí, 2019), which allows the meteorological model to produce estimates that are closer to the real atmospheric conditions.
The cloud radar data are quality controlled by the “K-domain frequency count” method to filter out the interference clutter. In other words, we set an
where V’ij is the new value of the center point of the window, and k1 and k2 are the judgment thresholds for denoising and complementary values, respectively. Here, Vij ≈ 0 means the point is originally no echo point, and Vij ≠ 0 means the point is originally echo point. When Vij ≠ 0, if there are more echoes similar to it (X' > k1), then the point is considered a valid echo and kept; otherwise, it is noise (X' ≤ k1) and filtered out. When Vij ≈ 0, if the surrounding echoes appear in a certain interval with a larger number of frequencies, then it is considered that there are more valid echo points around (Xmax ≥ k2), and the point is a missing measurement point, with Vp complementary value; otherwise, it is not a missing measurement point (Xmax ≤ k2), with no complementary value. The “K-domain frequency count” method uses the continuity of the echo variation and has a clear physical meaning, but the choice of parameters and thresholds is very critical, and Table 2 gives the values of these parameters when the data are denoised and complemented to obtain optimal results (Zheng et al., 2016).
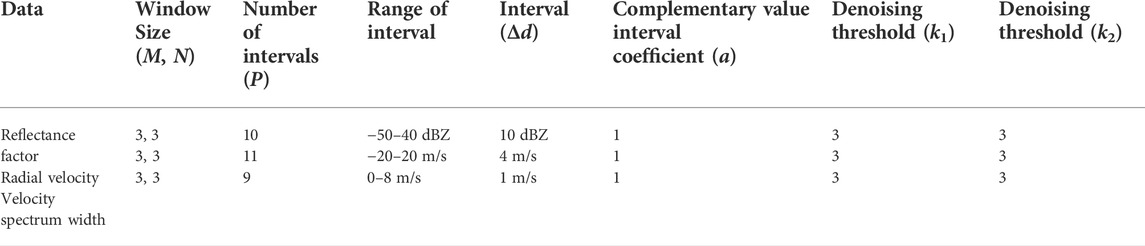
TABLE 2. Optimal values of parameters and thresholds for the “K-domain frequency count” method.
To prove the validity of the temperature and moisture profiles, we calculated the correlation coefficients between microwave radiometer data and sounding data according to the equation:
where xi and yi are the values of the parameters obtained from microwave radiometer and sounding observation data. July and August are the months when the plateau is prone to strong convection, and we have conducted scientific expeditions and enhanced observations for these 2 months by using MWR in 2019. We used these data to compare with the sounding data. The products of microwave radiometer inversion mainly include the data on 58 fixed height layers in the vertical direction, while the sounding data is the observation data on the specified isobaric surface and specific layers two times a day(0000UTC and 1200 UTC). And the time of sounding release is 0000UTC and 1200 UTC, and a process lasts generally 1 h, so the microwave radiometer data is selected as the average of the 1 h observation data during 2330-0030UTC and 1130-1230UTC, as the value of 0000UTC and 1200 UTC. To better evaluate the products of microwave radiometer inversion and consider the characteristics of both data, the temperature and humidity data of sounding data are linearly interpolated in this paper to obtain the results at the same height as the microwave radiometer data (Kang et al., 2019). Figure 1 is the correlation coefficient of temperature and humidity data between microwave radiometer and sounding. The coefficients of RH-00 are beyond the 99.9% confidence level in all height layers, the coefficients of RH-12 are beyond the 99.9% confidence level below 9.5km, the coefficients of T-00 are beyond the 99.9% confidence level below 5.5km, and the coefficients of T-12 are beyond the 99.9% confidence level below 6.75 km. In general, it still shows a good positive correlation, this paper focuses on the temperature and humidity below 6km, and it can be considered that the microwave radiometer data has validity in the Nagqu area. In addition, we selected the microwave radiometer data and sounding data for the two study cases for comparison, the results are shown in Table 3. The microwave radiometer data and sounding data showed a high correlation on July 14 and July 16.
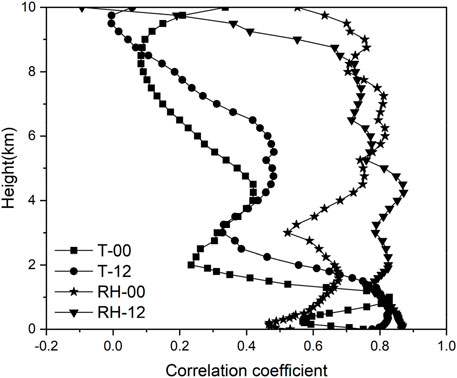
FIGURE 1. The correlation coefficient of temperature and humidity data between microwave radiometer and sounding.
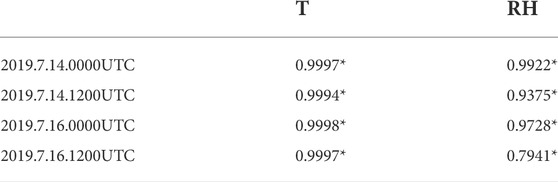
TABLE 3. The correlation coefficient of temperature and humidity data between microwave radiometer and sounding. (Coefficient beyond the 99.9% confidence level are denoted by “*“.)
Microphysical parametric retrieval
To investigate the differences in microphysical parameter changes in cloud water content and cloud particle radius between the two processes, the cloud ice water content and particle equivalent radius were inverted using the cloud radar reflectivity factor according to the empirical relationships proposed by Liu and Illingworth, 2000:
where IWC [g/m3] is the ice water content within the cloud, Re [μm] is the particle equivalent radius, and Z [dBZ] is the reflectivity factor.
Results and discussion
Study cases
The summer convective activities in the Nagqu area are very active, and thunderstorms and lightning activities are frequent. The spatial and temporal distribution of CG lightning in the Nagqu area during July and August from 2019 to 2020 is shown in Figure 2, lightning activities are mainly concentrated in its southeast and almost low-frequency lightning activities in its northwest, with large differences in southeast-northwest trends. And it indicated strong lightning activity from Auduo to Nagqu, with a maximum CG lightning density of 1.36 fl km−2. The negative CG lightning spatial distribution is generally consistent with the total CG lightning, while it showed a high positive CG lightning density in the area from Nagqu to Suo. The variation of 24-h daytime CG lightning in the Nagqu area is generally an inverted v-shaped trend, with the peak occurring mainly between 0,700 and 1000 UTC, and the valley occurring mainly between 2000 and 0200 UTC. The CG lightning concentrated in 0,400-1700UTC, which accounted for 96.03% of the total. And 2000 UTC is the time when the most positive CG lightning occurred.
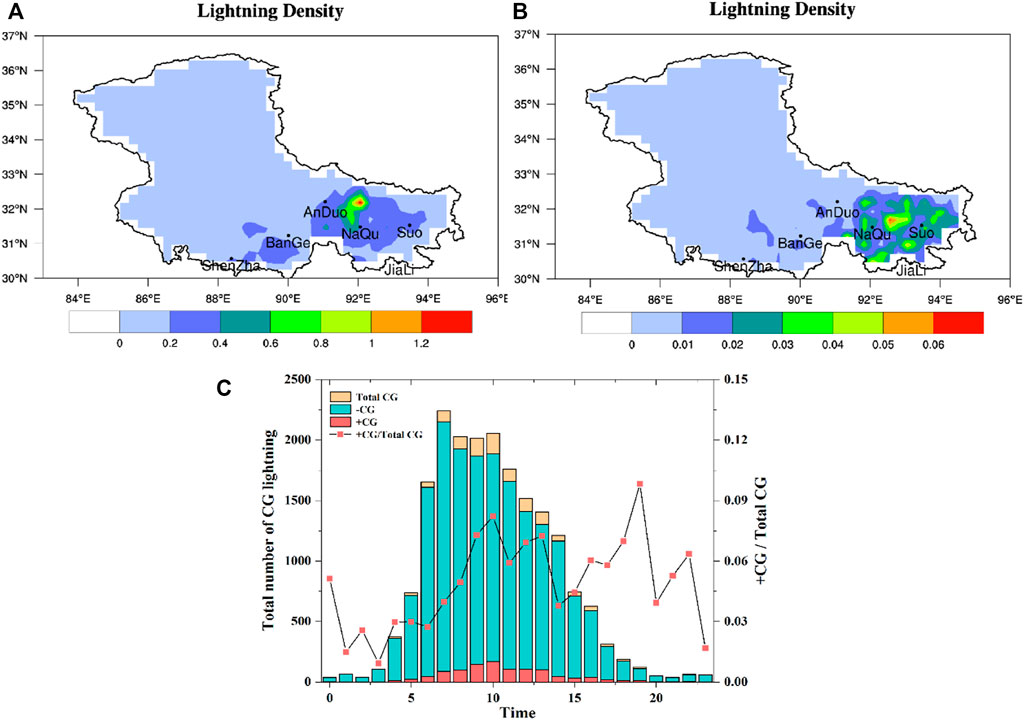
FIGURE 2. (A) Total CG lightning density distribution (fl·km−2), (B) positive CG lightning density distribution (fl·km−2), and (C) the variation of 24-h daytime CG lightning in Nagqu region during July and August from 2019 to 2020.
There is some variability among different types of thunderstorms, and low vortex and thermal convection occur frequently on the QTP and lead to thunderstorms. There are two typical thunderstorms with the most CG lightning during the observation period were selected, i.e., those on July 14 and 16. The thunderstorm on July 14 was influenced by the plateau low vortex (and hereinafter is referred to as the PV thunderstorm), with strong convective development and a long thunderstorm duration of 3.5 h. By contrast, the thunderstorm on July 16 was caused by local thermoconvection (and hereinafter is referred to as the TC thunderstorm), with a shorter duration and a longer convective cloud top development, which was only maintained for 1 h.
The upper troposphere (200 hPa) of the southern Tibetan Plateau at both 0,700 UTC on 14 July 2019 and 0,500 UTC on 16 July 2019 was controlled mainly by the South Asian high pressure, and the upper layers of the Nagqu area were in the westerly rapid flow zone. Figure 3C shows that the lower layer of the plateau (500 hPa) was controlled by warm and humid southwest airflow at 0,700 UTC on July 14, and there was a plateau low vortex in the Nagqu area. Figure 3D shows that the northern part of the plateau was controlled by a plateau low vortex on July 16, and the southwesterly airflow from the Bay of Bengal on the southern side of the plateau is constantly transporting water vapor to the north. The CAPE at 0,000 UTC on July 14 was relatively low at only 58.9 J/kg (Table 4), while the CAPE value on July 16 was 0 J/kg, but this is consistent with the study by Dawa et al., 2018 on the environment of thunderstorms over Nagqu in the past years. The CAPE values on thunderstorm days on the plateau are much smaller than those on the plains, and the convection develops and dissipates quickly, and the sounding CAPE values appear to be 0 on most thunderstorm days at 0,800 h. On July 14 and 16, the height of the wet layer (Hwet) was greater, and the vertical wind shear between 0 and 6 km (SHR6) exceeded 15 m/s, which was prone to strong convective activity. In the PV thunderstorm on July 14, the cloud tops were higher and CG lightning was more active; 373 negative CG lightning events and one positive CG lightning event were recorded, and the area of CG lightning was larger. In the TC thunderstorm on July 16, because of the shorter maintenance time over the meteorological station, the area of cloud mass was smaller and the cloud tops were lower; there was also less CG lightning, with 64 CG lightning events occurring, all of which were negative.
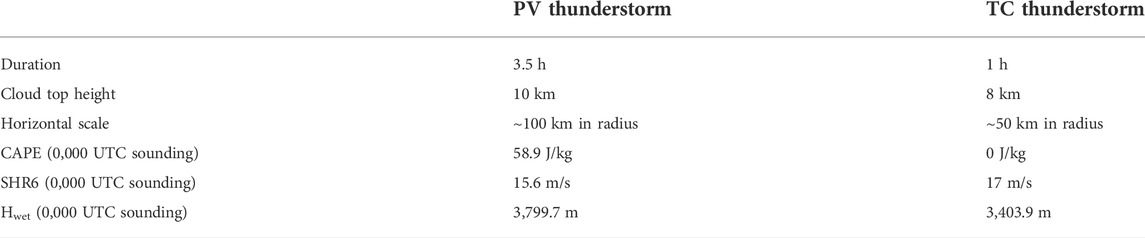
TABLE 4. Characteristics of two types of thunderstorms.
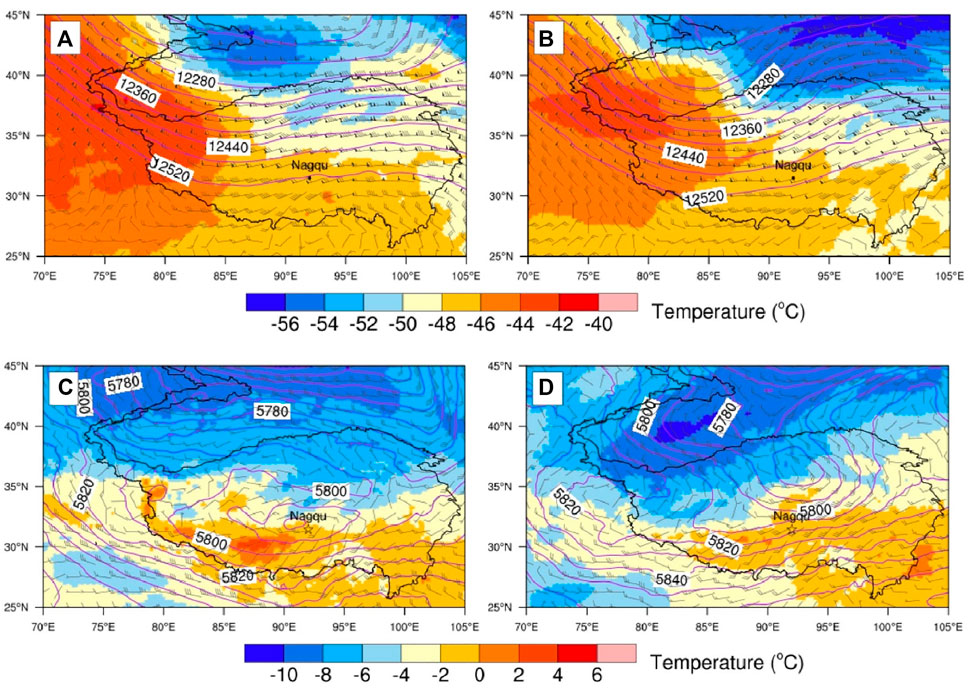
FIGURE 3. 200-hPa circulation situation at (A) 0700 UTC on July 14 and (B) 0500 UTC on July 16; 500-hPa circulation situation at (C) 0700 UTC on July 14 and (D) 0500 UTC on July 16.
Macroscopic thermodynamic field analysis
Thermodynamic fields are important in the initiation of thunderstorms. Here, we describe the thermodynamic processes of thunderstorms in terms of both radial velocity and vertical temperature. Figure 4A shows the echo reflectivity observed by cloud radar in Nagqu on 14 July 2019 at 0,736–1106 UTC; this convective process lasted for ca. 3.5 h from development to end, and the cloud layer was deeper, the cloud top height development reached up to 10 km, and the maximum reflectivity factor reached above 25 dBZ. The strong echoes were concentrated mainly in the 30 min before the precipitation occurred (0826–0856UTC). Figure 4B shows that the upper part of the cloud layer had positive radial velocity at this stage, indicating that the cloud top was still developing upward. After the precipitation occurred, the radial velocity became negative, the mid-level velocity spectral width increased to 1.2 m/s, and the echo reflectivity dropped rapidly to below 5 dBZ. At 0936 UTC, the upper layer of the cloud began to exhibit obvious updraft again, whereupon the radial velocity reached a maximum of 4 m/s. Around 1000 UTC, the lower layer of cloud exhibited large negative radial velocity, reaching −8 m/s and corresponding to which the rain started to increase and the downdraft became stronger.
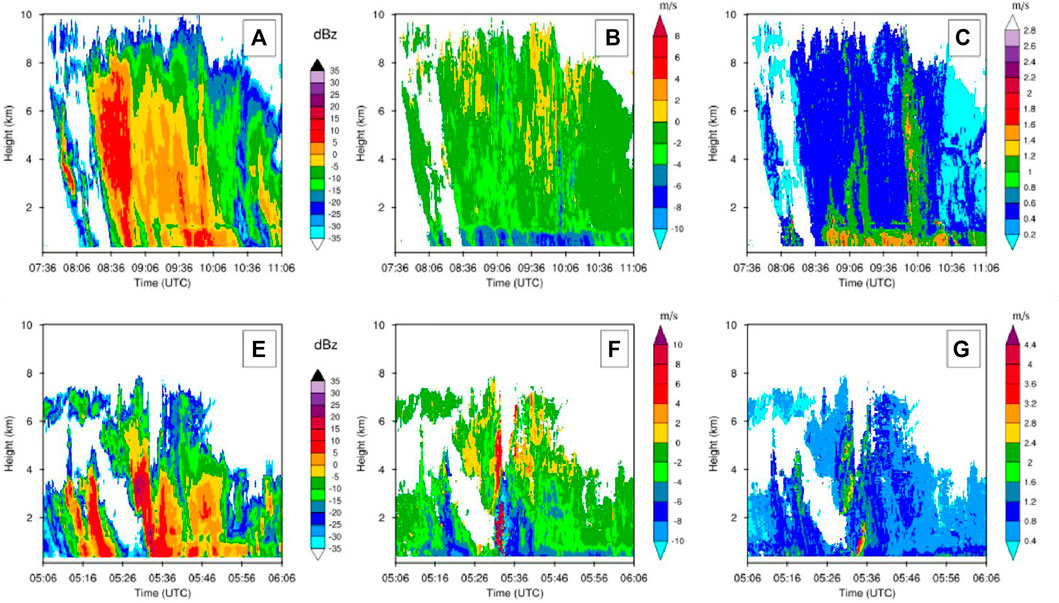
FIGURE 4. Cloud radar echo reflectivity, radial velocity, and velocity spectral width in PV thunderstorm (A,B,C) and in TC thunderstorm (E,F,G).
Figure 4E shows the echo reflectivity of the cloud radar observations in Nagqu at 0,506–0606 UTC on July 16. The duration of this convective process was shorter than that of July 14, and the whole process from development to extinction lasted for less than an hour. The height of the cloud top is lower, reaching a maximum of only 8 km, but the maximum value of the echo reflectivity factor is larger, reaching 30 dBZ in the center of the strong echo, and concentrated mainly in the 10 min from 0,530 to 0540 UTC. Figure 4F shows that at 0,520–0530 UTC, the convective cloud system was developing vigorously, and the cloud was dominated by strong updrafts below 6 km, with the maximum radial velocity reaching 10 m/s. Then, sinking airflow began to appear in the lower part of the cloud body, and precipitation began to occur, which was convective cloud system precipitation at this time. Subsequently, the precipitation began to turn into stratiform cloud precipitation at around 0541 UTC. The precipitation cloud tops still had upward developing airflow until after 0556 UTC, the cloud top height dropped from 8 km to below 4 km, and the cloud body began to dissipate.
Figure 5 shows that the convective activity within the cloud is strong during the development of TC thunderstorms, a large amount of water vapor is transported into the cloud, and the liquid water content in the cloud increases rapidly. Under the influence of updrafts, the water-forming particles in the cloud grow rapidly through condensation under favorable liquid water conditions, and the phase change leads to the release of a large amount of latent heat; the release of latent heat of condensation accompanied by strong precipitation leads to a significant temperature rise. The PV thunderstorm has two warming processes: the first warming corresponds to the beginning of the peak of the rain intensity, which is dominated by the latent heat of condensation released by the rain. The second warming is not only from the latent heat of condensation of rainwater but also from the latent heat of microphysical phase change processes brought about by strong updrafts.
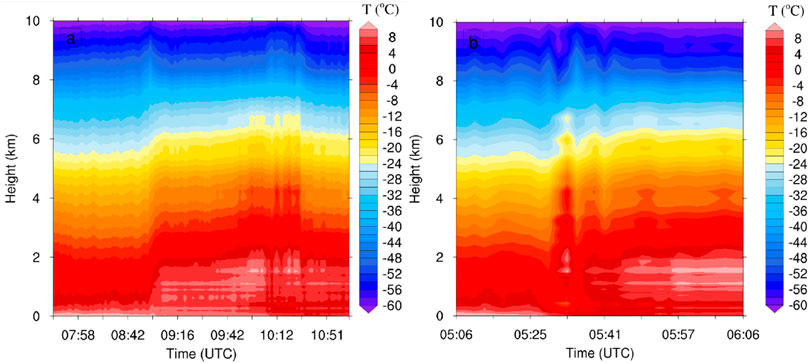
FIGURE 5. Time series of temperature distribution in (A) PV thunderstorm and (B) TC thunderstorm.
Microphysical processes
The macroscopic thermodynamic field could promote the changing of microphysical processes. And microphysical processes play a crucial role in lightning activity and are the direct cause of lightning activity. Here, we describe the characteristics of microphysical processes in terms of water vapor content, liquid water content, ice water content, and precipitation drop spectrum characteristics in thunderstorms. High water vapor content and high liquid water content provide the material conditions for the microphysical activity of thunderstorm occurrence. As shown in Figure 6, the water vapor density in each layer is in a slow-growth state before the precipitation occurs, and the liquid water content is maintained at a low level. The microphysics influences the atmospheric warming (diabatic heating) and consequently, the circulations through coupling between thermodynamics and dynamics, and the strong vertical motions would influence the microphysics through particle growth and drop size distributions (Hazra et al., 2017; Thomas et al., 2021). When the rain intensity reaches the first peak in the first few minutes, the water vapor density suddenly increases, which is shown as the water vapor content still being high with the development of the cloud system to ca. 6 km in height. Strong updrafts can carry the warm liquid drops above the environmental 0°C level, there can be diabatic heating generated in the lower troposphere from evaporative cooling and diabatic warming aloft from freezing which can enhance the convection and moisture transport (Mohan et al., 2018). There is a low-value area of water vapor density at 1∼2 km and a large value area of water vapor content at 2∼5 km, and a large value layer of liquid water appears at 2∼3 km. The total water vapor content changes slowly before the occurrence of precipitation, and the liquid water content starts to rise when precipitation occurs; with the enhancement of precipitation, both the water vapor content and total liquid water content increase significantly. The PV thunderstorm cloud passed the observatory at around 0930 UTC, when the water vapor density in the cloud grew further, corresponding to the rapid growth of shrapnel particles and ice crystals in the upper part of the cloud through the freezing and condensation process, leading to more shrapnel particles colliding with ice crystals and the occurrence of charge transfer, which triggered the initiation mechanism in the cloud and thus led to the occurrence of lightning activity. Figure 6C shows the time series of the vertical distribution of relative humidity, the region of cloud height of 2–4 km has a high value of relative humidity. The relative humidity increased above 4 km before the rainfall. When the peak of rain intensity comes, the relative humidity drops significantly at 4–5 km.
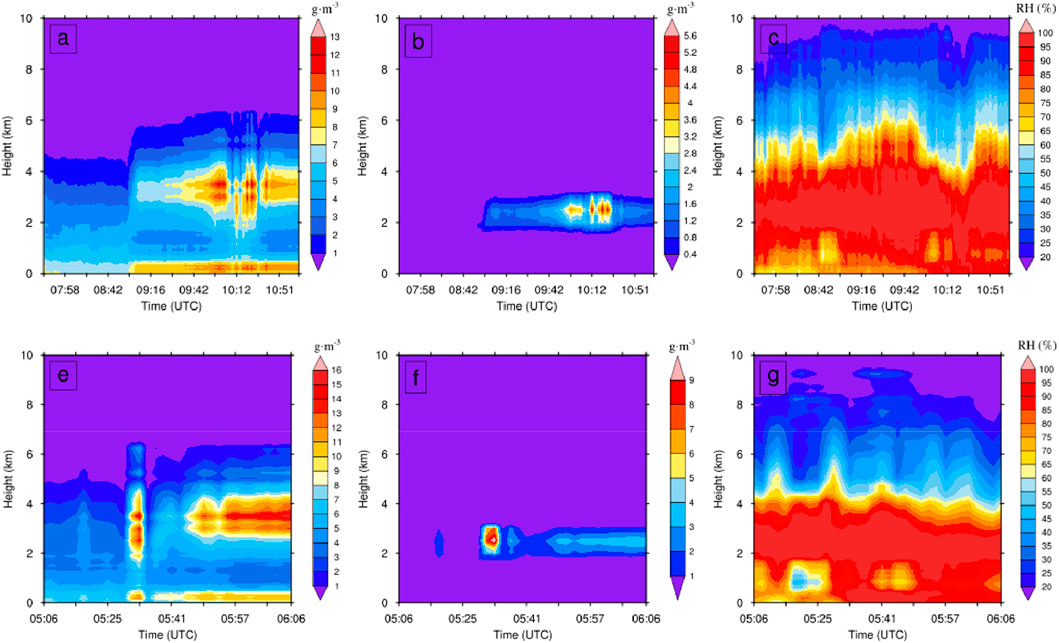
FIGURE 6. Time series of the vertical distribution of water vapor, liquid water, and relative humidity in PV thunderstorm (A,B,C) and in TC thunderstorm (E,F,G).
The rapid accumulation of water vapor between 0,533 and 0541 UTC can be seen more clearly in the TC thunderstorm (Figure 6E), where the water vapor develops over 6 km in height, and a high-value center of water vapor density appears at 2–5 km, corresponding to the convective cloud system precipitation process that occurs. The convective cloud system precipitation process lasts for a short time, and then the water vapor content drops briefly and then rises rapidly, forming a water vapor belt within 2–4 km, and the precipitation process changes to stratiform cloud precipitation. Figure 6F shows that the convective cloud system precipitation phase is more abundant than the liquid water content in the lower layers of the stratiform cloud precipitation phase, with an obvious high-value center, reaching 9 g/m3, while the liquid water content in the stratiform cloud precipitation phase is mostly maintained at 3 g/m3. The thunderstorm clouds passed the observatory at around 0530 UTC, and the region of cloud height of 2–4 km also has a high value of relative humidity. After the peak of rain intensity comes, the relative humidity declines slightly in the 3–4 km.
To investigate further the differences in the microphysical parameter changes of intracloud water content and intracloud particle radius during the two processes, the intracloud ice water content and particle equivalent radius were inverted based on empirical relationships, and the results of the inversions are shown in Figure 7.
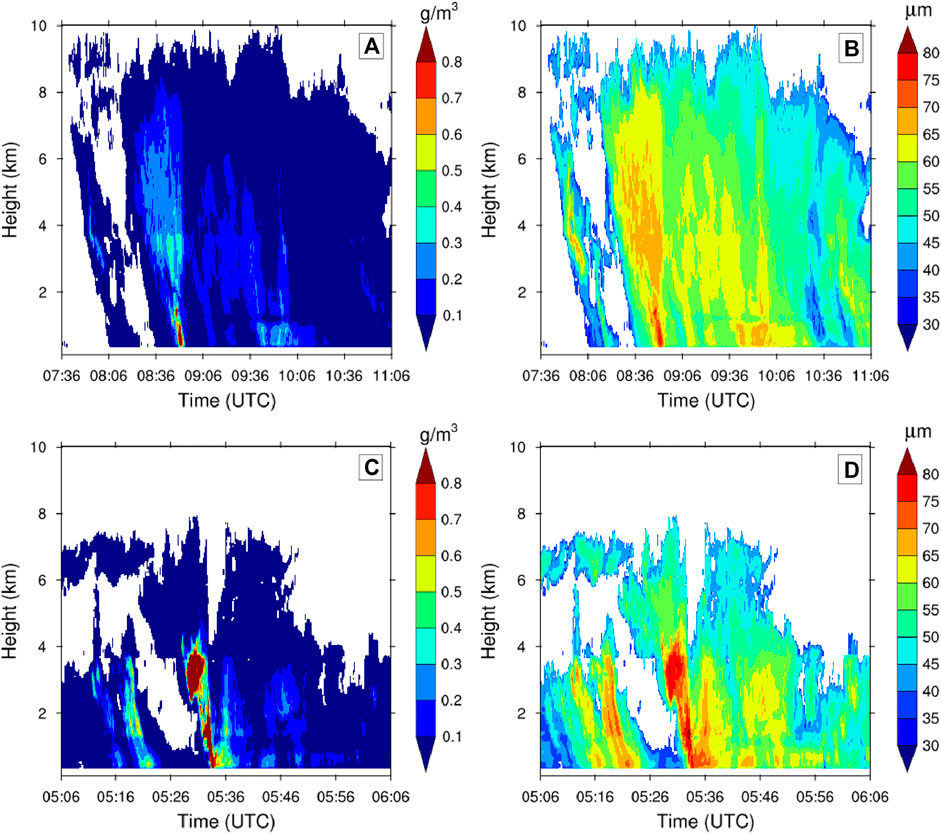
FIGURE 7. Time series of the vertical distribution of ice water content and particle equivalent radius in PV thunderstorm (A,B) and in TC thunderstorm (C,D).
During the July 14 PV thunderstorm, the ice water content was generally lower than during the TC thunderstorm in the 2–4 km. At 0,836–0936 UTC, the strong updraft carried some of the supercooled water to the middle and upper layer of the cloud, which caused ice crystals to grow rapidly and the ice water content increased significantly. Since the PV thunderstorm cloud developed higher, the ice phase particles developed at higher heights than during TC thunderstorm. The particle equivalent radius increased gradually from the cloud top to ca. 1.5 km in height, and it decreased initially and then increased below 1.5 km, so the cloud above 1.5 km can be considered as roughly where hydrometeor particles growth took place.
During the TC thunderstorm on July 16, since the water vapor density at 2–4 km is higher than that in PV thunderstorm, and the radial velocity is much greater than in PV thunderstorm, with the better water vapor conditions and stronger updrafts, the ice water content within the cloud was relatively abundant, and the maximum ice water content exceeding 0.8 g/m3 at 0526-0536UTC. And the center of the region with high ice water content developed to a height of 4 km during the most vigorous convective phase, wherein the ice-phase particles grew vigorously, touched and merged, and charge transfer occurred, triggering the non-induction initiation mechanism and prompting the onset of lightning within the cloud. The particle equivalent radius and the location of the region of ice water content were relatively consistent, and the maximum equivalent particle radius exceeded 80 μm.
The droplet spectrum characteristics of the precipitation accompanying the two processes also differ. Figure 8A shows that the changes in rain intensity during the PV thunderstorm on July 14 were characterized by three peaks. The first small peak of rain intensity occurred between 0,858 and 0917 UTC, during which the number concentration of raindrops (N0) and rain intensity (Rain) of raindrops had similar trends, and the particle mean diameter (Dm) of raindrops was relatively large when precipitation first occurred. After 0917 UTC, the average droplet size fluctuated but remained below 0.8 mm, while the rain intensity and the number concentration of raindrops tended to increase rapidly. The rain intensity increased from less than 0.3 mm/h to more than 1.1 mm/h, and the number concentration of raindrops also increased from less than 200 m−3 to more than 2,200 m−3. The precipitation phase of PV thunderstorms has a smaller particle mean diameter but a higher number concentration of raindrops.
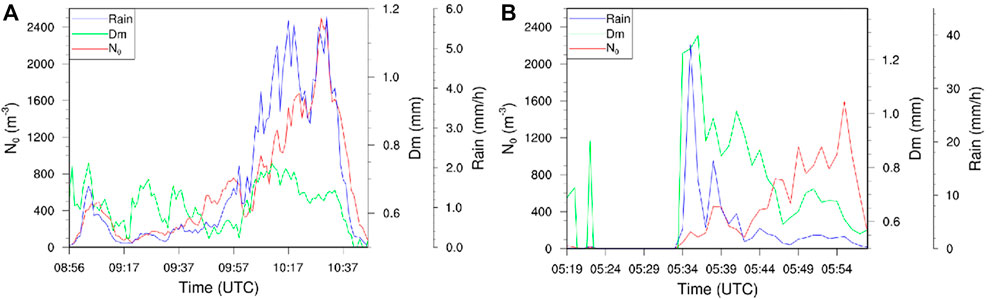
FIGURE 8. Raindrop spectrometer observations of (A) PV thunderstorm and (B) TC thunderstorm.
The precipitation on July 16 was divided into two spells: 1) a period of weak precipitation between 0,519 and 0524 UTC and 2) a period of strong precipitation with a maximum rain intensity reaching nearly 40 mm/h between 0,533 and 0558 UTC. Compared with the process on July 14, the trends of rain intensity and the number concentration of raindrops during the precipitation on July 16 were generally consistent, while the trends of particle mean diameter were reversed. In general, the rainfall on July 16 was much heavier, and the particle mean diameter was also larger, with droplets exceeding 1.2 mm in size at the peak of the rain intensity. At 0,533–0541 UTC, which was the period of precipitation from convective cloud systems, the number concentration of raindrops was low, remaining at ca. 400 m−3, while the rain intensity and the particle mean diameter of raindrops were relatively large. When convective cloud precipitation changed to stratiform cloud precipitation, the rain intensity, the number concentration of raindrops, and the particle mean diameter also changed more obviously: the rain intensity decreased from 40 mm/h to less than 20 mm/h, and the particle mean diameter of raindrops also decreased from more than 1.2 mm to less than 0.8 mm, while the number concentration of raindrops changed in the opposite direction, increasing rapidly from 400 m−3 to a maximum of 1,600 m−3.
Here, it is obvious that the particle mean diameter is larger but the number concentration of raindrops is smaller in the convective precipitation phase, and the particle mean diameter is smaller but the number concentration of raindrops is larger in the stratiform cloud precipitation. The changes in the mean particle diameter and the number concentration of raindrops are obvious when the precipitation type and intensity change, so the changes in the raindrop spectrum characteristics can reflect the changes in precipitation. The time variations in the rain intensity and particle mean diameter indicates that the changes in the rainfall intensity is closely related to the variations in the particle size.
Lightning activities
Thermodynamic and microphysical processes interact to cause lightning activities. To visualize better the evolution of thunderstorms and explore further the relationship between TBB and CG lightning, the superimposed TBB data from the Japanese Himawari satellite and ADTD data at different moments during these two thunderstorms are shown in Figures 9, 10. In addition to the blackbody bright temperature of cloud tops, the temperature gradient is another characteristic quantity related to the convective activity. It also reflects the convective activity inside the cloud masses, and the larger the temperature gradient, the more violent the cloud-top undulations, usually presenting a larger temperature gradient in the low-altitude inlet area ahead of the convective cloud mass movement. Herein, the TBB data are superimposed on the CG lightning data 10 min before and after the observation time to show the changes in CG lightning more fully (Chen et al., 2021).
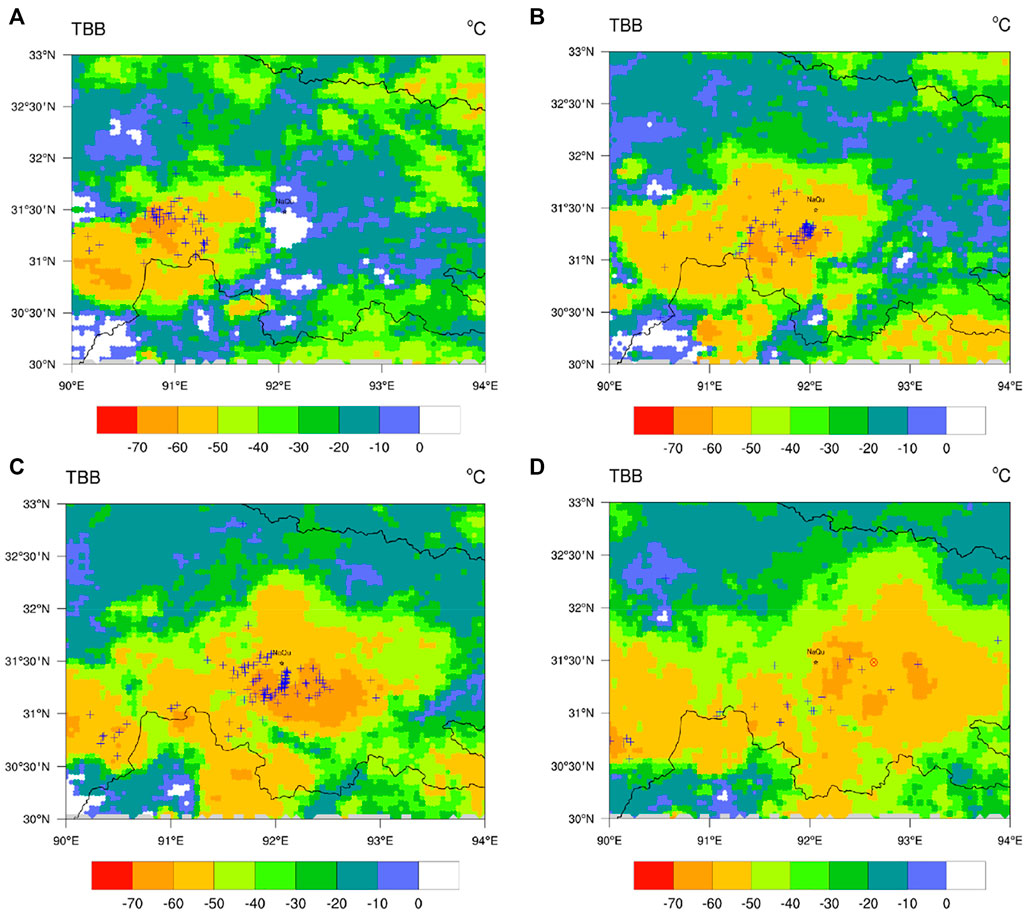
FIGURE 9. TBB superimposed on CG lightning at (A) 0,730, (B) 0,830, (C) 0,930, and (D) 1030 UTC on July 14 (+ indicates negative CG lightning, ⊕ indicates positive CG lightning).
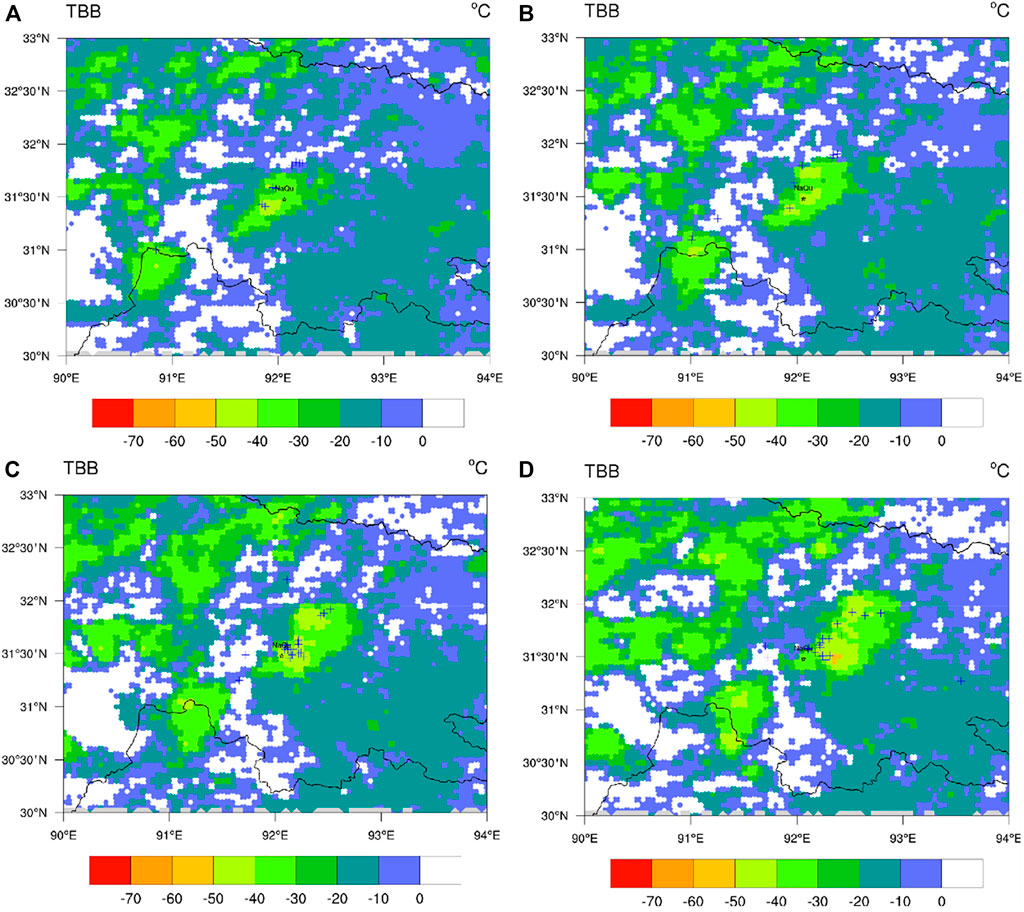
FIGURE 10. TBB superimposed on CG lightning at (A) 0,500, (B) 0,520, (C) 0,540, and (D) 0600 UTC on July 16 (+ indicates negative CG lightning, ⊕ indicates positive CG lightning).
The thunderstorm clouds on July 14 were developing from west to east and were located to the southwest of the meteorological station at 0730 UTC. The clouds developed with the maximum TBB reaching −60°C; the CG lightning was also more active and was concentrated mostly in the strong cold cloud area where TBB < −60°C. Then at 0830 UTC, the cold cloud area (TBB < −30°C) was further expanded, the strong cold cloud area was located to the south of the meteorological station, and the CG lightning in the strong cold cloud area was more intensive. As the cloud continued to develop, the strong cold cloud area continued to expand, and the thunderstorm cloud passed the meteorological station at around 0930 UTC, at which time the number of CG lightning events peaked at 155, all of which were negative CG lightning. The cloud continued to move eastward, and at 1030 UTC the number of CG lightning events began to decrease, and the thunderstorm began to dissipate and end. During the process, the negative CG lightning was active both the development and mature stages, while positive CG lightning appeared only once in the extinction process. The areas of lightning activities were concentrated in the strong cold cloud areas with TBB < −60°C; the lightning was also more active in areas with a larger TBB gradient except for the strong central area of deep convection.
In the TC thunderstorm on July 16, the cloud system development was relatively shallow, the meteorological station was in the cold cloud area, and the cloud body was also relatively small. The CG lightning was relatively scattered and sparse in the early stage, concentrated in the area with TBB < −40°C and the junction of TBB between −30°C and −40 °C. With the continuous development of the cloud moving to the northeast, the meteorological station was basically located in the stronger cold cloud area (TBB < −40°C) at 0,530–0550 UTC, and then the stronger cold cloud area was further expanded; also, the number of negative CG lightning increased rapidly during this period. By 0600 UTC, the meteorological station was located at the edge of the cloud, the center of CG lightning also moved eastward, and a new strong cold cloud area with TBB < −60°C developed on the east side, and then the cloud moved gradually from over the meteorological station to continue its eastward development. In general, the CG lightning was all negative during the TC thunderstorm, it was maintained over the station for a shorter period, and there were significantly fewer CG lightning events than in the PV thunderstorm on July 14. The centers of lightning activities were both located in the regions with TBB < −40°C and the regions with large TBB gradient during the two thunderstorms.
Interaction of three processes: Thermodynamic processes, microphysical changes, and lightning activities
In thunderstorms, the thermodynamic field would first promote the development of microphysical changes. The strong updraft transported a large amount of water vapor to the middle and upper layers of the clouds, and water vapor content zoomed above 2 km in both the PV and TC thunderstorms. High-value area of water vapor content formed and developed to 6 km in height with its high-value center in the middle layer of 2–4 km. The ice-phase particles in the middle and upper layers of the cloud kept growing through the process of condensation and attachment, and latent heat was released. The temperature at 2–4 km increased by ca. 5 °C in the PV thunderstorm, while the temperature increased more obviously in the TC thunderstorm due to the stronger convection, with that in the middle layer of the cloud increasing by ca. 10°C. During this period, the shrapnel particles collide with ice crystals and snow particles, triggering noninductive power generation that in turn caused CG lightning. As precipitation was intensifying, raindrops fell at a greater rate, which produced a certain dragging effect on the air, thus generating a stronger sinking airflow. With the weakening of updrafts, the sinking airflow cut off the supply of water vapor from the updraft to the upper layers of the cloud, the thunderstorm cloud began to dissipate. This was also a reason for the short maintenance time of TC thunderstorm. With the weakening of updraft, the strong dragging effect of heavy precipitation caused strong sinking airflow, which rapidly hindered the upward transport of water vapor in the lower layers, and the thermodynamic processes was resisted, which directly affected the microphysical changed such as particle condensation in the cloud, and then also weakened the electric discharge activities.
To investigate further the relationships between the microphysical and dynamical processes and lightning activities of the two thunderstorms, this study screens some data (Figure 11): 1) the maximum radial velocity from the cloud radar, 2) the total liquid water content、the average ice water content and the maximum ice water content from the microwave radiometer within a detection range of 10 km altitude, and 3) the number of CG lightning events. Of these, for consistent accuracy, the data for total liquid water content and ice water content were interpolated, and the time resolution was interpolated from 2 min to 1 min.
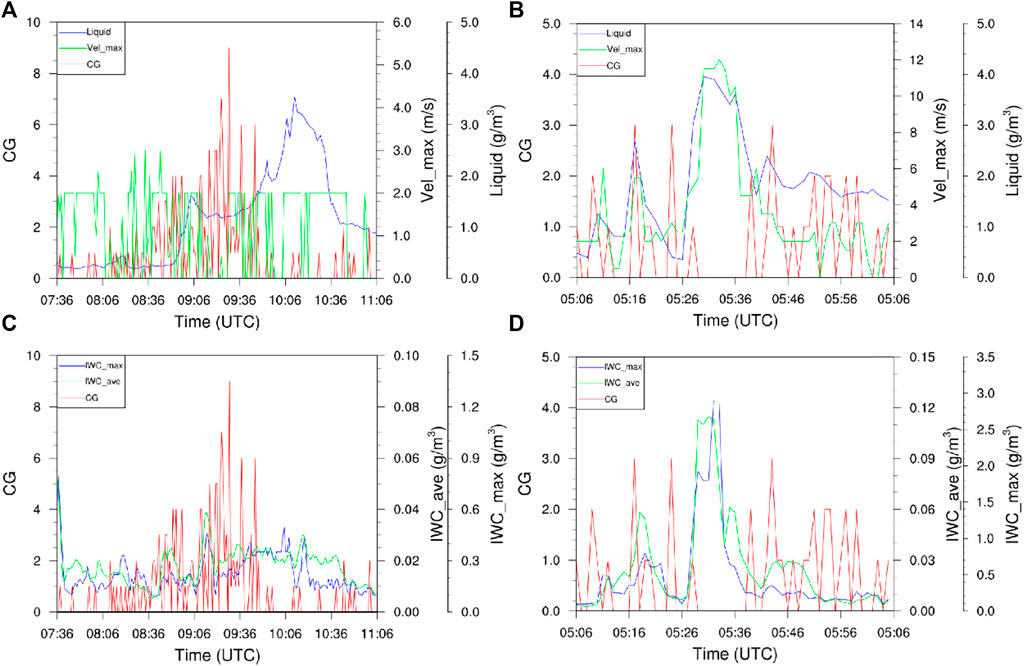
FIGURE 11. The time series of CG lightning (red), the maximum radial velocity (green), and the total liquid water content (blue) for (A) PV thunderstorm and (B) TC thunderstorm. The time series of CG lightning (red), the average ice water content (green), and the maximum ice water content (blue) for (C) PV thunderstorm and (D) TC thunderstorm.
For the PV thunderstorm, the maximum radial velocity fluctuated in the range of 0–3 m/s, the CG lightning increased at 0,836–0936 UTC, and the radial velocity peak was ca. 1 h earlier than the CG lightning peak. In the TC thunderstorm, the CG lightning varied more irregularly and the radial velocity was usually less than 8 m/s; at 0,526–0536 UTC, the maximum radial velocity reached a peak of 14 m/s, and with the development of updrafts, the CG lightning occurred more intensively, but it lagged the peak radial velocity by ca. 10 min. The high liquid water content with strong updrafts is favorable for CG lightning, but as updrafts weaken, water vapor cannot continue to be transported to the upper layers, and the sinking effect from rainfall slows down the development of thunderstorms and reduces the number of lightning events (Cai, 2021). The occurrence of peaks in ice water content was also earlier than the active phase of CG lightning. In general, the occurrence of peaks in ice water content and radial velocity is indicative of the active phase of lightning.
Conclusion
In this paper, based on ground-based data from cloud radar, a microwave radiometer, a raindrop spectrometer, and a lightning locator and combined with reanalysis data and satellite data, the physical parameter changes of two different types of thunderstorm processes and the characteristics of CG lightning occurring over the Nagqu area were studied, and the following conclusions are drawn.
The cloud layer of the PV thunderstorm on July 14 was deeper: the height of the cloud top developed up to 10 km, and the development time of the updraft within the cloud in the thermodynamic field was longer than that of the TC thunderstorm. However, the TC thunderstorm had stronger short-time updrafts and larger radial velocity, and the release of latent heat from the phase change of the hydromorphic material caused greater warming.
The changes in water vapor during the PV and TC thunderstorms were relatively consistent. The liquid water content started to increase when precipitation occurred, the water vapor density increased further, and the microphysical activities within the cloud led to increased lightning activities, findings that are similar to those from the study on the humidity change characteristics of thunderstorms in the Kunming area (Xu et al., 2021). The TC thunderstorm was richer in ice water content than the PV thunderstorm, where the convective cloud system precipitation phase had higher liquid water content in the lower layers than did the stratiform cloud precipitation phase.
For the raindrop spectrum characteristics of precipitation during thunderstorms, the trends of the number concentration of raindrops and the rain intensity were similar. Meanwhile, the rainfall amount and average particle size in the TC thunderstorm were larger than those in the PV thunderstorm, in which the particle mean diameter was larger but the particle number density was smaller in the convective precipitation stage, and the particle mean diameter was smaller but the particle number density was larger in the stratiform cloud precipitation stage.
In both the PV and TC thunderstorms, the system developed from east to west, and both were dominated by negative CG lightning; this agrees with Fan et al. (2018), who found that the proportion of positive CG lightning in the eastern part of the QTP is low. The liquid water content and convective activities within the clouds have a key influence on the initiating discharge process, and the cold cloud regions (TBB < −40 °C) and the regions with a large TBB gradient are more favorable to the development of CG lightning, which is consistent with the analysis of strong thunderstorm weather in Hohhot (Li et al., 2021).
Thermodynamic and microphysical processes in thunderstorms interact with each other in the process of lightning activities. The thermodynamic field brings water vapor and lifts for microphysical processes, and microphysical changes release latent heat to strengthen the dynamical effect and promote the development of lightning activities. When the generated precipitation is continuously enhanced, the dragging effect of raindrops produces stronger sinking airflow, which cuts off the supply of water vapor from the updraft to the middle and upper layers of the cloud, making the microphysical process subject to resistance and the electric activities process difficult to maintain, thus the thunderstorm dissipates. The trends in radial velocity and ice-phase particle concentration correspond to the active phase of the CG lightning, and the peak of the CG lightning will have a certain time lag compared to their peaks.
Thunderstorms can cause damage to public life and infrastructure in two forms, the first prime threat is CG lightning and the later is associated with the heavy rainfall produced by the occurrence of thunderstorms. The danger of lightning can be mainly reflected by the frequency and intensity of the CG lightning, CG lightning frequency of the PV thunderstorm on July 14 is 1.65 fl min−1, much greater than the TC thunderstorm on July 16 which is 0.93 fl min−1. And the average CG lightning intensity of the PV thunderstorm is -28.18kA, while that of the TC thunderstorm is -25.73 kA. Thus, in general, the risk of lightning in the PV thunderstorm is greater than that of the TC thunderstorm. The danger of heavy rainfall accompanying the thunderstorm can be measured by the average rainfall intensity and the accumulated rainfall. The accumulated rainfall during the PV thunderstorm is 4.85 mm with an average rainfall intensity of 1.39 mm/h, while the accumulated rainfall during the TC thunderstorm is 2.37 mm with an average rainfall intensity of 2.37 mm/h. Obviously, the TC thunderstorm is more likely to bring potential short-term heavy rainfall disasters. Both the risk of lightning hazard and heavy rainfall hazard caused by thunderstorms are closely related to the humidity parameters during the thunderstorms, and the water vapor density and liquid water content play a key role.
Data availability statement
The raw data supporting the conclusion of this article will be made available by the authors, without undue reservation.
Author contributions
ZY and YZ conceived and designed the study and wrote the manuscript. ZY processed the data. ZY, YZ, and LH interpreted the study’s implications and provided discussion and future research suggestions.
Funding
This research was jointly supported by the Second Qinghai-Tibet Plateau Comprehensive Scientific Research Project (2019QZKK0104), the National Natural Science Foundation of China Project (41875169), the Guizhou Science and Technology Program Project Qiankehe Support ([2019] No. 2387), the Sichuan Science and Technology Program Project (2022YFS0545), the Guizhou Science and Technology Program Project Qiankehe Support ([2022] No. 206), the Sichuan Science and Technology Program (2021YJ0393).
Acknowledgments
The authors would like to express their sincere thanks to the Second Qinghai-Tibet Plateau Comprehensive Scientific Research Project for providing the research data used in this study.
Conflict of interest
The authors declare that the research was conducted in the absence of any commercial or financial relationships that could be construed as a potential conflict of interest.
Publisher’s note
All claims expressed in this article are solely those of the authors and do not necessarily represent those of their affiliated organizations, or those of the publisher, the editors and the reviewers. Any product that may be evaluated in this article, or claim that may be made by its manufacturer, is not guaranteed or endorsed by the publisher.
References
Cai, B. B. (2021). The study of numerical simulation on the charge structure during two thunderstorms in Qinghai. (Nanjing, China: Nanjing University of Information Science & Technology). [dissertation/PhD's thesis]. doi:10.27248/d.cnki.gnjqc.2021.000154
Chen, R. J., Gou, A., and Wang, Y. (2021). Satellite and radar characteristics of two thunderstorms during a continuous strong storm in hubei province and their relationship with lightning activity (in Chinese). J. Trop. Meteorology 37, 457–467. doi:10.16032/j.issn.1004-4965.2021.044
Chen, X., Añel, J. A., Su, Z., de la Torre, L., Kelder, H., van Peet, J., et al. (2013). The deep atmospheric boundary layer and its significance to the stratosphere and troposphere exchange over the Tibetan Plateau. PLOS ONE 8 (2), e56909. doi:10.1371/journal.pone.0056909
Christian, H. J., Richard, J. B., Dennis, J. B., William, L. B., Dennis, E. B., and Driscoll, K. T. (2003). Global frequency and distribution of lightning as observed from space by the Optical Transient Detector. J. Geophys. Res. 108, 4005. doi:10.1029/2002JD002347
Dawa, Z., Yang, M., and Wang, X. (2018). Characteristics of hail day changes and analysis of hail and thunderstorm environmental conditions in Nagqu City over the years (in Chinese). Meteorological Environ. Sci. 41, 82–89. doi:10.16765/j.cnki.1673-7148.2018.04.012
Fan, P., Zheng, D., Zhang, Y., Gu, S., Zhang, W., Yao, W., et al. (2018). A performance evaluation of the world wide lightning location network (WWLLN) over the Tibetan plateau. J. Atmos. Ocean. Technol. 35, 927–939. doi:10.1175/JTECH-D-17-0144.1
Fu, S., and Tan, J. (2017). Quality control method of ground-based microwave radiometer detection data (in Chinese). J. Appl. Meteorological Sci. 28, 209–217. doi:10.11898/1001-7313.20170208
Fu, Y., Liu, G., Wu, G., Yu, R., Xu, Y., Wang, Y., et al. (2006). Tower mast of precipitation over the central Tibetan Plateau summer. Geophys. Res. Lett. 33, L05802. doi:10.1029/2005GL024713
Gong, C. S., Zeng, S. L., and Wang, J. Y. (2013). Analyses on climatic characteristics of thunderstorm in China in recent 30 years (in Chinese). Plateau Meteor 32, 1442–1449. doi:10.7522/j.issn.1000-0534.2012.00134
Guo, F., Zhang, Y., and Yan, M. (2004). The effect of environmental temperature and humidity stratification on charge structure in thunderstorms (in Chinese). Plateau Meteorol. 23, 678–683. doi:10.3321/j.issn:1000-0534.2004.05.016
Hazra, A., Chaudhari, H. S., Ranalkar, M., and Chen, J.-P. (2017). Role of interactions between cloud microphysics, dynamics and aerosol in the heavy rainfall event of June 2013 over Uttarakhand, India. Q. J. R. Meteorol. Soc. 143 (703), 986–998. doi:10.1002/qj.2983
Hu, Z., and Mallorquí, J. (2019). An accurate method to correct atmospheric phase delay for InSAR with the ERA5 global atmospheric model. Remote Sens. 11, 1969. doi:10.3390/rs11171969
Immerzeel, W. W., van Beek, L. P., and Bierkens, M. F. (2010). Climate change will affect the Asian water towers. Science 328, 1382–1385. doi:10.1126/science.1183188
Kang, X. Y., Zhang, B., Tian, J., Liu, N., and Ma, X. (2019). Applicability of products rretrieved from microwave radiometer in east Qinghai province (in Chinese). Arid Zone Res. 36, 356–364. doi:10.13866/j.azr.2019.02.11
Li, J., Wu, X., Yuan, T., Qie, X., and Yang, J. (2019). The temporal and spatial distribution of thunderstorms in Asia Monsoon Region based on the TRMM multi-sensor database (in Chinese). Chin. J. Geophys. 62, 4098–4109. doi:10.6038/cjg2019M0687
Li, S., Shi, R. L., and Sun, H. (2021). A comprehensive analysis of a severe thunderstorm process in Hohot of 2019 (in Chinese). J. Meteorological Sci. 41, 417–426. doi:10.12306/2020jms.0062
Li, Y. D., Wang, Y., Yang, S., Liang, H., Gao, S., and Fu, R. (2008). Characteristics of summer convective systems initiated over the Tibetan Plateau. Part I: Origin, track, development, and precipitation. J. Appl. Meteorol. Climatol. 47, 2679–2695. doi:10.1175/2008JAMC1695.1
Liu, C., and Illingworth, A. (2000). Toward more accurate retrievals of ice water content from radar measurements of clouds. J. Appl. Meteor. 39, 1130–1146. doi:10.1175/1520-0450(2000)039<1130:TMAROI>2.0.CO;2
Liu, C., and Zipser, E. J. (2005). Global distribution of convection penetrating the tropical tropopause. J. Geophys. Res. 110, D23104. doi:10.1029/2005JD006063
Liu, C., Zipser, E. J., and Nesbitt, S. W. (2007). Global distribution of tropical deep convection: Different perspectives from TRMM infrared and radar data. J. Clim. 20, 489–503. doi:10.1175/JCLI4023.1
Luo, H., and Yanai, M. (1983). The large-scale circulation and heat sources over the Tibetan Plateau and surrounding areas during the early summer of 1979. Part I: Precipitation and kinematic analyses. Mon. Wea. Rev. 111, 922–944. doi:10.1175/1520-0493(1983)111<0922:TLSCAH>2.0.CO;2
Luo, H., and Yanai, M. (1984). The large-scale circulation and heat sources over the Tibetan Plateau and surrounding areas during the early summer of 1979. Part II: Heat and moisture budgets. Mon. Wea. Rev. 112, 966–989. doi:10.1175/1520-0493(1984)112,0966:TLSCAH.2.0.CO;2
Luo, Y., Zhang, R., Luo, W. Qian, Z., and Hu, X. (2011). Intercomparison of deep convection over the Tibetan Plateau-Asian monsoon region and subtropical North America in boreal summer using CloudSat/CALIPSO data. J. Clim. 24, 2164–2177. doi:10.1175/2010JCLI4032.1
Ma, R., Zheng, D., Zhang, Y., Yao, W., Zhang, W., and Cuomu, D. (2021). Spatiotemporal lightning activity detected by WWLLN over the Tibetan plateau and its comparison with LIS lightning. J. Atmos. Ocean. Technol. 38, 511–523. doi:10.1175/JTECH-D-20-0080.1
Mohan, P. R., Srinivas, C. V., Yesubabu, V., Baskaran, R., and Venkatraman, B. (2018). Simulation of a heavy rainfall event over Chennai in Southeast India using WRF: Sensitivity to microphysics parameterization. Atmos. Res. 210, 83–99. doi:10.1016/j.atmosres.2018.04.005
Qie, X., Toumi, R., and Yuan, T. (2003). Lightning activities on the Tibetan Plateau as observed by the lightning imaging sensor. J. Geophys. Res. 108, 4551. doi:10.1029/2002JD003304
Qie, X., Wu, X., Yuan, T., Bian, J., and Lu, D. (2014). Comprehensive pattern of deep convective systems over the Tibetan Plateau–South Asian monsoon region based on TRMM data. J. Clim. 27, 6612–6626. doi:10.1175/JCLI-D-14-00076.1
Qie, X., Zhang, T., Chen, C., Zhang, G., Zhang, T., and Wei, W. (2005). The lower positive charge center and its effect on lightning discharges on the Tibetan Plateau. Geophys. Res. Lett. 32, L05814. doi:10.1029/2004GL022162
Tao, S., and Ding, Y. (1981). Observational evidence of the influence of the Qinghai-Xizang (Tibet) plateau on the occurrence of heavy rain and severe convective storms in China. Bull. Amer. Meteor. Soc. 62, 23OEOTIO>2.0.CO;2–30. doi:10.1175/1520-0477(1981)062<0023:oeotio>2.0.co;2
Thomas, B., Yesubabu, V., Srinivas, C. V., Dasari, H. P., Attada, R., and Langodan, S. (2021). Cloud resolving simulation of extremely heavy rainfall event over Kerala in August 2018 - sensitivity to microphysics and aerosol feedback. Atmos. Res. 258, 105613. doi:10.1016/j.atmosres.2021.105613
Wu, X., Qie, X., and Yuan, T. (2012). Regional distribution and diurnal variation of deep convective systems over the Asian monsoon region. Sci. China Earth Sci. 56, 843–854. doi:10.1007/s11430-012-4551-8
Xu, H., Zheng, J., Zhang, J., Zhu, K., and Li, Q. (2021). Study on the evolution characteristics of temperature and humidity parameters of two types of thunderstorms at Kunming Airport (in Chinese). Torrential Rain Disasters 40, 541–548. doi:10.3969/j.issn.1004-9045.2021.05.011
Xu, W. (2013). Precipitation and convective characteristics of summer deep convection over East Asia observed by TRMM. Mon. Weather Rev. 141, 1577–1592. doi:10.1175/MWR-D-12-00177.1
Xu, X., Lu, C., Shi, X., and Gao, S. (2008). World water tower: An atmospheric perspective. Geophys. Res. Lett. 35 (20), 525–530. doi:10.1029/2008gl035867
Yan, Y., and Liu, Y. (2019). Vertical structures of convective and stratiform clouds in boreal summer over the Tibetan Plateau and its neighboring regions. Adv. Atmos. Sci. 36, 1089–1102. doi:10.1007/s00376-019-8229-4
Yang, K., Koike, T., Fujii, H., Tamura, T., Xu, X., Bian, L., et al. (2004). The daytime evolution of the atmospheric boundary layer and convection over the Tibetan Plateau: Observations and simulations. J. Meteorological Soc. Jpn. 82, 1777–1792. doi:10.2151/jmsj.82.1777
Zhang, C., Zhang, Q., and Wang, Y. (2008). Climatology of hail in China: 1961–2005. J. Appl. Meteorol. Climatol. 47, 795–804. doi:10.1175/2007JAMC1603.1
Zhang, Y., Dong, W., Zhao, Y., Zhang, G., Zhang, H., Chen, C., et al. (2004). Study of charge structure and radiation characteristic of intracloud discharge in thunderstorms of Qinghai-Tibet Plateau. Sci. China Ser. D-Earth. Sci. 47D, 108–114. doi:10.1007/BF02880986
Zhao, C., Liu, L., Wang, Q., Qiu, Y., Wang, W., Wang, Y., et al. (2016). Toward understanding the properties of high ice clouds at the naqu site on the Tibetan plateau using ground-based active remote sensing measurements obtained during a short period in july 2014. J. Appl. Meteorol. Climatol. 55, 2493–2507. doi:10.1175/JAMC-D-16-0038.1
Zhao, C., Liu, L., Wang, Q., Qiu, Y., Wang, Y., and Wu, X. (2017). MMCR-based characteristic properties of non-precipitating cloud liquid droplets at Naqu site over Tibetan Plateau in July 2014. Atmos. Res. 190, 68–76. doi:10.1016/j.atmosres.2017.02.002
Zhao, P., Zhang, Y., Liu, C., Zhang, P., Xiao, H., and Zhou, Y. (2022c). Potential relationship between aerosols and positive cloud-to-ground lightning during the warm season in sichuan, southwest China. Front. Environ. Sci. 10, 945100. doi:10.3389/fenvs.2022.945100
Zhao, P., Xiao, H., Liu, C., Zhou, Y., Xu, X., and Hao, K. (2022b). Evaluating a simple proxy for climatic cloud-to-ground lightning in Sichuan Province with complex terrain, Southwest China. Int. J. Climatol. 42, 3909–3927. doi:10.1002/joc.7451
Zhao, P., Xiao, H., Liu, J., and Zhou, Y. (2022a). Precipitation efficiency of cloud and its influencing factors over the Tibetan plateau. Int. J. Climatol. 42, 416–434. doi:10.1002/joc.7251
Zhao, Y., Zhang, Y., and Dong, W. (2004). Preliminary analysis of characteristics lightning in Nagqu area of qinghai-xizang plateau (in Chinese). Chin. J. Geophys. 47, 405–410. doi:10.3321/j.issn:0001-5733.2004.03.006
Zheng, D., Zhang, Y., Zhang, Y., Yao, W., Wang, F., Lyu, W., et al. (2020). Lightning and deep convective activities over the Tibetan Plateau. Natl. Sci. Rev. 7, 487–488. doi:10.1093/nsr/nwz182
Zheng, J., Liu, L., and Zeng, Z. (2016). Ka-band milimeter wave cloud radar data quality control (in Chinese). J. Infrared Millim. Waves 35, 748–757. doi:10.11972/j.issn.1001-9014.2016.06.018
Keywords: thunderstorms, Nagqu, macrophysical, microphysical, CG lightning
Citation: Yan Z, Zhou Y and Hui L (2022) Characteristics of two different types of thunderstorms in summer over the Nagqu area in China. Front. Earth Sci. 10:985846. doi: 10.3389/feart.2022.985846
Received: 04 July 2022; Accepted: 12 September 2022;
Published: 28 September 2022.
Edited by:
Baoyou Zhu, University of Science and Technology of China, ChinaReviewed by:
Ashot Agassi Chilingarian, Alikhanyan National Laboratory, ArmeniaYesubabu Viswanadhapalli, National Atmospheric Research Laboratory, India
Copyright © 2022 Yan, Zhou and Hui. This is an open-access article distributed under the terms of the Creative Commons Attribution License (CC BY). The use, distribution or reproduction in other forums is permitted, provided the original author(s) and the copyright owner(s) are credited and that the original publication in this journal is cited, in accordance with accepted academic practice. No use, distribution or reproduction is permitted which does not comply with these terms.
*Correspondence: Yunjun Zhou, emhvdXlqQGN1aXQuZWR1LmNu