 Haiying Hu
 Chenxin Jing
 Lidong Dai
 Chuanyu Yin1,2
- 1Key Laboratory for High-Temperature and High-Pressure Study of the Earth’s Interior, Institute of Geochemistry, Chinese Academy of Sciences, Guiyang, Guizhou, China
- 2University of Chinese Academy of Sciences, Beijing, China
- 3Key Laboratory of Macrocyclic and Supramolecular Chemistry of Guizhou Province, Guizhou University, Guiyang, China
Carbonate minerals as a dominant carbon host can be transported to the Earth’s deep interior via subduction of the oceanic lithosphere, and their physicochemical behavior potentially has a significant influence on the compositional heterogeneity and physical properties in the deep mantle. In this study, we measured the electrical conductivity of natural siderite at 1–3 GPa and 100–700°C using a complex impedance analyzer in a large volume multi-anvil high-pressure apparatus. A sharp increase in conductivity was observed at ∼400°C under various pressures, and subsequently, the electrical conductivity keeps anomalously high values in the whole temperature range owing to a small quantity of interconnected highly conductive phases (graphite and magnetite) produced from the low degree decarbonation of siderite. The change in electrical conductivity and activation enthalpy suggest that the conduction mechanisms before and after low degree decarbonation of siderite are the small polaron (electron hopping in Fe2+–Fe3+) and highly conductive phases, respectively. Our results indicate the incipient decarbonation temperatures at 1–3 GPa are considerably lower than the decomposition boundary of siderite determined by phase equilibrium experiments, implying the initial decarbonation reaction of Fe-bearing carbonates in the subducting oceanic crust occurs at a shallower depth. The 30 vol.% of siderite is required to enhance the electrical conductivity of (Mg, Fe)CO3 solid solutions. Magnetite and graphite generated from the decarbonation reaction of the siderite component of Fe-bearing carbonate make a significant contribution to the high conductivity anomaly observed in the slab-mantle wedge interface.
Introduction
Carbonates are the main phases of carbon-bearing materials that can be transported into the deep Earth mantle via subduction of the oceanic crust. Since carbon has very low solubility in the mantle silicate minerals (Keppler et al., 2003), carbonate minerals are regarded as one of the dominant hosts for carbon in the deep mantle that even can be stable in the transition zone or lower mantle as new high-pressure carbon-bearing phases (Boulard et al., 2011; Liu et al., 2015; Cerantola et al., 2017). Simultaneously, the decomposition, melting, and dissolution of carbonates in the slab-released aqueous fluid can lead to the carbon released to Earth’s surface via volcanism. Therefore, carbonate minerals play an important role in the global deep carbon cycle (Alt and Teagle, 1999; Sverjensky et al., 2014; Thomson et al., 2016; Farsang et al., 2021). The change of state for carbonates during the subduction process dramatically affects the physical and chemical properties of the subducting oceanic crust and the mantle, including lower the melting point (solidus) (Dasgupta et al., 2004; Dasgupta and Hirschmann, 2006, 2007; Ghosh et al., 2009), redox state (Luth, 1993), and electrical structure (Gaillard et al., 2008; Sifré et al., 2015). In particular, the electrical conductivity of carbonates is of principal importance for exploring the carbon storage and spatial distribution in the Earth’s interior in conjunction with geophysical surveys (electromagnetic data, seismic velocity) and petrologic studies.
Most of the previous conductivity measurements for carbonate minerals have been mainly performed on (Mg, Ca)CO3 samples (e.g., calcite, magnesite, dolomite, aragonite, etc.) at high temperature and high pressure, and primarily focused on the discussion on the effect of temperature and pressure on conductivity in order to quantify their nature of transport mechanism (Papathanassiou and Grammatikakis, 1996; Papathanassiou, 1998; Ter Heege and Renner, 2007; Mibe and Ono, 2011; Ono and Mibe, 2013; Ono and Mibe, 2015). These experimental results have indicated that Mg-Ca carbonate minerals have a relatively low conductivity value within their stability and hardly make a pronounced contribution to the electrical structure of the surrounding mantle. However, the presence of iron has a crucial effect on the thermodynamic stability of carbonate phases, and the high-pressure experimental results have demonstrated that the stability of Fe-bearing carbonate (i.e., dolomite-ankerite and magnesite-siderite solid solutions) dramatically decreases with increasing Fe content (Dubrawaski, 1991; Tao et al., 2013; Tao et al., 2014; Bataleva et al., 2020). Accordingly, the incorporation of iron into carbonates potentially has an essential effect on the electrical conductivity of carbonate minerals owing to its multiple valence states, unlike Fe-free counterparts in which their cations do not oxidize. However, until now, the electrical conductivity of Fe-bearing carbonate has not yet been reported in high temperature and pressure experiments.
Siderite (FeCO3), as the end-member of (Mg, Ca, Fe)CO3 carbonate, can form a continuous solid solution with magnesite (MgCO3) in rocks, which can be extensively outcropped in the regions of subducted carbonated oceanic and continental crust (Zhu and Ogasawara, 2002; Tao et al., 2013). The study on the siderite stability has revealed that the decomposition temperature is much lower than that of magnesite by several hundred degrees Celsius, simultaneously, the reaction products, i.e., iron oxides (wüstite, magnetite, and hematite) and carbon species (graphite, CO, and CO2) strongly depend on oxygen fugacity (Koziol, 2004; Tao et al., 2013). These highly conductive phases from the thermal dissociation of Fe-bearing carbonate can be a good indicator of the storage and distribution of carbon in the Earth’s interior if they could make a significant contribution to the high conductivity anomalies of the surrounding context observed by the geophysical probing. Consequently, the electrical conductivity of siderite plays a principal and fundamental role in evaluating the effect of Fe content on the conductivity of Fe-bearing carbonate minerals, and the corresponding measurement of siderite is urgently requires at present for systematically understanding the electrical property of carbonate minerals as well as for potentially detecting the carbon storage and distribution in the mantle.
In this study, we carried out the in-situ electrical conductivity measurements of siderite at pressures of 1–3 GPa and temperatures up to 700°C in a multi-anvil high-pressure apparatus using the complex impedance spectroscopy under controlling oxygen fugacity condition. The low degree decarbonation of siderite was observed through the marked variation of electrical conductivity during the heating process, and the reaction products were determined and quantified by the integrated analysis in a combination of confocal Raman spectroscopy and TESCAN Integrated Mineral Analyzer (TIMA). Additionally, the microscopic conduction behavior before and after partial decomposition of siderite was clarified. The potential contribution of siderite decarbonation to the origin of the high conductivity anomaly observed at the slab-mantle wedge interface was discussed in detail.
Experimental procedure
Sample preparation
The starting materials for the electrical conductivity experiments are natural polycrystalline siderite aggregates, which were commercially purchased from the geological specimen incorporation. The massive block sample with a grayish-yellow color is fresh and unaltered with trace amounts of pyrite. The starting sample was confirmed to be siderite by the laser Raman spectroscopy measurement. The chemical composition of siderite was accurately determined by the electron probe microanalysis (EPMA) using a JEOL-JXA-8230 electron microprobe operating at a 25 kV accelerating voltage and a beam current of 10 nA at the State Key Laboratory of Ore‒Deposit Geochemistry in the Institute of Geochemistry, CAS, Guiyang, China. The result is given in Supplementary Table S1. The sample contains small amounts of Mg2+ and Mn2+, and its corresponding molecular formula is determined as Fe0.88Mn0.03Mg0.09CO3 that is close to the end-member of Fe-carbonate. During the conductivity preparation process, the sample was to first cut into cubic pieces using a diamond low-speed slicer, then polished into cylinders (diameter: 6 mm, height: 6.0–6.5 mm) in a diamond disc grinder. During these processes, water was adopted as the lubricant and cooling liquid in order to avoid the possible oxidation of siderite owing to the frication heat produced in the course of cutting and polishing. The cylindrical samples are successively ultrasonically cleaned in acetone and ethanol for 10 min, and finally dried at the temperature of 60°C in the dry vacuum furnace to remove the absorbed water that possibly affects the electrical conductivity measurement.
Electrical conductivity measurements and data analysis
Electrical conductivity experiments were carried out in a conventional large volume multi-anvil high-pressure apparatus installed in the Key Laboratory of High-Pressure Study of the Earth’s interior, Institute of Geochemistry, CAS, China. The design of sample cell assembly for conductivity measurement is shown in Figure 1, which is analogous to our previous work (Hu et al., 2018). The cubic pyrophyllite with each edge length of 32.5 mm was adopted as the pressure-transmitting medium. Since the stability of siderite is closely associated with oxygen fugacity due to the presence of ferrous iron, the oxygen fugacity is indispensable to be sufficiently controlled during conductivity measurements at high temperatures and pressure. In this study, a nickel foil placed between MgO and Al2O3 insulative sleeves as well as two symmetric Ni electrodes directly contacted with the sample were adopted to control oxygen fugacity close to the nickel-nickel oxide (NNO) buffer, which is generally corresponding to redox environments in the subduction zone and upper mantle. In addition, the Ni foil grounding is also used as a shield preventing the external electromagnetic disturbance from the heating current. The sample was surrounded by the MgO sleeve. The Al2O3 cylindrical sleeve is placed between the MgO sleeve and the heater that is consisted of three-layer stainless steel, so as to maintain a good insulation environment around the sample. The temperature was controlled using a K-type (Ni90Cr10–Ni97Al3) thermocouple, in which of one end was wielded to a small ball in direct contact with the middle of the sample. The temperature gradient was not more than 5°C between the middle and end of the sample.
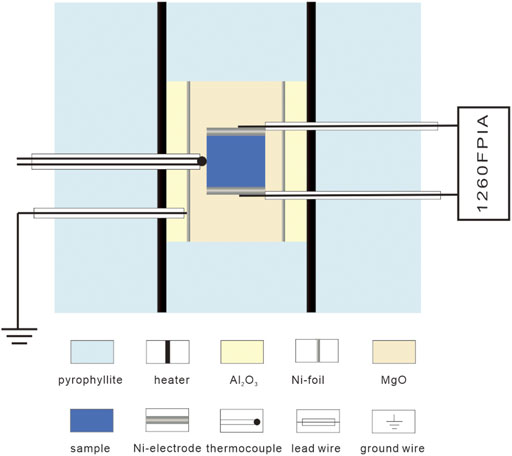
FIGURE 1. Schematic cross section of the cell assembly for conductivity measurement in multi-anvil apparatus.
Complex impedance spectra measurements were performed over 100–700°C and 1–3 GPa by virtue of a Solartron-1260 Impedance/Gain-Phase analyzer in a YJ-3000t multi-anvil apparatus. The applied signal voltage is 1 V and the frequency for the electrical conductivity measurement is scanning within the range of 10–106 Hz. To ensure a high insulation environment around the sample, the background resistance was first assessed by replacing the sample with a cylindrical MgO that has the same dimension as the sample. Since the background resistance is too high to acquire good impedance data at low temperatures, impedance spectra of MgO were measured at relatively high temperatures (850–1,200°C). If extrapolated the background conductivity to low temperature, it is several orders of magnitude lower than the sample conductivity as shown in Figure 2, therefore, the good insulative background avoids the possible leakage current through the Al2O3 and MgO sleeves placed out of the sample.
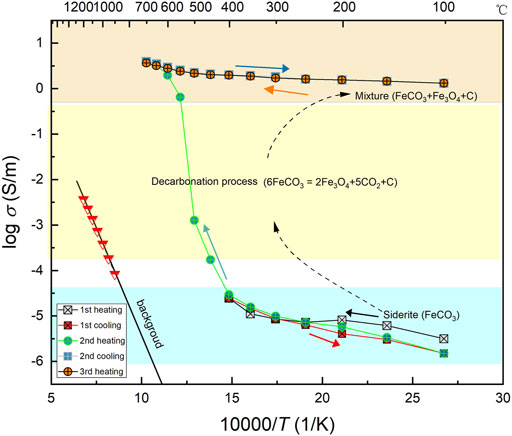
FIGURE 2. The electrical conductivity of sample in the different heating-cooling cycles at 3 GPa, together with the conductivity of background in sample cell. The distinct variation in conductivity was observed in the second heating cycle, in which the decarbonation reaction of sample took place.
For each run, when pressure reached the designated value, the temperature started to increase with a step of 50°C, and the impedance spectra were collected at 100–700°C with the same temperature interval. At various pressures, the maximum temperature for impedance measurement is different, as illustrated in Table 1. After the first heating-cooling cycle measurements, we found a large variation of impedance spectra with temperature, implying the possible occurrence of decarbonation in siderite. In order to obtain the conductivity within the stability of siderite and during the decomposition process, two different heating-cooling modes for conductivity measurements were employed: one is performed at the low-temperature ranges before the occurrence of decarbonation reaction, and another is temperature increases up to ∼700°C after the completion of the first low-temperature cycle. Firstly, when the target pressure was reached, the impedance spectra were collected at temperatures of 100–400°C (or 350°C) in 50°C intervals, and the heating-cooling cycles in this temperature range were performed until the reproducibility of resistance values was acquired. Subsequently, the complex impedance spectra were collected in the successive heating-cooling cycles at 100–700°C with a temperature interval of 50°C. An abrupt variation of impedance arc was observed in the heating process a at a temperature of ∼400°C at different pressures, reflecting the occurrence of siderite decomposition. In the subsequent heating-cooling cycles, the reproducible impedances were attained. After completion of the conductivity measurements, the sample was quenched by switching the heating current and slowly decompressed to room pressure. The experimental conditions are listed in Table 1 in detail.
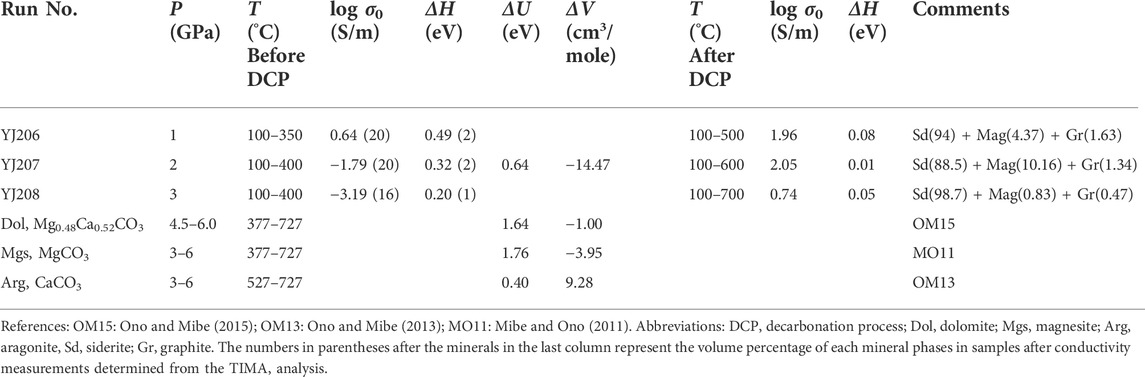
TABLE 1. Experimental conditions and the Arrhenius fitting parameters for the electrical conductivity of siderite (Fe0.88Mn0.03Mg0.09CO3) before decomposition and after partly decomposition as well as previous results of other carbonate minerals.
The sample conductivity (σ, S/m) was calculated from the resistance and the geometric factor (l/S) using the equation, σ = l/SR, where l is the sample length (m), S is the electrode area (m2) that is equal to the cross-sectional area of the sample in our experiments, and R (Ω) is the measured resistance of sample obtained by the equivalent circuit fitting. The change in sample dimensions caused by thermal expansion and compression is very small by measuring the geometrical shape of the recovered sample, which almost can be neglected. The uncertainties from temperature and pressure on the sample conductivity owing to the thermal gradient along the length of the sample and the accuracy of pressure calibration, are not more than 5%. Consequently, the overall uncertainty of the sample conductivity values is estimated to be less than 8% including the fitting error (<3%) of impedance spectra for all measurements.
Sample characterization after experiments
The recovered samples were mounted in the epoxy resin, sectioned, and then polished for the sample characterization after electrical conductivity measurements. The chemical composition of the recovered sample at different pressures was determined by EPMA using JEOL-JXA-8230 electron microprobe, and the backscattered electron images (BSE) were simultaneously acquired, the results are given in Supplementary Table S1 and Supplementary Figure S1. Since the iron oxide appeared and the potential presence of carbon in voids was not efficiently identified by the EMPA analysis owing to the samples coated with carbon, the confocal Raman imaging by the use of WITec alpha300R confocal Raman microscopy installed in the Key Laboratory of Macrocyclic and Supramolecular Chemistry of Guizhou Province, Guizhou University, China, was employed to confirm the iron oxide and carbon species as well as to investigate the spatial distribution of different mineral phases in sample. In Raman imaging, a confocal microscope was combined with a spectrometer, and Raman spectra were collected at every image pixel. The excitation wavelength and laser powers are 532 nm and 2.4 mW, respectively. The confocal signals are collected using a charge-coupled device thermoelectrically cooled to minus 60°C. The Raman data are analyzed by virtue of the WITec Project software package. A representative microscopic image and color-coded Raman image and corresponding spectra are shown in Figure 3, in which new phases coexisting with the siderite sample are observed and microfractures are present owing to compression crushing at high pressure. The released volatiles are evident from the voids.
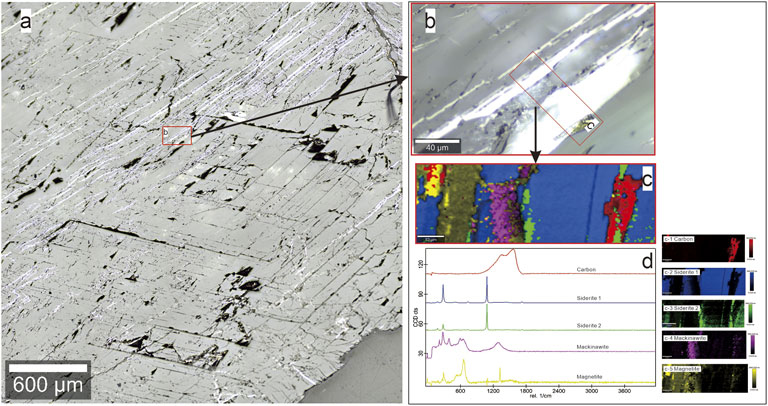
FIGURE 3. A representive Raman analysis results of the recoved siderite sample. (A) The optical microscope image showing the presence of microfracture and some new phases in siderite sample after high pressure. (B) The enlarged microscope image of the selected area in (A) and the red enframed region of (C) further analyzed. Combined false-color Raman image in (C), and the colors correspond to the spectra shown in (D). Scale bars are shown in each of images. After conductivity measurement, siderite is still the dominant phase with hgih abundances ≥88.5%, whereas it underwent low degree decarbonation reaction, generating a very small amount of highly conductive phases (graphite and magnetite). Additionally, mackinawite is probably present in the starting sample.
In order to accurately quantify the mineral proportions after low degree decarbonization of siderite, the recently developed technique of TESCAN Integrated Mineral Analyzer (TIMA) was adopted, that is equipped with an automated quantitative analysis system for the mineral mass analysis and phase/mineral distribution mapping by the use of a fully integrated quantitative energy-dispersive X-ray spectrometry (EDS) and an advanced statistical approach to scanning electron microscopy (SEM) system. The TIMA analyses were completed at the Xi’an Kuangpu Geological Exploration Technology Co., Ltd. For the TIMA analyses, the recovered samples were cut and polished along the cross-section of the sample and coated with a thin gold layer. The high-resolution SEM images for the whole plane of the polished cross-section of the sample were used to determine the phase proportions. A representative TIMA analysis result from the sample at 1 GPa is shown in Figure 4, and some similar results at different pressures are indicated in Supplementary Figure S2. Since the sample at 3 GPa was partly lost during the sample preparation process, the error in the calculated phase proportion would be relatively larger compared to other samples. The results of mineral proportion in the recovered samples are summarized in Table 1.
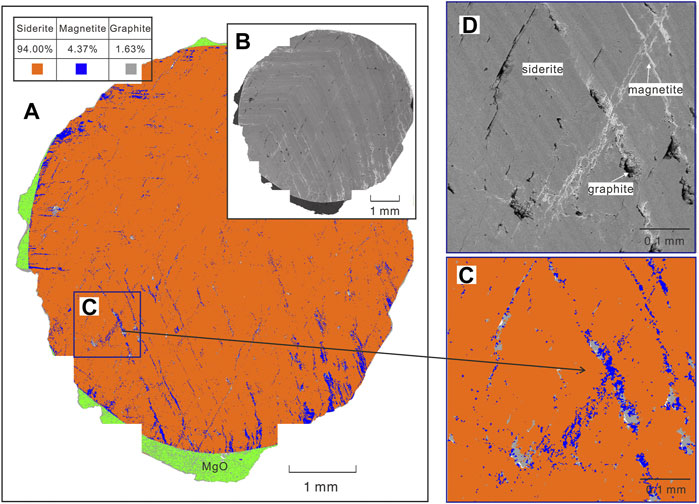
FIGURE 4. A representative mineral mapping of the plane of the cross-section of the recovered sample after conductivity measurement at 1 GPa by TIMA analysis. (A) TIMA mineral phases map and simultaneously acquired BSE image (B) of the whole cross-section of the sample. The mineral map (C) and corresponding BSE image (D) of the zoomed area selected from (A). The dark voids shown in BSE images (D) are the evidence of the release of volatiles and indicate precipitation of graphite. The volume fraction of each mineral was summerized Table 1 acquired from TIMA analysis. The green region shown in (A) represents the MgO sample chamber, as detailed in the experimental assembly diagram.
Results
Figure 5 indicates the typical impedance spectra of the sample measured in the second heating-cooling modes at 3 GPa. At temperatures below 500°C (Figure 5A), the impedance spectra exhibit an approximate semicircular arc with a center on or slightly below the real axis (Z′). Hence, an equivalent circuit consisting of a parallel resistor (R) and a constant phase element (CPE) is employed to fit these impedance spectra in order to obtain sample resistance. In the first heating-cooling cycles at temperatures ≤400°C, the impedance spectra have similar features as shown in Figure 5A and are reproducible at each temperature point. As temperature increases (Figure 5B), the impedance spectra change from a complete semicircular arc a to partial distorted semicircular arc until a line vertical to the real part of impedance Z″ appears, accompanying the impedance value sharply decreases from a hundred of kilo-ohm (kΩ) at 500°C to less than one hundred ohms (Ω) at temperature <600°C. It may reflect the decomposition reaction of the sample that occurred in high-temperature regions and produced highly conductive materials, resulting in the abrupt increase of conductivity. The analogous spectra were also observed in some highly conductive materials such as silicate/carbonatite melts (Sifré et al., 2015; Guo et al., 2017; Guo et al., 2018; Yoshino et al., 2018; Guo et al., 2021), NaCl-bearing (Guo and Keppler, 2019; Klumbach and Keppler, 2020) or water-bearing fluids from the dehydration of hydrous minerals (Manthilake et al., 2016; Pommier et al., 2019), and metallic minerals (Dai et al., 2019). In the second cooling cycle shown in Figure 5C, all of the impedance spectra exhibit similar vertical lines, implying the highly conductive phases in the sample dominate the conductivity. On a basis of the vertical lines caused by the relatively large contribution of the induction component from an electrode or lead wire, the equivalent circuit composed of an inductor and resistor as shown in Figure 5C is adopted to model the electrical response of the sample over the whole frequency range. The feature of impedance spectra in different heating-cooling cycles at 1 and 2 GPa resembles that obtained at 3 GPa.
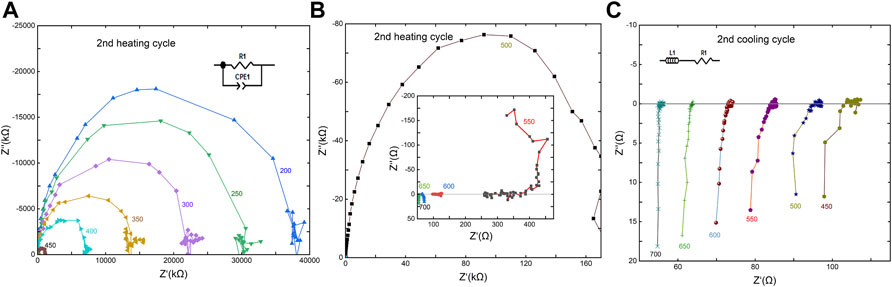
FIGURE 5. Representative complex impedance spectra measured at the second heating and cooling cycles at 2 GPa. The numbers alongside the impedance arcs are the temperature (°C). Impedance spectra gradually change from nearly semi arcs (A) to lines (B) with increasing temperature, reflecting the occurrence of sample decarbonation. In the second cooling cycle (C), the vertical lines are across the real impedance line at all temperature points that are characteristic of a conductor, thus the equivalent circuit composed of an inductor and resistor is used to model the resistance of sample.
The conductivity results in different heating-cooling cycles at 3 GPa is shown in Figure 2, along with the background conductivity of the sample cell. In the low-temperature regions (100–400°C), the electrical conductivities of the sample gradually increase with increasing temperature and are almost reproducible after the first heating-cooling cycles. The slightly higher conductivity in the first heating cycle was probably attributed to the remaining moisture in the system, and these data were usually excluded from the analysis. The sample in the low-temperature regimes have relatively low conductivity values, falling in the range of 10−4.5–10−6 S/m. Once the sample heated beyond 400°C in the second heating cycle, a large jump in conductivity was observed and the conductivity at 700°C is higher than that at 400°C by nearly five orders of magnitude. In the subsequent cooling/heating cycles, the conductivities cannot be reversible and still keep the high value with around 0.5 log unit (S/m) over the whole temperature range. In addition, the dependence of electrical conductivity on temperature can be almost negligible compared to that observed at low temperatures in the first heating-cooling cycle. The abrupt increase in conductivity is a consequence of the partial decomposition of the siderite sample, producing the highly conductive minerals that were confirmed by Raman spectroscopic analysis and TIMA results as shown in Figures 3, 4. Therefore, the reversible high conductivity yielded after the second heating cycle is attributed to the presence of highly conductive minerathe ls in the sample. The variation in electrical conductivity with the temperature at 1 and 2 GPa is analogous to that at 3 GPa.
Figure 6 displays the electrical conductivity of the siderite sample as a function of reciprocal temperature at 1–3 GPa, together with previous conductivity results of carbonate minerals as well as some highly conductive minerals for comparison. At low temperatures (<450°C), the conductivity linearly increases with increasing temperature under different pressures, and almost decreases with increasing pressure at the same temperature, whereas the effect of pressure on the conductivity is smaller relative to that of temperature. The initial decarbonation temperature determined based on the sudden change of conductivity seems to gradually increase with increasing pressure, e.g., 350°C at 1 GPa, 400°C at 2 GPa, and 450°C at 3 GPa, that is because the stability field of siderite expands as pressure increases. After the decarbonation occurrence, the conductivity shows an extremely weak temperature dependence and even can be considered to be independent of temperature. Nevertheless, the marked variation of conductivity at different pressure is directly associated with the different amounts of highly conductive phases (i.e., magnetite and graphite), and the electrical conductivity increases with an increasing amount of those conductive phases, for instance, a sample with 11.5 vol.% of highly conductive phases at 2 GPa has higher conductivity than those at 1 GPa and at 3 GPa, with values of 6 vol.% and 1.3 vol.%, respectively.
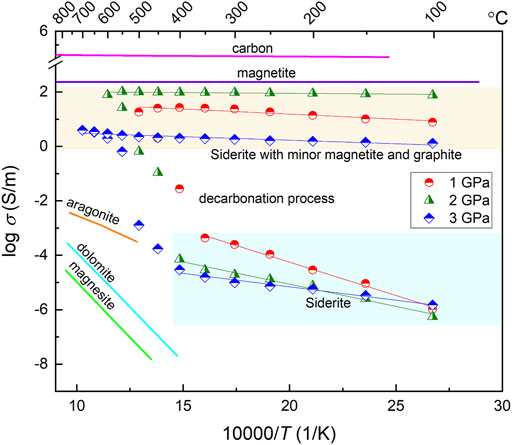
FIGURE 6. Temperature-dependent electrical conductivity of siderite at 1–3 GPa. The straight lines before and after the occurrence of sample decarbonation are the fitting results from Arrhenius equation. For comparison, the electrical conductivity of other carbonate minerals, e.g., aragonite Ono and Mibe (2013), dolomite Ono and Mibe (2015), and magnesite Mibe and Ono (2011), as well as the high conductive phases, e.g., magnetite Dai et al. (2019) and graphite Yoshino and Noritake (2011) are shown as solid lines with different color.
The linear relationship between conductivity and reciprocal temperature for the samples before and after the decarbonation occurrence can be expressed by the Arrhenius equation:
where
Discussion
Conduction behavior
Under our experimental conditions, the siderite samples exhibit a large variation in conductivity with the temperature that is associated with the occurrence of sample decomposition. The notably diverse activation enthalpies obtained before and after the decomposition reaction imply the possible different conduction mechanisms respectively dominating the conductivity of the sample in the two processes. In the low temperature regime before sample decomposition, the electrical conductivities are reproducible and relatively high with the values of ∼10−3–10–6.5 S/m and can be nearly comparable to those of aragonite (Ono and Mibe, 2013) at similar temperatures, but higher than those of dolomite and magnesite (Mibe and Ono, 2011; Ono and Mibe, 2015) as indicated in Figure 6. All of the previous conductivity measurements on carbonate minerals are within their stability field at a temperatures no more than 727°C. In this study, the conductivity measurements on siderite in the low-temperature region less than 500°C are also performed within its stability field based on the phase diagram of siderite (Tao et al., 2013). Consequently, the conduction mechanism at low temperature region should be the intrinsic conduction of the sample rather than the external conduction from other materials. The activation enthalpies obtained at low temperature decrease as pressure increases as shown in Figure 6; accordingly, the activation volume is −14.47 cm3/mole as indicated in Table 1. The negative pressure effect on the conductivity in siderite resembles that in dolomite and magnesite as shown in Figure 7, however, the much lower activation volume of siderite (−14.47 cm3/mole) compared to those of dolomite (−1.00 cm3/mole) and magnesite (−3.95 cm3/mole), is probably related to the iron of bivalence-variable metallic cation in the lattice position, unlike the unable oxidized cations in Ca-Mg carbonates, i.e., Ca, Mg. Due to the high activation energy of Ca-Mg carbonates (1.64 eV for dolomite and 1.76 eV for magnesite), the hopping conduction due to the large polarons process involving magnesium or/and calcium vacancies and a trapped hole is suggested to be the dominant mechanism in previous studies (Mibe and Ono, 2011; Ono and Mibe, 2015). For iron-rich carbonate, resembling to other Fe-bearing silicate minerals, e.g., Fe-bearing olivine, garnet, pyroxene, pand erovskites (Xu et al., 2000; Romano et al., 2006; Yang and Heidelbach, 2012; Dai and Karato, 2014; Sinmyo et al., 2014), the small polaron that electron-hole hopping between ferrous (Fe2+) and ferric (Fe3+) ions are likely to be the predominant conduction mechanism. Hence, it is proposed that the small polaron dominates the conductivity of siderite before the occurrence of the decarbonation reaction, with the characteristic of a relatively lower activation energy (0.64 eV).
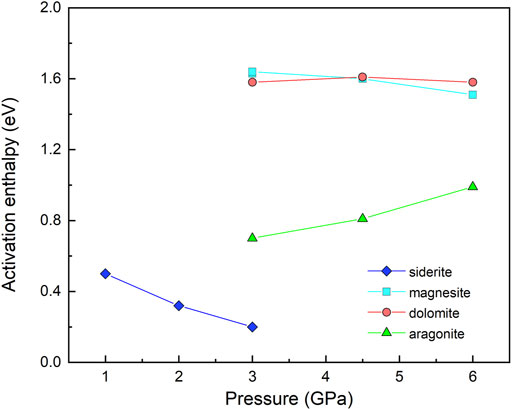
FIGURE 7. Activation enthalpies of carbonate minerals as a function of pressure before decarbonation reaction. The data of magnesite, dolomite and aragonite are from Mibe and Ono (2011), Ono and Mibe (2015), Ono and Mibe (2013), respectively.
Once the decarbonation reaction of the sample occurred when heated to a high temperature, the electrical conductivity abruptly increases by serval orders of magnitude, and it is irreversible when the sample was annealed to low temperature. The BSE image and confocal Raman imaging of the recovered sample (Figures 3, 4) have confirmed that a low degree of decarbonation took place at a high temperature. Simultaneously, except for mackinawite derived from the original sample, a very small amount of carbon and magnetite are produced during the partial decomposition process. Previous experimental studies have revealed that the percolation threshold of the highly-conductive phase concentrations in olivine aggregates are ∼1.7 vol.% graphite and ∼5 vol.% magnetite, respectively (Wang et al., 2013; Dai et al., 2019), and the critical volume fraction for connectivity of magnetite in serpentinite aggregates is even up to 25 vol.% (Kawano et al., 2012). In contrast, the theoretical calculation and experimental results on the conductivity of the natural chlorite have demonstrated that even less than 0.1 vol.% magnetite can form interconnectivity in the insulative matrix (Manthilake et al., 2016, see Supplementary Figure S1). In this study, the siderite sample only with the 1.3 vol.% of highly conductive minerals also has dramatically enhanced conductivity, and thus, it can be speculated that the interconnected networks or channels can easily be established in natural samples with a relatively low amount of highly conductive phases, compared to a synthetic sample from powder mixture. On the other hand, the large change in conductivity after the occurrence of siderite decarbonation accompanies the notable change in activation enthalpy, with the extremely low values of 0.01–0.08 eV as shown in Table 1, which are generally in accordance with that (0.02 eV) of graphite (Yoshino and Noritake, 2011) and magnetite (Kawano et al., 2012; Dai et al., 2019), and is also comparable to that of chlorite (i.e., 0.04 eV for low temperature and 0.15 eV for high temperature) after magnetite formation during dehydration reaction (Manthilake et al., 2016). Therefore, the anomalously high conductivity and low activation enthalpy after the onset of siderite decarbonation is a consequence of the presence of these interconnected highly-conductive phases (carbon and magnesite). Accordingly, the decomposition reaction of siderite at high temperature and high pressure is generally expressed as:
As illustrated in Figure 4, the microfractures and voids are developed during the conductivity measurement process, which may be attributed to the released gas phase. Meanwhile, the precipitation of graphite appears in these microfractures and voids. Actually, CO gas as an intermediate product was potentially formed during the decarbonation process of siderite by the reaction of 3FeCO3 = Fe3O4 + 2CO2 + CO, whereas the ratio of CO2 to CO is metastable with respect to the formation of graphite, that would be precipitated from the gas phase by the reaction 2CO = CO2 + C (Yui, 1966; Tao et al., 2013).
Constraints on the incipient temperature of siderite decarbonation
The electrical conductivity measurement is a very efficient approach to trace the state change (e.g., dehydration, dehydrogenation, decarbonation, melt, phase transition, etc.) of the sample at high temperature and high pressure, since a slight change of sample state usually can cause an observable variation in conductivity with temperature or pressure (Maumus et al., 2005; Manthilake et al., 2016; Hu et al., 2017; Hu et al., 2018; Manthilake et al., 2021; Hong et al., 2022). In this study, the sudden change in the conductivity occurred 350–450°C at different pressure has demonstrated that the siderite sample underwent a low degree decarbonation, producing magnetite and graphite that confirmed and quantified by confocal Raman imaging and TIMA image. Previous experimental study on the stability of siderite indicated that the decarbonation reaction is rather sluggish, even if duration up to 36 h at 900°C and 2.5 GPa, 88.3% siderite is still present in the quenched sample (Tao et al., 2013). Our experiments further verified the sluggishness of decarbonation reaction of siderite, even though the conductivity measurements were performed in three heating-cooling cycles within several hours, no less than 88.5 vol.% of siderite are still present in the recovered samples under experimental conditions as shown in Table 1. On the basis of the criteria of the phase boundary of siderite established by Tao et al. (2013), the run products with abundances >85% of siderite is regarded as siderite stable. It implies that in this study the recovered sample is within the stability field of siderite because ≥88.5 vol.% of siderite is still present after conductivity measurement. In light of the dramatical variation in electrical conductivity, our experimental results have clearly indicated that siderite have become to be thermally unstable and launched to breakdown at temperatures of 350–450°C under pressures of 1–3 GPa at oxygen fugacity of NNO buffer. From Figure 8, we found that the initial decarbonation temperature (350–450°C) of siderite determined by this study is far lower than that of previously reported decomposition boundary temperature (>600°C) determined by phase equilibrium experiments at same pressure ranges (Weidner, 1972; Koziol, 2004; Tao et al., 2013). These previously determined phase boundary of siderite decomposition was acquired under conditions of enough long duration in order to reach fully high-pressure phase equilibrium, correspondingly, the reaction products were quenched and analyzed. Hence, it is incapable to investigate the initial temperature of siderite decomposition, unless the high-temperature and high-pressure in-situ synchrotron X-ray diffraction technique is employed. In contrast, our present in-situ electrical conductivity of siderite measured in continuous heating process at different pressures constrained the incipient decarbonation temperature. As shown in Figure 8, the boundaries of the onset and completion of siderite decomposition are very wide, spanning several hundred degrees of Celsius due to the sluggishness of decarbonation reaction, implying that the occurrence of initial decarbonation of Fe-bearing carbonate is at a shallower depth in subducting oceanic crust. On the other hand, the initial decomposition temperature of siderite is much lower the geotherms of hot subduction and mantle, but intersect with the geotherm of cool subduction zone at below 450°C, hence, it is inferred that siderite is probably decomposed before subducted into the mantle.
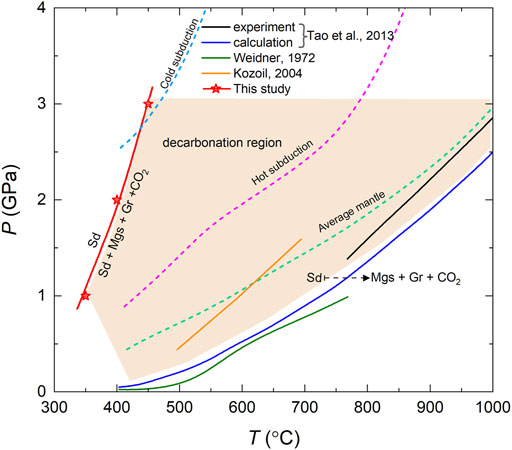
FIGURE 8. The incipient decomposition temperature of siderite = magnetite + graphite + CO2 determined in this study, along with previous phase boundary results from phase equilibrium experiments and thermodynamically calculation. The thermal structures of deduction slab in typical hot and cool subduction zones and average mantle geotherm indicated as dashed lines from Syracuse et al. (2010) and Akaogi et al. (1989).
The decarbonation reaction of siderite is not only dependent on P-T conditions, but is also strongly dependent on the oxygen fugacity, owing to the Fe element that can exist in multiple valence states. The experimental and theoretical results of Fe-C-O phase diagram in T-P-fO2 have indicated that the siderite stability field is wedge-shaped, and has its thermal maximum at the intersection with the CCO buffer (Yui, 1966; Kozil, 2004; Kang et al., 2015). Pressure and carbon dioxide fugacity (
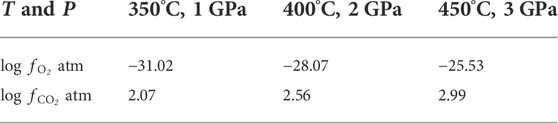
TABLE 2. The calculated fugacities of oxygen and carbon dioxide at the initial decomposition temperature of siderite at different pressure based on the formula given by Yui (1966).
Implications for high conductivity anomalies at slab-mantle wedge interface
Magnetotelluric images of the subduction zones has indicated that highly conductive anomalies are extensively present along or above the slab at variable depths, that are commonly interpreted as the presence of aqueous fluid or melt due to the dehydration of the descending slab (Wannamaker et al., 2009; Worzewski et al., 2011; McGary et al., 2014). Fluid accumulation in the forearc at depths of 20–40 km is regarded as a global phenomenon based on the consistent perception of electromagnetic (high conductivity) and seismic (low velocity) results. However, the compositions of fluid released from slabs are not well constrained, while the electrical conductivity of fluids has a strong compositional dependence, therefore, fluid fraction in the forearc has not been accurately estimated until now. Recent studies have demonstrated that the majority of CO2 (likely up to ∼65%) can be released at forearc depths in the typical subducting oceanic crust by decarbonation reactions, rather than subducted to the deep mantle, meanwhile, the released CO2 may be stored in the lithospheric mantle of the overriding plate (Barry et al., 2019; Stewart and Ague, 2020). The slab-released aqueous fluids could dissolve carbonate minerals stored in sediments, altered oceanic crust and carbonated mantle peridotite, producing carbon-bearing fluids. The present lack of the electrical conductivity of CHO fluids as a function of temperature, pressure and composition makes it difficult to constrain the carbon content in CHO fluids and its fluid fraction under subduction conditions while combining with magnetotelluric results. In addition, recent experimental results have indicated the substantial replacement of Ca2+ by Mg2+ in carbonate can decrease the solubility by at least two orders of magnitude (Farsang et al., 2021). It is speculated that the substitution of Fe2+ for Mg2+ in magnesite and dolomite probably has an important influence on the solubility of these carbonate minerals during subduction process, because the presence of Fe in carbonate can dramatically affect the physical properties, for instance, reducing the decarbonation temperature and the stability field of carbonates (Tao et al., 2014; Bataleva et al., 2020). Hence, the electrical conductivity of CHO fluids and the solubility of Fe-bearing carbonate at high temperature and pressure are required to better constrain the carbon content in aqueous fluid present in the forearc.
On the other hand, the highly conductive minerals, e.g., magnetite and graphite, are likely an important candidate for the explanation of high conductivity anomalies in the subduction zones, particularly, in the slab-mantle wedge interface where the buoyant fluid and melt phases are gravitationally unstable and can migrate upward via channels and fractures that formed by dehydration reactions (Plümper et al., 2017). Hydration and carbonation of mantle peridotite in the subduction zone generate carbonated serpentinites that commonly contain a certain amount of magnetite, some even up to 6.15 wt% magnetite (Klein et al., 2014; Guillot et al., 2015). The presence of magnetite in serpentinite would have a considerable effect on the electrical conductivity of serpentinites owing to its highly conductive feature. Nevertheless, the experimental results have shown that the conductivity of serpentinite was not significantly enhanced by the addition of 5 vol.% magnetite, and more than 25 vol.% magnetite is needed for the establishment of interconnectivity, but the shear deformation at the plate interface can promote the conductivity of serpentinite by an order of magnitude (Kawano et al., 2012). It implies that the connectivity of magnetite in the natural serpentinite under subduction context is likely established with far less than the percolation threshold (i.e., 25 vol.% magnetite).
Siderite often occurs with magnesite in rock and commonly form a continuous solid solution of (Mg,Fe)CO3 in natural carbonated oceanic and continental crust. To evaluate the contribution of siderite to the high conductivity at slab-mantle wedge interface, the threshold volume fraction of siderite in Fe-bearing carbonates is firstly qualified. Correspondingly, the electrical conductivity of Mg-Fe carbonate solid solutions, as a representative for Fe-bearing carbonates, are calculated by the effective medium (EM) theory model (Landauer, 1952), in combination with the conductivity data of magnesite from Mibe and Ono, (2011) and siderite from this study. The EM model can be expressed as
Here
Figure 9 shows the calculation results of ferromagnesian carbonate solid solutions as a function of various Fe content (XFe: the mole fraction of iron in the Mg site) within the temperature range of 400–900°C at 2 GPa. In this temperature range, the decarbonation reaction of siderite will take place, whereas magnesite is still within its stability field and has very low conductivity values, thus, it acts as the insulative matrix in (Fe, Mg)CO3 solid solutions. The electrical conductivity of magnesite-siderite solid solutions slightly increases with the increase of Fe concentration. When the content of the siderite component is increased up to 25% in the magnesite-siderite solid solutions, the conductivity of Mg-Fe carbonate is apparently enhanced with a value close to 0.1 S/m. Once the siderite component exceeds the percolation threshold of 30%, (Mg, Fe)CO3 solid solutions have the conductivity almost equal to siderite. Consequently, the component of (Mg0.7Fe0.3)CO3 is needed so as to make a contribution to high conductivity in the temperature ranges of 400–900°C.
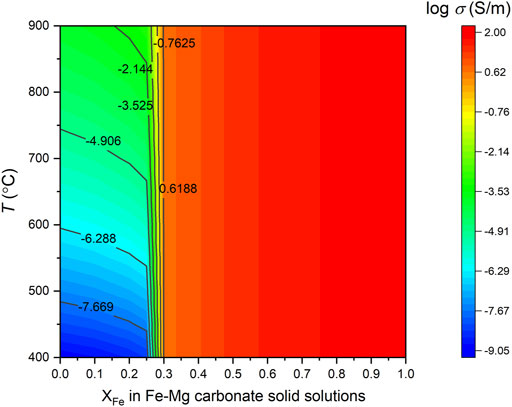
FIGURE 9. The calculated conductivity of (Mg, Fe)CO3 solid solutions as a function of various Fe content in the temperature range of 400–900°C and at 2 GPa using the EM model. The numbers shown in the contour lines are the logarithmic conductivity.
Our results have indicated that the low degree decarbonation of siderite with even only 1.3 vol.% of magnetite and graphite produced, cause a dramatical increase in electrical conductivity. It has also been demonstrated that the interconnectivity of graphite in resistive matrix can be easily established with the lower volume fraction (1.7 vol.%) (Wang et al., 2013). Consequently, the addition of highly conductivity materials (magnetite and graphite) generated from the siderite component of the Fe-bearing carbonate, into serpentinite will improve the interconnectivity of magnetite, that likely become the origin of highly conductivity anomalies observed in the slab-mantle wedge interface at relatively shallow depth of ∼20–40 km. As the plate subducts downwards, besides the progressive decarbonation of Fe-bearing carbonate, the dehydration of hydrous minerals, e.g., chlorite (Manthilake et al., 2016) and epidote (Hu et al., 2017), as well as devolatilization of carbonate-bearing serpentinite (Manthilake et al., 2021) can provide substantial iron oxides (e.g., hematite, magnetite). The accumulation of iron oxides at the slab-mantle wedge interface is potentially responsible for the anomalous high conductivity observed at relatively deep depths.
Conclusion
The electrical conductivity of natural siderite was determined at temperatures of 100–700°C and pressures of 1–3 GPa. An abrupt increase in conductivity observed at ∼400°C is attributed to the low degree decarbonation of siderite, accompanying the formation of a small amount of highly conductive phases (graphite and magnetite). The obvious variation in electrical conductivity and activation enthalpy before and after the occurrence of siderite decarbonation suggest two different conduction mechanisms, the small polaron (electron hopping between Fe2+ and Fe3+) and highly conductive phases dominating electrical conductivity, respectively. The incipient decarbonation temperature determined in this study is much lower than complete decomposition temperature of siderite determined by phase equilibrium experiments; implying the initial decomposition of Fe-bearing carbonates in subducting oceanic crust occurs at a shallower depth. The 30 vol.% of siderite is required to enhance the electrical conductivity of (Mg,Fe)CO3 solid solutions. Magnetite and graphite derived from the siderite component of Fe-bearing carbonate will promote the interconnectivity of magnetite in natural serpentinite, in addition to a significant contribution of magnetite from devolatilization of hydrous minerals in subduction zone. Therefore, magnetite is likely a new candidate for the origin of anomalously high conductivity observed in slab-mantle wedge interface.
Data availability statement
The original contributions presented in the study are included in the article/Supplementary Material, further inquiries can be directed to the corresponding author.
Author contributions
HH: conceptualization, writing-original draft preparation. CJ: software, analysis, and data curation. LD: supervision, discussion, editing. CY and DC: visualization, investigation. All authors contributed to the final manuscript.
Funding
This study was financially supported by the National Natural Science Foundation of China (Grant No. 42072055), the Youth Innovation Promotion Association of CAS (Grant No. 2019390), Special Fund of the West Light Foundation of CAS (2018) as well as the Science and Technology Foundation of Guizhou Province [grant number QKHJZ (2013) 2285] as well as Guizhou Provincial 2019 and 2020 Science and Technology Subsidies (grant numbers GZ2019SIG and GZ2020SIG).
Acknowledgments
The authors thank the senior technicians of Dr. Qian Cheng for their technical assistance with Raman spectroscopic analysis from the WITec (Beijing) Scientific Technology Co., Ltd. Shengping Li is thanked for his help with the TIMA analyses.
Conflict of interest
The authors declare that the research was conducted in the absence of any commercial or financial relationships that could be construed as a potential conflict of interest.
Publisher’s note
All claims expressed in this article are solely those of the authors and do not necessarily represent those of their affiliated organizations, or those of the publisher, the editors, and the reviewers. Any product that may be evaluated in this article, or claim that may be made by its manufacturer, is not guaranteed or endorsed by the publisher.
Supplementary material
The Supplementary Material for this article can be found online at: https://www.frontiersin.org/articles/10.3389/feart.2022.985740/full#supplementary-material
References
Akaogi, M., Ito, E., and Navrotsky, A. (1989). Olivine-modified spinel-spinel transitions in the system Mg2SiO4-Fe2SiO4: Calorimetric measurements, thermochemical calculation, and geophysical application. J. Geophys. Res. 94, 15671–15685. doi:10.1029/JB094iB11p15671
Alt, J. C., and Teagle, D. A. H. (1999). The uptake of carbon during alteration of ocean crust. Geochim. Cosmochim. Acta 63, 1527–1535. doi:10.1016/S0016-7037(99)00123-4
Barry, P. H., de Moor, J. M., Giovannelli, D., Schrenk, M., Hummer, D. R., Lopez, T., et al. (2019). Forearc carbon sink reduces long-term volatile recycling into the mantle. Nature 568, 487–492. doi:10.1038/s41586-019-1131-5
Bataleva, Y. V., Kruk, A. N., Novoselov, I. D., Furman, O. V., and Palyanov, Y. N. (2020). Decarbonation reactions involving ankerite and dolomite under upper mantle P, T-parameters: Experimental modeling. Minerals 10, 715. doi:10.3390/min10080715
Boulard, E., Gloter, A., Corgne, A., Antonangeli, D., Auzende, A-L., Perrillat, J-P., et al. (2011). New host for carbon in the deep Earth. Proc. Natl. Acad. Sci. U. S. A. 108, 5184–5187. doi:10.1073/pnas.1016934108
Cerantola, V., Bykova, E., Kupenko, I., Merlini, M., Ismailova, L., McCammon, C., et al. (2017). Stability of iron-bearing carbonates in the deep Earth’s interior. Nat. Commun. 8, 15960. doi:10.1038/ncomms15960
Dai, L., Hu, H., Sun, W., Li, H., Liu, C., and Wang, M. (2019). Influence of high conductive magnetite impurity on the electrical conductivity of dry olivine aggregates at high temperature and high pressure. Minerals 9, 44. doi:10.3390/min9010044
Dai, L., and Karato, S. (2014). Influence of FeO and H on the electrical conductivity of olivine. Phys. Earth Planet. Interiors 237, 73–79. doi:10.1016/j.pepi.2014.10.006
Dasgupta, R., and Hirschmann, M. M. (2007). Effect of variable carbonate concentration on the solidus of mantle peridotite. Am. Mineral. 92, 370–379. doi:10.2138/am.2007.2201
Dasgupta, R., and Hirschmann, M. M. (2006). Melting in the Earth's deep upper mantle caused by carbon dioxide. Nature 440, 659–662. doi:10.1038/nature04612
Dasgupta, R., Hirschmann, M. M., and Withers, A. C. (2004). Deep global cycling of carbon constrained by the solidus of anhydrous, carbonated eclogite under upper mantle conditions. Earth Planet. Sci. Lett. 227, 73–85. doi:10.1016/j.epsl.2004.08.004
Dubrawski, J. V. (1991). Thermal decomposition of some siderite-magnesite minerals using DSC. J. Therm. Analysis 37, 1213–1221. doi:10.1007/bf01913855
Farsang, S., Louvel, M., Zhao, C., Mezouar, M., Rosa, A. D., Widmer, R. N., et al. (2021). Deep carbon cycle constrained by carbonate solubility. Nat. Commun. 12, 4311. doi:10.1038/s41467-021-24533-7
Gaillard, F., Malki, M., Iacono-Marziano, G., Pichavant, M., and Scaillet, B. (2008). Carbonatite melts and electrical conductivity in the asthenosphere. Science 322, 1363–1365. doi:10.1126/science.1164446
Ghosh, S., Ohtani, E., Litasov, K. D., and Terasaki, H. (2009). Solidus of carbonated peridotite from 10 to 20 GPa and origin of magnesiocarbonatite melt in the Earth's deep mantle. Chem. Geol. 262, 17–28. doi:10.1016/j.chemgeo.2008.12.030
Guillot, S., Schwartz, S., Reynard, B., Agard, P., and Prigent, C. (2015). Tectonic significance of serpentinites. Tectonophysics 646, 1–19. doi:10.1016/j.tecto.2015.01.020
Guo, H., and Keppler, H. (2019). Electrical conductivity of NaCl-bearing aqueous fluids to 900 °C and 5 GPa. J. Geophys. Res. Solid Earth 124, 1397–1411. doi:10.1029/2018JB016658
Guo, X., Li, B., Ni, H., and Mao, Z. (2017). Electrical conductivity of hydrous andesitic melts pertinent to Subduction zones. J. Geophys. Res. Solid Earth 122, 1777–1788. doi:10.1002/2016JB013524
Guo, X., Wang, Q., Li, B., Zha, X. P., Gong, B., and Ni, H. (2021). Electrical conductivity of CO2 and H2O-bearing nephelinitic melt. J. Geophys. Res. Solid Earth 126, e2020JB019569. doi:10.1029/2020JB019569
Guo, X., Zhang, L., Su, X., Mao, Z., Gao, X., Yang, X., et al. (2018). Melting inside the Tibetan crust? Constraint from electrical conductivity of peraluminous granitic melt. Geophys. Res. Lett. 45, 3906–3913. doi:10.1029/2018GL077804
Hong, M., Dai, L., Hu, H., Yang, L., and Zhang, X. (2022). Pressure-induced structural phase transitions in natural kaolinite investigated by Raman spectroscopy and electrical conductivity. Am. Mineral. 107, 385–394. doi:10.2138/am-2021-7863
Hu, H., Dai, L., Li, H., Hui, K., and Sun, W. (2017). Influence of dehydration on the electrical conductivity of epidote and implications for high-conductivity anomalies in subduction zones. J. Geophys. Res. Solid Earth 122, 2751–2762. doi:10.1002/2016JB013767
Hu, H., Dai, L., Li, H., Sun, W., and Li, B. (2018). Effect of dehydrogenation on the electrical conductivity of Fe-bearing amphibole: Implications for high conductivity anomalies in subduction zones and continental crust. Earth Planet. Sci. Lett. 498, 27–37. doi:10.1016/j.epsl.2018.06.003
Kang, D., Schmidt, M. W., Poli, S., Franzolin, E., and Connolly, J. D. (2015). Melting of siderite to 20 GPa and thermodynamic properties of FeCO3-melt. Chem. Geol. 400, 34–43.
Kawano, S., Yoshino, T., and Katayama, I. (2012). Electrical conductivity of magnetite-bearing serpentinite during shear deformation. Geophys. Res. Lett. 39, L20313. doi:10.1029/2012GL053652
Keppler, H., Wiedenbeck, M., Shcheka, S. S., and Jons, N. (2003) Magnetite in seafloor serpentinite--Some like it hot. Nature 424, 414–416. doi:10.1038/nature01828
Klein, F., Bach, W., Humphris, S. E., Kahl, W-A., Jöns, N., Moskowitz, B., et al. (2014) Magnetite in seafloor serpentinite‒Some like it hot. Geology 42, 135–138. doi:10.1130/G35068.1
Klumbach, S., and Keppler, H. (2020) Electrical conductivity of HCl-bearing aqueous fluids to 700°C and 1 GPa.. Contrib. Mineral. Petrol. 175, 114. doi:10.1007/s00410-020-01754-5
Koziol, A. M. (2004). Experimental determination of siderite stability and application to Martian Meteorite ALH84001. Am. Mineral. 89, 294–300. doi:10.2138/am-2004-2-306
Landauer, R. (1952). The electrical resistance of binary metallic mixtures. J. Appl. Phys. 23, 779–784. doi:10.1063/1.1702301
Liu, J., Lin, J. F., and Prakapenka, V. (2015). High-pressure orthorhombic ferromagnesite as a potential deep-mantle carbon carrier. Sci. Rep. 5, 7640. doi:10.1038/srep07640
Luth, R. W. (1993). Diamonds, eclogites, and the oxidation state of the earth's mantle. Science 261, 66–68. doi:10.1126/science.261.5117.66
Manthilake, G., Bolfan-Casanova, N., Novella, D., Mookherjee, M., and Andrault, D. (2016). Dehydration of chlorite explains anomalously high electrical conductivity in the mantle wedges. Sci. Adv. 2, e1501631. doi:10.1126/sciadv.1501631
Manthilake, G., Mookherjee, M., and Miyajima, N. (2021). Insights on the deep carbon cycle from the electrical conductivity of carbon-bearing aqueous fluids. Sci. Rep. 11, 3745. doi:10.1038/s41598-021-82174-8
Maumus, J., Bagdassarov, N., and Schmeling, H. (2005). Electrical conductivity and partial melting of mafic rocks under pressure. Geochim. Cosmochim. Acta 69, 4703–4718. doi:10.1016/j.gca.2005.05.010
McGary, R. S., Evans, R. L., Wannamaker, P. E., Elsenbeck, J., and Rondenay, S. (2014). Pathway from subducting slab to surface for melt and fluids beneath Mount Rainier. Nature 511, 338–340. doi:10.1038/nature13493
Mibe, K., and Ono, S. (2011). Electrical conductivity of MgCO3 at high pressures and high temperatures. Phys. B Condens. Matter 406, 2018–2020. doi:10.1016/j.physb.2011.03.009
Ono, S., and Mibe, K. (2013). Electrical conductivity of aragonite in the subducted slab. Eur. J. Mineral. 25, 11–15. doi:10.1127/0935-1221/2013/0025-2254
Ono, S., and Mibe, K. (2015). Influence of pressure and temperature on the electrical conductivity of dolomite. Phys. Chem. Min. 42, 773–779. doi:10.1007/s00269-015-0761-x
Papathanassiou, A. N. (1998). Effect of hydrostatic pressure on the electrical conductance of polycrystalline magnesite Mg(CO3). Phys. Rev. B 58, 4432–4437. doi:10.1103/PhysRevB.58.4432
Papathanassiou, A. N., and Grammatikakis, J. (1996). Pressure variation of the electrical conductivity of dolomite [(CaMg(CO3)2]. Phys. Rev. B 53, 16247–16251. doi:10.1103/PhysRevB.53.16247
Plümper, O., John, T., Podladchikov, Y. Y., Vrijmoed, J. C., and Scambelluri, M. (2017). Fluid escape from subduction zones controlled by channel-forming reactive porosity. Nat. Geosci. 10, 150–156. doi:10.1038/ngeo2865
Pommier, A., Williams, Q., Evans, R. L., Pal, I., and Zhang, Z. (2019). Electrical investigation of natural lawsonite and application to subduction contexts. J. Geophys. Res. Solid Earth 124, 1430–1442. doi:10.1029/2018JB016899
Romano, C., Poe, B. T., Kreidie, N., and McCammon, C. A. (2006). Electrical conductivities of pyrope-almandine garnets up to 19 GPa and 1700 °C. Am. Mineral. 91, 1371–1377. doi:10.2138/am.2006.1983
Sifré, D., Hashim, L., and Gaillard, F. (2015). Effects of temperature, pressure and chemical compositions on the electrical conductivity of carbonated melts and its relationship with viscosity. Chem. Geol. 418, 189–197. doi:10.1016/j.chemgeo.2014.09.022
Sinmyo, R., Pesce, G., Greenberg, E., McCammon, C., and Dubrovinsky, L. (2014). Lower mantle electrical conductivity based on measurements of Al, Fe-bearing perovskite under lower mantle conditions. Earth Planet. Sci. Lett. 393, 165–172. doi:10.1016/j.epsl.2014.02.049
Stewart, E. M., and Ague, J. J. (2020). Pervasive subduction zone devolatilization recycles CO2 into the forearc. Nat. Commun. 11, 6220. doi:10.1038/s41467-020-19993-2
Sverjensky, D. A., Stagno, V., and Huang, F. (2014). Important role for organic carbon in subduction-zone fluids in the deep carbon cycle. Nat. Geosci. 7, 909–913. doi:10.1038/ngeo2291
Syracuse, E. M., van Keken, P. E., and Abers, G. A. (2010). The global range of subduction zone thermal models. Phys. Earth Planet. Interiors 183, 73–90. doi:10.1016/j.pepi.2010.02.004
Tao, R., Fei, Y., and Zhang, L. (2013). Experimental determination of siderite stability at high pressure. Am. Mineral. 98, 1565–1572. doi:10.2138/am.2013.4351
Tao, R., Fei, Y., Zhang, L., and Liu, Q. (2014). The effect of Fe on the stability of dolomite at high pressure: Experimental study and petrological observation in eclogite from southwestern Tianshan. China. Geochim. Cosmochim. Acta 143, 253–267. doi:10.1016/j.gca.2014.02.031
Ter Heege, J. H., and Renner, J. (2007). In situ impedance spectroscopy on pyrophyllite and CaCO3 at high pressure and temperature: Phase transformations and kinetics of atomistic transport. Phys. Chem. Min. 34, 445–465. doi:10.1007/s00269-007-0162-x
Thomson, A. R., Walter, M. J., Kohn, S. C., and Brooker, R. A. (2016). Slab melting as a barrier to deep carbon subduction. Nature 529, 76–79. doi:10.1038/nature16174
Wang, D., Karato, S., and Jiang, Z. (2013). An experimental study of the influence of graphite on the electrical conductivity of olivine aggregates. Geophys. Res. Lett. 40, 2028–2032. doi:10.1002/grl.50471
Wannamaker, P. E., Caldwell, T. G., Jiracek, G. R., Maris, V., Hill, G. J., Ogawa, Y., et al. (2009). Fluid and deformation regime of an advancing subduction system at Marlborough, New Zealand. Nature 460, 733–736. doi:10.1038/nature08204
Weidner, J. R. (1972). Equilibria in the system Fe-C-O; Part I, Siderite-magnetite-carbon-vapor equilibrium from 500 to 10, 000 bars. Am. J. Sci. 272, 735–751. doi:10.2475/ajs.272.8.735
Worzewski, T., Jegen, M., Kopp, H., Brasse, H., and Castillo, W. T. (2011). Magnetotelluric image of the fluid cycle in the Costa Rican subduction zone. Nat. Geosci. 4, 108–111. doi:10.1038/ngeo1041
Xu, Y., Shankland, T. J., and Duba, A. G. (2000). Pressure effect on electrical conductivity of mantle olivine. Phys. Earth Planet. Interiors 118, 149–161. doi:10.1016/S0031-9201(99)00135-1
Yang, X., and Heidelbach, F. (2012). Grain size effect on the electrical conductivity of clinopyroxene. Contrib. Mineral. Petrol. 163, 939–947. doi:10.1007/s00410-011-0707-3
Yoshino, T., Gruber, B., and Reinier, C. (2018). Effects of pressure and water on electrical conductivity of carbonate melt with implications for conductivity anomaly in continental mantle lithosphere. Phys. Earth Planet. Interiors 281, 8–16. doi:10.1016/j.pepi.2018.05.003
Yoshino, T., and Noritake, F. (2011). Unstable graphite films on grain boundaries in crustal rocks. Earth Planet. Sci. Lett. 306, 186–192. doi:10.1016/j.epsl.2011.04.003
Yui, S. (1966). Decomposition of siderite to magnetite at lower oxygen fugacities: A thermochemical interpretation and geological implications. Econ. Geol. 61, 768–776. doi:10.2113/gsecongeo.61.4.768
Keywords: electrical conductivity, siderite, decarbonation, highly conductive anomaly, slab-mantle wedge interface
Citation: Hu H, Jing C, Dai L, Yin C and Chen D (2022) Electrical conductivity of siderite and its implication for high conductivity anomaly in the slab-mantle wedge interface. Front. Earth Sci. 10:985740. doi: 10.3389/feart.2022.985740
Received: 04 July 2022; Accepted: 12 August 2022;
Published: 30 August 2022.
Edited by:
Nibir Mandal, Jadavpur University, IndiaCopyright © 2022 Hu, Jing, Dai, Yin and Chen. This is an open-access article distributed under the terms of the Creative Commons Attribution License (CC BY). The use, distribution or reproduction in other forums is permitted, provided the original author(s) and the copyright owner(s) are credited and that the original publication in this journal is cited, in accordance with accepted academic practice. No use, distribution or reproduction is permitted which does not comply with these terms.
*Correspondence: Lidong Dai, ZGFpbGlkb25nQHZpcC5neWlnLmFjLmNu