 Brijesh K. Bansal
 Anup K. Sutar
 Mithila Verma3
- 1Civil Engineering Department, Indian Institute of Technology Delhi, New Delhi, India
- 2Borehole Geophysics Research Laboratory, Ministry of Earth Sciences, Karad, India
- 3Ministry of Earth Sciences, New Delhi, India
The Mizoram state of India lies in close proximity to the active Indo-Burma subduction zone and had experienced several moderate to large earthquakes, including the M7 event in 1938. Since 2015, only two events with 5<M<6 have occurred in the area, however, a sudden enhancement of earthquake activity (M3.0–M5.7) was observed from June to August 2020 in the eastern part of the Mizoram state, including the four events of M ≥ 5.0. We analysed the waveform data of 21 events recorded by the local and regional BBS to estimate the source parameters. The focal depth of these events varies from 13 to 45 km, while other parameters such as corner frequency, source radius, stress drop, and scalar seismic moment of the events are found in the range of 0.45–3.36 Hz, 0.77–5.58 km, 1.3–193 bars, and 3.98107E+13 to 6.30957E+17 Nm, respectively. The seismicity pattern shows two distinct clusters along the well-demarcated faults in the region, and most of them are generated by strike-slip movements. The Churachandpur-Mao Fault (CMF) is found to be the most active tectonic element in the study area. Hence, an M8 event has been simulated on the same fault using the stochastic simulation technique. The technique was validated by simulating the three M+5 events on the same source zone and comparing the simulated PGA, frequency, and response spectrum with the observed data. The simulation reveals that a PGA ∼480 gals is expected near the fault zone. The easternmost districts of Mizoram, such as Champai, Serchhip, Lunglei, Saiha, and Aizawl, may experience severe PGA (250–450 gals). The response spectral acceleration corresponding to single-storey, double-storey, 3–4 storey, and 5–6 storey buildings has also been estimated in the present study and it is found to vary in the range of 1,400–200 gals. The result of the present study will be useful in various engineering applications and help reduce the loss of lives and damage to infrastructure due to future large events in the region.
Introduction
The entire northeastern part of India falls in seismic zone V of the seismic zoning map of India (BIS, 2002) and is considered to be seismically most active. The region has witnessed several large earthquakes in historical times, including the two great events in India (1950, M8.7 and 1897, M8.1) and is juxtaposed between collision and subduction tectonics (Panda et al., 2018). The relative motion between the Indian and Eurasian Plates, which is about 5 cm/yr and oriented toward ∼N20◦E in Myanmar (DeMets et al., 1994), contributes to the subduction of the Indian Plate beneath the Burma Plate along the Sunda and Andaman trenches with a highly oblique convergence. In this setting, the Burma Plate represents a fore-arc sliver that is coupled with the Indian Plate (e.g., Satyabala, 2003; Nielsen et al., 2004; Stork et al., 2008) and appears as a zipper section, where south-eastward dipping Naga thrust (NT), northward dipping Dauki fault (DF) and eastward steeply dipping Churachandpur-Mao Fault (CMF) representing three arms of the junction. The opening of the section, therefore, explained the collision of the Indian plate in the North, whereas, subduction to the East (Panda et al., 2018). The collision between the Indian and Eurasian plates is marked by the mighty Himalaya in the north, while, the subduction beneath the Burmese plate is active in the east in the Indo-Burmese subduction zone (Nandy, 2001). The Indo-Burmese subduction zone is seismically more active compared to the rest of the region.
In northeast India, Mizoram is one of the states located in the proximity of the Indo-Burmese subduction zone and has witnessed many large earthquakes in the past, including the M7 event on 16 August 1938. In addition, ∼13 events with a magnitude between 6<M<7 and 82 earthquakes having magnitude between 5<M<6 occurred in the area (Source: ISC catalogue). Though the 1938 M7 event did not cause much damage in the area due to its deeper focal depth (75 km) and the lower population at the time, a similar event today could be disastrous due to population burst and haphazard infrastructure development over the years. Further, most of the houses in the area are built with concrete and located on the foothills and hill slopes. Thus, any major event in and around the area may cause severe damage to the structures directly or due to secondary effects like earthquake-induced landslides and liquefaction. The region is still active, and several researchers have inferred that an M≥8.0 magnitude earthquake may occur in the region (Gupta and Singh, 1989a; Sahu and Saikia, 1994; Betka et al., 2018; Vorobieva et al., 2021). Although active subduction between the Indian and Burmese plates is occurring in the area, several studies indicate that the region may not be suitable for megathrust events such as the Sumatra 2004 earthquake (Mw9.1). This may be due to thrusting combined with remnant subduction as well as the juxtaposition and dominance of different strike-slip/thrusting tectonic units in the area (Srivastava et al., 2013). Further, Kundu and Gahalaut (2012) argued that the majority of earthquakes in the region occur at a depth range of 30–60 km and the seismicity trend coincides with the Indian slab. Although the subducting slab can be traced up to a depth of 660 km, the focal mechanism of the earthquakes in the area suggests that these earthquakes occurred within the Indian plate. The state of stress also does not support active subduction. The lack of evidence of great earthquakes in the historical records and the non-seismogenic nature of the plate interface under the accretionary wedge suggests that seismic hazard due to plate boundary may be relatively low. However, major intra-slab earthquakes at shallow (∼15 km) and intermediate (∼45 km) depths may still cause damage in the sediment-filled valley regions.
The active subduction at the IBR is also a debatable question; many researchers have proposed that active subduction is highly partitioned between the frontal fold-thrust belt and dextral strike-slip faults in the internal part of the IBR (Satyabala, 1998; Nielsen et al., 2004; Steckler et al., 2016), whereas, other researchers argues that the IBR is undergoing purely dextral strike-slip deformation with no active subduction (Rao and Kumar, 1999; Kundu and Gahalaut, 2012b).
Long-term and high-quality data on earthquake location and magnitude are critical for understanding seismic tectonics and seismic hazard. However, in the difficult terrain and in their geopolitical location (border region), monitoring of earthquakes through a dense network with adequate coverage across the known geological structures (faults/lineaments) is a challenging task. In absence of such data, we have to depend on alternate approach, like ground motion simulation. At the same time, exchange of data with neighbouring nations through a collaborative approach would highly useful. The study region, which is bounded between 92o–93.5oE longitude and 22o–24.6o N latitude, has witnessed a spurt of moderate earthquake activity (3<M<6) during June-August 2020. The recorded events gave a unique opportunity to study the seismotectonics of the region and gain insight into the active tectonics surrounding the study area, as well as to have a fresh look at the seismic hazard scenario of the region. We assess the hazard in terms of PGA due to a postulated M8 event using the stochastic simulation technique. The effect of the ground shaking on the built environment in the study area is also estimated to help in design and construction.
Geology and tectonics of the study area
The study area lies in the proximity of the Indo-Burmese Wedge (IBW), which consists of the Arakan Yoma Mountain Belt, Chin Hills, Naga Hills, the Myanmar Central Basin (MCB), and the eastern highlands of the Shan Plateau (Figure 1A). Being in the close vicinity of the Indo-Burmese arc (IBA), the Mizoram State is highly vulnerable to earthquakes. The IBA consists of IBW in forearc and Sagaing fault (SF) in back-arc (Panda and Kundu, 2022). Geologically, the Mizoram State lies in the Surma basin, which was developed due to the mutual collision between the Indian and Burmese plates during the Late Oligocene (Maurin and Rangin, 2009). The lithostratigraphic succession of the Surma Basin is divided into the Oligocene Barail Group, the Miocene Surma Group, and the Tipam Group. The 7 km thick column of sedimentary rocks of the Surma Group is divided into the lower Bhuban Formation and the upper Bokabil Formation, which is the best developed lithounit of the Surma Basin, attaining a thickness of more than 5 km (Figure 1B). The Bhuban Formation is further subdivided into the Lower, Middle, and Upper Bhuban Units with conformable contacts (Bharali et al., 2017 and references therein).
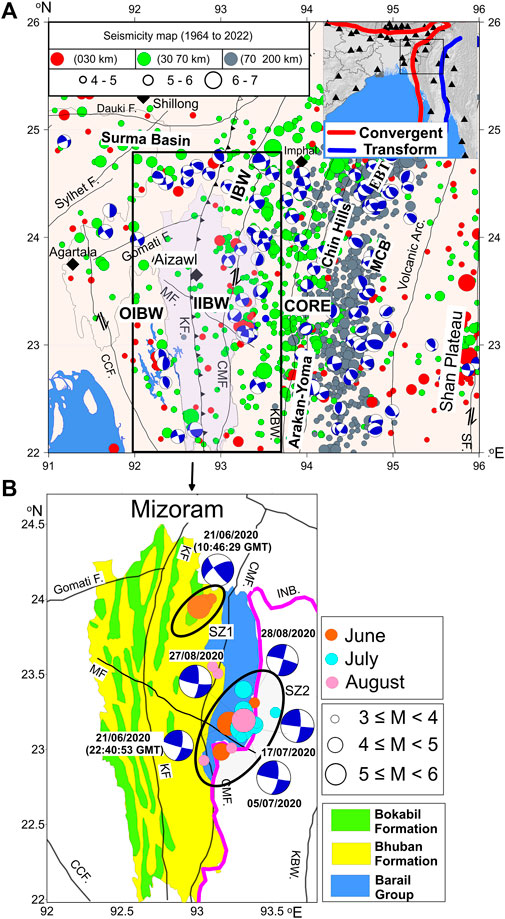
FIGURE 1. (A) Tectonic map of Mizoram and its surrounding areas; seismicity data for the period 1964–2022 are collected from www.isc.ac.uk and overlapped over the tectonic map. The seismicity data is plotted based on increasing magnitude and depth, the labels used for representing magnitude and depth are given in the legend section, which is placed in the upper left corner of the Figure 1A. Fault plane solutions of some selected events are also overlapped over the map (source: www.globalcmt.org). Abbreviations used are T, Thrust; F, fault, CCF, Chittagong Coastal Fault; CMF, Churachandpur-Mao Fault; KF, Kaladan Fault; EBT, Eastern Boundary Thrust; SF, Sagaing fault, KBW, Kabaw Fault and MF, Mat Fault. Important cities are presented with black diamonds and Mizoram state is highlighted with light blue colour and shown inside the black box. (B) The geology of Mizoram state is provided in Figure 1B. Events that occurred from June to August 2020 are plotted over the map and labelled. Fault plane solutions of some of the events are also shown by beach ball representation (source: www.globalcmt.org). Important tectonic elements cutting across the State are also shown and labelled. The big and small ellipse represents clusters SZ1 and SZ2 respectively.
The Surma basin was evolved with the deposition of Barail sediments, which are considered as a base for the deposition of the Miocene Surma Group. These sediments were thrusted over the Surma Group of rocks along the Indo-Burmese arc. Along the western margin, the molasse facies known as the Tipam Group was deposited. The lithology of the Surma group consists of alternate sequences of transgressive-regressive facies dominantly comprised of sandstone, siltstone, and shale in various proportions (Dasgupta, 1984). The sediments in the Surma basin were primarily derived from the felsic provenance of surrounding orogens, viz. Himalayan ranges in the north, Shillong plateau in the northwestern corner, Naga hills in the northeastern corner, and Indo-Burmese ranges (IBR) along the eastern side, and deposited under the influence of a fluvio-deltaic environment (Nandy, 2001). The sediments were moderately weathered under semi-humid to humid climatic conditions before they were deposited into the Surma basin. Figure 1B depicts the details of the geological formations of Mizoram (Dasguupta 1984; Bharali et al., 2017).
Tectonically, the region is intersected by a number of parallel to sub-parallel transverse faults and thrusts like the Chittagong Coastal Fault (CCF), Churachandpur-Mao Fault (CMF), Kaladan Fault (KF), Eastern Boundary Thrust (EBT)/Kabaw Fault (KBF), Sagaing Fault (SF), Gomati Fault (GF), Mat Fault (MF), Disang Thrust (DT), and Naga Thrust (NT), and several other lineaments, trending NE-SW, ENE-WSW, and NW-SE directions and associated with anticlinal-synclinal structures in the Mizoram Fold Belts (Chen and Molnar, 1990; Kayal, 2008; Maurin and Rangin, 2009). Among these, the most prominent transverse fault, trending in a NW-SE direction, is known as the Mat Fault (MF) (Betka et al., 2018). It is a right-lateral strike-slip fault that runs across the Surma Basin and Mizo Fold Belts. It obliquely cuts across the general north–south trend of the Indo-Burmese arc and is traceable across the entire Mizoram State. The Mat River crosses the Mat fault and follows it for a considerable distance (Figure 1A). Recent studies suggest that the Mat fault extends up to a shallow depth of 4 km and shows little movement or slip (Tiwari et al., 2015). In the past 50 years, no earthquake of M>4.5 has occurred on the MF and no earthquake of M>5.5 has occurred within 100 km of the fault (Sailo et al., 2011). Even the KF, which passes through the western part of Mizoram does not contribute to the seismicity of the area (Betka et al., 2018). The dextral displacement of the KF formed within the two right-lateral faults (KF and CCF), shows the development of shears such as the Riedel Shear by the faster movement of the Indian Plate subduction below the Burmese plate (Khin et al., 2020).
The Indo-Myanmar subduction zone is divided into three sub-sections; 1) Outer Indo-Burmese Wedge (OIBW), 2) Inner Indo-Burmese Wedge (IIBW), and 3) Core (CORE), each separated by faults (Maurin and Rangin, 2009). The OIBW lies between KF and CMF and is tectonically complex due to the eastward underthrusting of the Indian plate beneath the Burmese microplate. However, it is seismically less active compared to the IIBW and the core part of the subduction zone (Maurin and Rangin, 2009; Kundu and Gahalaut, 2012). The CMF is most likely an over-steepened Neogene thrust (Uddin and Lundberg, 1998), which was thought to be reactivated as a dextral strike-slip fault (Gahalaut et al., 2013; Wang et al., 2014). It can be mapped at the surface near the Imphal Valley (Figure 1), and the fault is hypothesized to accommodate a significant amount of dextral shear (∼18 mm/year) resulting from the India-Burma plate motion (Gahalaut et al., 2013; Wang et al., 2014).
The core unit of the Indo-Burmese Wedge, with a width of about 50 km, is jawed between the west-dipping thrust type KBF and the right-lateral strike-slip CMF, which is highly active and causes intense seismic activity in the region (Figure 1A). The contribution of the KBF to the strain budget of the India-Burma-Sunda system is uncertain due to the absence of clear geomorphic indicators (Wang et al., 2014). The south verging Naga Thrust and Disang Thrust separates the eastern part of the Brahmaputra Valley from the extensive west propagating IBW. Due to such tectonic settings, earthquakes are not uncommon in this region. Past seismicity in the Mizo-Fold Belt region shows that the region experienced moderate-sized earthquakes (Mw 5.0–5.5). However, Zaman and Monira (2017) argued that faults in Mizoram are capable of producing an Mw 7.0 earthquake. Further, in the Mizo-fold belt, the intra-plate region OIBW experienced earthquakes, mostly within 50 km of depth, whereas in the IIBW, the earthquakes are deeper (50–75 km) and in the Core part, east to KBF, seismicity is observed up to a depth of 100 km (Ni et al., 1989; Satyabala, 2003; Kayal et al., 2006; Gahalaut et al., 2013).
Data source and methodology
We use data records from 28 local and regional stations of the National seismological Network in India (Bansal et al., 2021) and a few stations from the neighbouring countries, namely, Myanmar and Bhutan (Table 1) for location and source parameter estimation of the earthquake events that occurred during June-August 2020 in Mizoram area. The estimated parameters have been used for computing the strong ground motion using the stochastic simulation (SS) technique. The spectral acceleration for different storied buildings has been estimated using the Duhamel integral technique (Chopra, 2015). A brief description of the methodology used in this study is provided below.
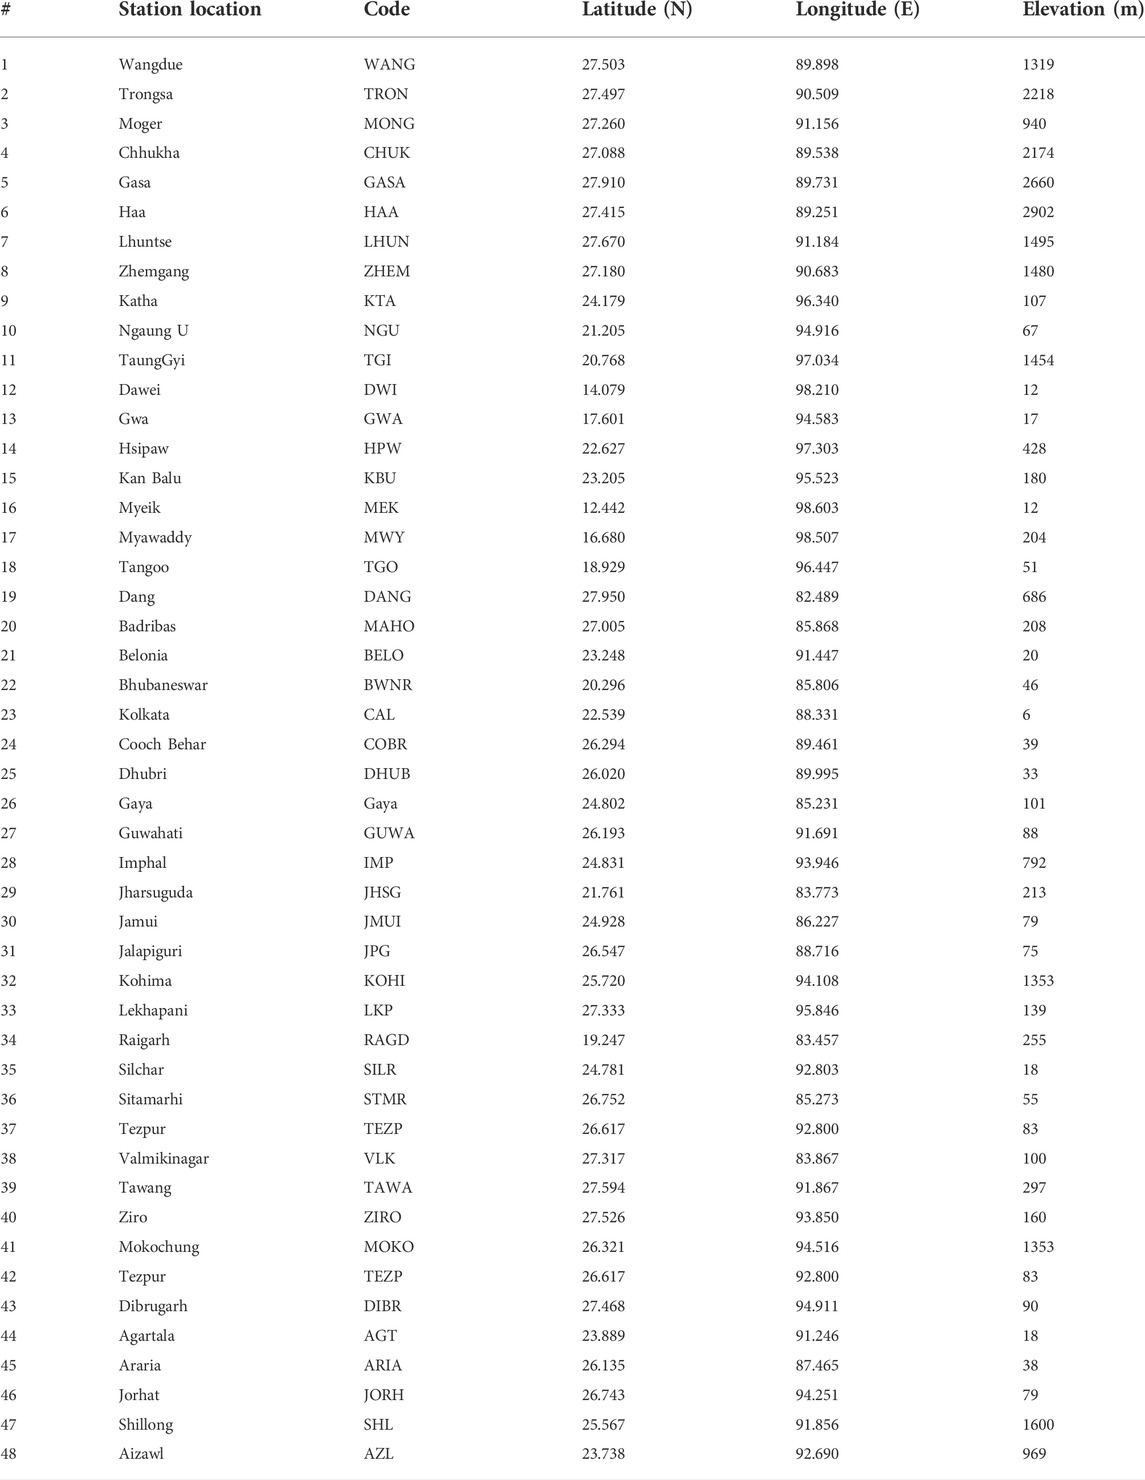
TABLE 1. Details of the location of seismic stations used in the present study.
Earthquake location and source parameters
The earthquakes are located using the Seisan software package (Ottemoller et al., 2021). The algorithm is based on minimizing the RMS value between observed and theoretical travel time differences. As the stations are distributed (Table 1) on a regional scale, the global ISPEI91 (Kennett and Engdahl, 1991) velocity model has been used for computation of the theoretical travel times. The location is finalized when the RMS of observed and calculated travel time is reduced below 0.5 s and as the error associated with latitude, longitude, and depth is below 5–7 km range.
Source parameters of the events, such as stress drop, corner frequency, source radius, and scaler seismic moment, have been estimated by the spectral analysis method, following Brune’s circular model (Brune, 1976). The attenuation parameters viz, Q and
Ground motion simulation by stochastic method
In the stochastic finite fault modelling technique, the large fault is divided into N sub-faults, where each sub-fault is considered as a small point source (Beresnev and Atkinson, 1997; Beresnev et al., 1998) and the ground motion is simulated using the stochastic point source method (Boore, 2003). The Fourier amplitude spectrum observed at the site can be modelled as contributions from the source, path, and site effect, which can be modelled as
where,
where
where
As the rupture originates from the hypocentre, it triggers the nearby sub faults to rupture. Thus, the rupture spread radially and the total ground motion at the observed site can be modelled by summing the contribution of each sub fault with a proper time delay (Motazedian and Atkinson, 2005).
Where,
We use EXSIM code developed by Motazedian and Atkinson (2005) to simulate the strong ground motion. Prior to simulation of the target event, the code is validated by simulating recorded earthquakes and comparing the observed PGA, frequency and response spectrum with the simulated results.
Estimation of spectral acceleration
During an earthquake, the base of a building swings back and forth as it moves with the ground motion, and the influence of an earthquake on a structure is represented by the response spectrum. The earthquake ground motion response spectrum represents an envelope of the peak responses of many single-degree-of-freedom (SDOF) systems with different periods. The acceleration response spectrum of a ground motion is a relationship between the natural period of vibration of the SDOF system and the maximum absolute acceleration that it experiences under the ground motion. The response of the system to an applied force, p(t), at time t is given by adding the responses to all impulses up to that time using Duhamel’s integral technique (Chopra 2015). In this exercise, we have used the code developed by (Viens and Denolle, 2019) to compute the acceleration response spectrum for different selected periods corresponding to single and multi-storey buildings.
Data analysis and results
We analyse data of 21 well recorded events that occurred during June-August 2020 in Mizoram region during the period. (Table 1; Figure 1). Details of the earthquake location and source parameters of the events are provided in Table 2. These events have magnitude between Mw3.0–5.7 and focal depths of 13–45 km (Figures 2A,B). Out of the 21 events, four events have magnitude M ≥ 5 (Table 2); we selected three events for ground motion simulation to constrain the parameters for the target simulation. The analysis makes use of the estimated source parameters and the available attenuation parameters of the region for strong ground motion simulation. Fault plane solutions of the events were taken from www.gcmt.org and tabulated in Table 3.
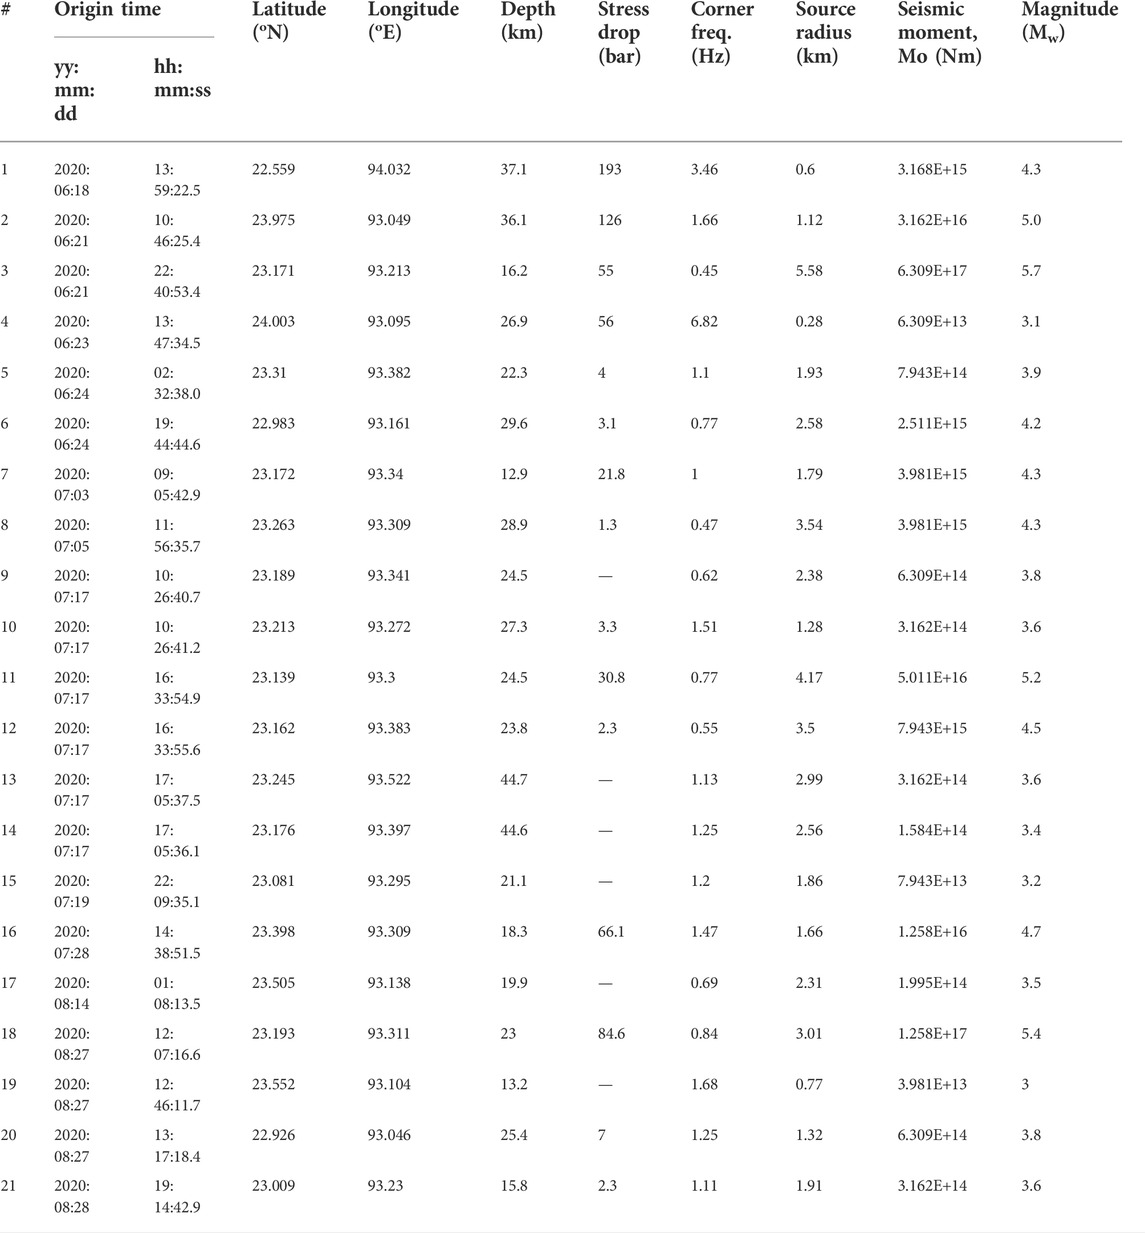
TABLE 2. Estimated source parameters of the events used in the present study.
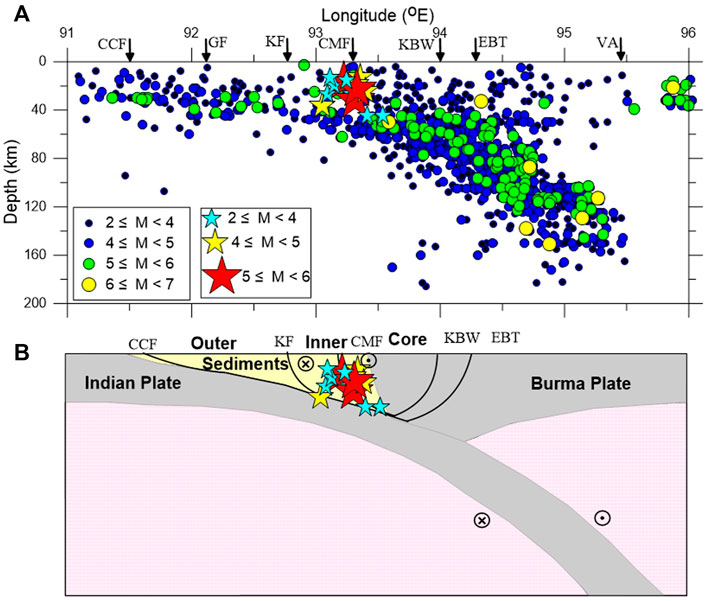
FIGURE 2. (A) Depth distribution of events along a profile coinciding with 23o Latitude is shown in the figure. The events surrounding the profiles are collected and plotted with different magnitude scales and labelled. The events that occurred during June—August 2020 are also overlapped over the map and are shown by star symbols. Important tectonic elements crossing the profiles are projected over the map and are also labelled. The labels used in the figure are followed from Figure 1. (B) A tectonic model of the region is shown and overlapped by events that occurred from June to August 2020 in the study area.
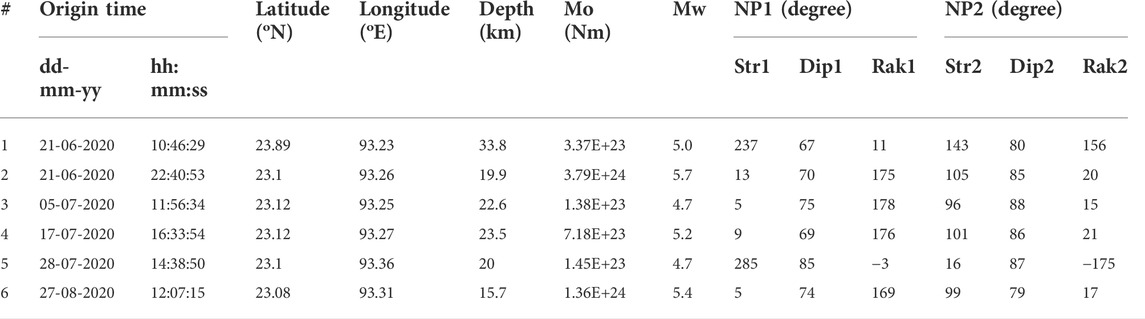
TABLE 3. Fault plane solution of selected events (Source: www.gcmt.org).
The stochastic simulation technique requires source parameters, such as fault dimension, magnitude, latitude, longitude, depth, strike, and dip of the fault; medium parameters, such as density, shear wave velocity, attenuation parameters (e.g., Q and k) and site parameters such as amplification/de-amplification etc., at the site of stimulation. For validation and parameter optimization, three events with M>5 were selected and ground motion simulation has been performed. The simulated results were then compared with the observed ground acceleration waveforms at the sites where the observed events were recorded. The simulation parameters are listed in Table 4. The fault dimensions were computed using the Wells and Coppersmith, (1994) formula. The location and depth of the fault were considered following the earthquake location (Table 2), and the rupture initiation point, as well as rupture model, is assumed to be random in this case. Many iterations (trails) were performed and only the best-matched results that approached closer to the observed results were accepted. The attenuation parameters and the site amplification parameters were taken from (Sutar et al., 2020) and (Kanth and Dash, 2010), respectively. The simulated PGA for M>5 events are shown in Figures 3A–C, and the comparison between observed and simulated results are shown in Figures 3D–F. It can be seen that the simulated results from all three simulations are in general agreement with observed PGA records. It may be noted that the simulated PGA smoothly decays with increasing distance (Figure 3), while, the observed PGA does not. This may be happened be due to the fact that the simulated PGA is based on the assumption of uniform site amplification at all the sites, which may not be the case in actual field conditions. We have also estimated the correlation coefficient between the observed and simulated PGA and found the correlation coefficient >0.5 in all three simulations. Similarly, the frequency and response spectra of the simulated accelerograms were compared with the observed data and the results were found to be consistent. An example of the spectral matching for the June 21 (M5.7) event is shown in Figure 4 for the three stations, located closer to the epicentre of the event. The observed and simulated spectra are plotted for July 17 (M5.2) and Aug. 27 (M5.4) events are shown in the Supplementary Figures S1,S2), which also show good matching. In all three simulations, attenuation and site parameters were kept common, except for the source properties of the events (Table 4). Taking advantage of these results, similar criteria was applied to simulate the target M8 event. The source depth of the target event was assumed to be ∼20 km based on the seismicity pattern of the region (Figure 2). Details of the parameters used in the simulation are provided in Table 4, and the simulated PGA is plotted in Figure 5A. The simulation results show that a PGA of 480 gals may occur near the fault zone. The easternmost districts of Mizoram, which lie within an epicentral distance <100 km, may experience PGA ranging between 240 and 480 gals, and the area may experience severe ground shaking. Cities in Mizoram state that lie at a distance of >100 km from the epicentre will experience ground acceleration <200 gals. The simulated PGA is compared with the available attenuation relations of the region (Figure 5B).
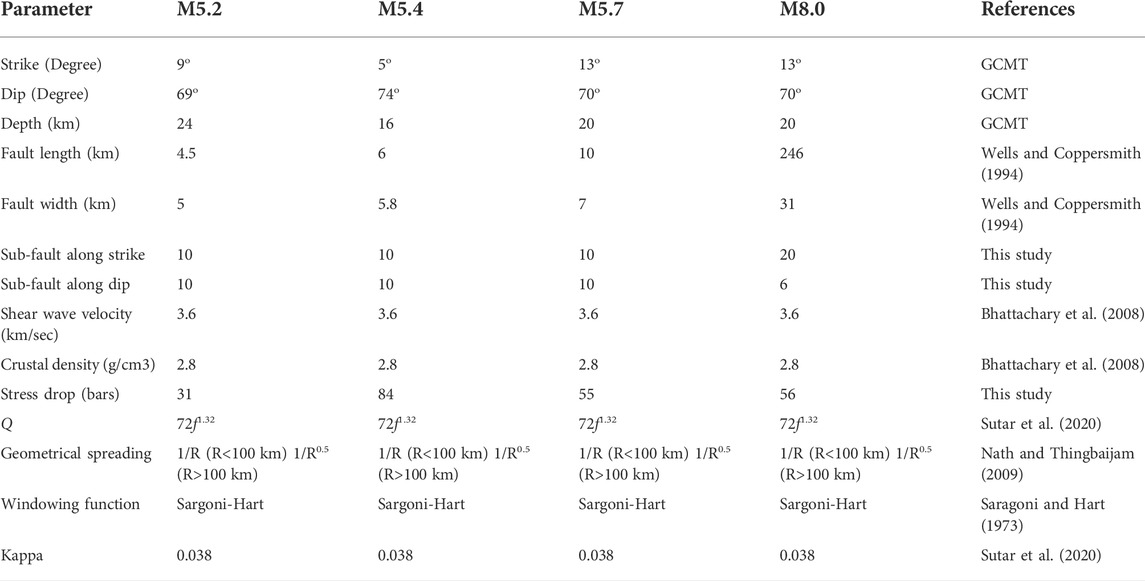
TABLE 4. The input parameters used for ground motion simulation using Stochastic Simulation technique.
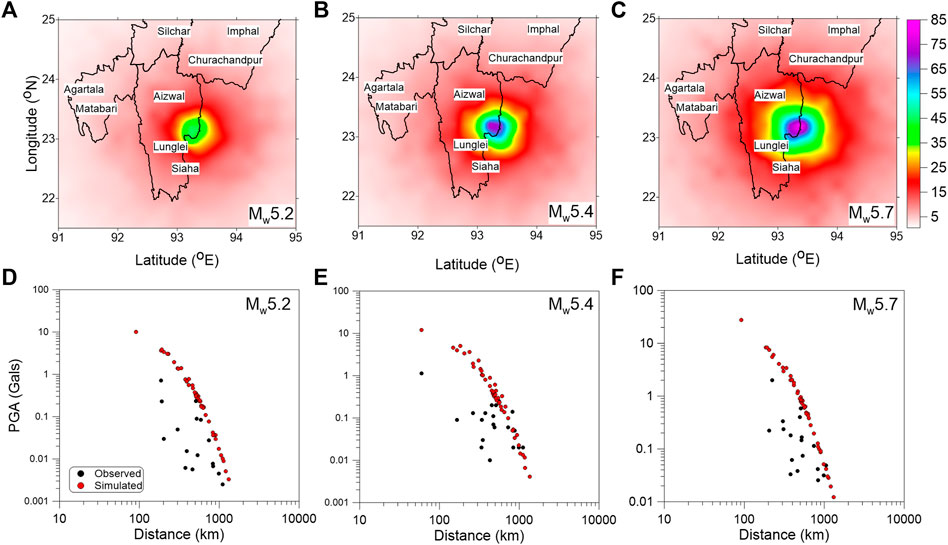
FIGURE 3. PGA distribution of simulated (A) Mw5.2, (B) Mw5.4, (C) Mw5.7 events are shown in the figure. The coloured scale of the simulated PGA is given on the right side of the figure. Comparisons between observed and simulated PGA are plotted for (D) Mw5.2, (E) Mw5.4, (F) Mw5.7 events.
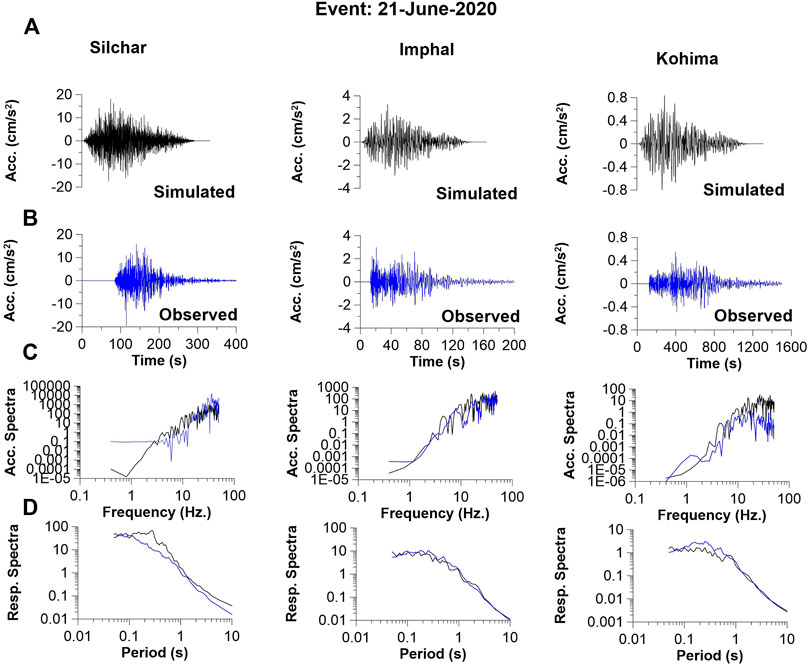
FIGURE 4. Comparative plot between (A) simulated (black lines) and (B) observed (blue lines) acceleration waveform records. (C) acceleration spectra and (D) response spectra for simulated (black lines) and observed (blue lines) ground motion records at three stations, namely Silchar, Imphal and Kohima of the 21 June 2020 (M5.7) event.
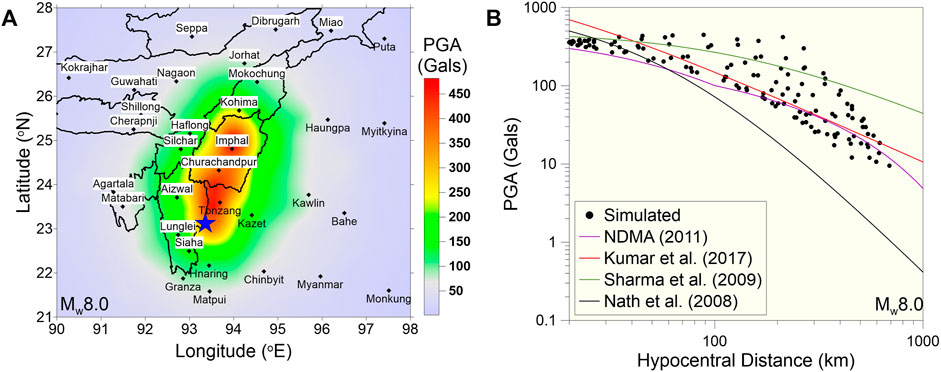
FIGURE 5. The plot displays (A) PGA distribution for a future great magnitude event (M8.0) in the study area (B) a comparative plot between simulated PGA with different attenuation relations developed for the region.
The spectral acceleration (Sa) for different periods has also been estimated from the corresponding response spectra obtained from the simulated accelerograms of the target event (M8). Different periods were selected to estimate the spectral acceleration corresponding to single-storey buildings (T = 0.1 s), double-storey buildings (T = 0.2 s), 3–4 storey buildings (T = 0.5 s), and 5-6 storey buildings (T = 0.8 s). The natural period (Tn) of a building is the time taken by it to undergo one complete cycle of oscillation. This is an inherent property of a building, which is controlled by its mass (m) and stiffness (k), which can be given by the following relation,
Thus, buildings with a larger mass and with low stiffness have a longer natural period than light and stiff buildings. Resonance will occur in a building only if the frequency at which the ground shakes is steady or near the natural frequency of the building. The earthquake ground motion contains a group of frequencies that are continuously changing at each instant of time and thus the response of the building depends on the frequency content of the ground motion. Depending on the natural period of the building and ground motion received, the building will experience different PGA for different storeyed buildings. A single-story building near the epicentral area may experience acceleration ranging from 700 to 1,400 gals, while double, 3-4-story, and 5-6-story buildings may experience acceleration ranging from 700 to 1,100 gals, 300–600 gals, and 150–300 gals, respectively. The spectral acceleration for the corresponding periods is contoured and plotted in Figure 6.
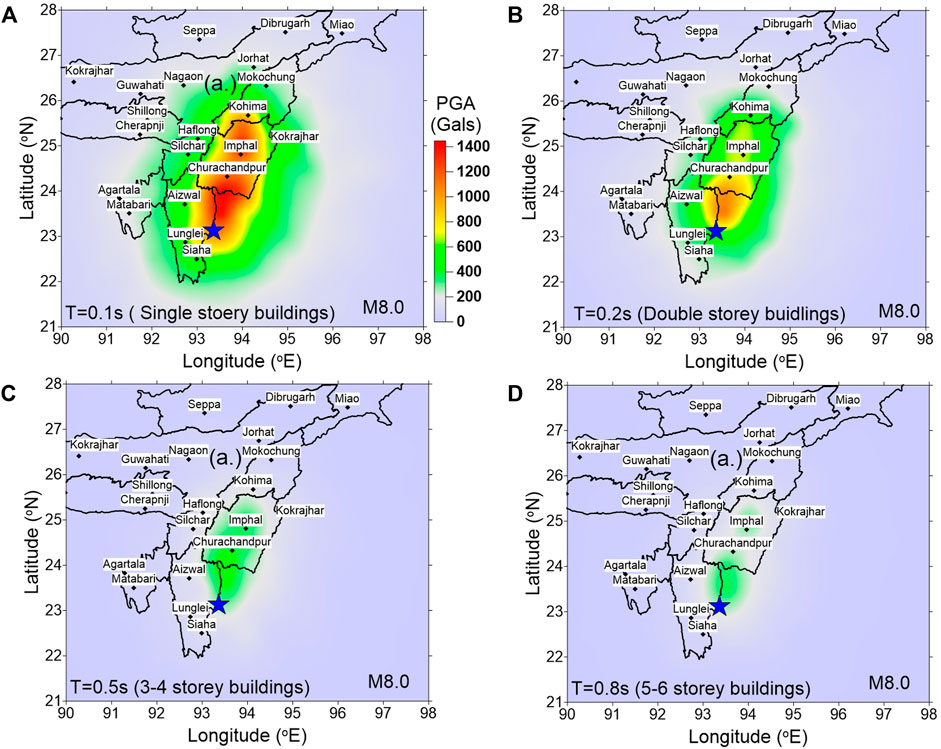
FIGURE 6. Contour plot for the simulated spectral acceleration for (A) single storey (T=0.1 s), (B) double storey (T=0.2 s), (C) 3-4 storey, and (D) 5-6 storey buildings are shown on the map.
Discussion
The earthquakes that occurred in the Mizoram area from June to August 2020 are located in two distinct clusters (SZ1 and SZ2 of Figure 1B); SZ1 lies between KF and CMF, whereas SZ2 lies between CMF and KBW. Events that occurred in June 2020 are located in both the clusters (SZ1 and SZ2), while the events that occurred in July - August 2020 strictly fall in SZ2. Most of the events, which occurred in both the clusters, show a strike-slip faulting mechanism (Figure 1B). The dominant fault mechanism in cluster SZ1 has nodal planes, NP1 with strike 237o (SW-NE direction), dip 67o, rake 11o and NP2 with strike 143o (NW-SE direction), dip 80o and rake 156o. Similarly, most of the events that occurred in SZ2 also have a strike-slip faulting mechanism, with NP1 striking between 5–13o (NNE-SSW direction), dipping between 75–85o and having a rake of 169-178o. Most of the events in this zone are located at a depth of 13–45 km (Figure 2). The earthquake sequence started with the occurrence of the M5.0 event on 21 June 2020 at 10 h:46 m:29s at SZ1 and a few hours later on 21 June 2020 (at 22 h:50 m:53s), the M5.7 event occurred at SZ2, which is the largest event that occurred in this period (June-August) in the study area (Figure 1B). Most of the events that occurred in the source zone (SZ2) follow the same FPS as of the M5.7 earthquake, suggesting that the other events may be the aftershocks of the M5.7 event. However, the M5.0 event of 21 June 2020 may not be considered as the foreshock of the M5.7 as the event occurred at a different source location (SZ1). The events, which occurred in June in SZ1 lie between KF and CMF, whereas events that occurred in SZ2 are locked within CMF and KBF (Figure 2). Correlating the FPS of observed earthquakes in SZ2, it is inferred that CMF might be the causative source and the events might have resulted due to movement along CMF (Figure 2B). It can also be seen that the events in SZ2 are located in the tail part of MF, but Tiwari et al. (2015) reported that the fault extends up to a shallow depth of 4 km and the events in SZ2 in this analysis are found much deeper, thus MF could not be considered as the source fault of the events (Figure 2). Further, the aftershocks recorded after the Mw5.7 event in SZ2 are aligned along the NNE-SSW direction (Figure 1B), correlating the strike direction of CMF, which also shows that it may be the causative source for the sequence of earthquakes that occurred in SZ2. The CMF is an active fault in the IBW and the events might be generated due to the dextral-slip motion of the wedge along the Indo–Burma arc (Figure 2A). Similarly, by correlating the FPS of the events in SZ1, KF was inferred as the causative source for the event (Figure 2). Further, the stress transfer due to KF might have activated the CMF and the events in SZ2 have occurred after the occurrence of the event in KF. Most of the events in both source zones show dextral strike-slip motion, and such right-lateral movement is also reported by GPS studies (Gahalaut and Kundu, 2012; Gahalaut et al., 2013; Panda et al., 2018; Mallick et al., 2019) between the India and Sunda plates. They have reported that the relative motion between India and Sunda plates is ∼36 mm/yr and ∼20 mm/yr of slip is accommodated along the Sagaing fault. The remaining motion might be accommodated between India and Sunda plates (Hazarika and Kayal, 2022). Mallick et al. (2019) argued that the India and Burma plates are fully coupled up to a depth of ∼30 km and the active convergence across the IBR is going on at a rate of ∼12–24 mm/year. The estimated dextral shear of ∼8 mm/year across the IBW, distributed between the CMF and/or other unresolved upper plate structures. However, recent GPS studies indicate that the India-Sunda long-term relative plate motion (∼37 mm/year) is distributed across the major active fault systems, namely, the Sagaing Fault (SF) (∼18 mm/year), Churachandpur-Mao Fault (CMF) (∼17 mm/year), and the Blind megathrust (∼7 mm/year), from east to west across the IBA respectively (Panda and Kundu, 2022). Several researchers suggest that Fold-belt-normal convergence of ∼13–17 mm/yr is absorbed by the frontal part of the IBR and has been modelled as elastic loading of the accretionary prism along a locked, east-dipping megathrust with the possibility of an Mw≥8.0 earthquakes (Wang et al., 2014; Steckler et al., 2016; Betka et al., 2018).
Vorobieva et al. (2021) very recently, using the Block-and-Fault Dynamics model, showed that the India-Burma megathrust is locked and can generate an M8+ event in the area. Similarly, Hazarika and Kayal, (2022), postulated that the IBW is accommodating a part of the plate movement by strike-slip motion along the plate boundary causing shallower earthquakes in Mizoram and suggested that this could be a precursor for an impending large earthquake in the magnitude range Mw∼7.0 in the IBW, which is not unusual in the subduction zone as observed in the past (Gupta and Singh, 1989).
Vorobieva et al. (2021) further inferred that aseismic slip in the CMF significantly reduces the seismic hazard of great interplate earthquakes in the region and CMF almost does not contribute to regional shortening. Therefore, it does not affect seismicity in the region, it is sliding rather than locked. However, the recent earthquake activity has occurred close to the CMF (Figure 1). It is thus apparent that the regional tectonics in the study area is very complex and the fault dynamics has not yet been fully understood. Several studies concluded that an M>9 megathrust event is unlikely to occur in the region based on historical evidence, but an M8.0 event cannot be ruled out (Gupta and Singh, 1989; Wang et al., 2014). The occurrence of such an event will cause severe damage in the region as most of the buildings in the region are located in the foothills or on the slopes of the mountains (Figure 7). Also, the earthquake-triggered landslides, liquefaction, mudflow etc. may further add to devastation. To address the hazard associated with such a future event in the area, the ground motion has been simulated for a potential M8.0 event in the surrounding region.
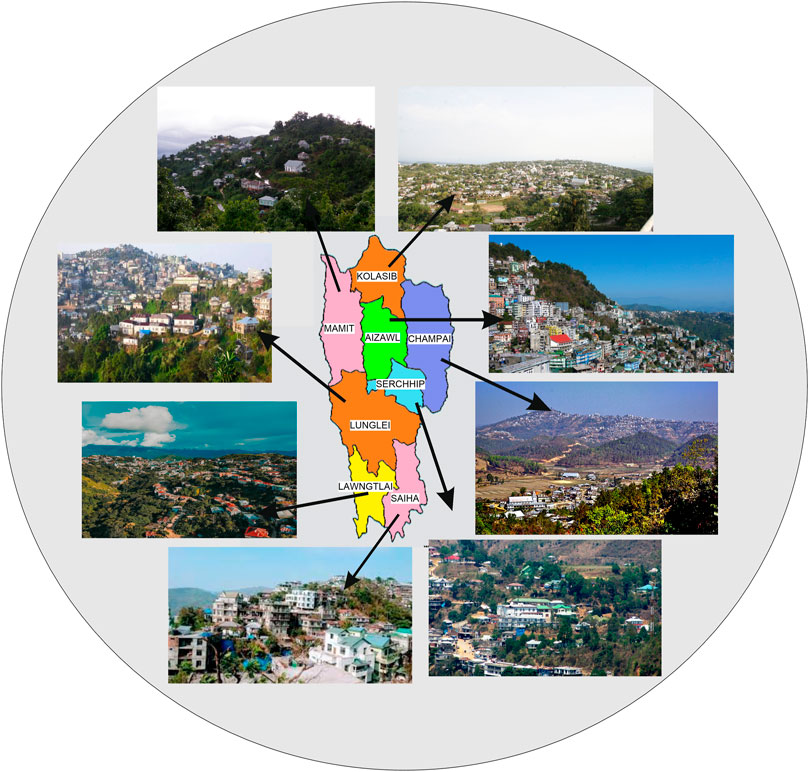
FIGURE 7. Map showing the synoptic view of builtenvironment in divergent geological conditions in different districts of Mizoram state.
The stochastic simulation technique was validated with the observed event and compared the simulated PGA, frequency, and response spectrum with observed records (Figures 3, 4). The simulated results for the target simulation are compared with the selected ground motion attenuation relations of the region and it is found that the simulated results corroborate well with the attenuation relations of the area (Figure 5B). In the present exercise, the finite fault model has been considered, whereas, the attenuation relations are developed for a point source, so a little deviation between the simulated PGA and attenuation relations can be found. The simulated results for the target event show that the source area may experience a PGA of ∼480gals, and the region may witness severe ground shaking with an intensity of VIII-IX in the epicentral region (BIS, 2002). The event may also cause severe damage to the surrounding states of Mizoram (Figure 5).
The intensity of ground waves at a particular location depends on the magnitude of the earthquake, the epicentral distance and the medium through which the waves travel. Earthquakes can generate periods generally varying between 0.01 and 33 s, and buildings that experience a force due to ground acceleration can oscillate with their natural period (T), which depends on the building’s flexibility and mass. The fundamental natural period, T, of a normal single-storey to 20-storey building usually ranges between 0.05 and 2.00 s. Thus, depending on the natural period of the structures and ground motion due to earthquakes, some buildings will be shaken more than others in the same region, which could lead to the failure of the structures. Most of the buildings in the study region are one–five stories, where the expected spectral acceleration may vary from 1,200 to 200 gals, respectively, in the event of the occurrence of an M8 earthquake in the vicinity. Further, most of the buildings in the study area are constructed on slopes and foothills of the mountains (Figure 7) and are exposed to higher hazards due to earthquake-triggered landslides, mudflows, etc.
The reconnaissance traverse from Aizawl to Champhai shows the presence of repetitive succession of Neogene sedimentary rocks of the Surma Group and Tipam Formation. The litho units include mostly sandstone, siltstone, and shale (Nandy 2001). Thus, the strong ground shaking may destruct the built environment due to earthquake induced landslides on the slopes of the hills. Such shaking may also cause liquefaction where thick sedimentary layers are present with sufficient moisture content, causing severe damage to buildings built over such a site, as seen in many earthquakes in northeast India (Verma et al., 2014). Past studies show that sites located on sediments, even far away from the epicentre, may experience high ground motion amplification. Similarly, soil liquefaction due to the presence of a high saturation level may also add earthquake-related hazards to the area (Verma et al., 2014). The obvious question that arises is how to deal with such hazards in the absence of any proven predictive scientific technique. Perhaps the most effective and practical approach is to take preventive measures and create awareness amongst the masses (Bansal and Verma, 2012; Bansal and Verma, 2013; Verma and Bansal, 2013). A recent study by Bansal et al. (2022), details specific activities for mitigating the earthquake and landslide hazards in the eastern Himalayan region. A similar exercise could be useful for Mizoram state and its surroundings also. The results of this study, along with preventive measures and public education/awareness, will help in reducing the loss of lives and property due to future large events.
Conclusion
The results show that earthquake activity (M3.0–5.7) occurred in the eastern part of Mizoram state, India from June to August 2020 was concentrated within a focal depth of 13–45 km. The events were found to be clustered in two distinct zones and were generated due to strike-slip motion along the Churachandpur Mao Fault and Kaladan Fault. The source parameters of the events, i.e., the corner frequency, source radius, stress drop, and scalar seismic moment, are found to vary between 0.45–3.36 Hz, 0.77–5.58 km, 1.3–193 bars, and 3.98107E+13 to 6.30957E+17 Nm, respectively. The results corroborate well with the earlier studies carried out on the Indo-Burmese subduction zone. The analysis of three M5+ events has provided an opportunity to validate the stochastic simulation technique, used for simulating a target M8 event in the area. The location of the target event is selected based on the present seismicity in the area and its simulation illustrates that the source zone may experience a PGA of ∼480 gals and most of the districts in the state might experience a PGA of between 100 and 450 gals. The intensity may vary from VI to VIII and, the infrastructure from single-story and five-to six-story buildings may be expected to have spectral accelerations of 700–1,400 gals and 150–300 gals, respectively. The results of the study will be useful for retrofitting of the existing buildings, the design of new structures, and land use planning.
Data availability statement
The earthquake data are available from National Centre for Seismology and could be requested through the website (https://seismo.gov.in/).
Author contributions
BB: Conceptualization, data collection, review and editing of the MS AS: Data processing, figure and Table preparation, MS draft preparation MV: Prepared geology and tectonics of the MS, correlation to results obtained with Geology/tectonics and review.
Acknowledgments
The authors acknowledge the heads of their respective institutes for their support and encouragement. The work was initiated when the corresponding author was working at the Ministry of Earth Sciences. Data shared by the National Centre for Seismology and the Indian National Centre for Ocean Information Services are duly acknowledged. The online data from www.globalcmt.org and www.isc.ac.uk are found useful in completing the work. Mr. Himanshu Chaube helped in preparing the tables. The authors also thank two reviewers for their constructive comments, which helped in improving the MS.
Conflict of interest
The authors declare that the research was conducted in the absence of any commercial or financial relationships that could be construed as a potential conflict of interest.
Publisher’s note
All claims expressed in this article are solely those of the authors and do not necessarily represent those of their affiliated organizations, or those of the publisher, the editors and the reviewers. Any product that may be evaluated in this article, or claim that may be made by its manufacturer, is not guaranteed or endorsed by the publisher.
Supplementary material
The Supplementary Material for this article can be found online at: https://www.frontiersin.org/articles/10.3389/feart.2022.985394/full#supplementary-material
SUPPLEMENTARY FIGURE S1Comparative plot between (A) simulated (black lines) and (B) observed (blue lines) acceleration waveform records. (C) acceleration spectra and (D) response spectra for simulated (black lines) and observed (blue lines) ground motion records at three stations, namely Silchar, Imphal and Kohima of the 17th July 2020 (M5.2) event.
SUPPLEMENTARY FIGURE S2Comparative plot between (A) simulated (black lines) and (B) observed (blue lines) acceleration waveform records. (C) acceleration spectra and (D) response spectra for simulated (black lines) and observed (blue lines) ground motion records at three stations, namely Silchar, Imphal and Kohima of the 28th August 2020 (M5.4) event.
References
Bansal, B. K., Pandey, A. P., Singh, A. P., Suresh, G., Singh, R. K., and Gautam, J. L. (2021). National seismological network in India for real-time earthquake monitoring. Seismol. Res. Lett. 92, 2255–2269. doi:10.1785/0220200327
Bansal, B. K., and Verma, M. (2012). Education and awareness: A key to earthquake risk reduction. J. Geol. Soc. India 80, 451–454. doi:10.1007/S12594-012-0164-2
Bansal, B. K., Verma, M., Gupta, A. K., and Prasath, A. R. (2022), On mitigation of geological hazards in the eastern himalayan region. Nat. Hazards.
Bansal, B. K., and Verma, M. (2013). Science and technology based earthquake risk reduction strategies: The Indian scenario. Acta geophys. 614 (61), 808–821. doi:10.2478/S11600-013-0105-5
Beresnev, I. A., Atkinson, G. M., Johnson, P. A., and Field, E. H. (1998). Stochastic finite-fault modeling of ground motions from the 1994 Northridge, California, earthquake. II. Widespread nonlinear response at soil sites. Bull. Seismol. Soc. Am. 88, 1402–1410.
Beresnev, I. A., and Atkinson, G. M. (1997). Modeling finite-fault radiation from the wn spectrum. Bull. Seismol. Soc. Am. 87, 67–84.
Betka, P. M., Seeber, L., Thomson, S. N., Steckler, M. S., Sincavage, R., and Zoramthara, C. (2018). Slip-partitioning above a shallow, weak décollement beneath the Indo-Burman accretionary prism. Earth Planet. Sci. Lett. 503, 17–28. doi:10.1016/j.epsl.2018.09.003
Bharali, B., Borgohain, P., Bezbaruah, D., Vanthangliana, V., Phukan, P. P., and Rakshit, R. (2017). A geological study on upper Bhuban Formation in parts of Surma basin, Aizawl, Mizoram. Sci. Vis. 17, 128–147. doi:10.33493/scivis.17.03.02
Bhattacharya, P. M., Mukhopadhyay, S., Majumdar, M. K. K., and Kayal, J. R. R. (2008). 3-D seismic structure of the northeast India region and its implications for local and regional tectonics. J. Asian Earth Sci. 33, 25–41. doi:10.1016/j.jseaes.2007.10.020
Boore, D. M. (2003). Simulation of ground motion using the stochastic method. Pure Appl. Geophys. 160, 635–676. doi:10.1007/PL00012553
Brune, J. N. (1976). The Physics of Earthquake Strong Motion. Dev. Geotech. Eng. 15, 141–177. doi:10.1016/B978-0-444-41494-6.50008-4
Chen, W. P., and Molnar, P. (1990). Source parameters of earthquakes and intraplate deformation beneath the Shillong Plateau and the Northern Indoburman Ranges. J. Geophys. Res. 95, 12527. doi:10.1029/jb095ib08p12527
Chopra, A. K. (2015). Dynamics of structures. Global Edition4th Edition4th Edition. Pearson Education Limited.
Dasgupta, S. (1984). Tectonic trends in Surma Basin and possible Genesis of the folded belt. Rec. Geol. Surv. India 113 (IV), 58–61.
DeMets, C., Gordan, R. G., Argus, D. F., and Stein, S. (1994). Effect of recent revisions to the geomagnetic reversal time scale on estimates of current plate motions. Geophys. Res. Lett. 21, 2191–2194. doi:10.1029/94gl02118
Gahalaut, V. K., Kundu, B., Laishram, S. S., Catherine, J., Kumar, A., Devchandra Singh, M., et al. (2013). Aseismic plate boundary in the Indo-Burmese wedge, northwest Sunda Arc. Geology 41, 235–238. doi:10.1130/G33771.1
Gahalaut, V. K., and Kundu, B. (2012). Possible influence of subducting ridges on the Himalayan arc and on the ruptures of great and major Himalayan earthquakes. Gondwana Research 21, 1080–1088. doi:10.1016/j.gr.2011.07.021
Gupta, H. K., and Singh, H. N. (1989a). Earthquake swarms precursory to moderate to great earthquakes in the northeast India region. Tectonophysics 167, 285–298. doi:10.1016/0040-1951(89)90079-6
Gupta, H. K., and Singh, H. N. (1989b). Earthquake swarms precursory to moderate to great earthquakes in the northeast India region. Tectonophysics 167, 285–298. doi:10.1016/0040-1951(89)90079-6
Hazarika, D., and Kayal, J. R. (2022). Recent felt earthquakes (Mw 5.0–5.9) in Mizoram of north-east India region: Seismotectonics and precursor appraisal. Geological Journal 57, 877–885. doi:10.1002/GJ.4290
Kayal, J. R., Arefiev, S. S., Baruah, S., Hazarika, D., Gogoi, N., Kumar, A., et al. (2006). Shillong Plateau earthquakes in northeast India region: Complex tectonic model. Curr. Sci. 91, 109–114.
Kayal, J. R. (2008). Microearthquake Seismology and seismotectonics of south asia. Dhanbad: Springer publication. Kayal, 186–192.
Kennett, B. L. N., and Engdahl, E. R. (1991). Traveltimes for global earthquake location and phase identification. Geophys. J. Int. 105, 429–465. doi:10.1111/j.1365-246x.1991.tb06724.x
Khin, K., Moe, A., and Myint, M. (2020). Geology, structure and lithostratigraphic framework of the rakhine coastal ranges in Western Myanmar: Implications for the collision of the India plate and west Myanmar Block. J. Asian Earth Sci. 196, 104332. doi:10.1016/j.jseaes.2020.104332
Kundu, B., and Gahalaut, V. K. (2012a). Earthquake occurrence processes in the Indo-Burmese wedge and Sagaing fault region. Tectonophysics 524–525, 135–146. doi:10.1016/j.tecto.2011.12.031
Kundu, B., and Gahalaut, V. K. (2012b). Earthquake occurrence processes in the Indo-Burmese wedge and Sagaing fault region. Tectonophysics 524–525, 135–146. doi:10.1016/j.tecto.2011.12.031
Mallick, R., Lindsey, E. O., Feng, L., Hubbard, J., Banerjee, P., and Hill, E. M. (2019). Active convergence of the India-Burma-Sunda plates revealed by a new continuous GPS network. J. Geophys. Res. Solid Earth 124, 3155–3171. doi:10.1029/2018JB016480
Maurin, T., and Rangin, C. (2009). Structure and kinematics of the Indo-Burmese Wedge: Recent and fast growth of the outer wedge. Tectonics 28. doi:10.1029/2008TC002276
Motazedian, D., and Atkinson, G. M. (2005). Stochastic finite-fault modeling based on a dynamic corner frequency. Bull. Seismol. Soc. Am. 95, 995–1010. doi:10.1785/0120030207
Nandy, D. R. (2001). Geodynamics of northeastern India and the adjoining region. ACB Publications Available at: http://librarysearch.nirmauni.ac.in/cgi-bin/koha/opac-detail.pl?biblionumber=46311&shelfbrowse_itemnumber=85134 [Accessed March 4, 2017].
Nath, S. K., and Thingbaijam, K. K. S. (2009). Seismic hazard assessment – a holistic microzonation approach. Nat. Hazards Earth Syst. Sci. 9, 1445–1459. doi:10.5194/nhess-9-1445-2009
Ni, J. F., Guzman-Speziale, M., Bevis, M., Holt, W. E., Wallace, T. C., and Seager, W. (1989). Accretionary tectonics of Burma and the three dimensional geometry of the Burma subduction zone. Geol. 17, 68–71. doi:10.1130/0091-7613(1989)017<0068:atobat>2.3.co;2
Nielsen, C., Chamot-Rooke, N., and Rangin, C. (2004). From partial to full strain partitioning along the Indo-Burmese hyper-oblique subduction. Mar. Geol. 209, 303–327. doi:10.1016/J.MARGEO.2004.05.001
Ottemoller, L., Voss, P. H., and Havskov, J. (2021). SEISAN earthquake SOftware for windows, solaris, linux and macosx, version 12.0. 607. Available at: http://seisan.info (Accessed June 6, 2022).
Panda, D., and Kundu, B. (2022). Geodynamic complexity of the Indo-Burmese arc region and its interaction with northeast Himalaya. Earth. Sci. Rev. 226, 103959. doi:10.1016/j.earscirev.2022.103959
Panda, D., Kundu, B., and Santosh, M. (2018). Oblique convergence and strain partitioning in the outer deformation front of NE Himalaya. Sci. Rep. 8, 10564–10. doi:10.1038/s41598-018-28774-3
Purnachandra Rao, N., and Kumar, M. R. (1999). Evidences for cessation of Indian Plate subduction in the Burmese arc region. Geophys. Res. Lett. 26, 3149–3152. doi:10.1029/1999GL005396
Raghu Kanth, S. T. G., and Dash, S. K. (2010). Deterministic seismic scenarios for north east India. J. Seismol. 14, 143–167. doi:10.1007/s10950-009-9158-y
Sahu, O. P., and Saikia, M. M. (1994). The b value before the 6th August, 1988 India-Myanmar border region earthquake—A case study. Tectonophysics 234, 349–354. doi:10.1016/0040-1951(94)90235-6
Sailo, S., Tiwari, R. P., and Baruah, S. (2011). Seismotectonics of Surma basin with special reference to sylhet and Mat faults. Geol. Soc. India Mem. 77, 185–193.
Saragoni, G. R., and Hart, G. C. (1973). Simulation of artificial earthquakes. Earthq. Eng. Struct. Dyn. 2, 249–267. doi:10.1002/eqe.4290020305
Satyabala, S. P. (2003). Oblique plate convergence in the Indo-Burma Myanmar subduction region. Pure Appl. Geophys. 160, 1611–1650. doi:10.1007/s00024-003-2378-0
Satyabala, S. P. (1998). Subduction in the Indo-Burma region: Is it still active? Geophys. Res. Lett. 25, 3189–3192. doi:10.1029/98GL02256
Srivastava, H. N., Bansal, B. K., and Verma, M. (2013). Largest earthquake in Himalaya: An appraisal. J. Geol. Soc. India 82, 15–22. doi:10.1007/s12594-013-0117-4
Steckler, M. S., Mondal, D. R., Akhter, S. H., Seeber, L., Feng, L., Gale, J., et al. (2016). Locked and loading megathrust linked to active subduction beneath the Indo-Burman Ranges. Nat. Geosci. 9, 615–618. doi:10.1038/ngeo2760
Stork, A. L., Selby, N. D., Heyburn, R., and Searle, M. P. (2008). Accurate relative earthquake hypocenters reveal structure of the burma subduction zone. Bull. Seismol. Soc. Am. 98, 2815–2827. doi:10.1785/0120080088
Sutar, A. K., Verma, M., Bansal, B. K., and Pandey, A. P. (2020). Simulation of strong ground motion for a potential Mw7.3 earthquake in Kopili fault zone, northeast India. Nat. Hazards 104, 437–457. doi:10.1007/s11069-020-04176-5
Tiwari, R. P., Gahalaut, V. K., Rao, C. U. B., Lalsawta, C., Kundu, B., and Malsawmtluanga, (2015). No evidence for shallow shear motion on the Mat Fault, a prominent strike slip fault in the Indo-Burmese wedge. J. Earth Syst. Sci. 124, 1039–1046. doi:10.1007/S12040-015-0591-8
Uddin, A., and Lundberg, N. (1998). Cenozoic history of the Himalayan-Bengal system: Sand composition in the Bengal basin, Bangladesh. Geol. Soc. Am. Bull. 110, 497–511. Available at: 10.1130/0016-7606(1998)110<0497:chothb>2.3.co;2 https://pubs.geoscienceworld.org/gsa/gsabulletin/article-abstract/110/4/497/183368/Cenozoic-history-of-the-Himalayan-Bengal-system?redirectedFrom=fulltext (Accessed August 4, 2022).
Verma, M., and Bansal, B. K. (2013). Seismic hazard assessment and mitigation in India: An overview. Int. J. Earth Sci. 102, 1203–1218. doi:10.1007/s00531-013-0882-8
Verma, M., Singh, R. J., and Bansal, B. K. (2014). Soft sediments and damage pattern: a few case studies from large Indian earthquakes vis-a-vis seismic risk evaluation. Nat. Hazards 10, 1829–1851. doi:10.1007/s11069-014-1283-4
Viens, L., and Denolle, M. A. (2019). Long‐period ground motions from past and virtual megathrust earthquakes along the nankai trough, Japan. Bull. Seismol. Soc. Am. 109, 1312–1330. doi:10.1785/0120180320
Vorobieva, I., Gorshkov, A., and Mandal, P. (2021). Modelling the seismic potential of the Indo-Burman megathrust. Sci. Rep. 11, 21200–13. doi:10.1038/s41598-021-00586-y
Wang, Y., Sieh, K., Tun, S. T., Lai, K. Y., and Myint, T. (2014). Active tectonics and earthquake potential of the Myanmar region. J. Geophys. Res. Solid Earth 119, 3767–3822. doi:10.1002/2013JB010762
Wells, D. L., and Coppersmith, K. J. (1994). New empirical relationships among magnitude, rupture length, rupture width, rupture area, and surface displacement. Bull. Seismol. Soc. Am. 84, 974–1002.
Keywords: peak ground acceleration (PGA), acceleration response spectra, stochastic simulation, hazard, source parameter, Mizoram state, India
Citation: Bansal BK, Sutar AK and Verma M (2022) The 2020 earthquake sequence and seismic hazard scenario of Mizoram state in northeast India. Front. Earth Sci. 10:985394. doi: 10.3389/feart.2022.985394
Received: 03 July 2022; Accepted: 25 August 2022;
Published: 28 September 2022.
Edited by:
Fanyu Zhang, Lanzhou University, ChinaReviewed by:
Yueren Xu, Institute of Earthquake Forecasting, China Earthquake Administration, ChinaDibyashakti Panda, University of New Mexico, United States
Copyright © 2022 Bansal, Sutar and Verma. This is an open-access article distributed under the terms of the Creative Commons Attribution License (CC BY). The use, distribution or reproduction in other forums is permitted, provided the original author(s) and the copyright owner(s) are credited and that the original publication in this journal is cited, in accordance with accepted academic practice. No use, distribution or reproduction is permitted which does not comply with these terms.
*Correspondence: Brijesh K. Bansal, YmFuc2FsLm1vZXNAZ21haWwuY29t