
95% of researchers rate our articles as excellent or good
Learn more about the work of our research integrity team to safeguard the quality of each article we publish.
Find out more
ORIGINAL RESEARCH article
Front. Earth Sci. , 22 August 2022
Sec. Solid Earth Geophysics
Volume 10 - 2022 | https://doi.org/10.3389/feart.2022.984063
This article is part of the Research Topic Water in the Earth’s Interior View all 5 articles
 Zongfa Wang1,2
 Yi Wang1,2*
Although the discoveries of hydrous ringwoodite inclusions and ice-VII inclusions in natural diamonds suggest a hydrous mantle transition zone (MTZ), water content and distribution in the MTZ remain unclear. Here combining a global P- and S-wave isotropic velocity tomography and mineral physics modeling, we image the water distribution in the MTZ. Our results indicate that the MTZ is a main water reservoir inside the Earth, and the total water content of the MTZ is about 0.64–1 seawater. The upper MTZ (410–520 km) and the lower MTZ (520–660 km) contain 0.3–0.5 wt% and 0.15–0.2 wt% water, respectively, implying water contents of the MTZ decrease with increasing depths. The most hydrous regions are mainly located near subduction zones, where the upper MTZ and the lower MTZ can contain water up to 0.5–1 wt% and 0.2–0.5 wt%, respectively, indicating water is transported into the MTZ by hydrous slabs. In addition, old subducted slabs in the western Pacific subduction zone are more hydrous than young subducted slabs in the eastern Pacific subduction zone. We also propose a water circulation model which integrates our results of the water content and distribution in the MTZ.
The presence of water in the Earth’s interior has significant effects on the melting temperature, rheological strength, phase boundary, ionic diffusion, electrical conductivity, and elasticity of mantle minerals (Karato, 1990; Hirth and Kohlstedt, 1996; Karato and Jung, 1998; Hier-Majumder et al., 2005; Frost and Dolejš, 2007; Mao et al., 2008a; Mao and Li, 2016). Understanding the water content and distribution in the Earth’s interior is essential to learning the Earth’s differentiation, mantle convection, and water circulation between the Earth’s interior and surface. Hence the topic of water content in the silicate mantle, especially in the mantle transition zone (MTZ), which is considered to be the maximum aquifer in the mantle (Inoue et al., 1995; Kohlstedt et al., 1996), has become one of the hottest topics in geophysics in the past 3 decades.
The hypothesis of a hydrous MTZ has been verified by the discoveries of hydrous ringwoodite inclusions with 1 wt% H2O (Pearson et al., 2014) and ice-VII inclusions in natural diamonds (Tschauner et al., 2018). However, these isolated observations cannot represent the water contents in the whole MTZ. Many studies have attempted to infer the water contents and distributions in the MTZ from seismological observations (Mao et al., 2008a; Meier et al., 2009; Houser, 2016; Liu et al., 2018; Chang and Ferreira, 2019; Wang et al., 2019; Wang et al., 2021), but significant discrepancies exist between their results. Several studies support a dry MTZ, such as Houser’s (2016) result based on the 410- and 660-km discontinuities and shear velocities, and Chang and Ferreira’s (2019) result based on seismic anisotropy data. However, Meier et al. (2009) proposed a partly hydrated MTZ model which shows hydrous regions far away from subduction zones based on the MTZ thickness and S wave velocity. Mineralogists suggest a hydrous MTZ based on comparing mineralogical results with global seismic velocity models (Mao et al., 2008a; Wang et al., 2019).
The above discrepancies come from both the different seismic data for the water content determination and large uncertainties from mineral physics modeling. Compared with the upper mantle, anisotropy in the MTZ is controversial (Kustowski et al., 2008; Visser et al., 2008; Panning et al., 2010; Moulik and Ekström, 2014). Hence it is difficult to get a robust water distribution in the MTZ from anisotropy information. Due to large experimental uncertainties (Thio et al., 2016), the depths of the 410- and 660-km discontinuities hardly provide a reliable water content in the MTZ. Since the trade-off between temperature effects and water effects on seismic velocities in the MTZ, only using S wave velocity like the previous studies is not recommended. Combined studies of P and S wave velocities may be more informative (Thio et al., 2016). Furthermore, the previous studies tended to assume a linear relationship between seismic velocity and water content, which is inaccurate because of the complicated phase transformations and anelastic effect of water in the MTZ.
In this study, we improve our previous mineral physics modeling method (Weidner and Wang, 1998; Wang et al., 2006b; Wang et al., 2008, 2009) to involve water effects on phase transformations and velocities and predict seismic velocities under arbitrary compositions, water contents, and temperatures. We generate a complex relationship between P and S wave velocity perturbations and anomalies in composition, water content, and temperature. Then we combine our modeling results with the global P and S wave isotropic velocity model TX2019slab (Lu et al., 2019) to infer water distribution, thermal structure, and compositions in the MTZ and track the water circulation in the Earth’s interior.
The lateral variation of P- and S-wave velocities in the mantle is dominantly caused by temperature, water content, and chemical composition anomalies. Our mineral physics modeling builds a bridge between observed velocity anomalies and these physics and chemical factors. In addition, only considering anharmonic effect in the inversion of thermal structure would introduce a large degree of partial melt and a much thicker oceanic crust than observation (Karato, 2008); hence our mineral physics modeling will consider both the anharmonic effect and anelastic effect on velocity.
We modify our previous mineral physics method (Weidner and Wang, 1998; Wang et al., 2006b; Wang et al., 2008, 2009), which does not consider water effects, to involve water effects on both phase diagrams and elastic properties of olivine polymorphs (Wang et al., 2003; Litasov et al., 2005; Wang et al., 2006a; Mao et al., 2008a; Mao et al., 2008b; Jacobsen et al., 2009; Inoue et al., 2010a; Mao et al., 2010; Mao et al., 2011; Mao et al., 2012; Zhou et al., 2022). The modified method allows us to obtain the mantle velocities at arbitrary temperatures, water contents, and bulk compositions. Then the anharmonic velocity anomalies caused by temperature, water, and composition can be determined. Our mineral physics modeling method uses phase diagrams of the CaO-MgO-Al2O3-SiO2 (CMAS) system (Gasparik, 2003) and hydrous olivine polymorphs (Litasov et al., 2005; Inoue et al., 2010a) to determine stable minerals for a certain mantle temperature, pressure, bulk composition, and water content, and cation distribution data (Weidner and Wang, 1998) to resolve their chemical compositions. Elastic properties and volume fractions of the stable minerals are calculated through the third order Birch-Murnaghan equation of state (Birch, 1978) based on the elastic database used in previous studies (Weidner and Wang, 1998; Wang et al., 2006b; Li et al., 2006; Wang et al., 2008, 2009; Li et al., 2011) and the high pressures and high temperatures experimental data of hydrous olivine polymorphs (Supplementary Table S1) (Wang et al., 2003, Wang et al., 2006a; Mao et al., 2008a; Mao et al., 2008b; Jacobsen et al., 2009; Mao et al., 2010; Mao et al., 2011; Mao et al., 2012; Zhou et al., 2022). In this study, we also involve water-iron correction parameters for elasticities of olivine polymorphs (Supplementary Table S1). After determining the elastic properties and volume fractions of the stable minerals at a certain mantle pressure, temperature, water content, and bulk composition, we use the Voigt-Reuss-Hill (VRH) average method (Hill, 1952) to calculate the velocity of the mineral assemblage. Since the water effect on seismic velocities of pyrope and orthopyroxene is subtle and even negligible (Fan et al., 2019; Hou et al., 2022), we ignore the water effect on them in our modeling. The water effect of other secondary minerals (e.g., calcium-perovskite and ilmenite) is also ignored.
According to Chapter 20.3 in Karato (2008), the functional form of the temperature and water dependence for weak anelasticity is approximately given by:
where
the first and second term on the right side of this equation represent the anharmonic and anelastic effect of temperature respectively. we use the values given in Table 20.2 of Karato (2008) to infer the velocity perturbations caused by the anelastic effect of temperature.
Similarly, taking the logarithm and derivative of the first equation with respect to water content, one finds:
the first and second term on the right side of this equation represent the anharmonic and anelastic effect of water respectively. According to Karato (1995),
In addition, since the effect of major element on anelasticity is insignificant (Durham and Goetze, 1977; Darot and Gueguen, 1981; Shito et al., 2006), we ignore the anelastic effect of mantle composition in this study.
Using the improved mineral physics method, we predict the P and S velocity perturbations at different mantle conditions relative to a reference model (Figure 1). We choose a one-dimensional 1,400°C adiabatic geotherm as the reference temperature model (Supplementary Figure S1B); the pyrolite model (Carmichael et al., 1974; McDonough and Sun, 1995) as the reference mantle composition model, which consists of 82.5 mol% harzburgite and 17.5 mol% basalt (Supplementary Table S2). In addition, according to the research of hydrous wadsleyite and ringwoodite (Wang et al., 2019; Wang et al., 2021), we assume the reference water model is wadsleyite with 0.5 wt% water for the upper MTZ, ringwoodite with 0.25 wt% water for the lower MTZ, and other secondary minerals are dry. Furthermore, the reference Q model for anelastic effect is derived from PREM (Dziewonski and Anderson, 1981). The velocity anomalies caused by anharmonic effect (about 0.5%–3%) are all larger than those caused by anelastic effect (lower than 0.5%) since the energy dissipation in the MTZ is much smaller than that in the upper mantle (Figure 1). However, the anelastic effect is not negligible in the MTZ. For instance, the S wave anelastic anomaly caused by 200 K temperature anomaly is up to 0.5% in the MTZ (Figures 1E,F). Compared with the velocity anomalies caused by ∼1 wt% water content and 200 K temperature anomaly, the velocity anomaly caused by 7.5 mol% harzburgite anomaly is minor and lower than 1% in the MTZ (Figures 1C,D), which indicates the composition effect in the MTZ is minor. There are several possible composition anomalies in the MTZ, such as basalt content anomaly, Fe content anomaly, and Al content anomaly. Since the following inversion procedure does not have enough information to distinguish the differences between those anomalies, we use basalt content anomaly to represent mantle composition anomaly.
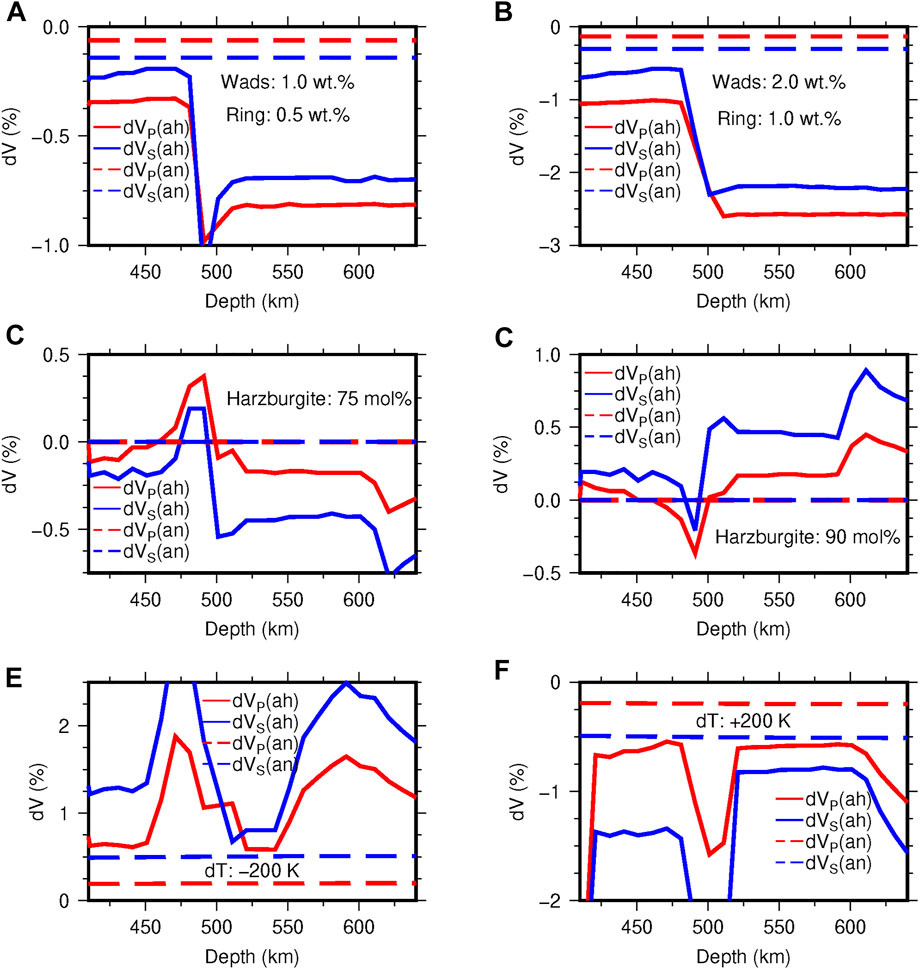
FIGURE 1. Velocity perturbations of (A) a water-unsaturated model (i.e., 1 wt% water in wadsleyite and 0.5 wt% in ringwoodite); (B) a water-saturated model (i.e., 2 wt% water in wadsleyite and 1 wt% in ringwoodite); (C) a depleted harzburgite model (75 mol% harzburgite + 25 mol% basalt); (D) an enriched harzburgite model (90 mol% harzburgite + 10 mol% basalt); (E) a cold model with a temperature 200 K lower than the reference temperature model; (F) a hot model with a temperature 200 K higher than the reference temperature model, relative to velocities of the reference mineral model. Subscripts an and ah represent the velocity anomalies caused by anelastic effect and anharmonic effect respectively.
Due to the complicated phase transformations caused by temperature variations, the profile has some slight fluctuations. For instance, when temperature decreases 200 K, the phase boundary of β to γ olivine will elevate (Supplemenatry Figure S1A), causing the velocity anomalies around 450 km to increase largely (Figure 1E). Moreover, since the volume fraction of ilmenite increases with decreasing temperature around 550 km (Supplemenatry Figure S1A), the velocity anomalies fluctuate in the lower MTZ (Figure 1E).
Because of the significant water storage capacity of wadsleyite and the large water sensitivity of ringwoodite, the reduction of anharmonic velocity can reach 1%–3% in the water-saturated situation, which is comparable with those from 200 K temperature anomaly (Figure 1B). Unlike olivine (Mao et al., 2010), the anharmonic water effect of wadsleyite and ringwoodite is not largely suppressed by increasing pressure, so there are still remarkable velocity reductions in the deep MTZ. The velocity reduction caused by water in the lower MTZ is more significant than in the upper MTZ since ringwoodite is more sensitive to water than wadsleyite. In addition, P wave anomalies caused by water effects are slightly larger than S wave anomalies (Figures 1A,B), which is different from those caused by temperature and composition effects.
The 3-D sensitivity kernels of P- and S-wave velocity anomalies to water, temperature, and harzburgite abundance for the upper MTZ (462 km depth) and lower MTZ (587 km depth) are calculated (Figures 2, 3). At the upper MTZ, both P- and S-wave anomalies show small sensitivities to water, and they only change 1% in the range of 0–2 wt% water content when
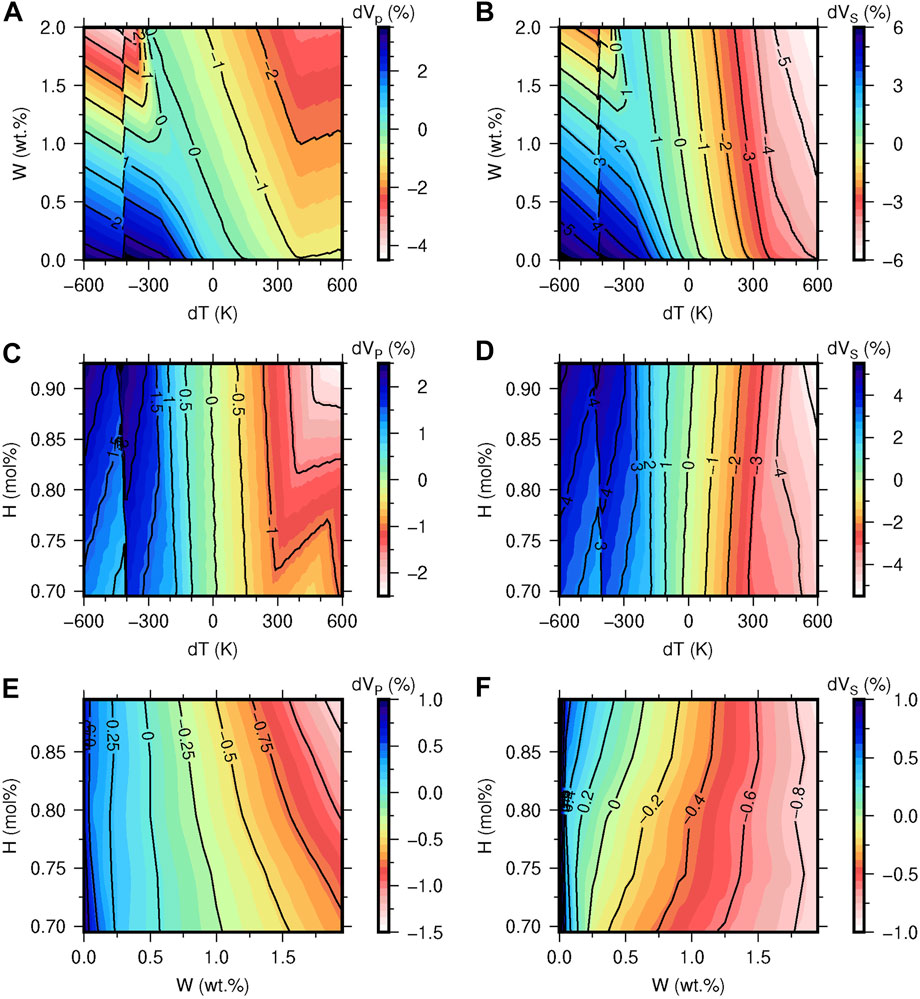
FIGURE 2. The sensitivity kernels of P- and S-wave velocity anomalies in the upper MTZ to water and temperature based on the pyrolite composition model (A,B); to temperature and harzburgite abundance based on a water content of 0.5 wt% in wadsleyite (C,D); to water and harzburgite abundance based on the 1,400°C adiabatic geotherm (E,F).
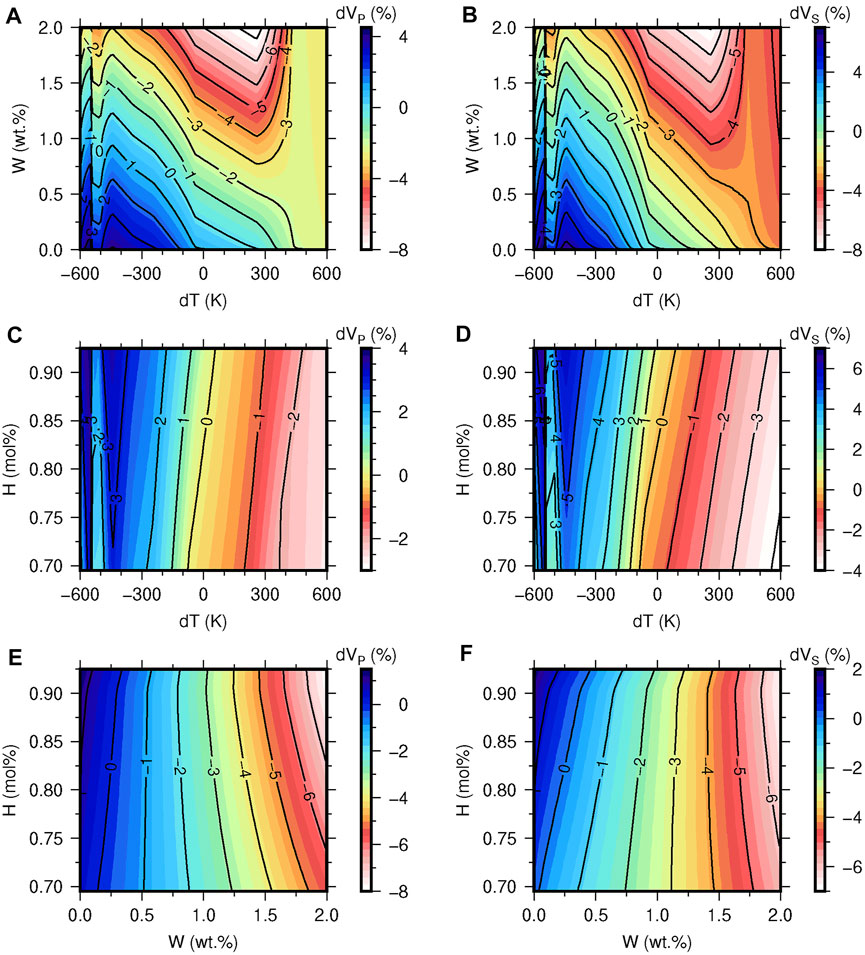
FIGURE 3. The sensitivity kernels of P- and S-wave velocity anomalies in the lower MTZ to water and temperature based on the pyrolite composition model (A,B); to temperature and harzburgite abundance based on a water content of 0.25 wt% in ringwoodite (C,D); to water and harzburgite abundance based on the 1,400 °C adiabatic geotherm (E,F).
The temperature effect is comparable with the water effect in the MTZ. P and S wave velocity anomalies change about 4% and 8%, respectively, in the whole range of temperature variation (Figures 2C,D, 3C,D). Although temperature effect decreases with depths due to the pressure effects on thermal expansion and attenuation (Karato, 2008), it is prominent in the MTZ.
Compared with temperature and water effects, the chemical composition effect is minor. The variations of velocity anomalies are lower than 1% when harzburgite abundance changes from 70 mol% to 90 mol% (Figures 2E,F, 3E,F). Since the chemical effect is not suppressed by pressure and becomes more visible in the deeper mantle (Karato, 2008), we find that the velocity variations in 587 km caused by composition anomaly are slightly larger than those in 462 km (Figures 2E,F, 3E,F).
Based on the above mineral physics modeling, we can invert water content, temperature, and composition structures in the MTZ from a seismic tomography model. The grid search method is implemented to find the optimal temperature, composition, and water anomalies for observed P- and S-wave velocity anomalies. We define a misfit function
where the subscripts
In this study, we use TX2019slab (Lu et al., 2019), a P and S wave joint tomography model based on a linearized inversion of the major P- and S- body wave phases, to constrain the water distribution of the MTZ. TX2019slab shares some common features with other P and S wave joint tomography models (Houser et al., 2008; Simmons et al., 2010; Tesoniero et al., 2015) and has a higher resolution in the MTZ. Except for the North America (NAM) subduction zone, high velocity anomalies (1.5%–4%) related to subducted slabs in 7 subduction zones (i.e., the Calabria (CAL), western Java (JAV), northern Honshu (HON), northern Mariana (MAR), Tonga (TON), Central America (CAM) and northern Chile (CHI) subduction zones.) are well resolved. Low velocity anomalies (−1% to −2%) are dominantly located in Southern Eurasia, South Pacific, and East Africa (Figure 4). Compared with other models, TX2019slab reveals a more refined slab geometry and higher amplitude of velocity anomalies within slabs since they incorporated a 3-D subducting slab model into their starting reference model in inversion. Lu and Grand (2016) pointed out that the incorrect imaging of slabs can bias tomography results (Lu et al., 2019), so a tomography model with more accurate slab structures can provide a more reliable water distribution in the MTZ. The above analysis shows TX2019slab is an appropriate model for revealing the water anomalies near subduction zones.
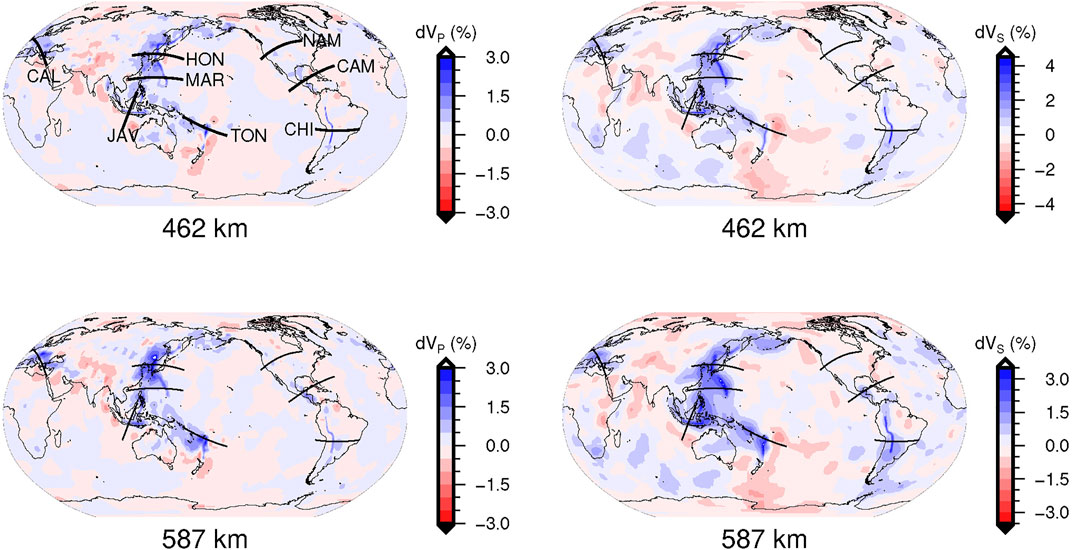
FIGURE 4. Isotropic P-wave and S-wave velocity anomalies in the upper and lower MTZ for TX2019slab (Lu et al., 2019). Eight black lines represent the subducting directions of slabs in eight subduction zones. They are the HON, MAR, TON, JAV, CHI, NAM, CAM, and CAL subduction zones.
Our inversion results show that the MTZ is a main water reservoir of the Earth. The olivine polymorphs in the upper MTZ and the lower MTZ contain 0–2 wt% water and 0–1.5 wt% water, respectively (Figure 5). Considering the mass fractions of wadsleyite and ringwoodite (about 50–60 wt% in the mantle) and the uncertainties from the reference water model (Wang et al., 2019; Wang et al., 2021), the average water contents of the upper MTZ and the lower MTZ are 0.30–0.50 wt% and 0.15–0.20 wt%, respectively. The total water contents in the MTZ (
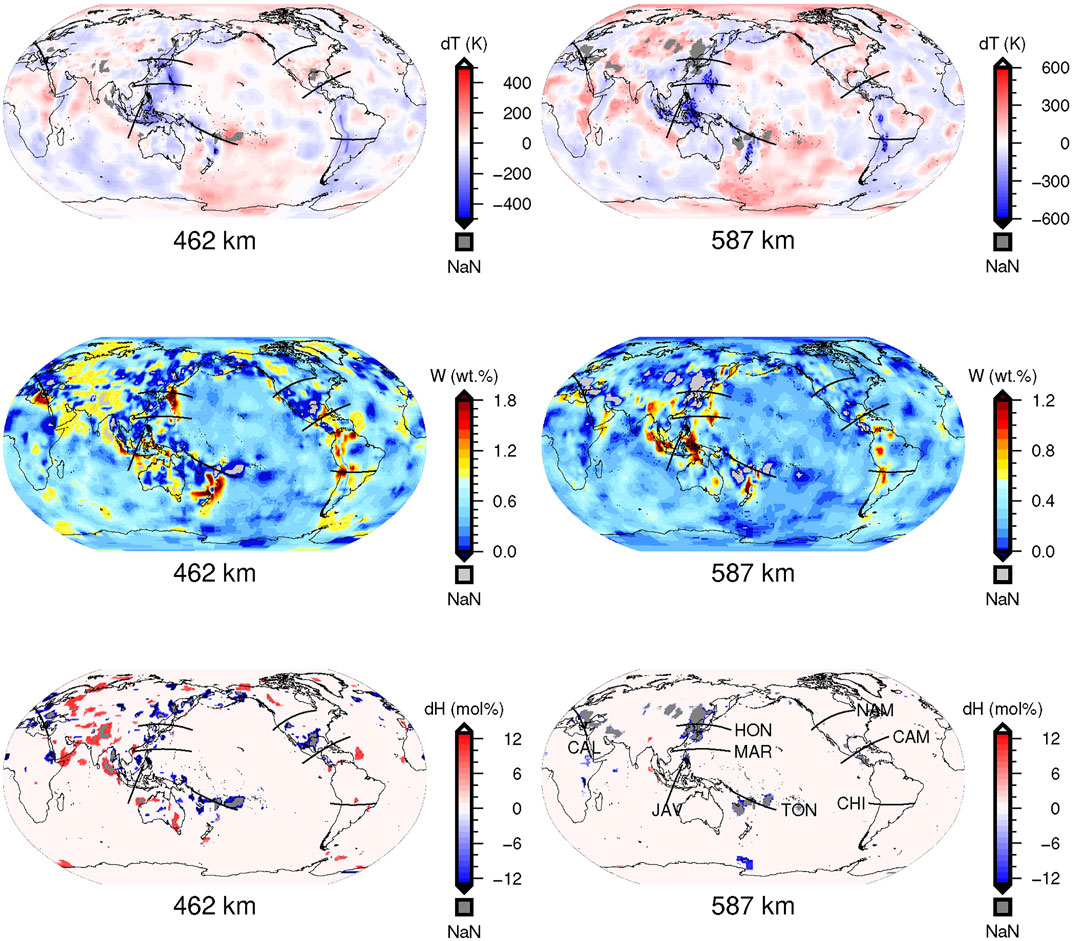
FIGURE 5. Distributions of temperature anomalies, water contents and harzburgite anomalies in the upper MTZ (462 km) and the lower MTZ (587 km). Only the optimal solutions with a misfit less than 0.2% are displayed, and those with an error greater than 0.2% (NaN) are marked in gray color. Eight black lines represent the subducting directions of slabs in eight subduction zones.
Most high water content areas in the MTZ are located near the subduction zones, and the water content of the slabs in the upper MTZ is higher than that in the lower MTZ, which indicates that slabs can transport water into the MTZ. Based on the inversion results, the eight slabs can be divided into three groups: 1. The HON, MAR, TON, JAV, and CHI subduction zones, which are colder (dT = −200 ∼ −600 K) than other slabs, display prominent hydrous signals in the whole MTZ. The water contents are up to 2 wt% and 1 wt% in the upper and the lower MTZ, respectively. 2. The CAM and CAL subduction zones, which have temperature anomalies between 0 and −200 K, display clear hydrous signals (wadsleyite with 0.7–1.4 wt% water) in the upper MTZ, and weak hydrous signals (ringwoodite with 0.5–0.7 wt% water) in the lower MTZ. 3. The NAM slab does not show an apparent low-temperature anomaly or hydrous signal in the whole MTZ, indicating it is relatively hot, significantly dehydrated in the upper mantle, and barely transporting water into the MTZ. Since dense hydrous magnesium silicates (DHMS) are stable at low temperatures (Poli and Schmidt, 2002) and the water storage capacities of hydrous phases are inversely proportional to temperature (Litasov and Ohtani, 2003), so colder slabs dehydrate more slowly, and carry more water into the deep mantle (van Keken et al., 2011), versa vice.
Besides the subduction zones, the central and southern Eurasia also show hydrous signals in the upper MTZ and contain water up to 0.6–1 wt%. Combining with the temperature and composition structures, we find that these hydrous regions have positive temperature anomalies and a mantle composition different from the surrounding pyrolite mantle. Future work is needed to determine the cause of this anomaly.
The composition structure indicates that the pyrolite model can represent the chemical composition of most areas in the MTZ. In addition, we find that composition anomalies are required to explain some of the velocity perturbations in the upper MTZ. Since our data cannot provide adequate information to distinguish differences between composition anomalies, our modeling results only indicate if a composition anomaly is needed to explain the velocity perturbations but cannot provide an accurate composition anomaly model. For example, our modeling suggests basalt accumulations up to 30% near the HON, MAR, and TON subduction zones in the upper MTZ. It could be a result of a large proportion (∼65% after ∼12.5 Myr) of pyroxene appearing in the oceanic crust due to slow diffusion in majoritic garnet (van Mierlo et al., 2013); or it only indicates those areas have chemical anomalies, and more information is needed to obtain a robust composition model in the future.
It is noteworthy that the lateral distribution patterns of water, temperature, and composition (Figure 5) are not affected by the reference models, but their absolute values can be different when we choose different reference models. Since the reference water model (Wang et al., 2019; Wang et al., 2021) we choose has a layered feature of water content in the MTZ, the upper MTZ is more hydrous than the lower MTZ in our results. This layered feature may be caused by the deep mantle melt redistribution (Karato et al., 2020): The hydrous melt above 410 km which is heavier than the surrounding mantle, has returned to the MTZ with downwelling flows (e.g., subducted slabs), causing the upper MTZ has accumulated more water.
Our results show some unresolved regions with misfits greater than 0.2%. We find that the unresolved places are dominantly near the HON, TON, and CAL subduction zones (Figure 5), where high velocity anomalies up to 2.5% ∼ 3.5% appear and P-wave velocity anomalies are slightly larger than S-wave velocity anomalies (Figure 4). Since the western Pacific subduction zone and the Mediterranean subduction zone have stagnant slabs (Fukao et al., 2009), other factors (such as the influence of Superhydrous phase B) need to be involved for a more accurate model in the future.
van Keken et al. (2011) used geodynamic calculation to model the thermal and petrological structures of the subduction zones and to predict water contents of downgoing slabs. Their calculation indicates that cold slabs, such as TON, MAR, HON, and JAV, dehydrate slowly and can transfer water into depths lower than 230 km. In contrast, warm slabs, such as NAM, become nearly anhydrous at shallow depths (Figures 6A,B), which is consistent with our results. Their study suggests that the CHI slab is warm and dehydrates significantly above 230 km depth, while our results show a clear hydrous signal in the MTZ close to the CHI slab. The possible reason for the discrepancy is that the subduction of the middle ocean ridge (Hu et al., 2016) at the CHI slab brings more water into the mantle than other slabs, so the slab remains hydrous in the MTZ, although it significantly dehydrates in the upper mantle.

FIGURE 6. Other results related to the water contents in the MTZ. (A) Thermal parameter Φ (the product of convergence speed and age of subducted slabs) of subducted slabs (Figure 1 in van Keken et al., 2011). A higher thermal parameter indicates a colder slab. (B) Predicted H2O flux at selected depths in the global subduction zones. The black line is the position of trench. The parallel lines show H2O input to the fore arc (15 km), volcanic front (100 km), 150 km depth and >230 km depth, respectively (Figure 7 in van Keken et al., 2011). (C) Variations of the electrical conductivity at 410–520 km depth (Sun et al., 2015). (D) Variations of the electrical conductivity at 520–670 km depth (Sun et al., 2015). plotted are log10(σ), σ is electrical conductivity in S/m. Eight black lines represent the subducting directions of slabs in eight subduction zones.
Besides seismic velocity, electrical conductivity is also highly sensitive to water, and a small amount of water can significantly increase electrical conductivity (Karato, 1990). Sun et al. (2015) reported a high-resolution global electrical conductivity model, which shares some common features with our results (Figures 6C,D). Their model shows high electrical conductivity anomalies are mainly located in the HON, MAR, JAV, and CHI subduction zones (red areas in Figures 6C,D). Moderate electrical conductivity anomalies appear near the CAM subduction zone (white areas in Figures 6C,D). Low electrical conductivity anomalies appear close to the NAM subduction zone (blue areas in Figures 6C,D). Those characteristics are all consistent with our results (Figure 5). In addition, high conductivity anomalies are also located in central Eurasia and the northern Indian Ocean (red areas in Figures 6C,D), which show high water contents up to 0.6–1 wt% in the upper MTZ in our results (Figure 5). However, our results exhibit a hydrous MTZ beneath the TON subduction, which does not appear in the conductivity model. Since the electrical conductivity of minerals is not only affected by water but also by temperature and chemical composition (Huang et al., 2005; Yoshino et al., 2008; Yoshino and Katsura, 2009), we need to consider the combined effect of these factors to understand the high electrical conductivity in the MTZ.
According to our water distribution results and the water contents and water distributions of the upper mantle (Peslier et al., 2017; Ohtani, 2021), together with the information on deep mantle melting (Karato et al., 2020) and plate tectonic history (Brown et al., 2020), we propose a water circulation model in Figure 7.
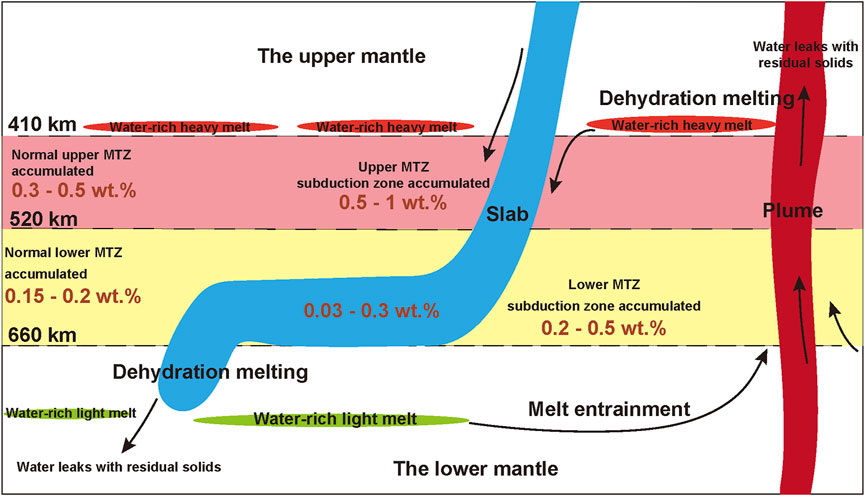
FIGURE 7. Schematic diagram for the water circulation in the mantle.
Hydrous regions in the upper mantle are near subduction zones, where slabs transported 0.03–0.3 wt% water into the MTZ (Suetsugu et al., 2010; Peslier et al., 2017; Ohtani, 2021). Because plate tectonics began in the early Paleoproterozoic (2.2 Ga) (Brown et al., 2020), the subduction of oceanic plates may have been going on for hundreds of millions of years. Since the diffusion rate of hydrogen is slow (∼1 km for 100 My) but the motion of water-rich melts is fast (∼100–1,000 km for 100 My), the motion of water-rich melts reflects the redistribution of water in the Earth (Karato et al., 2020). The thermal structure of our inversion results demonstrates that it is difficult to produce intensive partial melting in the MTZ. However, when subducted slabs penetrate the 660-km discontinuity, dehydration and partial melting will occur due to the significant contrast of water storage capacity between the MTZ and the lower mantle (Litasov and Ohtani, 2002; Hirschmann et al., 2009; Inoue et al., 2010b; Litasov et al., 2013), and most released water enters the melt, resulting in water-rich melts below the 660-km discontinuity. Since the water-rich melt is lighter than the surrounding mantle below 660 km, it returns to the MTZ with upwelling flows (e.g., mantle plumes) (Sanloup et al., 2013; Sakamaki, 2017; Karato et al., 2020). Similarly, dehydration melting occurs when upwelling flows pierce the 410-km discontinuity. Because the hydrous melt above 410 km is heavier than the surrounding mantle, the water-rich melt will return to the MTZ with downwelling flows (e.g., subducted slabs) (Sanloup et al., 2013; Sakamaki, 2017; Karato et al., 2020). Similar to the plate tectonic, such redistribution of water may have been going on for hundreds of millions of years, so the water released from slabs can be accumulated in the MTZ, the upper MTZ, and the lower MTZ have accumulated 0.3–0.5 wt% and 0.15–0.2 wt% water, respectively (Figure 7), during the whole tectonic history.
Based on the high temperatures and high pressures experimental data of hydrous olivine polymorphs (Wang et al., 2003; Litasov et al., 2005; Wang et al., 2006a; Mao et al., 2008a; Mao et al., 2008b; Jacobsen et al., 2009; Inoue et al., 2010a; Mao et al., 2010; Mao et al., 2011; Mao et al., 2012; Zhou et al., 2022), we improved our previous mineral modeling method (Weidner and Wang, 1998; Wang et al., 2006b; Wang et al., 2008, 2009) to involve water effects in the calculation. Then we combine the seismic isotropic velocity tomography TX2019slab (Lu et al., 2019) and our new mineral physics modeling method to map the water distribution in the MTZ.
We find that the MTZ is a main water reservoir of the Earth, and the total water content of the MTZ is about 0.64–1 seawater. The upper MTZ (410–520 km) and the lower MTZ (520–660 km) contain 0.3–0.5 wt% and 0.15–0.2 wt% water, respectively, implying water contents of the MTZ decrease with increasing depths. The most hydrous regions are mainly located near subduction zones, where the upper MTZ and the lower MTZ can contain water up to 0.5–1 wt% and 0.2–0.5 wt%, respectively, indicating water can be transported into the MTZ by slabs. In addition, old subducted slabs in the western Pacific subduction zone are more hydrous than young subducted slabs in the eastern Pacific subduction zone. Our results are consistent with petrological modeling (van Keken et al., 2011) and electrical conductivity tomography (Sun et al., 2015). We also proposed a water circulation model in the Earth’s mantle.
The original contributions presented in the study are included in the article/Supplementary Material, further inquiries can be directed to the corresponding author.
The specific contributions of each author are as follows. ZW: Methodology, software, data processing, visualization, writing-original draft; YW: conceptualization, supervision, review, editing. All authors read and approved the final manuscript.
This work was supported by the National Natural Science Foundation of China (XDB18010302).
We thank Wang et al. (2019) and Sun et al. (2015) for providing us their data. We thank Zhu Mao, Yumei He, Zhongqing Wu for constructive discussions. Most of the figures were made using Generic Mapping Tools (Wessel and Smith, 1998).
The authors declare that the research was conducted in the absence of any commercial or financial relationships that could be construed as a potential conflict of interest.
All claims expressed in this article are solely those of the authors and do not necessarily represent those of their affiliated organizations, or those of the publisher, the editors and the reviewers. Any product that may be evaluated in this article, or claim that may be made by its manufacturer, is not guaranteed or endorsed by the publisher.
The Supplementary Material for this article can be found online at: https://www.frontiersin.org/articles/10.3389/feart.2022.984063/full#supplementary-material
Birch, F. (1978). Finite strain isotherm and velocities for single-crystal and polycrystalline NaCl at high pressures and 300 K. J. Geophys. Res. 83 (B3), 1257–1268. doi:10.1029/JB083iB03p01257
Brown, M., Johnson, T., and Gardiner, N. J. (2020). plate tectonics and the archean Earth. Annu. Rev. Earth Planet. Sci. 48 (1), 291–320. doi:10.1146/annurev-earth-081619-052705
Carmichael, I. S. E., Turner, F. J., and Verhoogen, J. (1974). Igneous petrology. New York: McGraw-Hill.
Chang, S.-J., and Ferreira, A. M. G. (2019). Inference on water content in the mantle transition zone near subducted slabs from anisotropy tomography. Geochem. Geophys. Geosyst. 20 (2), 1189–1201. doi:10.1029/2018GC008090
Darot, M., and Gueguen, Y. (1981). High-temperature creep of forsterite single crystals. J. Geophys. Res. 86 (B7), 6219–6234. doi:10.1029/JB086iB07p06219
Durham, W. B., and Goetze, C. (1977). Plastic flow of oriented single crystals of olivine: 1. Mechanical data. J. Geophys. Res. 82 (36), 5737–5753. doi:10.1029/JB082i036p05737
Dziewonski, A. M., and Anderson, D. L. (1981). Preliminary reference Earth model. Phys. earth Planet. interiors 25 (4), 297–356. doi:10.1016/0031-9201(81)90046-7
Fan, D., Xu, J., Lu, C., Tkachev, S. N., Li, B., Ye, Z., et al. (2019). Elasticity of single-crystal low water content hydrous pyrope at high-pressure and high-temperature conditions. Am. Mineral. 104 (7), 1022–1031. doi:10.2138/am-2019-6897
Fei, H., Yamazaki, D., Sakurai, M., Miyajima, N., Ohfuji, H., Katsura, T., et al. (2017). A nearly water-saturated mantle transition zone inferred from mineral viscosity. Sci. Adv. 3 (6), e1603024. doi:10.1126/sciadv.1603024
Frost, D. J., and Dolejš, D. (2007). Experimental determination of the effect of H2O on the 410-km seismic discontinuity. Earth Planet. Sci. Lett. 256 (1), 182–195. doi:10.1016/j.epsl.2007.01.023
Fukao, Y., Obayashi, M., and Nakakuki, T. (2009). Stagnant slab: a review. Annu. Rev. Earth Planet. Sci. 37 (1), 19–46. doi:10.1146/annurev.earth.36.031207.124224
Hier-Majumder, S., Anderson, I. M., and Kohlstedt, D. L. (2005). Influence of protons on Fe-Mg interdiffusion in olivine. J. Geophys. Res. 110, B02202. doi:10.1029/2004JB003292
Hill, R. (1952). The elastic behaviour of a crystalline aggregate. Proc. Phys. Soc. A 65 (5), 349–354. doi:10.1088/0370-1298/65/5/307
Hirschmann, M. M., Tenner, T., Aubaud, C., and Withers, A. C. (2009). Dehydration melting of nominally anhydrous mantle: the primacy of partitioning. Phys. Earth Planet. Interiors 176 (1), 54–68. doi:10.1016/j.pepi.2009.04.001
Hirth, G., and Kohlstedt, D. L. (1996). Water in the oceanic upper mantle: Implications for rheology, melt extraction and the evolution of the lithosphere. Earth Planet. Sci. Lett. 144 (1), 93–108. doi:10.1016/0012-821X(96)00154-9
Hou, M., Zhou, W.-Y., Hao, M., Hua, F. T.-S., Kung, J., Zhang, D., et al. (2022). Effect of structural water on the elasticity of orthopyroxene. Am. Mineral. 107 (4), 703–708. doi:10.2138/am-2021-7843
Houser, C. (2016). Global seismic data reveal little water in the mantle transition zone. Earth Planet. Sci. Lett. 448, 94–101. doi:10.1016/j.epsl.2016.04.018
Houser, C., Masters, G., Shearer, P., and Laske, G. (2008). Shear and compressional velocity models of the mantle from cluster analysis of long-period waveforms. Geophys. J. Int. 174 (1), 195–212. doi:10.1111/j.1365-246X.2008.03763.x
Hu, J., Liu, L., Hermosillo, A., and Zhou, Q. (2016). Simulation of late Cenozoic South American flat-slab subduction using geodynamic models with data assimilation. Earth Planet. Sci. Lett. 438, 1–13. doi:10.1016/j.epsl.2016.01.011
Huang, X., Xu, Y., and Karato, S.-i. (2005). Water content in the transition zone from electrical conductivity of wadsleyite and ringwoodite. Nature 434 (7034), 746–749. doi:10.1038/nature03426
Inoue, T., Ueda, T., Tanimoto, Y., Yamada, A., and Irifune, T. (2010a). The effect of water on the high-pressure phase boundaries in the system Mg2SiO4-Fe2SiO4. J. Phys. Conf. Ser. 215, 012101. doi:10.1088/1742-6596/215/1/012101
Inoue, T., Wada, T., Sasaki, R., and Yurimoto, H. (2010b). Water partitioning in the Earth's mantle. Phys. Earth Planet. Interiors 183 (1), 245–251. doi:10.1016/j.pepi.2010.08.003
Inoue, T., Yurimoto, H., and Kudoh, Y. (1995). Hydrous modified spinel, Mg1.75SiH0.5O4: A new water reservoir in the mantle transition region. Geophys. Res. Lett. 22 (2), 117–120. doi:10.1029/94GL02965
Jacobsen, S. D., Jiang, F., Mao, Z., Duffy, T. S., Smyth, J. R., Holl, C. M., et al. (2009). Correction to" Effects of hydration on the elastic properties of olivine. Geophys. Res. Lett. 36 (12), L12302. doi:10.1029/2009gl038660
Karato, S.-i. (2008). Deformation of earth materials. An introduction to the rheology of Solid Earth. Cambridge: Cambridge Univ. Press.
Karato, S.-i. (1995). Effects of water on seismic wave velocities in the upper mantle. Proc. Jpn. Acad. Ser. B. Phys. Biol. Sci. 71 (2), 61–66. doi:10.2183/pjab.71.61
Karato, S.-i., and Jung, H. (1998). Water, partial melting and the origin of the seismic low velocity and high attenuation zone in the upper mantle. Earth Planet. Sci. Lett. 157 (3), 193–207. doi:10.1016/S0012-821X(98)00034-X
Karato, S.-i., Karki, B., and Park, J. (2020). Deep mantle melting, global water circulation and its implications for the stability of the ocean mass. Prog. Earth Planet. Sci. 7 (1), 76. doi:10.1186/s40645-020-00379-3
Karato, S.-i. (1990). The role of hydrogen in the electrical conductivity of the upper mantle. Nature 347 (6290), 272–273. doi:10.1038/347272a0
Karato, S.-i. (2011). Water distribution across the mantle transition zone and its implications for global material circulation. Earth Planet. Sci. Lett. 301 (3), 413–423. doi:10.1016/j.epsl.2010.11.038
Kohlstedt, D. L., Keppler, H., and Rubie, D. C. (1996). Solubility of water in the α, β and γ phases of (Mg, Fe)2SiO4. Contributions Mineralogy Petrology 123 (4), 345–357. doi:10.1007/s004100050161
Kustowski, B., Ekström, G., and Dziewoński, A. M. (2008). Anisotropic shear-wave velocity structure of the earth's mantle: a global model. J. Geophys. Res. 113 (B6), B06306–B06323. doi:10.1029/2007JB005169
Li, L., Weidner, D. J., Brodholt, J., Alfè, D., and Price, G. D. (2006). Elasticity of Mg2SiO4 ringwoodite at mantle conditions. Phys. Earth Planet. Interiors 157 (3), 181–187. doi:10.1016/j.pepi.2006.04.002
Li, L., Weidner, D. J., Brodholt, J. P., and Alfè, D. (2011). Prospecting for water in the transition zone: dln(Vs)/dln(Vp). Phys. Earth Planet. Interiors 189 (1), 117–120. doi:10.1016/j.pepi.2011.07.009
Litasov, K. D., Shatskiy, A., and Ohtani, E. (2013). Earth’s mantle melting in the presence of C-O-H-bearing fluid. Phys. Chem. deep Earth, 38–65. doi:10.1002/9781118529492.ch2
Litasov, K., and Ohtani, E. (2002). Phase relations and melt compositions in CMAS–pyrolite–H2O system up to 25 GPa. Phys. Earth Planet. Interiors 134 (1), 105–127. doi:10.1016/S0031-9201(02)00152-8
Litasov, K., Ohtani, E., Sano, A., Suzuki, A., and Funakoshi, K. (2005). In situ X-ray diffraction study of post-spinel transformation in a peridotite mantle: Implication for the 660-km discontinuity. Earth Planet. Sci. Lett. 238 (3), 311–328. doi:10.1016/j.epsl.2005.08.001
Litasov, K., and Ohtani, E. (2003). Stability of various hydrous phases in CMAS pyrolite-H2O system up to 25 GPa. Phys. Chem. Minerals 30 (3), 147–156. doi:10.1007/s00269-003-0301-y
Liu, Z., Park, J., and Karato, S.-i. (2018). Seismic evidence for water transport out of the mantle transition zone beneath the european Alps. Earth Planet. Sci. Lett. 482, 93–104. doi:10.1016/j.epsl.2017.10.054
Lu, C., Grand, S. P., Lai, H., and Garnero, E. J. (2019). TX2019slab: A new P and S tomography model incorporating subducting slabs. J. Geophys. Res. Solid Earth 124 (11), 11549–11567. doi:10.1029/2019JB017448
Lu, C., and Grand, S. P. (2016). The effect of subducting slabs in global shear wave tomography. Geophys. J. Int. 205 (2), 1074–1085. doi:10.1093/gji/ggw072
Mao, Z., Jacobsen, S. D., Frost, D. J., McCammon, C. A., Hauri, E. H., and Duffy, T. S. (2011). Effect of hydration on the single-crystal elasticity of Fe-bearing wadsleyite to 12 GPa. Am. Mineralogist 96 (10), 1606–1612. doi:10.2138/am.2011.3807
Mao, Z., Jacobsen, S. D., Jiang, F., Smyth, J. R., Holl, C. M., and Duffy, T. S. (2008a). Elasticity of hydrous wadsleyite to 12 GPa: implications for Earth's transition zone. Geophys. Res. Lett. 35 (21), L21305. doi:10.1029/2008GL035618
Mao, Z., Jacobsen, S. D., Jiang, F., Smyth, J. R., Holl, C. M., Frost, D. J., et al. (2008b). Single-crystal elasticity of wadsleyites, β-Mg2SiO4, containing 0.37–1.66 wt.% H2O. Earth Planet. Sci. Lett. 266 (1), 78–89. doi:10.1016/j.epsl.2007.10.045
Mao, Z., Jacobsen, S. D., Jiang, F., Smyth, J. R., Holl, C. M., Frost, D. J., et al. (2010). Velocity crossover between hydrous and anhydrous forsterite at high pressures. Earth Planet. Sci. Lett. 293 (3), 250–258. doi:10.1016/j.epsl.2010.02.025
Mao, Z., and Li, X. (2016). Effect of hydration on the elasticity of mantle minerals and its geophysical implications. Sci. China Earth Sci. 59 (5), 873–888. doi:10.1007/s11430-016-5277-9
Mao, Z., Lin, J.-F., Jacobsen, S. D., Duffy, T. S., Chang, Y.-Y., Smyth, J. R., et al. (2012). Sound velocities of hydrous ringwoodite to 16 GPa and 673 K. Earth Planet. Sci. Lett. 331-332, 112–119. doi:10.1016/j.epsl.2012.03.001
McDonough, W. F., and Sun, S. s. (1995). The composition of the Earth. Chem. Geol. 120 (3), 223–253. doi:10.1016/0009-2541(94)00140-4
Meier, U., Trampert, J., and Curtis, A. (2009). Global variations of temperature and water content in the mantle transition zone from higher mode surface waves. Earth Planet. Sci. Lett. 282 (1), 91–101. doi:10.1016/j.epsl.2009.03.004
Moulik, P., and Ekström, G. (2014). An anisotropic shear velocity model of the Earth's mantle using normal modes, body waves, surface waves and long-period waveforms. Geophys. J. Int. 199 (3), 1713–1738. doi:10.1093/gji/ggu356
Ohtani, E. (2021). Hydration and dehydration in earth's interior. Annu. Rev. Earth Planet. Sci. 49 (1), 253–278. doi:10.1146/annurev-earth-080320-062509
Ohtani, E., Litasov, K., Hosoya, T., Kubo, T., and Kondo, T. (2004). Water transport into the deep mantle and formation of a hydrous transition zone. Phys. Earth Planet. Interiors 143-144, 255–269. doi:10.1016/j.pepi.2003.09.015
Panning, M. P., Lekić, V., and Romanowicz, B. A. (2010). Importance of crustal corrections in the development of a new global model of radial anisotropy. J. Geophys. Res. 115 (B12), B12325–B12379. doi:10.1029/2010JB007520
Pearson, D. G., Brenker, F. E., Nestola, F., McNeill, J., Nasdala, L., Hutchison, M. T., et al. (2014). Hydrous mantle transition zone indicated by ringwoodite included within diamond. Nature 507 (7491), 221–224. doi:10.1038/nature13080
Peslier, A. H., Schönbächler, M., Busemann, H., and Karato, S.-I. (2017). Water in the Earth’s interior: distribution and origin. Space Sci. Rev. 212 (1), 743–810. doi:10.1007/s11214-017-0387-z
Poli, S., and Schmidt, M. W. (2002). Petrology of subducted slabs. Annu. Rev. Earth Planet. Sci. 30 (1), 207–235. doi:10.1146/annurev.earth.30.091201.140550
Sakamaki, T. (2017). Density of hydrous magma. Chem. Geol. 475, 135–139. doi:10.1016/j.chemgeo.2017.11.012
Sanloup, C., Drewitt, J. W. E., Konôpková, Z., Dalladay-Simpson, P., Morton, D. M., Rai, N., et al. (2013). Structural change in molten basalt at deep mantle conditions. Nature 503 (7474), 104–107. doi:10.1038/nature12668
Shito, A., Karato, S.-i., Matsukage, K. N., Nishihara, Y., Jacobsen, S. D., and Van Der Lee, S. (2006). Towards mapping the three-dimensional distribution of water in the upper mantle from velocity and attenuation tomography. Washington DC: Geophysical Monograph-American Geophysical Union, 225–236.
Simmons, N. A., Forte, A. M., Boschi, L., and Grand, S. P. (2010). GyPSuM: a joint tomographic model of mantle density and seismic wave speeds. J. Geophys. Res. 115 (B12), 123100–B13124. doi:10.1029/2010JB007631
Suetsugu, D., Inoue, T., Obayashi, M., Yamada, A., Shiobara, H., Sugioka, H., et al. (2010). Depths of the 410-km and 660-km discontinuities in and around the stagnant slab beneath the Philippine Sea: is water stored in the stagnant slab? Phys. Earth Planet. Interiors 183 (1), 270–279. doi:10.1016/j.pepi.2010.09.004
Sun, J., Kelbert, A., and Egbert, G. D. (2015). Ionospheric current source modeling and global geomagnetic induction using ground geomagnetic observatory data. JGR. Solid Earth 120 (10), 6771–6796. doi:10.1002/2015JB012063
Tesoniero, A., Auer, L., Boschi, L., and Cammarano, F. (2015). Hydration of marginal basins and compositional variations within the continental lithospheric mantle inferred from a new global model of shear and compressional velocity. J. Geophys. Res. Solid Earth 120 (11), 7789–7813. doi:10.1002/2015JB012026
Thio, V., Cobden, L., and Trampert, J. (2016). Seismic signature of a hydrous mantle transition zone. Phys. Earth Planet. Interiors 250, 46–63. doi:10.1016/j.pepi.2015.11.005
Tschauner, O., Huang, S., Greenberg, E., Prakapenka, V. B., Ma, C., Rossman, G. R., et al. (2018). Ice-VII inclusions in diamonds: evidence for aqueous fluid in Earth’s deep mantle. Science 359 (6380), 1136–1139. doi:10.1126/science.aao3030
van Keken, P. E., Hacker, B. R., Syracuse, E. M., and Abers, G. A. (2011). Subduction factory: 4. Depth-dependent flux of H2O from subducting slabs worldwide. J. Geophys. Res. 116 (B1), 01401. doi:10.1029/2010JB007922
van Mierlo, W. L., Langenhorst, F., Frost, D. J., and Rubie, D. C. (2013). Stagnation of subducting slabs in the transition zone due to slow diffusion in majoritic garnet. Nat. Geosci. 6 (5), 400–403. doi:10.1038/ngeo1772
Visser, K., Trampert, J., Lebedev, S., and Kennett, B. L. N. (2008). Probability of radial anisotropy in the deep mantle. Earth Planet. Sci. Lett. 270 (3), 241–250. doi:10.1016/j.epsl.2008.03.041
Wang, J., Sinogeikin, S. V., Inoue, T., and Bass, J. D. (2003). Elastic properties of hydrous ringwoodite. Am. Mineralogist 88 (10), 1608–1611. doi:10.2138/am-2003-1025
Wang, J., Sinogeikin, S. V., Inoue, T., and Bass, J. D. (2006a). Elastic properties of hydrous ringwoodite at high-pressure conditions. Geophys. Res. Lett. 33 (14), L14308. doi:10.1029/2006GL026441
Wang, W., Walter, M. J., Peng, Y., Redfern, S., and Wu, Z. (2019). Constraining olivine abundance and water content of the mantle at the 410-km discontinuity from the elasticity of olivine and wadsleyite. Earth Planet. Sci. Lett. 519, 1–11. doi:10.1016/j.epsl.2019.04.018
Wang, W., Zhang, H., Brodholt, J. P., and Wu, Z. (2021). Elasticity of hydrous ringwoodite at mantle conditions: Implication for water distribution in the lowermost mantle transition zone. Earth Planet. Sci. Lett. 554, 116626. doi:10.1016/j.epsl.2020.116626
Wang, Y., Wen, L., and Weidner, D. (2009). Array triplication data constraining seismic structure and composition in the mantle. Surv. Geophys. 30 (4), 355–376. doi:10.1007/s10712-009-9073-3
Wang, Y., Wen, L., Weidner, D., and He, Y. (2006b). SH velocity and compositional models near the 660-km discontinuity beneath South America and northeast Asia. J. Geophys. Res. 111, B07305. doi:10.1029/2005JB003849
Wang, Y., Wen, L., and Weidner, D. (2008). Upper mantle SH- and P-velocity structures and compositional models beneath southern Africa. Earth Planet. Sci. Lett. 267 (3), 596–608. doi:10.1016/j.epsl.2007.12.010
Weidner, D. J., and Wang, Y. (1998). Chemical- and Clapeyron-induced buoyancy at the 660 km discontinuity. J. Geophys. Res. 103 (B4), 7431–7441. doi:10.1029/97JB03511
Wessel, P., and Smith, W. H. F. (1998). New, improved version of generic mapping tools released. Eos Trans. AGU. 79 (47), 579. doi:10.1029/98EO00426
Yoshino, T., and Katsura, T. (2009). Effect of iron content on electrical conductivity of ringwoodite, with implications for electrical structure in the transition zone. Phys. Earth Planet. Interiors 174 (1-4), 3–9. doi:10.1016/j.pepi.2008.09.015
Yoshino, T., and Katsura, T. (2013). Electrical conductivity of mantle minerals: Role of water in conductivity anomalies. Annu. Rev. Earth Planet. Sci. 41 (1), 605–628. doi:10.1146/annurev-earth-050212-124022
Yoshino, T., Manthilake, G., Matsuzaki, T., and Katsura, T. (2008). Dry mantle transition zone inferred from the conductivity of wadsleyite and ringwoodite. Nature 451 (7176), 326–329. doi:10.1038/nature06427
Keywords: water content, water distribution, the mantle transition zone, mineral physics modeling, seismic tomography
Citation: Wang Z and Wang Y (2022) Global water distribution in the mantle transition zone from a seismic isotropic velocity model and mineral physics modeling. Front. Earth Sci. 10:984063. doi: 10.3389/feart.2022.984063
Received: 01 July 2022; Accepted: 29 July 2022;
Published: 22 August 2022.
Edited by:
Jia Liu, Zhejiang University, ChinaReviewed by:
Jingui Xu, University of Hawaii, United StatesCopyright © 2022 Wang and Wang. This is an open-access article distributed under the terms of the Creative Commons Attribution License (CC BY). The use, distribution or reproduction in other forums is permitted, provided the original author(s) and the copyright owner(s) are credited and that the original publication in this journal is cited, in accordance with accepted academic practice. No use, distribution or reproduction is permitted which does not comply with these terms.
*Correspondence: Yi Wang, eWl3YW5nMjVAdXN0Yy5lZHUuY24=
Disclaimer: All claims expressed in this article are solely those of the authors and do not necessarily represent those of their affiliated organizations, or those of the publisher, the editors and the reviewers. Any product that may be evaluated in this article or claim that may be made by its manufacturer is not guaranteed or endorsed by the publisher.
Research integrity at Frontiers
Learn more about the work of our research integrity team to safeguard the quality of each article we publish.