
94% of researchers rate our articles as excellent or good
Learn more about the work of our research integrity team to safeguard the quality of each article we publish.
Find out more
BRIEF RESEARCH REPORT article
Front. Earth Sci., 05 October 2022
Sec. Volcanology
Volume 10 - 2022 | https://doi.org/10.3389/feart.2022.983051
This article is part of the Research TopicLinking Subaqueous, Subglacial, and Subaerial Volcanism: How Water Influences Eruption Dynamics and Creation of Volcanic ProductsView all 10 articles
 Jean-Marie Saurel1*
 Lise Retailleau1,2
 Christine Deplus1
 Benoît Loubrieu3Delphine Pierre3Michel Frangieh1
 Nassim Khelifi1Robin Bonnet3
 Valérie Ferrazzini1,2Sara Bazin3Pierre Guyavarch3Maryline Moulin3 REVOSIMA Seismology group REVOSIMA Bathymetry group
The majority of Earth volcanism takes place in the deep ocean. Deep-sea volcanoes are particularly complicated to study due to their remoteness. Very different methods can be used and their combination can lead to crucial information about submarine volcanoes behavior. In Mayotte, Comoros archipelago, efforts have been made to study and monitor the deep volcanic activity (∼3000 m) currently occurring east of Mayotte through various methods and campaigns on land and at sea. In October 2020, a line of 10 Ocean Bottom Seismometers was deployed during 10 days, leading to a hand-picked catalog of more than a thousand of hydro-acoustic signals, which have been associated with reactions between hot lava and deep cold ocean waters. During the same period, repeated swath bathymetry surveys were performed over an active lava flow field. We compare the time evolution of the hydro-acoustic events locations and bathymetry differences observed between each survey. While bathymetric information gives absolute location of new lava flows, hydro-acoustic events give detailed relative time variations leading to short-term spatial evolution. Bathymetric information thus provides snapshots of the eruptive area evolution at specific times, when hydro-acoustic signals show its continuous evolution. By combining both complementary analyses we are able to clearly define the detailed evolution of the lava flows pattern in the short time period of 10 days. Applied to the data already acquired on Mayotte since 2019, this method could allow us to estimate more precisely the volcano effusion rate and its evolution, giving further insights on the feeding system.
The majority of volcanism on Earth occurs underwater, under hundreds to thousands of meters of sea water. Submarine volcanoes are particularly difficult to study due to lack of access. Their activity can remain unknown because the seafloor, of which only 20% had been mapped in 2021 (GEBCO, 2021), is largely invisible and unreachable. Unless the products of the eruption get close to the surface, satellite can not be of any help.
Like volcanoes on land, submarine volcanoes generate various seismic signals that give indication about magma sources, propagation and eruptive processes (McNutt and Roman, 2015). Because submarine eruptions are often far away from land (for example, along mid-ocean ridges), common land-based monitoring means (e.g. seismicity, deformation) have limited performances due to distance. These eruptions also generate signals that propagate through the water column. A wide variety of hydro-acoustic signals emitted by active submarine volcanoes can be recorded at sea and are part of the global oceanic soundscape (Yun et al., 2021). They range from high frequency bubbling noise in shallow waters (Longo et al., 2021) to broadband explosion signals in deep waters (Haxel and Dziak, 2005; Dziak et al., 2008). Eruption can also generate long-duration low-frequency tremor (Dziak et al., 2008; Heaney et al., 2013). Such hydro-acoustic signals, generated through different processes (earthquakes, landslides, lava-water interactions, explosions), are transmitted into the water column and can be recorded in near field by Ocean Bottom Seismometers (OBS), by moored hydrophones in near and far field, or through converted T-waves by shore-based seismic stations. Tepp and Dziak (2021) showed that, since 1939, 47% of the 119 submarine eruptions reported in the literature were detected thanks to hydro-acoustics recordings around the world. 82% of those 119 eruptions were associated with land-based detections and half of these detections were based on the study of T-waves when they reach the shorelines.
Once discovered, some active submarine volcanoes are then studied with marine surveys, to confirm their existence and understand their mechanism. During these surveys, in situ methods are performed to observe and characterize the detected activity (e.g. with towed cameras, dredges, profiling CTDs). One of the main method is to perform repeated swath bathymetry campaigns with a multi beam echo sounder (MBES). The resulting seafloor topography maps can be compared in order to identify and constrain the extent of morphological changes (Chadwick et al., 1991; Fox et al., 1992; Caress et al., 2012; Carey et al., 2018). In volcanic contexts, negative depth changes are interpreted as collapse or landslides (Chadwick et al., 2008; Watts et al., 2012), and positive depth changes are interpreted as new volcanic material (e.g. volcaniclastic deposits, lava flows or edifices, Clague et al., 2011; Chadwick et al., 2019; Feuillet et al., 2021). When possible, underwater vehicles, autonomous - AUV or remotely operated - ROV, are used to acquire swath bathymetry with higher resolution. AUV and ROV navigate much closer to the seafloor, yielding bathymetry with ∼1 m lateral resolution, but can only survey a limited surface. Ship-based MBES surveys can cover a much wider surface, but their lateral resolution is limited to tens of meters in deep waters.
Several volcanoes have been discovered and studied with these combined methods. In the early 1980s, the mapping of the Juan de Fuca ridge, off the coast of Oregon (United States of America), led to the discovery of Axial Seamount volcano (Delaney et al., 1981). Since then, this active volcano has been intensively studied. In 2006, several OBS were moored nearby and regularly recovered. Those instruments allowed the understanding of the 2011 eruption timing and the reconstruction of the precursory phase (Dziak et al., 2012). In 2014, the Ocean Observatories Initiave [OOI, (Kelley et al., 2014)] deployed a permanent cabled network of instruments around Axial Seamount, including OBS equipped with hydrophones. In 2015, an eruption and its signals were recorded in real-time by the network (Wilcock et al., 2016). The hydro-acoustic signals were located on the north rift zone, 10 km away from the main caldera. This led to a marine survey a few month later that mapped fresh lava flows with ship-based MBES. Higher resolution maps were also acquired using an AUV-based MBES. These surveys showed that lava flows were spread over 19 km along the main caldera and the north rift zone (Chadwick et al., 2016; Clague et al., 2017), and their location matched the hydro-acoustics events locations. Using both bathymetry difference maps and the hydrophone recordings, Le Saout et al. (2020) were then able to reconstruct the eruption dynamics and quantify the lava propagation rates and edifice constructions.
Similarly, in the south-west of the Pacific Ocean, the West Mata submarine volcano, part of the Mata volcanic chain is also frequently erupting and used as an underwater volcano laboratory to better document and understand deep sea eruptions. With 11 bathymetry surveys performed on site since 1996, the different morphological changes on West Mata have been mapped (Clague et al., 2011; Embley et al., 2014; Chadwick et al., 2019). In May 2009, a combination of close-distance hydrophone, in-situ ROV videos and ship based surveys allowed the recording and understanding of deep-sea active degassing and explosive activity (Dziak et al., 2015).
These studies showed that hydro-acoustic signals recordings combined with MBES surveys can help reconstruct eruption dynamics, which is crucial in submarine contexts where continuous visual observation is difficult to achieve.
East of Mayotte island, in the Comoros archipelago, a major eruption started in 2018, preceded by strong seismic activity in May of that year (Cesca et al., 2020; Lemoine et al., 2020). An oceanographic cruise conducted in May 2019 [Mayobs1, (Feuillet, 2019)] led to the discovery of a new volcanic edifice (named Fani Maoré) 50 km south east of the island (Feuillet et al., 2021). Many efforts are made to monitor the activity by a reinforced land network of seismic stations and oceanographic cruises (REVOSIMA, 2021), to understand the current volcanic activity as well as past activity. Amongst these methods, OBS stations are regularly installed and their data analyzed (Saurel et al., 2022). Multi-Beam Echo Sounder (MBES) measurements are also performed to study the building of the volcanic structure (Deplus et al., 2019).
We analyzed the data recorded by the hydrophone channel of a set of OBS stations distributed along a 100 km-long line from Petite-Terre to the south-west, with a 10 km inter station distance (Figure 1). They were deployed between October 7 and October 17, 2020. The closest instrument was only a few kilometers south from the active lava flows (blue patch on Figure 1). During this deployment, a scientific cruise [Mayobs15, (Rinnert et al., 2020)] was conducted on board French R/V Marion Dufresne with MBES profiling over the Fani Maoré volcano and its surroundings. Successive bathymetry surveys revealed that the eruption was ongoing all along the duration of the cruise, in an area north-west of the main edifice, hereafter named the TikTak area. Their careful analysis allowed to recover very fine depth changes between each survey and to map the location of volcanic activity on the seafloor at several times between October 7 and October 17.
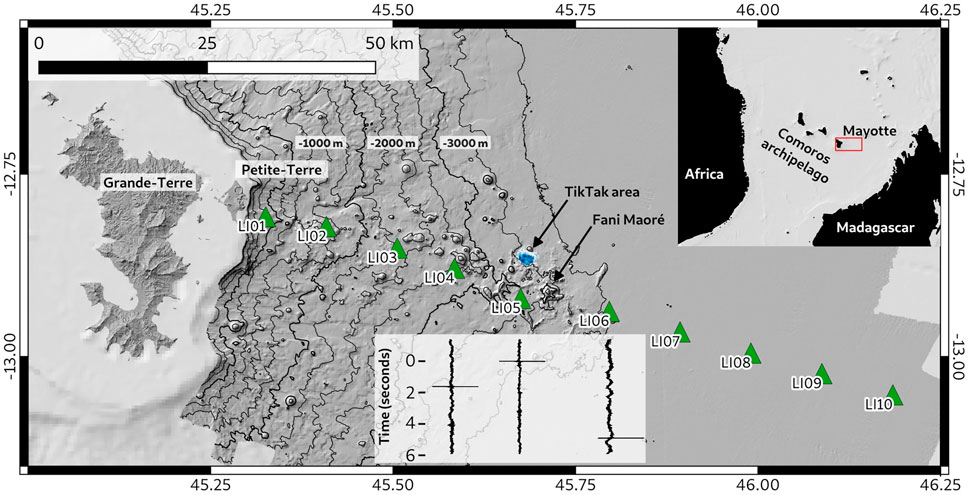
FIGURE 1. Bathymetry (Feuillet et al., 2019) of the eastern Mayotte submarine volcanic area with depth contours every 1000 m (thick contours) and 250 m (light contours). The green triangles represent the line of OBS deployed from October 7 to October 17, 2020. The new volcanic edifice (Fani Maoré) lies at the eastern tip of the volcanic chain, close to LI05. The TikTak volcanic area, active during the deployment, is shown in blue. Top right insert: regional setting of the Comoros archipelago, north of Mozambique Channel, between Africa and Madagascar. Insert below the stations: example of an hydro-acoustic event recording, synchronized with LI05 first arrival.
We show in this paper that bathymetry surveys can quantify the overall extent of new lava flows, which is not possible using hydro-acoustic monitoring alone. On the other hand, hydro-acoustic monitoring can track the relative evolution of the activity in time with hourly details and metric spatial resolution, which cannot be attained with the limited spatial resolution and the sporadic recurrence of bathymetry surveys. Combining the two methods allowed to recover absolute and fine information of the lava flow evolution of the Mayotte eruption with high time resolution.
We present in this section the methodologies used to map bathymetry changes and to extract hydro-acoustic signals source locations.
During Mayobs15 cruise, several bathymetry surveys of various quality were carried out. A high quality survey of the whole Fani Maoré volcano and its surroundings, made up of east/west and north/south lines, was performed on October 9 and 10. On October 22, a set of 4 good quality lines was also acquired over the active lava flows field. In between, good quality profiles were acquired on the same area on October 12 and 17, as well as an additional transit line on October 14. Another transit line has been collected before the October 9–10 survey, on October 6.
R/V Marion Dufresne is equipped with a Kongsberg EM122 MBES (12 kHz, 1° × 1° beam width). Good quality lines are conducted at low speed (5–6 knots), the swath bathymetry width is cut at 50° for both starboard and portside and adjacent lines overlap from central to external beams. Thanks to these acquisition standards, the MBES vertical accuracy can be constrained to 0.2–0.3% of the water depth. All bathymetry data are processed using the GLOBE software (Poncelet et al., 2019), according to a single and common workflow, resulting in standardized grids for depth changes analysis. Due to the depth of the area (∼3000 m) and thanks to the redundancy of the soundings, the data can be gridded down to a 30 m cellsize. For each pixel, a standard deviation layer (based on the valid soundings in the cell) is computed: for low slopes, at 3000 m water-depth, it does not exceed 4 m, which support a robust analysis of thin new morphological features. As a result of this statistical analysis, we consider that changes in bathymetry exceeding 5 m in elevation over a minimum of 3x3 pixels surface in flat areas are the result of new lava flows.
In addition, the MBES acquisitions are regularly calibrated in an area known for being stable, outside of the eruption site. A statistical analysis of the differences between two successive grids is performed: the vertical bias between the two surveys can be identified and corrected as an average level in bathymetry differences; moreover, resulting standard deviation over such a stable area helps for validating observations. Low quality data, that do not permit to accurately quantify small depth changes, can however be used to track-down the moving main spot of volcanic activity on the seafloor if they form a coherent unit with elevation differences above the 5 m threshold.
Finally, after computing differences between the bathymetry grids in the TikTak area, outlines of areas with reliable depth changes between two successive surveys have been designed using the 5 m threshold (Figure 2). Their locations were confirmed by analysing bathymetry differences between the high quality surveys of October 9–10 and 22.
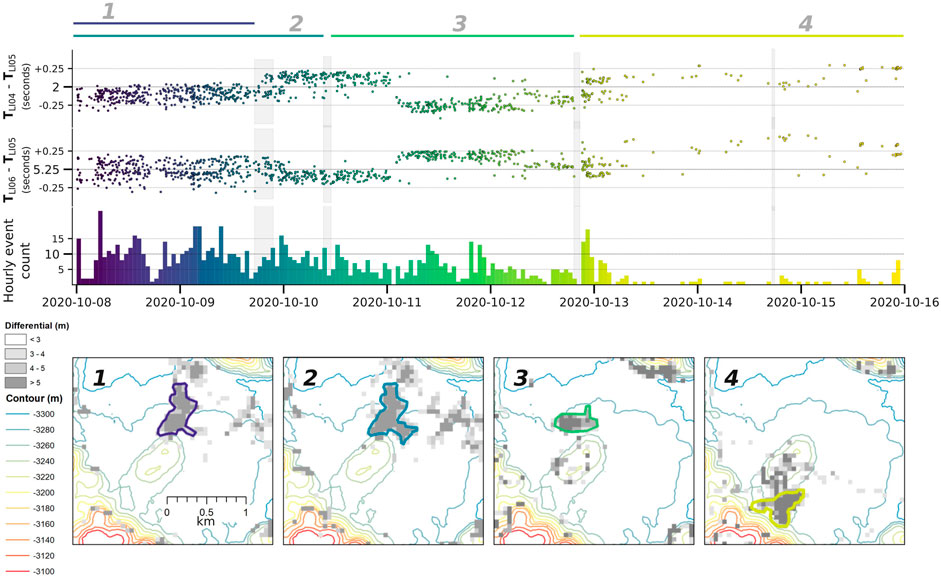
FIGURE 2. Top panel: time span corresponding to each bathymetry difference map. Hydro-acoustic events arrival time differences between LI04 and LI05 and between LI06 and LI05. Middle panel: hourly number of hydro-acoustic events detected from October 8 to October 16. The gray vertical bars indicate the occurrence of each MBES survey used to produce elevation difference maps. Bottom panel: maps of the TikTak area showing depth differences greater than 3 m (gray scale) between MBES surveys (1: October 6–9; 2: October 6–10; 3: October 10–12; 4: October 12–17). The same color is used on the maps to outline the reliable depth differences interpreted as new volcanic material.
The waves emitted at underwater eruption sites propagate upwards in the water column and can later reflect at the ocean surface and the seafloor. They can be recorded by hydrophones located in the water column or on the seafloor. In Mayotte, Bazin et al. (2021) showed the distinct signature of these signals using hydrophones moored in the SOFAR (SOund Fixing and RAnging) channel. Part of the hydro-acoustic energy is also converted into seismic waves and is transmitted in the Earth crust. Indeed, some geophones of the OBS array recorded such signals but their data analysis is more complex.
Among the 10 OBS, LI05 was the closest to the active lava flows at the time of deployment and therefore served as reference. We chose here to only use the 3 closest OBS (LI04, LI05 and LI06) to analyse the best waveforms (highest signal to noise ratios).
The continuous records were manually scanned to identify hydro-acoustic events by the REVOSIMA seismology group during a pickathon (Saurel et al., 2022). These events are characterized by a short and impulsive signal, and several seconds time-delay between stations (Figure 1) due to the slow propagation of the hydro-acoustic waves through water at ∼1500 m/s. This led to a manual catalog of 1328 events. Because the bathymetry difference maps do not show any significant changes between October 14 and 17 and because very few events occurred on October 16, we chose to limit our analysis up to the end of October 15.
For each event we automatically picked the first arrival on the hydrophone record, in a 25 s data-window. After detrending the signals, we filtered them above 1.5 Hz to remove unwanted long-period noise. On each station, the absolute maximum value of the trace was picked and labelled as the first arrival. This first arrival corresponds to an acoustic wave propagation with a single reflection on the ocean surface.
To locate the sources, we performed a grid search to fit the inter-station arrival time differences. We generated synthetic time-arrivals on a 10 m grid on the seafloor by using NonLinLoc Time2EQ software (Lomax, 2008). The travel-time tables for a signal reflected on the ocean surface were calculated using the Pirocko Cake library (Heimann et al., 2017). We used a 1D velocity model derived from a CTD profile (conductivity, temperature, depth) on the volcano acquired during Mayobs1 (Feuillet, 2019). We calculated the two synthetic arrival time differences between LI04 and LI06, respectively, and the reference LI05 station. Our location result corresponded to the grid point where we minimized the residuals root mean square between observed and synthetic arrival-time differences. We also tested a simpler global 1D velocity model to assess how sensitive our locations were compared to water celerity. We noted that it did not produced a significant variation in the absolute locations.
The OBS stations location on the seafloor could not be determined and we only knew the ship position during the instrument deployment and its recovery, with an accuracy of 10 m. Since there are strong oceanic currents around Mayotte, the OBS can drift several hundred of meters during its descent and ascent. Indeed, we observed that the distances between deployment and pick up locations varied between 300 m and 900 m. To estimate the influence of the OBS location uncertainty on our location results, we calculated the locations of all the events of our catalog using 5 different locations for each of the 3 OBS (Figure 3A). The 5 locations were uniformly spread between deployment and recovery points for each instrument and they led to 125 sets of OBS array configurations.
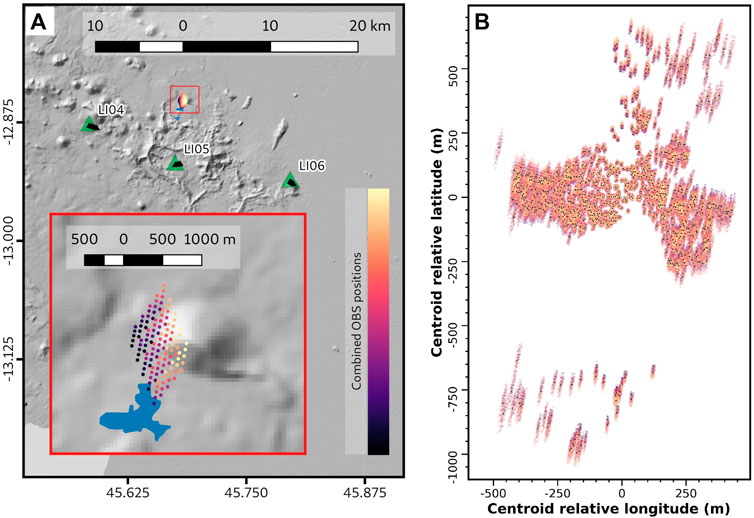
FIGURE 3. (A): Centroid of the source locations computed with each of the 125 OBS network configurations (represented with the color scale). The green triangles represent the deployment locations of the three stations we used. The black triangles on top represent the station location variations we tested. The insert shows a zoom on the events locations (red square). The blue patch corresponds to the area of reliable depth changes deduced from MBES surveys over the whole survey. (B): Events locations (color dots for each event) relative to the centroid point for all the network configurations. The color scale indicate the set of OBS positions used.
Our results (Figure 3A) show that absolute source locations greatly depend on the OBS positions and are spread over ∼0.7 km square. Moreover, these absolute locations are not collocated with the mapped changes of bathymetry (Figure 3A insert) and are always located north of the mapped lava flows. Relative positions can be obtained by removing the centroid of the events from each set built with the 125 station configurations (Figure 3B). While the absolute locations differ, the relative variations between events remain consistent for all configurations of stations. The relative variations are limited to 7 m in longitude and 26 m in latitude for 95% of the events. Consequently, we can translate the centroid of the events to match the contour of the sea-floor bathymetry changes identified with the MBES surveys, in order to analyze the relative variations of the locations with time.
In the next sections, we refer as source location, the average position of the events obtained with the 125 station distributions.
Between October 7 and 17, 2020, various periods of activity can be identified through both hydro-acoustic signals and bathymetry analysis (Figure 2).
Relative time arrivals of the hydro-acoustic events between different stations (Figure 2) and the resulting relative locations of the hydro-acoustic events (Figure 4) show both progressive and sudden migrations. Simultaneously, bathymetry analysis shows the evolution of the lava flow pattern (Figures 2, 4).
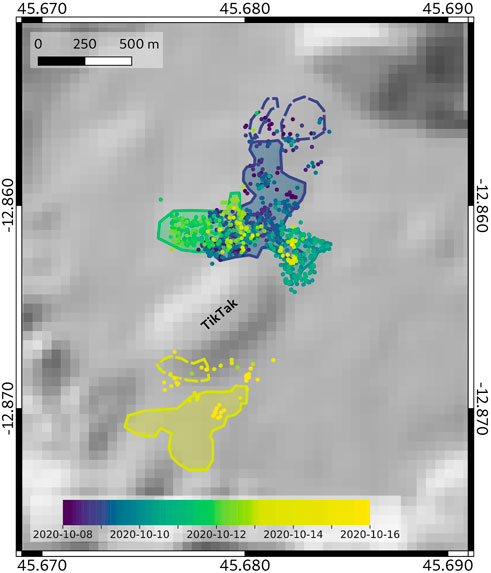
FIGURE 4. Locations of hydro-acoustic events superimpoed on bathymetry differences contours. Same colorscale as in Figure 2. Dots show the hydro-acoustic events relative locations. Plain lines contours are the outlines of reliable depth differences from Figure 2 interpreted as new lava flows. Dashed contours show the outlines of questionable depth changes, that we further confirmed as new volcanic material thanks to hydro-acoustic events relative locations.
The bathymetry differences highlight 3 different areas of morphology changes during the period of study (Figure 2, bottom panels). They were located at the north and at the south of the elongated mount named TikTak (Figure 4). Until October 10 around 12:00 UTC, the activity was concentrated in the north of the area, with some late extension towards the south eastern tip. Between October 10 and October 13, the activity shifted to the south west of the previously active zone. Starting from October 13, depth changes were only present in the south of the area, about 1 km away from the other active zones we highlight.
Relative hydro-acoustic event locations evolution adds insight into the short time evolution of the lava flows. Figure 2 shows the evolution of arrival times, number of events and depth changes during the 8 days of the study. On the upper panel, we show the evolution of the arrival time difference between stations LI04 (and LI06) and the reference station LI05. We can see that the extension of activity to the eastern tip of the northern patch at the end of October 9 happened gradually. In contrast, on October 11, the western patch started being active quite suddenly. The arrival time differences show a clear shift in average values compared to the previous activity period followed by a smooth and rapid variation during the first hours. On October 13, hydro-acoustic events migrated sharply again, which is consistent with the migration of the areas of significant depth changes to the south.
Figure 4 shows that some hydro-acoustic events occured outside the contours defined by reliable depth changes (plain lines). On the eastern tip, which was active at the end of October 10, the event locations were more extended than the bathymetry contours, suggesting areas covered with lava flows thinner than our depth change threshold. In the north, they seemed to correspond to some cluster of pixels indicating bathymetry differences (blue dashed contour, Figure 4). These pixels were located at the edge of the bathymetry swath and were difficult to discriminate from noise. Swath bathymetry data standard deviations are also higher in areas with high slopes. Consequently, the depth differences observed at the southern edge of the TikTak mount (yellow dashed contour, Figure 4) had not been initially associated with reliable changes in bathymetry. However, during this period of sparse activity (hourly events count, Figure 2), some hydro-acoustic events were located on the southern edge of TikTak, which suggests that the southern dashed contour (Figure 4) also bounds a real bathymetry change.
The hydro-acoustic events activity varied during the period of study. The northern lava flows was the most active, with around 10 to 15 events per hour. The number of events decreased when the lava flows expanded toward the east, but regained in intensity again when the western area suddenly became active. This could be an indication that the strength of activity and the lava flow rate (expected to be higher at the onset of a new outbreak) are correlated.
As discussed in the Materials and methods section, the results of the absolute locations of the hydro-acoustic events vary with station locations. As explained by Le Saout et al. (2020) the sea-floor topography and variations in the water celerity also have an influence on hydro-acoustic waves propagation. Our approximation of this parameters was then transferred to the absolute localization results of the hydro-acoustic events. However, we showed that localizing their relative positions is robust against uncertainties in the positions of the recording stations. Thus, hydro-acoustic events can be used to study the temporal evolution of lava flows.
On the other hand, maps of bathymetry differences give correct absolute locations but integrate all the differences over the time window between two surveys. Maps of bathymetry differences are not able to show the temporal evolution of what happened between the surveys. Consequently, bathymetry surveys and hydro-acoustic events location are very complementary. By combining both methods, we are able to observe short-term variations of the lava flows of the Mayotte eruption between October 8 and 16. While the flows can progressively extend through an area, the volcanic activity location can also suddenly change, as we showed in the previous section (Figure 2). This highlights that the eruption was not a steady and continuous process with a single lava outbreak on the seafloor, even if it might have been fed by a single dyke. Furthermore, like on onland volcanoes, lava outputs cool at some locations, closing the active outbreak, and the lava finds new paths toward the seafloor, either via lava tunnels or shallow propagation from the main dyke.
Areas with high variations in slopes scatter the echo-sounder beams in multiple directions, leading to false bathymetry differences. Similarly, the edges of the bathymetry swath are noisy and generate artifacts on bathymetry difference maps. Consequently, it makes it difficult to distinguish small real bathymetry changes from noisy signals. When coupled with the hydro-acoustic event relative locations, such small questionable differences can be confirmed (or not) as new areas of volcanic activity. Hydro-acoustic event locations and analyses of depth changes are complementary to give information on the evolution of the lava flows through time and thus the eruption dynamic. Consequently, lava flows starting and ending times can be narrowed down to the hour. We showed in this study that areas that were considered doubtful during the bathymetry analysis (southern rim of the TikTak structure and north of the area) were real zones of recent volcanic activity, using hydro-acoustic events location.
In the past 20 years, two main mechanisms have been proposed to explain hydro-acoustic impulsive signals generated at submarine volcanoes. They could either result from rapid expansion and explosion of cold water entrapped into the molten lava: depending on the water depth, cold water can be heated to steam (Caplan-Auerbach et al., 2017) or supercritical state (Schipper and White, 2010). Or, the impulsive signals could be generated by gas bubbles: gas-rich magma exsolves bubbles (Clague et al., 2003) which can burst in shallow waters or implode in deeper waters (depending on the gas critical point).
The hydro-acoustic sources we recorded near Mayotte were very impulsive. The instrument 250 Hz sampling rate can theoretically recover signals with a frequency content up to 125 Hz. However, with a signal length typically shorter than 0.05 s, the impulsive events were recorded with less than 10 samples. Consequently, we were not able to reliably recover their complete frequency content, which is likely above 50 Hz. This frequency content seems however comparable with the hydro-acoustic signals analysed by Le Saout et al. (2020) that present a similarity between them up to high frequencies between 50 and 100 Hz. Because we could not recover the complete frequency band of the signal, we cannot know if we recovered the correct polarity of the dominant source. This polarity would give information on whether the source of the hydro-acoustic signals was explosive (starting with compression) or implosive (starting with decompression).
There is a debate whether explosive sources are possible in deep water. Depending on salinity, the critical point of sea-water, where water-vapour phase in not possible anymore, is between 295 and 302 bars (Bischoff and Rosenbauer, 1984), which corresponds to a depth of 3000 m (Fofonoff and Millard, 1983). Since the active area near Mayotte is deeper than 3200 m (Figure 2 lower panels), it is supposed that sea-water cannot exist in the vapour phase. In that case, a steam-burst explosive type source as evidenced at 1600 m depth on Axial Seamount during 2015 eruption (Caplan-Auerbach et al., 2017) would not be compatible with Mayotte eruption depth. However, Schipper and White (2010) demonstrated that lava could heat entrapped sea-water to supercritical state at depth below 3000 m with a rapid phase transition allowing explosive sources. More recently, Dürig et al. (2020) showed that induced fuel-coolant process (IFCI, that do not involve any vapour phase) are very effective in deep ocean and produce fine ash at explosive rate on the lava-water boundary. Such highly effective fragmentation process could produce numerous impulsive hydro-acoustic signals at the lava-water boundary. Another explanation could involve CO2 or other volcanic gases. Clague et al. (2003) proposed that supercritical CO2 bubbles exsolved from the magma quickly collapse into liquid CO2 when the bubble cools down. Cui et al. (2016) showed the existence of cavitation when bubbles collapse and rebound, generating pressure pulse at each collapse and rebound. Bubble collapse, whether they are produced by exsolved CO2 or other volcanic gases, would produce repetitive implosive hydro-acoustic signals. The June 2019 fresh lava samples (Fouquet and Feuillet, 2019) from the second phase of the eruption showed a significant amount of vesicularity and some of them still contained vesicle-trapped volatiles (popping rocks) when brought on-board (Berthod et al., 2021). Assuming the lava composition from 2020 TikTak lava flows was similar, a high vesicularity, compatible with a high volatile content, could be in favor of underwater implosions driven by rapidly cooling gas bubbles.
Preliminary analysis of the speed of the hydro-acoustic sources migration during October 12th shows velocity values around 0.0044 m/s (Green to yellow zone in Figure 4). Those values are similar to the lowest flow front velocities estimated by Le Saout et al. during 2015 eruption on Axial Seamount and interpreted as corresponding to the latest stages of the activity. On Fani Maoré volcano, the volcanic activity we described happened more than 2 years after the beginning of the eruption (Mittal et al., 2022) and the low flow-front velocities could correspond to the latest stages of the eruption.
Combining the repeated swath bathymetry surveys with the continuous OBS hydrophone records can give insights into the eruption evolution and constrains the time boundaries of its lava flow activities at the hour level. We showed three cases where hydro-acoustic events helped confirm small bathymetry changes. When only ship-based bathymetry is available, outlines of the new lava flows can also be made more finely thanks to hydro-acoustic events relative locations and this will have consequences on the emitted volumes estimation. This information can then be used to estimate the lava flow extrusion rate with an accuracy and precision greater than with bathymetry alone, and have a better idea of the eruption mechanism and dynamics.
We show the success of this methodology for a 8-days time window. In the next steps, the hydro-acoustic events will be analyzed using the OBS data recorded since early 2019 near Mayotte and compared with bathymetric surveys performed during the successive Mayobs campaigns (Feuillet et al., 2019). Since events cannot be picked manually for such long term records, on-going work focuses on the automatic detection and classification of hydro-acoustic events. Simultaneously, work is being done to reconstruct the phases of the eruption and to estimate the volumes of new material and flow rates throughout the eruption from the repeated bathymetric surveys near Mayotte (Deplus et al., 2019).
The datasets analyzed for this study can be found in the Sismer Mayobs15 (Rinnert et al., 2020; http://data.ifremer.fr/SISMER) and Volobsis (REVOSIMA, 2021; http://volobsis.ipgp.fr) repositories upon request.
J-MS, LR, CD, BL and DP contributed to conception and design of the study. DP, BL, RB and CD performed the bathymetry analysis. J-MS, LR, MF, NK and VF performed the hydro-acoustic events analysis. SB helped interpreting the hydro-acoustic signals. J-MS and LR wrote the first draft of the manuscript. CD and BL wrote the MBES method section. PG performed the OBS deployment, data conversion and quality assessment. MM designed the OBS deployment. The REVOSIMA seismology group manual picked the hydro-acoustic events. The REVOSIMA bathymetry group designed the MBES data processing protocol and assessed the accuracy and resolution limits. All authors contributed to manuscript revision, read, and approved the submitted version.
Since June 2019, Mayotte eruption monitoring is funded by le Ministère de l’Enseignement Supérieur, de la Recherche et de l’Innovation (MESRI), le Ministère de la Transition Ecologique (MTE) and le Ministère des Outremers (MOM) with the support of le Ministère de l’Intérieur (MI) and le Ministère des Armées (MINARM) through the REVOSIMA (REVOSIMA, 2021).
J-MS and LR thank William Chadwick, William Wilcock and David Clague for fruitful discussions on impulsive hydro-acoustic events possible sources at the beginning of the project. The authors thank Genavir and Louis Dreyfus Armateur crews who operated the R/V Marion Dufresne Mayobs15 survey and the cruise leaders (Emmanuel Rinnert, Isabelle Thinon and Nathalie Feuillet). Members of the REVOSIMA Seismology group who picked the hydro-acoustic events that have been used in this study: Chastity Aiken, Sara Bazin, Kévin Canjamalé, Océane Foix, Cyprien Griot, Aude Lavayssière, Nicolas Mercury, J-MS. REVOSIMA Bathymetry group: Jean-Marie Augustin, Patrick Bachèlery, Sylvain Bermell, Christine Deplus, Nathalie Feuillet, Jean-Christophe Komorowski, Elodie Lebas, Anne Le Friant, Benoît Loubrieu, Fabien Paquet, Delphine Pierre, Emmanuel Rinnert, Carla Scalabrin, Isabelle Thinon. Numerical computations of hydro-acoustic events location were performed on the S-CAPAD/DANTE platform, IPGP, France.
The authors declare that the research was conducted in the absence of any commercial or financial relationships that could be construed as a potential conflict of interest.
All claims expressed in this article are solely those of the authors and do not necessarily represent those of their affiliated organizations, or those of the publisher, the editors and the reviewers. Any product that may be evaluated in this article, or claim that may be made by its manufacturer, is not guaranteed or endorsed by the publisher.
Bazin, S., Royer, J.-Y., Dubost, F., Paquet, F., Loubrieu, B., Lavayssière, A., et al. (2021). Initial results from a hydroacoustic network to monitor submarine lava flows near Mayotte island. Comptes Rendus Géoscience. (accepted). doi:10.5802/crgeos.119
Berthod, C., Médard, E., Bachèlery, P., Gurioli, L., Di Muro, A., Peltier, A., et al. (2021). The 2018-ongoing Mayotte submarine eruption: Magma migration imaged by petrological monitoring. Earth Planet. Sci. Lett. 571, 117085. doi:10.1016/j.epsl.2021.117085
Bischoff, J. L., and Rosenbauer, R. J. (1984). The critical point and two-phase boundary of seawater, 200–500°C. Earth Planet. Sci. Lett. 68, 172–180. doi:10.1016/0012-821X(84)90149-3
Caplan-Auerbach, J., Dziak, R., Haxel, J., Bohnenstiehl, D., and Garcia, C. (2017). Explosive processes during the 2015 eruption of axial seamount, as recorded by seafloor hydrophones. Geochem. Geophys. Geosyst. 18, 1761–1774. doi:10.1002/2016gc006734
Caress, D., Clague, D., Paduan, J., Martin, J., Dreyer, B., Chadwick, W., et al. (2012). Repeat bathymetric surveys at 1-metre resolution of lava flows erupted at Axial Seamount in April 2011. Nat. Geosci. 5, 483–488. doi:10.1038/ngeo1496
Carey, R., Soule, S. A., Manga, M., White, J. D., McPhie, J., Wysoczanski, R., et al. (2018). The largest deep-ocean silicic volcanic eruption of the past century. Sci. Adv. 4, e1701121. doi:10.1126/sciadv.1701121
Cesca, S., Letort, J., Razafindrakoto, H. N., Heimann, S., Rivalta, E., Isken, M. P., et al. (2020). Drainage of a deep magma reservoir near Mayotte inferred from seismicity and deformation. Nat. Geosci. 13, 87–93. doi:10.1038/s41561-019-0505-5
Chadwick, W., Wright, I., Schwarz-Schampera, U., Hyvernaud, O., Reymond, D., and De Ronde, C. (2008). Cyclic eruptions and sector collapses at monowai submarine volcano, kermadec arc: 1998–2007. Geochem. Geophys. Geosyst. 9. doi:10.1029/2008gc002113
Chadwick, W. W., Embley, R. W., and Fox, C. G. (1991). Evidence for volcanic eruption on the southern juan de fuca ridge between 1981 and 1987. Nature 350, 416–418. doi:10.1038/350416a0
Chadwick, W. W., Paduan, J. B., Clague, D. A., Dreyer, B. M., Merle, S. G., Bobbitt, A. M., et al. (2016). Voluminous eruption from a zoned magma body after an increase in supply rate at axial seamount. Geophys. Res. Lett. 43, 12063–12070. doi:10.1002/2016GL071327
Chadwick, W. W., Rubin, K. H., Merle, S. G., Bobbitt, A. M., Kwasnitschka, T., and Embley, R. W. (2019). Recent eruptions between 2012 and 2018 discovered at west mata submarine volcano (ne lau basin, sw Pacific) and characterized by new ship, auv, and rov data. Front. Mar. Sci. 6. doi:10.3389/fmars.2019.00495
Clague, D. A., Davis, A. S., and Dixon, J. E. (2003). Submarine strombolian eruptions on the gorda mid-ocean ridge. Explos. Subaqueous Volcanism, 111–128. doi:10.1029/140gm07
Clague, D. A., Paduan, J. B., Caress, D. W., Chadwick, W. W., Le Saout, M., Dreyer, B. M., et al. (2017). High-resolution auv mapping and targeted rov observations of three historical lava flows at axial seamount. Oceanogr. Wash. D. C). 30, 82–99. doi:10.5670/oceanog.2017.426
Clague, D., Paduan, J., Caress, D., Thomas, H., Chadwick, W., and Merle, S. (2011). Volcanic morphology of West Mata Volcano, NE Lau Basin, based on high-resolution bathymetry and depth changes. Geochem. Geophys. Geosyst. 12. doi:10.1029/2011gc003791
Cui, P., Zhang, A., and Wang, S. (2016). Small-charge underwater explosion bubble experiments under various boundary conditions. Phys. Fluids 28, 117103. doi:10.1063/1.4967700
Delaney, J. R., Johnson, H. P., and Karsten, J. L. (1981). The juan de Fuca ridge—Hot spot—Propagating rift system: New tectonic, geochemical, and magnetic data. J. Geophys. Res. 86, 11747–11750. doi:10.1029/JB086iB12p11747
Deplus, C., Feuillet, N., Bachelery, P., Fouquet, Y., Jorry, S., Thinon, I., et al. (2019). Early development and growth of a deep seafloor volcano: Preliminary results from the mayobs cruises. AGU Fall Meet. Abstr. 2019, V43I–V0227.
Dürig, T., White, J. D., Murch, A., Zimanowski, B., Büttner, R., Mele, D., et al. (2020). Deep-sea eruptions boosted by induced fuel–coolant explosions. Nat. Geosci. 13, 498–503. doi:10.1038/s41561-020-0603-4
Dziak, R., Haxel, J., Bohnenstiehl, D., Chadwick, W., Nooner, S. L., Fowler, M., et al. (2012). Seismic precursors and magma ascent before the april 2011 eruption at axial seamount. Nat. Geosci. 5, 478–482. doi:10.1038/ngeo1490
Dziak, R. P., Bohnenstiehl, D. R., Baker, E. T., Matsumoto, H., Caplan-Auerbach, J., Embley, R. W., et al. (2015). Long-term explosive degassing and debris flow activity at west mata submarine volcano. Geophys. Res. Lett. 42, 1480–1487. doi:10.1002/2014GL062603
Dziak, R., Royer, J., Haxel, J., Delatre, M., Bohnensteihl, D., Matsumoto, H., et al. (2008). AGU Fall Meeting Abstracts, 2008. T51B–1888.Hydroacoustic detection of recent seafloor volcanic activity in the southern indian ocean
Embley, R. W., Merle, S. G., Baker, E. T., Rubin, K. H., Lupton, J. E., Resing, J. A., et al. (2014). Eruptive modes and hiatus of volcanism at West Mata seamount, ne lau basin: 1996–2012. Geochem. Geophys. Geosyst. 15, 4093–4115. doi:10.1002/2014gc005387
Feuillet, N., Jorry, S., Crawford, W., Deplus, C., Thinon, I., Jacques, E., et al. (2021). Birth of a large volcanic edifice through lithosphere-scale dyking offshore Mayotte (Indian Ocean). Nat. Geosci. 14, 787–795. doi:10.1038/s41561-021-00809-x
Feuillet, N., Jorry, S., Rinnert, E., Thinon, I., Fouquet, Y., Paquet, F., et al. (2019). Mayobs. doi:10.18142/291
Fofonoff, N., and Millard, R. (1983). Algorithms for computation of fundamental properties of seawater. UNESCO Tech. Pap. Mar. Sci. 44.
Fouquet, Y., and Feuillet, N. (2019). MD223/Mayobs4 cruise, Marion Dufresne R/V. doi:10.17600/18001238
Fox, C. G., Chadwick, W. W., and Embley, R. W. (1992). Detection of changes in ridge-crest morphology using repeated multibeam sonar surveys. J. Geophys. Res. 97, 11149–11162. doi:10.1029/92jb00601
GEBCO (2021). About the seabed 2030 project. Available at: https://seabed2030.org/about-us (Accessed 08 02, 2022).
Haxel, J., and Dziak, R. (2005). Evidence of explosive seafloor volcanic activity from the Walvis ridge, south atlantic ocean. Geophys. Res. Lett. 32, L13609. doi:10.1029/2005gl023205
Heaney, K. D., Campbell, R. L., and Snellen, M. (2013). Long range acoustic measurements of an undersea volcano. J. Acoust. Soc. Am. 134, 3299–3306. doi:10.1121/1.4818844
Heimann, S., Kriegerowski, M., Isken, M., Cesca, S., Daout, S., Grigoli, F., et al. (2017). Pyrocko: A versatile seismology toolkit for Python. doi:10.5880/GFZ.2.1.2017.001
Kelley, D. S., Delaney, J. R., and Juniper, S. K. (2014). Establishing a new era of submarine volcanic observatories: Cabling Axial Seamount and the endeavour segment of the Juan de Fuca ridge. Mar. Geol.Anniversary Spec. Issue 352, 426–450. doi:10.1016/j.margeo.2014.03.010
Le Saout, M., Bohnenstiehl, D. R., Paduan, J. B., and Clague, D. A. (2020). Quantification of eruption dynamics on the north rift at Axial Seamount, Juan de Fuca ridge. Geochem. Geophys. Geosyst. 21, e2020GC009136. doi:10.1029/2020gc009136
Lemoine, A., Briole, P., Bertil, D., Roullé, A., Foumelis, M., Thinon, I., et al. (2020). The 2018–2019 seismo-volcanic crisis east of Mayotte, Comoros islands: Seismicity and ground deformation markers of an exceptional submarine eruption. Geophys. J. Int. 223, 22–44. doi:10.1093/gji/ggaa273
Lomax, A. (2008). The NonLinLoc software guide. Mouans-SartouxFrance: ALomax Scientific. Available at: http://alomax.free.fr/nlloc.
Longo, M., Lazzaro, G., Caruso, C. G., Corbo, A., Scappuzzo, S. S., Italiano, F., et al. (2021). Hydro-acoustic signals from the Panarea shallow hydrothermal field: New inferences of a direct link with stromboli. London: Geological Society. Special Publications 519.
McNutt, S. R., and Roman, D. C. (2015). “Volcanic seismicity,” in The encyclopedia of volcanoes (Elsevier), 1011–1034.
Mittal, T., Jordan, J. S., Retailleau, L., Beauducel, F., and Peltier, A. (2022). Mayotte 2018 eruption likely sourced from a magmatic mush. Earth Planet. Sci. Lett. 590, 117566. doi:10.1016/j.epsl.2022.117566
Poncelet, C., Billant, G., and Corre, M.-P. (2019). Globe (global oceanographic bathymetry explorer) software.
REVOSIMA (Mayotte Volcanological And Seismological Monitoring Network) (2021). Institut de physique du globe de Paris (IPGP), Bureau de recherches géologiques et minières (BRGM), Institut français de recherche pour l’exploitation de la mer (IFREMER), and Centre national de la recherche scientifique (CNRS). Data collection of the Mayotte volcanological and seismological monitoring network (REVOSIMA). doi:10.18715/MAYOTTE.REVOSIMA
Rinnert, E., Thinon, I., and Feuillet, N. (2020). MD228/Mayobs15 cruise, Marion Dufresne R/V. doi:10.17600/18001745
Saurel, J.-M., Jacques, E., Aiken, C., Lemoine, A., Retailleau, L., Lavayssière, A., et al. (2022). Mayotte seismic crisis: Building knowledge in near real-time by combining land and ocean-bottom seismometers, first results. Geophys. J. Int. 228, 1281–1293. doi:10.1093/gji/ggab392
Schipper, C. I., and White, J. D. (2010). No depth limit to hydrovolcanic limu o pele: Analysis of limu from Lō`ihi seamount, Hawai`i. Bull. Volcanol. 72, 149–164. doi:10.1007/s00445-009-0315-5
Tepp, G., and Dziak, R. P. (2021). The seismo-acoustics of submarine volcanic eruptions. J. Geophys. Res. Solid Earth 126, e2020JB020912. doi:10.1029/2020jb020912
Watts, A., Peirce, C., Grevemeyer, I., Paulatto, M., Stratford, W., Bassett, D., et al. (2012). Rapid rates of growth and collapse of Monowai submarine volcano in the Kermadec arc. Nat. Geosci. 5, 510–515. doi:10.1038/ngeo1473
Wilcock, W. S. D., Tolstoy, M., Waldhauser, F., Garcia, C., Tan, Y. J., Bohnenstiehl, D. R., et al. (2016). Seismic constraints on caldera dynamics from the 2015 Axial Seamount eruption. Science 354, 1395–1399. doi:10.1126/science.aah5563
Keywords: hydro-acoustic analysis, bathymetric analysis, multi-beam echo sounder, submarine eruption, Mayotte, lava flows, ocean bottom seismometer
Citation: Saurel J-M, Retailleau L, Deplus C, Loubrieu B, Pierre D, Frangieh M, Khelifi N, Bonnet R, Ferrazzini V, Bazin S, Guyavarch P, Moulin M, REVOSIMA Seismology group and REVOSIMA Bathymetry group (2022) Combining hydro-acoustic sources and bathymetric differences to track the vent evolution of the Mayotte eruption, Mozambique Channel. Front. Earth Sci. 10:983051. doi: 10.3389/feart.2022.983051
Received: 30 June 2022; Accepted: 23 August 2022;
Published: 05 October 2022.
Edited by:
Tobias Dürig, University of Iceland, IcelandReviewed by:
Luis E. Lara, Servicio Nacional de Geología y Minería de Chile, ChileCopyright © 2022 Saurel, Retailleau, Deplus, Loubrieu, Pierre, Frangieh, Khelifi, Bonnet, Ferrazzini, Bazin, Guyavarch, Moulin, REVOSIMA Seismology group and REVOSIMA Bathymetry group. This is an open-access article distributed under the terms of the Creative Commons Attribution License (CC BY). The use, distribution or reproduction in other forums is permitted, provided the original author(s) and the copyright owner(s) are credited and that the original publication in this journal is cited, in accordance with accepted academic practice. No use, distribution or reproduction is permitted which does not comply with these terms.
*Correspondence: Jean-Marie Saurel, c2F1cmVsQGlwZ3AuZnI=
Disclaimer: All claims expressed in this article are solely those of the authors and do not necessarily represent those of their affiliated organizations, or those of the publisher, the editors and the reviewers. Any product that may be evaluated in this article or claim that may be made by its manufacturer is not guaranteed or endorsed by the publisher.
Research integrity at Frontiers
Learn more about the work of our research integrity team to safeguard the quality of each article we publish.