 Shuai Shi1,2
 Jinxian He1,2*
 Xiaoli Zhang1,2Hongchen Wu3Ziqi Yu4Jian Wang1,2Tiantian Yang1,2Wei Wang1,2
- 1Key Laboratory of Coalbed Methane Resource and Reservoir Formation Process, Ministry of Education, China University of Mining and Technology, Xuzhou, China
- 2School of Resources and Geoscience, China University of Mining and Technology, Xuzhou, China
- 3Institute of Geochemistry, Chinese Academy of Sciences, Guiyang, China
- 4School of Public Policy and Management, China University of Mining and Technology, Xuzhou, China
Studying complex pore structures and fractal characteristics of gas shale provides significant guidance for clarifying the mechanism of shale gas accumulation and realizing its efficient development. In this paper, 12 samples of Taiyuan Formation shale are used as the research object, and the fractal theory is combined with mercury intrusion porosimetry and N2 adsorption technology to innovatively solve the problem of splicing point selection, which can reveal the full-scale pore size distribution of shale. The results demonstrate that the most common types of pores in the chosen samples are pores between or within clay minerals, micropores and mesopores inside organic matter, and microfractures, based on scanning electron microscopy imagery analyses. The pores of shale samples have fractal geometries. The fractal dimension DM1 values in the mercury intrusion porosimetry experiments range from 2.3060 to 2.6528. Two fractal dimensions, DN1 and DN2, may be obtained using the Frenkel-Halsey-Hill fractal method. DN1 values vary from 2.4780 to 2.6387, whereas DN2 values range from 2.5239 to 2.7388. Most macropores in shale samples have a size range of about 0.2 mm, with a wide pore size distribution, and the largest peak of the micro-mesopore volume is generally about 50 nm. The fractal dimension correlates positively with the corresponding pore volume, although the correlation between volume and composition is weak. The relatively strong correlation between fractals and the basic compositions of shale proves the fractal theory’s relevance in defining pore inhomogeneity. This study would contribute to the development of a fractal perspective-based method for pore splicing while also expanding our understanding of pore morphology and structure in transitional shale.
1 Introduction
The world’s energy supply is undergoing a third significant transition, and many nations have aggressive energy development strategies in place to promote the quick advancement of this transition (Zou et al., 2020). To achieve carbon peak and neutrality goals, the focus of the energy in China will remain on stable supply, clean and low-carbon energy, and economic convenience in the long run while addressing the difficulty of upgrading for high-quality development (Dai et al., 2021). Natural gas is an indispensable, relatively clean, and efficient high-quality energy source for use in the process of energy structure transformation, and its demand will continue to expand in the future. Shale gas, a representative of unconventional gas, has emerged as one of the most essential natural gas resources in the last decades. Influenced by the rapid development of the shale gas industry in many countries (Jarvie et al., 2007), research and exploration of shale gas in China are also increasing.
Shale gas reservoirs are an integrated source and storage reservoir system, which means that large amounts of natural gas in them have a complex storage state (Curtis, 2002). Gas enrichment is strongly influenced by the shale features, including the content and type of organic matter (OM), mineral composition, and pore structure parameters such as specific surface area (SSA), pore volume (PV), and pore size distribution (PSD). The complex characteristics of pore structure type and evolution, which are usually dominated by nanometer- or micron-scale pores, have an important impact on the storage and seepage capacity of shale. The SSA, mainly attributed to micropores and mesopores, determines the storage potential of adsorbed gas, the PV of macropores influences the storage ability of free gas, and the diffusion and seepage capacity of shale gas is mainly controlled by the PSD (Li et al., 2019). Therefore, a detailed and in-depth study of the pore feature of shale reservoirs has important meaning for clarifying the mechanism of shale gas accumulation and developing shale gas resources.
Scholars have put forward a host of experimental methods to research the development characteristics of reservoir pores, including three types of methods: microscopic imaging methods, radiographic methods, and fluid injection methods. Specifically, they include scanning electron microscopy (SEM) (Jiao et al., 2014), atomic force microscopy (Chen et al., 2021a), helium ion microscopy (Wang et al., 2020), confocal laser scanning microscopy (Liu et al., 2020), computed tomography (Liu et al., 2021a), nuclear magnetic resonance (NMR) (Li et al., 2016), small-angle scattering (Sun et al., 2020), mercury intrusion porosimetry (MIP) (Li et al., 2021a), and low-temperature N2 adsorption (N2 adsorption) (Hu et al., 2019). Because of the complex pore structure of gas shale, various methods have limitations, and it is difficult to analyze the pore structure with a single method (Jiang et al., 2017). Therefore, scholars usually combine techniques to study shale pores (Chen et al., 2021b; Wang et al., 2021; Zhang et al., 2018). Due to their efficiency and extensive testing range, MIP and N2 adsorption are combination procedures that are frequently employed for quantitative pore characterization. However, the selection of splice points also has a significant impact on the collection of the full-scale PSD.
At present, there are three main methods of pore splicing, as follows: 1) From experience, three splicing points—25, 50, and 100 nm—are widely applied (Zhang et al., 2017; Xu et al., 2021); 2) According to the PSD image, the intersection of two curves or the midpoint of their parallel segments is usually selected for the splicing location (Xu et al., 2018); 3) The splicing point can be determined from an NMR T2 curve (Xiao et al., 2020; Zheng et al., 2019a). The problems with these methods are also obvious: For method 1, the splicing points are frequently chosen based on the splicing findings of similar lithologies or study areas, making the points chosen highly subjective. For method 2, it is very difficult to determine the splicing point since intersections or parallel segments often cannot be found, or there may be multiple intersections or parallel segments. For method 3, NMR experiments are relatively expensive, and there is no unified understanding of the T2 curve correction method, which essentially introduces another pore size characterization method.
The fractal method is typically used to examine patterns and characteristics that are self-similar but lack a distinctive length (Liu et al., 2019a). The microscopic pore structure of rock reservoirs has good statistical self-similarity and exhibits good fractal characteristics within a certain pore size range (Clarkson et al., 2013), which can be quantitatively described by the fractal dimension. N2 adsorption and MIP provide fast, efficient, and economical acquisition of fractal dimensions. A large body of scholarly work has found that fractal dimension can quantitatively characterize the non-homogeneity of reservoir pore structure, which is suitable for reservoir description and evaluation (Jiang et al., 2016; Liu et al., 2019b; Wang & Zai, 2021).
In this study, we conducted SEM morphology observation, MIP, and N2 adsorption analysis on the Taiyuan Formation shale collected from the Linxing area to obtain the morphological characteristics of the pores and quantitative parameters of the pore structure. The fractal dimensions of different pore ranges were calculated, which can be used to characterize the pore structure and inhomogeneity of the shale. An attempt is made to select suitable splicing points from the fractal perspective, and then to obtain full-scale PSD curves and PVs at each stage. Based on this, the relationship between fractal dimension, PV, and basic compositions of transitional shale, is discussed.
2 Geologic background
The Ordos Basin (Figure 1A) is located in the North China Craton (Li et al., 2021b). According to the basement material composition and structural characteristics, it can be divided into six subsidiary parts (Figure 1B) (Li et al., 2019). The Linxing area is located on the eastern edge of the Ordos Basin, and its structure is relatively simple (Figures 1B,C). Controlled by the Zijinshan magmatic rock intrusion and regional tectonic movement, the stratigraphic trend is NE–SW, with a dip of 5°–10° to the west (Xu et al., 2015; Shu et al., 2021). The paleogeographic evolution of the strata in the Ordos Basin underwent a transition from sea to land during the Late Paleozoic. In the Taiyuan stage, the study area’s sedimentary environment is the main barrier coastal sedimentary system (Figure 1D) (Shen et al., 2017). The Taiyuan Formation of the Upper Carboniferous is a major coal-bearing stratum in North China (Ju et al., 2017), mainly comprising grayish-black shale, silty mudstone, argillaceous siltstone, sandstone, micrite limestone, bioclastic limestone, and coal seams.
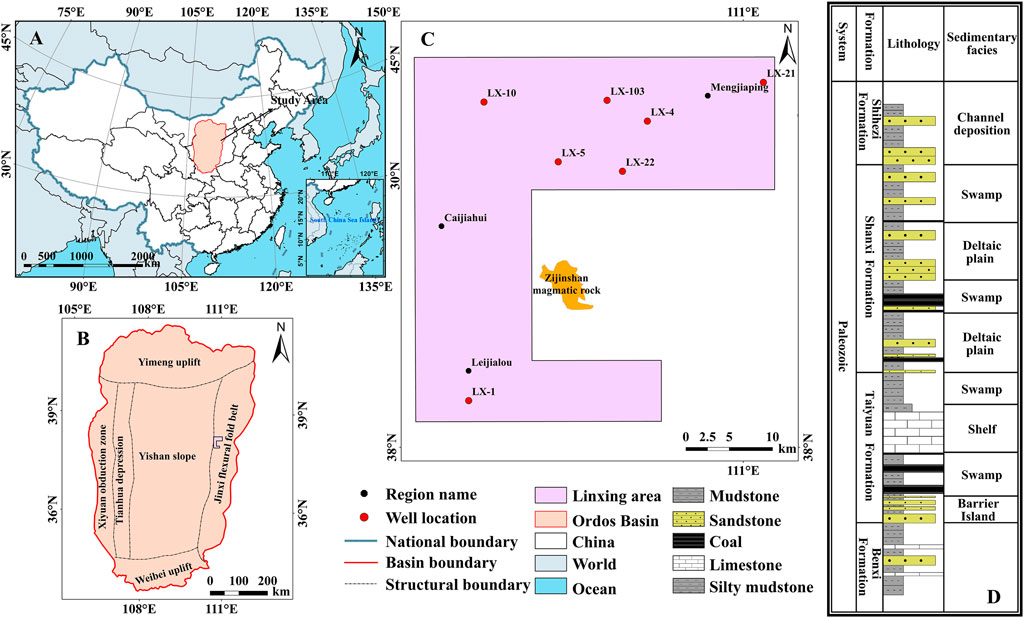
FIGURE 1. Geological settings of the Ordos Basin: (A) showing the location of the Ordos Basin; (B,C) showing the location of Linxing area and sampling well; (D) stratigraphic histogram of Shihezi Formation-Benxi Formation in Linxing area, modified after Li et al. (2016).
3 Samples and experiments
A total of 12 shale samples were collected from depths of 1659–2067 m in the Taiyuan Formation, and then the samples were crushed and divided into several parts to complete different experimental tests. Organic geochemical and mineralogical composition tests were used to clarify the developmental status of the samples. SEM was used to observe the pore morphology of each sample to obtain a visual understanding of the pore morphology, and MIP and N2 adsorption were used for quantitative and comprehensive analysis of the pore structure of the samples. The pore classification system of the International Union of Pure and Applied Chemistry (IUPAC) (Thommes et al., 2015) is widely applicable and comparable, so this scheme is used for the classification of pores in this paper.
3.1 Organic geochemical and mineral composition tests
Each sample was subjected to tests on its total organic carbon (TOC) concentration, OM type, vitrinite reflectance (Ro), and whole-rock X-ray diffraction (XRD) to determine its fundamental geochemical characteristics and mineral compositions. The TOC content was determined by a carbon/sulfur analyzer (multi EA4000, Analtik Jena, Germany). Microfraction microscopy was used to distinguish among the OM types, and the Ro was then measured using a matching photometer. The mineral compositions of the shale sample can be obtained by the XRD experiment (D8 ADVANCE, Bruker, Germany).
3.2 Scanning electron microscopy characterization
Using a scanning electron microscope (Quanta 250, FEI company, United States), we acquired SEM images of the microscopic pores. The SEM imaging on the fresh broken surfaces of the samples was conducted at 25°C and 35% relative humidity. The qualitative structural information of the microscopic pores was obtained from the acquired SEM images, see Section 4.2 for more detailed results.
3.3 Mercury intrusion porosimetry
The mercury intrusion analyses were done using a mercury porosimeter (Poremaster 60GT, Quantachrome Instruments, United States) at pressures up to 40,000 pounds per square inch absolute (psia; approximately 275.8 MPa). Crushed shale samples with diameters between 1 and 3 mm were prepared according to standard operating guidelines, and all samples were dried at a constant temperature of 100°C for 5 h before being tested for MIP.
3.4 Low-temperature N2 adsorption
The low-temperature N2 adsorption experiments were performed on an automatic SSA and pore analyzer (Tristar Ⅱ 3020, Micromeritics Instruments, United States). After the sample was pulverized to 0.25–0.425 mm diameter particles (Chen et al., 2018), weighed 1–2 g, and placed in a desiccator where it was dried at 100°C for 8 h. Using liquid nitrogen, we measured a range of relative pressures (P/P0) from 0.002 to 0.995 for N2 adsorption under a temperature of −195.85°C. After the N2 adsorption tests were completed, the density function theory (DFT) model was used for PV and PSD acquisition. With the support of mercury intrusion data, it can be confirmed that the samples contain a large number of macropores, so after considering the applicability of each model, the DFT model is most suitable for obtaining the PSD.
4 Results
4.1 Organic geochemical characteristics and mineral composition
The basic geochemical characteristics and mineral composition of each sample were tested experimentally, and Table 1 lists the test results. The TOC content of shale samples of Taiyuan formation in the Linxing area ranges from 1.59% to 22.58%, with a mean value of 2.77%. The OM types are mainly typed II kerogen, and the vitrinite reflectance ranges from 1.00% to 1.34%, with a mean value of 1.23%, which is in the middle maturity stage. According to the North American shale evaluation standard, the Taiyuan shale in the Linxing area is a fine gas-producing source rock (Burnaman & Shelton, 2009). Based on the XRD test results, the main mineral components in the shale samples are clay minerals, quartz, carbonate minerals, pyrite, and feldspar, in order of abundance.
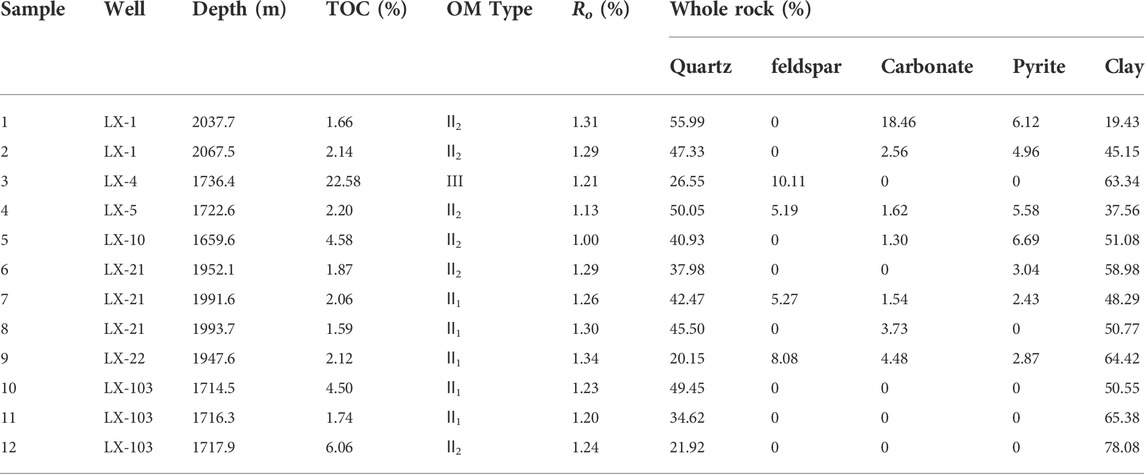
TABLE 1. Sample properties for the Taiyuan shale in the Linxing area.
4.2 Qualitative analysis of pore morphology
The qualitative analysis of shale pore morphology is helpful to determine the pore structure. Micronmeter-scale pores and nanometer-scale pores are abundant in the SEM imageries. According to the SEM imagery characterizations, there are three main types of pores in the Taiyuan shale: intraparticle (intraP) pores that are located inside mineral grains, interparticle (interP) pores that are located between mineral grains, and microfractures. The intraP pores located within kerogen, are also known as OM pores.
The OM pores in the Taiyuan Formation shale have different shapes and sizes, and exist in isolation or are connected. Pore diameters range from a few nanometers to several hundreds of nanometers, and pores of several microns can also be seen (Figures 2A,B). Typically, the interP pores are observed around or between particles in minerals. These interP pores are tens to hundreds of nanometers in diameter and usually have elongated shapes or polygonal cross-sections (Figures 2C,E). Clay minerals, pyrite framboids, and OM contain the most intraP pores (Figures 2C,D). Microfractures in the Taiyuan Formation shale can develop in and between particles of minerals or OM, mainly as organic hydrocarbon-generating fractures, mineral interlayer fractures, or mineral tension fractures caused by temperature and pressure changes during diagenesis. The morphologies of microcracks extend linearly or curvilinearly, and the lengths are usually several microns to tens of micrometers (Figure 2F). The existence of microcracks provides good channels for the communication of different types of reservoir spaces and the seepage of gas.
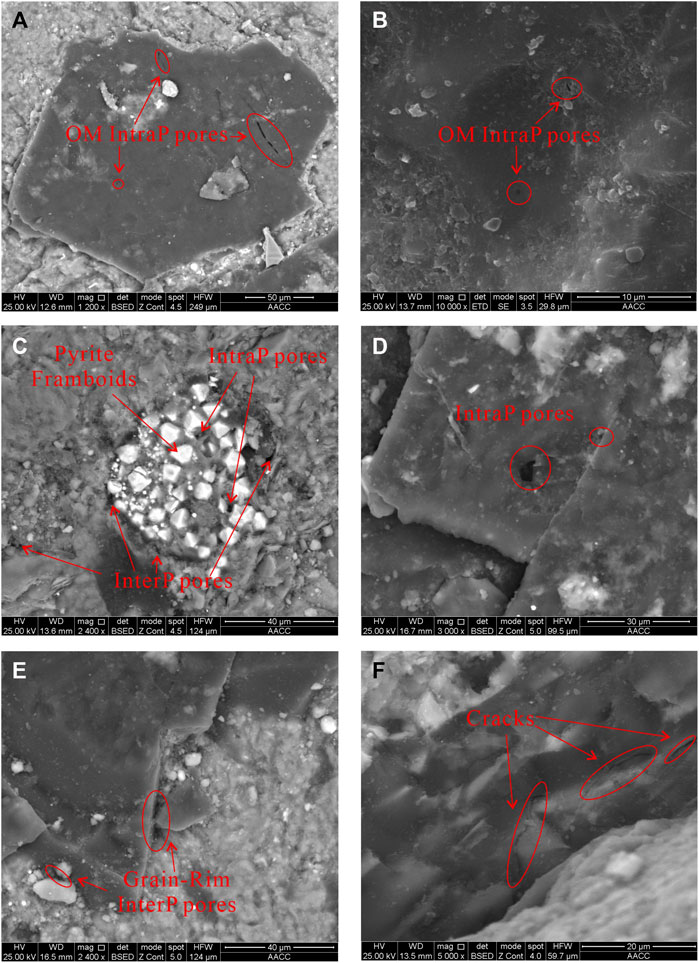
FIGURE 2. Scanning electron microscopy (SEM) imageries of Taiyuan Formation shale: (A) sample 3, LX-4, 1736.4 m; (B) sample 9, LX-22, 1947.6 m; (C) sample 7, LX-21, 1991.6 m; (D,E) sample4, LX-5, 1722.6 m; (F) sample 11, LX-103, 1716.3 m.
4.3 Quantitative analyses of pore structure
4.3.1 Pore characterization using mercury intrusion porosimetry measurements
For the MIP method, the form of the in-extrusion mercury curve shows various pore space expansion and connectivity. According to the intrusion mercury curves of the Taiyuan Formation shales in the study area, although the cumulative mercury intrusion differs between various shale samples, the intrusion curve often has the same shape. All of them have a low-pressure section (p < 0.011 MPa, corresponding to a pore size of 150 μm), with the steepest slope, suggesting the presence of numerous macropores that are micron-sized in diameter. The mercury intrusion rate is modest after this point and the intrusion curve gradually flattens out.
The mercury intrusion curve of the samples could be divided into two categories when the pressure was greater than 10 MPa, with one category’s mercury intrusion remaining nearly constant after 10 MPa (Figure 3A), and the other category’s mercury intrusion gradually increasing with pressure until it reached its maximum mercury intrusion (Figure 3B). The majority of the Taiyuan Formation shale samples are well closed based on the degree of closure of the intrusion and extrusion curves. Some samples even have practically overlapping intrusion/extrusion curves, indicating that the bulk of the samples’ pores is open or cracked.
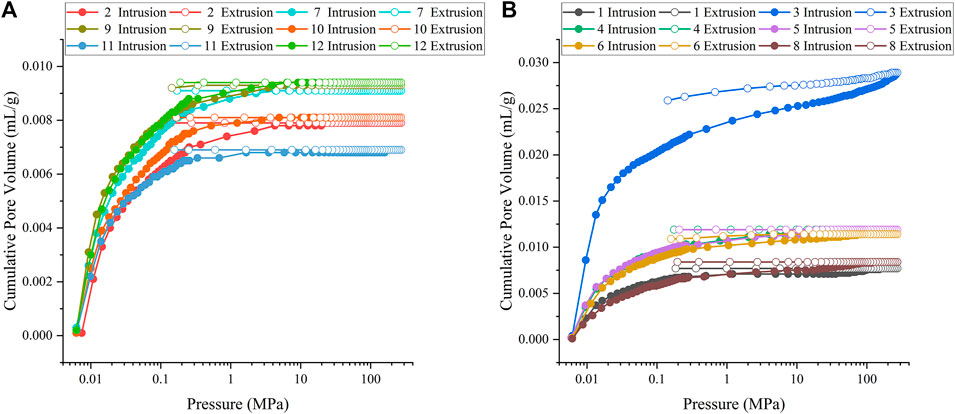
FIGURE 3. Mercury intrusion/extrusion curves of the Taiyuan Formation shales.
The pores of the Taiyuan Formation shale are widely distributed, ranging from mesopores to micron-scale fractures (Figure 4). Among them, samples 1, 3, 4, 5, 6, and 8, have a bimodal distribution. The two main peaks consist of meso–macropores and cracks, respectively. The right peak area (8000–200,000 nm) is larger than the left peak area (5–100 nm). Samples 2, 7, 9, 10, 11, and 12, have only a single peak, indicating that the reservoir space is mainly composed of fractures. The PV of sample 3 is significantly higher than that of the other samples at each stage, which may be caused by the higher TOC content (Table 1).
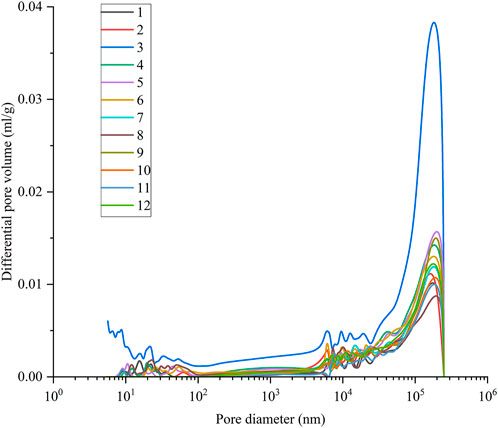
FIGURE 4. Pore size distributions (PSDs) of shales estimated from mercury intrusion porosimetry (MIP) analyses.
4.3.2 Pore structure from N2 adsorption isotherms
The IUPAC report in 2015 divided the gas adsorption isotherms into eight categories, adding two subclasses to represent the characteristics of different pores in porous materials (Thommes et al., 2015). The morphological characteristics of adsorption-desorption curves of the twelve shale samples are similar in general. They all show an inverse S shape with a hysteresis loop. In the early stage of adsorption (P/P0 < 0.1), the nitrogen adsorption capacity increases slowly, the curve is slightly convex upward, and there is an inflection point. In the middle section of the adsorption curve (P/P0 = 0.1–0.7), the nitrogen adsorption capacity increases gently, and the adsorption curve is almost a straight line. In the late stage of adsorption (P/P0 > 0.7), the nitrogen adsorption capacity increases rapidly with the increase of the P/P0 and the adsorption curve is steep, but when the adsorption curve was close to the nitrogen saturation vapor pressure the shale samples did not reach the maximum adsorption capacity. The above adsorption-desorption curve characteristics show that the adsorption isotherm of the Taiyuan Formation shale samples is similar to the type IV isotherm, but it is still not saturated at the adsorption end-point, which is a characteristic of the type II isotherm. This evidence indicates that the shale samples include a substantial number of macropores that exceed the detection limit of N2 adsorption. Based on the IUPAC classifications of hysteresis loops, the Taiyuan shale samples belong to H3 (Thommes et al., 2015). The desorption curves for samples 2, 4, 6, 7, 8, and 11 show prominent inflection points near the P/P0 of 0.5 and large hysteresis loops (Figure 5A), indicating that ink bottle-shaped pores exist. By contrast, Figure 5B illustrates that the desorption curves for 1, 3, 5, 9, 10, and 12 have no inflection points. And the hysteresis lines of these samples are relatively small, indicating the presence of conical pores. This is consistent with what is seen in the SEM images, such as the cone-shaped OM pores (Figure 2A) observed in sample 3.
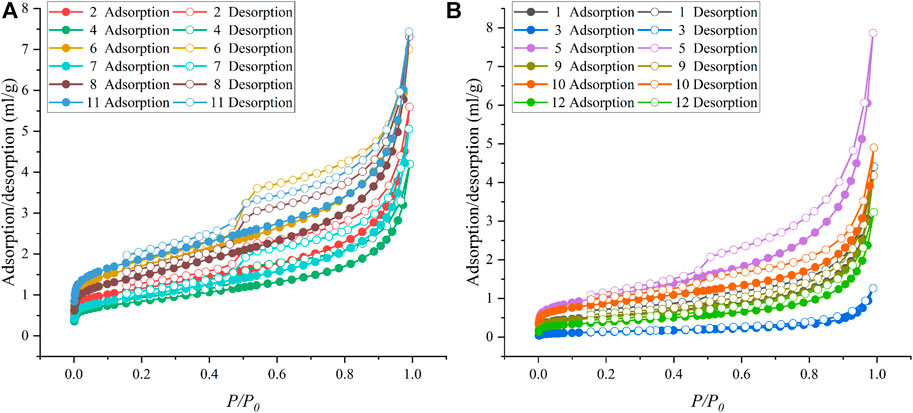
FIGURE 5. Isotherms of samples (A) samples with clear inflection points; (B) samples without inflection points.
From the PSD diagram (Figure 6), it can be seen that the pore spaces in the shale are mainly concentrated in mesopores and macropores. The maximum peak value of the differential PV is usually around 50 nm, which is near the boundary between mesopores and macropores. The PSD characteristics also show that mesopores and macropores provide the most pore space and are the main components of the Taiyuan Formation shale pores. Some samples can also show higher peaks in the range of micropores, indicating that the Taiyuan shale also contains a certain number of micropores. Due to the limitation of N2 adsorption experiments, some micropore (<1 nm) volumes may be neglected.
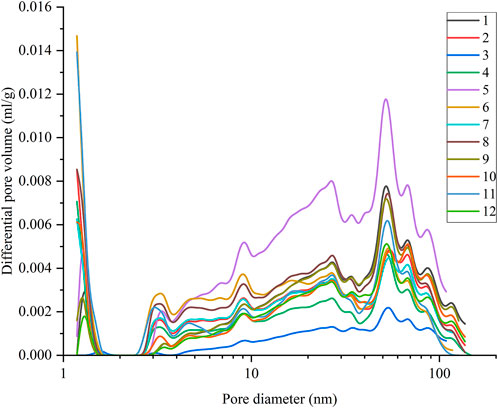
FIGURE 6. PSDs of shales estimated from N2 adsorption analyses.
5 Discussion
5.1 Pore fractal analysis of the shale samples
5.1.1 Pore fractal analysis using mercury intrusion porosimetry measurements
The fractal theory had been successfully applied by many scholars to the analysis of shale reservoirs. The MIP experiment was mainly solved based on the Washburn formula and Menger sponge model (Cai et al., 2011), the calculation formula can be derived as follows:
where: DM is the shale pore fractal dimension using MIP, dimensionless; P is the experimental pressure, MPa; and VP is the mercury injection volume at P, mL/g.
According to the Eq. 1, the mercury intrusion data was obtained, and then the linear fitting was performed according to the relationship between ln (dVP/dP) and lnP of the shale sample to obtain the slope (Figure 6), thereby obtaining the fractal dimension DM of different shale samples, listed in Table 2. There were two cases for the fitting results of ln(dVP/dP) and lnP, corresponding to the two PSD characteristics. There are two stages in the relationship between ln(dVP/dP) and lnP in Figure 7A, corresponding to samples with bimodal PSD, indicating that the pore fractal dimension of the Taiyuan shale in the Linxing area has a boundary point, and its pressure limit is approximately 14.7 MPa; the corresponding pore size range is approximately 100 nm. Figure 7B only exists in the first stage, corresponding to the sample with only a single peak. The macropore–fracture fractal dimension was recorded as DM1, and the mesopore–macropore fractal dimension was recorded as DM2. DM1 ranged from 2.3060 to 2.6528, with a mean value of 2.5264; DM2 ranged from 2.9510 to 3.4587, with a mean value of 3.1644. According to fractal theory, the D value was only meaningful when it was between 2 and 3. This means that DM2 was unreliable, and it could be noted that its correlation index, R2, was also low. Research by other scholars had shown that matrix compression may result from excessive mercury intrusion pressure (Zhang, et al., 2019a; Zhang et al.,. 2019b). In other words, the loss of reliability for DM2 was a sign that the pore structure is damaged.
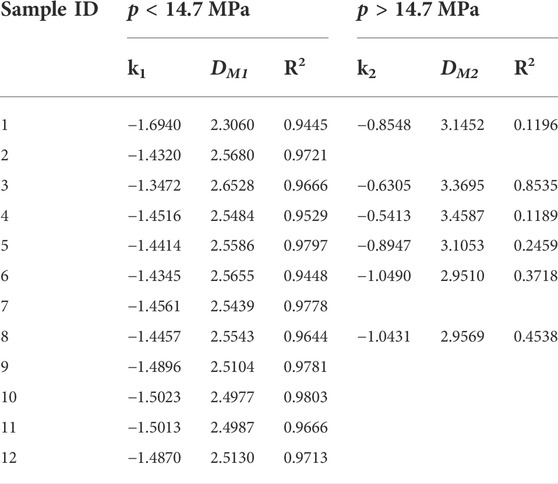
TABLE 2. Fractal dimension of mercury intrusion porosimetry (MIP) in shale samples.
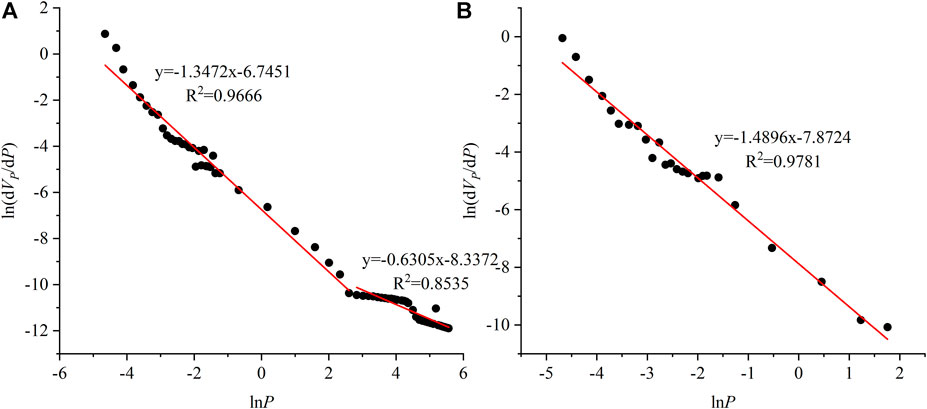
FIGURE 7. Fractal calculation results from ln (dVP/dP) vs. lnP reconstructed from MIP for two representative shale samples (A) sample 3; (B) sample 9.
5.1.2 Pore fractal analysis from N2 adsorption isotherms
Many methods had been used to calculate the fractal dimension of porous materials using nitrogen adsorption data. The more commonly used methods included the Frenkel–Halsey–Hill (FHH) model, the Brunauer–Emmett–Teller (BET) model, and the Niemark–Kiselev (NK) model. Among them, the FHH method was the most widely used, and the fractal characteristics obtained are also effective (Liu et al., 2019b). Therefore, this model was chosen to calculate the fractal dimension of nitrogen adsorption in this study. The calculation method of the FHH model is as follows:
where: DN is the shale pore fractal dimension using N2 adsorption, dimensionless; P is the equilibrium pressure of the gas, MPa; P0 is the gas saturation pressure, MPa; V is the volume of adsorbed gas molecules at P, and C is a constant.
It can be seen from Eq. 2 that the fractal dimension DN can be obtained by making a relationship diagram between lnV and ln[ln(P0/P)] and obtaining the slope between them through the least-squares regression. Based on the original N2 adsorption isotherm data for the shale samples, a scatter diagram (Figure 8) can be drawn. It can be seen from the figure that the relationship between ln[ln(P0/P)] and lnV has two stages with a good linear fitting relationship, and the demarcation point is at P/P0 = 0.5. The discrepancies between the scatter diagram at P/P0 of 0–0.5 and 0.5–1 indicate diverse adsorption behaviors. Intermolecular forces dominated the adsorption behavior in the early stage (P/P0 < 0.5) of N2 adsorption, while the behavior was controlled by capillary coalescence in the later stage (P/P0 > 0.5) of N2 adsorption (Wang et al., 2016). So DN1 was computed in the early stage. At lower P/P0, as N2 molecules were adsorbed and arranged on the surface of the pores, monolayer adsorption occurs, in which surface adsorption dominates. Therefore, DN1 responded to the surface roughness of the pore structure and could be referred to as the surface fractal dimension. In contrast, DN2 has computed in the P/P0 > 0.5 regions. At higher relative pressures, pore-filling adsorption and multilayer adsorption dominated, and N2 molecules manifested capillary condensation features. Consequently, DN2 was used as the fractal dimension of the pore structure.
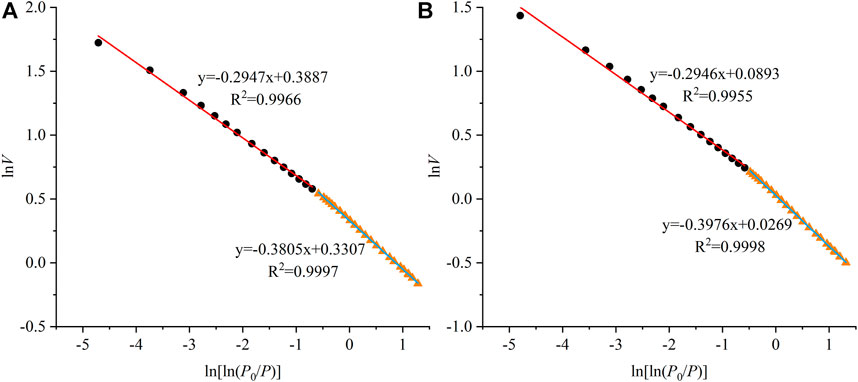
FIGURE 8. Scatter diagrams of lnV vs. ln[ln(P0/P)] for two typical shale samples, both with a demarcation point at P/P0 = 0.5 (A) sample 2; (B) sample 4.
Two characteristic FHH model scatter plots of lnV vs. ln[ln(P0/P)] from N2 adsorption data for samples 2 and 3 are plotted in Figure 8. The slopes obtained from the fits are presented in Table 3, and it can be found that all R2 values are greater than 0.99, indicating a good correlation between the linear fits. It can be seen from Table 3 that DN1 ranges from 2.4780 to 2.6387 with a mean value of 2.5757, and DN2 ranges from 2.5239 to 2.7388 with a mean value of 2.6487. DN1 was smaller than DN2 for each sample. Studies conducted on shale reservoirs in different basins had shown the same results, suggesting that lower DN1 values than DN2 values might be a more general phenomenon (Hazra et al., 2019; Jiang et al., 2016; Liu et al., 2021b). According to the research of relevant scholars, DN1 was positively correlated with the amount of methane gas adsorption, so the relatively high DN1 values of the Taiyuan Formation shale indicated that it had a higher gas adsorption potential (Yang et al., 2014). The higher DN2 values compared with DN1 values might result from the enhanced accessibility of N2 to porous structures at higher relative pressures. (Hazra et al., 2019).

TABLE 3. Fractal dimension of N2 adsorption isotherms in shale samples.
5.2 The full-scale pore size distribution of transitional shales
MIP and N2 adsorption had specific pore size test ranges. Shale samples had a wide range of pore sizes, and neither of these two techniques alone could reliably characterize all the pores in a shale, making it inappropriate to analyze full-scale PSDs by only a single experiment. Therefore, in this section, it will be discussed how to effectively couple the PSD values obtained from MIP and N2 adsorption experiments to characterize the full-scale PSD of shales.
The core of rebuilding the full-scale PSD is to give full play to the advantages of the two test methods, that is, to capitalize on the most reliable parts of the two data sets. When a piece of data is no longer reliable, it should not be present in the final result of the full-scale PSD images. The fractal theory had been wildly used to characterize the distribution of pores in various rocks. Therefore, we can use fractal dimension to solve the problem of splicing point selection. When the rock fractal dimension value loses its physical meaning or there is no fractal dimension value, the corresponding method can no longer effectively characterize the pore structure of the rock and that data should be discarded. Through the previous calculation, we found that for the Taiyuan shale, the DM values lose physical meaning in the part of pore size less than 100 nm; while the DN values are always meaningful, thus the reasonable splicing point should be at 100 nm.
Compared our approach to the standard method 2 to further validate its dependability. By comparing the PSD plots (Figure 9) of the N2 adsorption and MIP across the whole test range of the N2 adsorption test. Except for sample 3, the MIP generally underestimated the PV below 100 nm. The PSD curves of samples 1, 2, 4, 5, 6, and 8 retain some morphological similarity (peak heights change but peak positions remain similar), and there are crossings or exhibit the same monotonicity near 100 nm, however, this pore splicing approach fails for samples 7, 9, 10, 11, and 12. This demonstrates that the fractal theory is viable and more extensively relevant in the problem of splicing point selection. This shows that the fractal theory is valid and more widely applicable in the problem of the selection of splicing points. It should be observed that the two curves of sample 3 have multiple intersections in the 50–100 nm pore size section, and the measured stage pore volume increases as the intrusion pressure increases. This is similar to the usual overestimation of mesopore and micropore volumes in coal rocks reported by certain authors due to matrix compression effects (Li et al., 2021a). Combined with the significantly higher TOC of sample 3 (22.58%), it suggests that organic matter pores and mineral pores are different when they are disrupted. OM particles may be disrupted due to larger intrusion pressure, thus making the internally contained closed pores disrupted and communicated. Mineral pores, on the other hand, tend to collapse as a whole, i.e., they are supported by the clay mineral skeleton and still maintain a certain pore morphology (Kuila & Prasad, 2013).
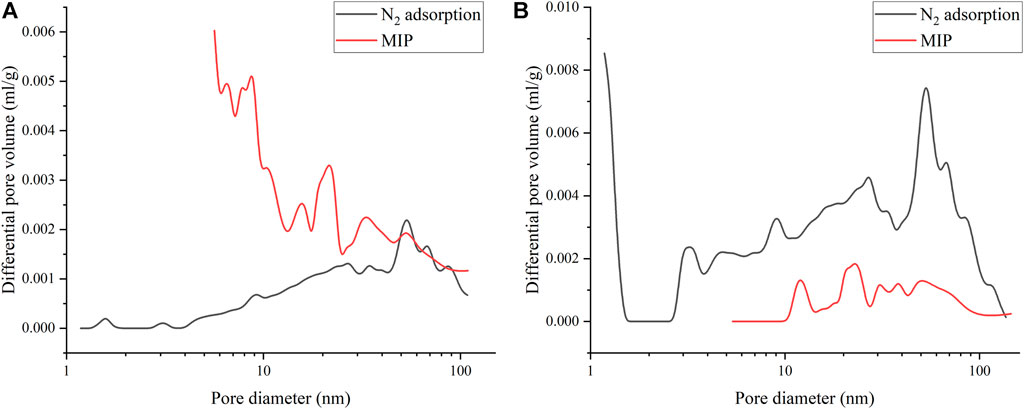
FIGURE 9. Comparison of pore size distribution obtained from MIP and N2 adsorption data (A) sample 3; (B) sample 8.
Figure 10 exhibits the volume differential full-scale PSD of 12 shale samples gained from the above fractal method. The figure shows that the distributions of the studied samples range from 1.5 nm to 200 μm, and nanoscale pores act as an important storage space for the Taiyuan shale. The porosity values gained from the full-scale PSD curve are significantly larger than those obtained from the MIP or N2 adsorption techniques alone, which indicates that pores at micron and larger scales are not negligible for shale gas reservoirs. The full-scale PSD curves exhibit a multimodal character, and several peaks can be found, corresponding to pore diameters of approximately 1.5 nm, 25 nm, 50 nm, 10 μm, and 0.2 mm, from left to right.
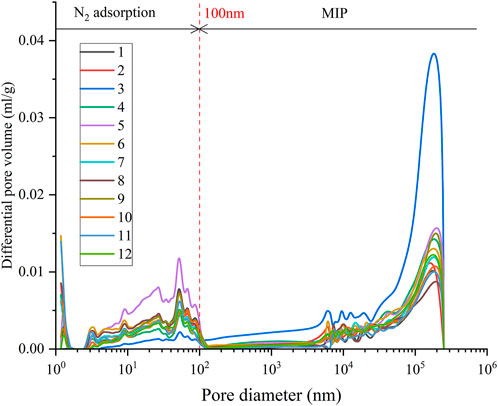
FIGURE 10. Full-scale PSDs of 12 samples gained by combining N2 adsorption and MIP measurements.
The foregoing research shows that the pore structure of shale is complicated, diversified, and has a wide range of PSD. The pore volume distribution features of full pore size vary substantially among different Taiyuan Formation shale samples. However, in general, it is still characterized by macropores providing the majority of PV, followed by mesopores, and micropores providing a small amount of PV (Figure 11). The mean volumes of micropores, mesopores, and macropores are 0.00045 ml/g, 0.0031 ml/g, and 0.011 ml/g, respectively. The mean percentages are 3.4%, 21.7%, and 74.9%, respectively.
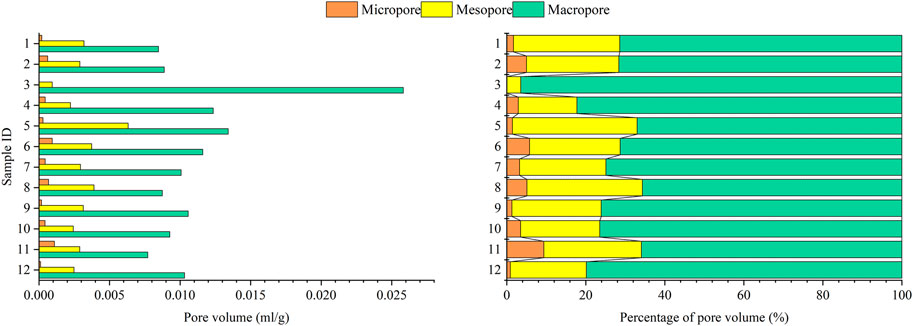
FIGURE 11. Pore volume and percentage of pore volume distributions based on IUPAC pore classification.
5.3 The correlation between fractal dimensions and the pore volume and compositions of shales
To determine the effect of the fractal characteristics of Taiyuan shale on pore anisotropy, it is essential to survey the correlation between fractal dimensions, PV, and the basic compositions of transitional shale, including TOC content, quartz content, and clay content. A total of three effective fractal dimensions were obtained in this study, DM1, DN1, and DN2, which correspond to most of the macropores, micropores, and mesopores, respectively.
Figure 12 illustrates the positive relationship between fractal dimensions and related pore volume. Micropores show a clearer correlation between DN1 and pore volume than mesopores and macropores do (Figure 12B). In shale reservoirs, heterogeneity and irregular pore structure are mostly caused by micropores, as demonstrated by Yang et al. (2014), and the fractal dimension in such shales indicates the degree of micropore development.
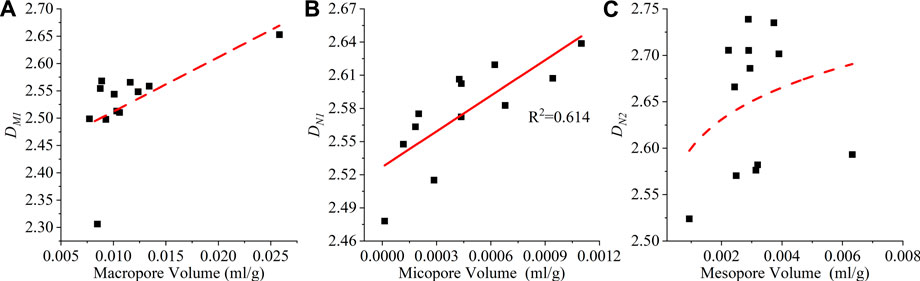
FIGURE 12. Relationship between fractal dimensions and corresponding pore volume: (A) DM1; (B) DN1; (C) DN2.
The growth of shale reservoir pores, particularly organic pores, is significantly influenced by TOC, which is a prerequisite for shale gas enrichment. The relationship between PV and TOC at each scale reveals that macropore volume has a positive correlation with TOC, indicating that high TOC content positively affects macropores development; for mesopores, there is no obvious relationship between TOC and mesopore volume; and for micropores, there is a weak negative relationship between the two (Figure 13A). It should be noted that sample 3 has a substantially greater TOC than the other samples, which may obfuscate the association between the other samples, hence it has been omitted from the graph in Figure 13A and Figure 14A.
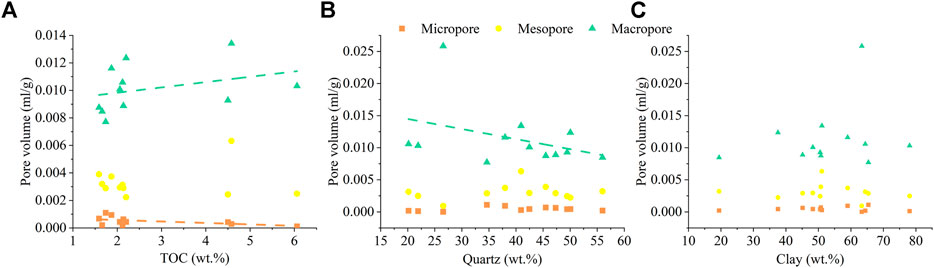
FIGURE 13. Relationship between PV and compositions of transitional shale: (A) TOC; (B) Quartz; (C) Clay.
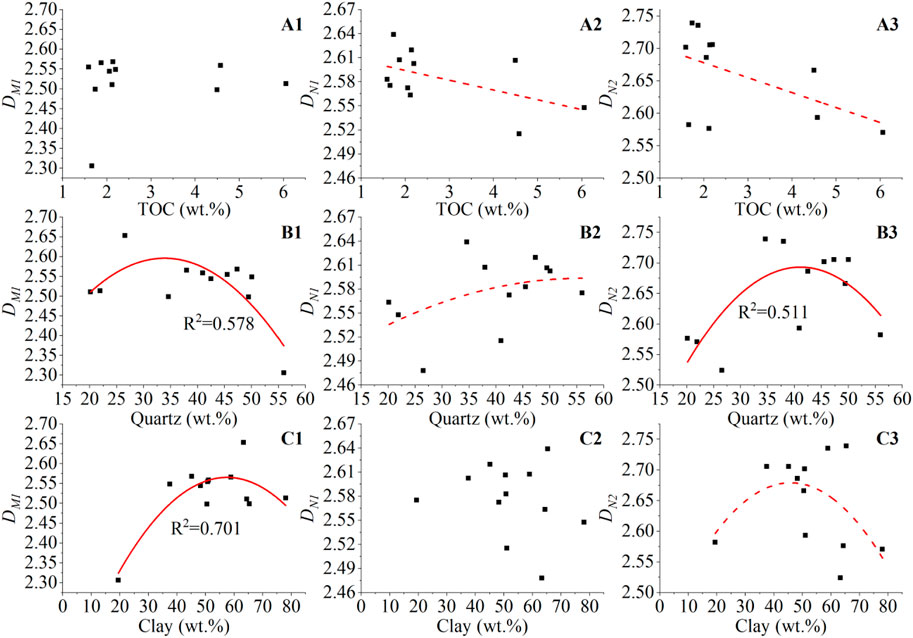
FIGURE 14. Relationship of fractal dimensions versus shale compositions. (A) total organic carbon (TOC) vs. fractal dimensions: (1) DM1, (2) DN1, (3) DN2; (B) quartz contents vs. fractal dimensions: (1) DM1, (2) DN1, (3) DN2; (C) clay contents vs. fractal dimensions: (1) DM1, (2) DN1, (3) DN2.
The correlation analysis between the quartz content and the PV of each scale shows that the macropore volume is negatively correlated with the quartz content as a whole, but there is no obvious correlation between the mesopore and micropore volumes and the quartz content (Figure 13B). According to the negative relationship between macropore volume and quartz concentration, secondary quartz formed during diagenesis may be the primary source of quartz crystals. Because different types of clay minerals have vastly different morphological structures and physicochemical properties that have different effects on pore growth in shale reservoirs, there is no clear relationship between clay and pore volume at any scale (Figure 13C).
TOC shows no significant relationship with DM1, and is negatively correlated with both DN1 and DN2 (Figure 14A). This phenomenon contradicts the shale recorded in the Qingshankou Formation lacustrine shale (Wang et al., 2015), where the relationship indicates a decrease followed by an increase, with a minimum value of D at about 3% TOC content. Our findings varied from previously published maritime shale gas data (Yang et al., 2014; Xi et al., 2018), in which D was positively linked with TOC concentration. It is discovered that the discrepancy might be due to differences in sedimentary facies by further analyzed related studies. The transitional facies are the Taiyuan Formation shale’s sedimentary facies, whereas other researchers have concentrated on lacustrine and marine shales.
The relationship between quartz minerals and various fractal dimensions is not the same, there is a parabolic correlation between DM1 and DN2, and a positive correlation with DN1 (Figure 14B). Some scholars believed that the quartz content is independent of the fractal dimension (Xi et al., 2018), which contradicted the current findings, and the varied behavior of quartz at different phases merits further exploration. Clay minerals show a parabolic relationship with DM1 and DN2, and no significant correlation with DN1 (Figure 14C). The correlation analysis between clay mineral content and fractal dimensions at different scales shows that the maximum non-homogeneity occurs around 50% of clay mineral content. The correlation with the fractal dimension of the pore surface is not strong, indicating that clay is not the main cause of hole surface roughness
It is discovered that the connections between fractal dimension and shale composition are typically nonlinear. This was consistent with previous researchers’ findings that shale reservoirs were sensitive to multiple geological variables that interact with one another and had a complicated pore network (Ross & Bustin, 2009). In the previous analysis, the Taiyuan Formation and marine and lacustrine shale samples showed different correlations in fractal and component correlations, and even some components were close in content. This phenomenon can be attributed to differences in depositional environments, as we know that different depositional environments bring about differences in OM types, sources of quartz, types of clay minerals, and more. The difference between Taiyuan Formation shale and marine and lacustrine shale also indicates that the study of the sedimentary process deserves attention.
6 Conclusion
The scanning electron microscopy, mercury intrusion porosimetry, and N2 adsorption experiments were employed in this work to examine the pore morphology and structure of 12 transitional shale samples. The mercury intrusion porosimetry and N2 adsorption were applicable complementary techniques to investigate the diverse characteristics of shale. The optimal splicing point was successfully chosen based on the physical meaning of fractal dimension combined with mercury intrusion porosimetry and N2 adsorption technology, and a full-scale pore size distribution image was obtained. Furthermore, the relationships between the basic components of shale and the fractal dimension have been studied. The following five conclusions have been obtained.
(1) The scanning electron microscopy imageries provided qualitative information on the Taiyuan shale pore size and morphology. The pore structure and network in the shale were very complicated. Micropores and mesopores within organic matter, interP pores between mineral grains, and microfractures were the most common types of pores in the Taiyuan shale.
(2) The pore structure and size range of the Taiyuan shale was quantitatively characterized by the mercury intrusion porosimetry and N2 adsorption experiments. According to the mercury intrusion porosimetry analyses, unimodal and multimodal pore size distributions can be found, with most pores ranging in size by approximately 0.2 mm. For micropores and mesopores, multimodal pore size distributions were found based on the results of N2 adsorption characterization. Typically, the maximum peak value of the differential pore volume was usually around 50 nm.
(3) The pores of the Taiyuan shale samples had fractal geometries. The fractal dimension DM1 was determined via the mercury intrusion porosimetry experiments, and its value ranged from 2.3060 to 2.6528. The Taiyuan shale had significantly different adsorption behaviors and fractal characteristics at relative pressures <0.5 and >0.5. Two fractal dimensions, DN1 and DN2, can be determined using the Frenkel–Halsey–Hill model, with DN1 ranging between 2.4780 and 2.6387, and DN2 ranging between 2.5239 and 2.7388.
(4) The Taiyuan shale samples had a wide pore size distribution and macropores were the main source of the pore volume. The mean percentages of micropores, mesopores, and macropores are 3.4%, 21.7%, and 74.9%, respectively.
(5) There were various correlations between fractal dimension, pore volume, and basic composition of shale. The correlation between fractal dimension and corresponding pore volume was positive, the correlation between pore volume and component was weak, but the correlation between fractal and component was mostly non-linear. The good correlation between fractals reflected the validity of the fractal theory in the characterization of pore inhomogeneity.
Data availability statement
The original contributions presented in the study are included in the article/Supplementary material, further inquiries can be directed to the corresponding author.
Author contributions
Conceptualization: SS, JH; Methodology: SS, XZ; Formal analysis and investigation: HW, ZY, and JW; Writing–original draft preparation: SS; Writing–review and editing: SS, JH; Funding acquisition: JH, XZ; Resources: HW, TY, and WW; Supervision: JH.
Funding
The National Key R&D Program of China (2021YFC2902003); The National Natural Science Foundation of China (41702170).
Conflict of interest
The authors declare that the research was conducted in the absence of any commercial or financial relationships that could be construed as a potential conflict of interest.
Publisher’s note
All claims expressed in this article are solely those of the authors and do not necessarily represent those of their affiliated organizations, or those of the publisher, the editors and the reviewers. Any product that may be evaluated in this article, or claim that may be made by its manufacturer, is not guaranteed or endorsed by the publisher.
References
Burnaman, M. D., and Shelton, J. (2009). Shale gas play screening and evaluation criteria. China Pet. Explor. 14 (03), 51–64.
Cai, Y. D., Liu, D. M., Yao, Y. B., Li, J. Q., and Liu, J. L. (2011). Fractal characteristics of coal pores based on classic geometry and thermodynamics models. Acta Geol. Sin. - Engl. Ed. 85 (5), 1150–1162. doi:10.1111/j.1755-6724.2011.00547.x
Chen, S. B., Gong, Z., Li, X. Y., Wang, H. J., Wang, Y., and Zhang, Y. K. (2021a). Pore structure and heterogeneity of shale gas reservoirs and its effect on gas storage capacity in the Qiongzhusi Formation. Geosci. Front. 12 (6), 101244. doi:10.1016/j.gsf.2021.101244)
Chen, Y., Jiang, C., Leung, J. Y., Wojtanowicz, A. K., and Zhang, D. (2021b). Multiscale characterization of shale pore-fracture system: Geological controls on gas transport and pore size classification in shale reservoirs. J. Petroleum Sci. Eng. 202, 108442. Article 108442. doi:10.1016/j.petrol.2021.108442
Chen, Y. L., Qin, Y., Wei, C. T., Huang, L. L., Shi, Q. M., Wu, C. F., et al. (2018). Porosity changes in progressively pulverized anthracite subsamples: Implications for the study of closed pore distribution in coals. Fuel 225, 612–622. doi:10.1016/j.fuel.2018.03.164
Clarkson, C. R., Solano, N., Bustin, R. M., Bustin, A. M. M., Chalmers, G. R. L., He, L., et al. (2013). Pore structure characterization of North American shale gas reservoirs using USANS/SANS, gas adsorption, and mercury intrusion. Fuel 103, 606–616. doi:10.1016/j.fuel.2012.06.119
Curtis, J. B. (2002). Fractured shale-gas systems. Aapg Bull. 86 (11), 1921–1938. doi:10.1306/61EEDDBE-173E-11D7-8645000102C1865DAvailable at: https://www.scopus.com/inward/ record.uri?eid=2-s2.0-0036860861&partnerID=40&md5=92ff1a872d03ebc16123055d2458e727
Dai, H. L., Su, Y. A., Kuang, L. C., Liu, J. Z., Gu, D. Z., and Zou, C. N. (2021). Contemplation on China's energy-development strategies and initiatives in the context of its carbon neutrality goal. Engineering 7 (12), 1684–1687. doi:10.1016/j.eng.2021.10.010
Hazra, B., Chandra, D., Singh, A. K., Varma, A. K., Mani, D., Singh, P. K., et al. (2019). Comparative pore structural attributes and fractal dimensions of Lower Permian organic-matter-bearing sediments of two Indian basins: Inferences from nitrogen gas adsorption. Energy Sources Part A Recovery Util. Environ. Eff. 41 (24), 2975–2988. doi:10.1080/15567036.2019.1582737
Hu, H., Hao, F., Guo, X., Yi, J., Shu, Z., Bao, H., et al. (2019). Effect of lithofacies on the pore system of over-mature Longmaxi shale in the Jiaoshiba area, Sichuan Basin, China. Mar. Petroleum Geol. 109, 886–898. doi:10.1016/j.marpetgeo.2019.06.050
Jarvie, D. M., Hill, R. J., Ruble, T. E., and Pollastro, R. M. (2007). Unconventional shale-gas systems: The Mississippian Barnett Shale of north-central Texas as one model for thermogenic shale-gas assessment. Am. Assoc. Pet. Geol. Bull. 91 (4), 475–499. doi:10.1306/12190606068
Jiang, F., Chen, D., Chen, J., Li, Q., Liu, Y., Shao, X., et al. (2016). Fractal analysis of shale pore structure of continental gas shale reservoir in the Ordos Basin, NW China. Energy fuels. 30 (6), 4676–4689. doi:10.1021/acs.energyfuels.6b00574
Jiang, S., Xiao, D., Tang, X., Xing, F., Xiang, C., Pahnke, P., et al. (2017). Nano to micron-sized pore types and pore size distribution revealed by innovative test methods-case studies from fluvial, lacustrine and marine tight and shale oil and gas plays in China and US. J. Nanosci. Nanotechnol. 17 (9), 6296–6306. doi:10.1166/jnn.2017.14433
Jiao, K., Yao, S. P., Liu, C., Gao, Y. Q., Wu, H., Li, M. C., et al. (2014). The characterization and quantitative analysis of nanopores in unconventional gas reservoirs utilizing FESEM-FIB and image processing: An example from the lower Silurian Longmaxi Shale, upper Yangtze region, China. Int. J. Coal Geol. 128, 1–11. doi:10.1016/j.coal.2014.03.004
Ju, W., Shen, J., Qin, Y., Meng, S., Wu, C., Shen, Y., et al. (2017). In-situ stress state in the Linxing region, eastern Ordos Basin, China: Implications for unconventional gas exploration and production. Mar. Petroleum Geol. 86, 66–78. doi:10.1016/j.marpetgeo.2017.05.026
Kuila, U., and Prasad, M. (2013). Specific surface area and pore-size distribution in clays and shales. Geophys. Prospect. 61 (2), 341–362. doi:10.1111/1365-2478.12028
Li, G., Qin, Y., Wu, M., Zhang, B., Wu, X., Tong, G., et al. (2019). The pore structure of the transitional shale in the Taiyuan formation, Linxing area, Ordos Basin. J. Petroleum Sci. Eng. 181, 106183. doi:10.1016/j.petrol.2019.106183
Li, Y. B., Song, D. Y., Liu, S. M., Ji, X. F., and Hao, H. J. (2021b). Evaluation of pore properties in coal through compressibility correction based on mercury intrusion porosimetry: A practical approach. Fuel 291, 120130. doi:10.1016/j.fuel.2021.120130
Li, Y., Song, D., Liu, S., Ji, X., and Hao, H. (2021a). Evaluation of pore properties in coal through compressibility correction based on mercury intrusion porosimetry: A practical approach. Fuel 291, 120130. doi:10.1016/j.fuel.2021.120130
Li, Y., Tang, D., Wu, P., Niu, X., Wang, K., Qiao, P., et al. (2016). Continuous unconventional natural gas accumulations of Carboniferous-Permian coal-bearing strata in the Linxing area, northeastern Ordos basin, China. J. Nat. Gas Sci. Eng. 36, 314–327. doi:10.1016/j.jngse.2016.10.037
Liu, B., Gao, Y., Liu, K., Liu, J., Ostadhassan, M., Wu, T., et al. (2021a). Pore structure and adsorption hysteresis of the middle Jurassic Xishanyao shale formation in the Southern Junggar Basin, northwest China. Energy Explor. Exploitation 39 (3), 761–778. doi:10.1177/0144598720985136
Liu, B., Jin, L., and Hu, C. (2019a). Fractal characterization of silty beds/laminae and its implications for the prediction of shale oil reservoirs in Qingshankou formation of Northern Songliao Basin, Northeast China. Fractals 27 (1), 1940009. doi:10.1142/s0218348x19400097)
Liu, B., Yan, M., Sun, X., Bai, Y., Bai, L., and Fu, X. (2020). Microscopic and fractal characterization of organic matter within lacustrine shale reservoirs in the first member of cretaceous Qingshankou Formation, songliao basin, Northeast China. J. Earth Sci. 31 (6), 1241–1250. doi:10.1007/s12583-020-1345-3
Liu, W., Wang, G., Han, D. Y., Xu, H., and Chu, X. Y. (2021b). Accurate characterization of coal pore and fissure structure based on CT 3D reconstruction and NMR. J. Nat. Gas Sci. Eng. 96, 104242. Article 104242. doi:10.1016/j.jngse.2021.104242
Liu, Y., Zhu, Y., Wang, Y., and Chen, S. (2019b). Fractal characteristics of nanoscale pores in shale and its implications on methane adsorption capacity. Fractals 27 (1), 1940014. doi:10.1142/s0218348x19400140)
Ross, D. J. K., and Bustin, R. M. (2009). The importance of shale composition and pore structure upon gas storage potential of shale gas reservoirs. Mar. Petroleum Geol. 26 (6), 916–927. doi:10.1016/j.marpetgeo.2008.06.004
Shen, Y., Qin, Y., Wang, G. G. X., Guo, Y., Shen, J., Gu, J., et al. (2017). Sedimentary control on the formation of a multi-superimposed gas system in the development of key layers in the sequence framework. Mar. Petroleum Geol. 88, 268–281. doi:10.1016/j.marpetgeo.2017.08.024
Shu, Y., Sang, S.-X., Lin, Y.-X., Zhou, X.-Z., Wang, H., and Wang, Z.-L. (2021). The influence of magmatic-hydrothermal activities on porosity and permeability of sandstone reservoirs in the Linxing area, Ordos Basin, Northern China. J. Asian Earth Sci. 213, 104741. Article 104741. doi:10.1016/j.jseaes.2021.104741
Sun, M. D., Zhao, J., Pan, Z. J., Hu, Q. H., Yu, B. S., Tan, Y. L., et al. (2020). Pore characterization of shales: A review of small angle scattering technique. J. Nat. Gas Sci. Eng. 78, 103294. Article 103294. doi:10.1016/j.jngse.2020.103294
Thommes, M., Kaneko, K., Neimark, A. V., Olivier, J. P., Rodriguez-Reinoso, F., Rouquerol, J., et al. (2015). Physisorption of gases, with special reference to the evaluation of surface area and pore size distribution (IUPAC Technical Report). Pure Appl. Chem. 87 (9-10), 1051–1069. doi:10.1515/pac-2014-1117
Wang, F., and Zai, Y. (2021). Fractal and multifractal characteristics of shale nanopores. Results Phys. 25, 104277. doi:10.1016/j.rinp.2021.104277
Wang, M., Xue, H., Tian, S., Wilkins, R. W. T., and Wang, Z. (2015). Fractal characteristics of upper cretaceous lacustrine shale from the songliao basin, NE China. Mar. Petroleum Geol. 67, 144–153. doi:10.1016/j.marpetgeo.2015.05.011
Wang, P., Zhang, C., Li, X., Zhang, K., Yuan, Y., Zang, X., et al. (2020). Organic matter pores structure and evolution in shales based on the he ion microscopy (him): A case study from the triassic yanchang, lower silurian longmaxi and lower cambrian niutitang shales in China. J. Nat. Gas Sci. Eng. 84, 103682. doi:10.1016/j.jngse.2020.103682
Wang, Y., Liu, L., and Cheng, H. (2021). Gas adsorption characterization of pore structure of organic-rich shale: Insights into contribution of organic matter to shale pore network. Nat. Resour. Res. 30 (3), 2377–2395. doi:10.1007/s11053-021-09817-5
Wang, Y., Zhu, Y., Liu, S., and Zhang, R. (2016). Pore characterization and its impact on methane adsorption capacity for organic-rich marine shales. Fuel 181, 227–237. doi:10.1016/j.fuel.2016.04.082
Xi, Z., Tang, S., Wang, J., Yi, J., Guo, Y., and Wang, K. (2018). Pore structure and fractal characteristics of niutitang shale from China. Minerals 8 (4), 163. Article 163. doi:10.3390/min8040163
Xiao, Q., Yang, Z., Wang, Z., Qi, Z., Wang, X., and Xiong, S. (2020). A full-scale characterization method and application for pore-throat radius distribution in tight oil reservoirs. J. Petroleum Sci. Eng. 187, 106857. doi:10.1016/j.petrol.2019.106857
Xu, H., Tang, D., Zhao, J., and Li, S. (2015). A precise measurement method for shale porosity with low-field nuclear magnetic resonance: A case study of the carboniferous-permian strata in the linxing area, eastern Ordos Basin, China. Fuel 143, 47–54. doi:10.1016/j.fuel.2014.11.034
Xu, L., Yang, K., Wei, H., Liu, L., Li, X., Chen, L., et al. (2021). Full-scale pore structure characteristics and the main controlling factors of mesoproterozoic xiamaling shale in zhangjiakou, hebei, China. Nanomaterials 11 (2), 527. doi:10.3390/nano11020527
Xu, Y., Wang, Y., Yuan, H., Zhang, D., Agostini, F., and Skoczylas, F. (2018). Pore structure characterization of tight sandstone from Sbaa Basin, Algeria: Investigations using multiple fluid invasion methods. J. Nat. Gas Sci. Eng., 59, 414–426. doi:10.1016/j.jngse.2018.09.021
Yang, F., Ning, Z., and Liu, H. (2014). Fractal characteristics of shales from a shale gas reservoir in the Sichuan Basin, China. Fuel 115, 378–384. doi:10.1016/j.fuel.2013.07.040
Zhang, L., Lu, S., Xiao, D., and Gu, M. (2017). Characterization of full pore size distribution and its significance to macroscopic physical parameters in tight glutenites. J. Nat. Gas Sci. Eng. 38, 434–449. doi:10.1016/j.jngse.2016.12.026
Zhang, S., Tang, S., Zhang, J., and Pan, Z. (2018). Pore structure characteristics of China sapropelic coal and their development influence factors. J. Nat. Gas Sci. Eng. 53, 370–384. doi:10.1016/j.jngse.2018.03.022
Zheng, S., Yao, Y., Liu, D., Cai, Y., and Liu, Y. (2019a). Nuclear magnetic resonance surface relaxivity of coals. Int. J. Coal Geol. 205, 1–13. doi:10.1016/j.coal.2019.02.010
Zheng, S., Yao, Y., Zhang, S., Liu, Y., and Yang, J. (2019b). Insights into multifractal characterization of coals by mercury intrusion porosimetry. Energies 12 (24), 4743. doi:10.3390/en12244743)
Keywords: linxing area, pore structure, fractal analysis, full-scale PSD, shale gas
Citation: Shi S, He J, Zhang X, Wu H, Yu Z, Wang J, Yang T and Wang W (2022) Fractal analysis of pore structures in transitional shale gas reservoirs in the Linxing area, Ordos Basin. Front. Earth Sci. 10:979039. doi: 10.3389/feart.2022.979039
Received: 27 June 2022; Accepted: 04 August 2022;
Published: 29 August 2022.
Edited by:
Amin Beiranvand Pour, INOS University Malaysia Terengganu, MalaysiaReviewed by:
Bo Liu, Northeast Petroleum University, ChinaPeng Li, SINOPEC Petroleum Exploration and Production Research Institute, China
Copyright © 2022 Shi, He, Zhang, Wu, Yu, Wang, Yang and Wang. This is an open-access article distributed under the terms of the Creative Commons Attribution License (CC BY). The use, distribution or reproduction in other forums is permitted, provided the original author(s) and the copyright owner(s) are credited and that the original publication in this journal is cited, in accordance with accepted academic practice. No use, distribution or reproduction is permitted which does not comply with these terms.
*Correspondence: Jinxian He, anhoZUBjdW10LmVkdS5jbg==