 Arqam Muqtadir
 Saud Al-Dughaimi
 Jack Dvorkin
- College of Petroleum Engineering and Geosciences, King Fahd University of Petroleum and Minerals, Dhahran, Saudi Arabia
Sonic and dipole wireline tools measure Vp and Vs along the vertical direction. The state of stress in the subsurface is predominantly anisotropic, while most laboratory experiments measuring the dynamic elastic properties are conducted under hydrostatic stress. The question we ask is whether such laboratory experiments provide the velocities that are close to those measured in the vertical wellbore where the stresses are anisotropic. To address this question, we conducted ultrasonic pulse transmission experiments on several room-dry rock samples. The comparison was made between the P- and S-wave velocities obtained at pure hydrostatic loading conditions and those at a smaller hydrostatic stress with added axial stress, so that the total stress along the axis of a cylindrical plug was the same as under pure hydrostatic loading. These differences were significant in the extreme case of only 1 MPa hydrostatic confining stress with the axial stress increasing up to 40 MPa. However, as the hydrostatic (confining) stress increased, the differences between the velocities along the axis of the sample became smaller and smaller. For example, at 1 MPa confining and 30 MPa axial stress, the relative difference in Vp was about 10%, while that in Vs was about 20%. However, at 10 MPa confining stress, these differences became about 3% and 6%, respectively, and further decreased as the confining stress increased. This means that even at strong in-situ contrasts between the vertical and horizontal stresses, the results of laboratory hydrostatic experiments can be used for in-situ velocity estimates. These results also appear to be consistent with a theoretical model that predicts the directional velocities at any triaxial stress conditions from those measured versus hydrostatic stress.
Introduction
The elastic-wave velocities in porous rocks are practically always sensitive to stress, especially so for the samples extracted from the deep subsurface. Many laboratory tests indicate that both the P- and S-wave velocities increase with increasing stress. The commonly accepted reason for such behavior is the closure of compliant cracks present in the pore space, as well as the stiffening of compliant grain contacts (e.g., Hudson, 1980; Johnson, 1985). These subtle features may occupy only a small portion of the entire rock volume, yet their contribution to the compliance of rock material is enormous. The smaller the aspect ratio of the crack the more compliant it is (e.g., Hudson, 1980). Hence, once these cracks close, the stiffnesses of the sample and the respective velocities strongly increase.
Literature on stress-induced anisotropy is massive. Arguably, the first quantitative and rigorous report on stress-related velocity anisotropy is by Nur and Simmons (1969). The authors show that a granite sample subject to uniaxial stress makes the P-wave velocity highest along the direction of the applied stress and makes this velocity substantially slower along the direction normal to the stress. Moreover, this work, for the first time reported the so-called S-wave splitting, meaning that these polarized waves travel with different speeds in any direction. S-wave splitting, also called seismic birefringence, is the phenomenon that occurs when a polarized shear wave enters an anisotropic medium, whereby the incident S-wave splits into two polarized shear waves.
This work was followed by Nur’s (1971) theoretical investigation on the effect of the directional distribution of cracks on velocity anisotropy. These theoretical results matched the experimental data obtained on two granite samples.
These two pioneering publication have been since followed by an avalanche of experimental and theoretical publications. It is simply impossible to refer to all of them here. Instead, we will quote only selected ones.
Crampin (1985) shows that shear-wave splitting in seismographs may be interpreted, under a set of assumptions, in terms of crack orientation, thus also implying the anisotropy of permeability in reservoirs. Zamora and Poirier (1990) experimentally investigate the P-wave velocity anisotropy, as well as S-wave splitting in Fountainebleau sandstone in two orthogonal directions. They also show that the crack orientation inferred from these experiments and using the Crampin (1985) theory qualitatively match the orientations observed in the respective Scanning Electron Microscope (SEM) images. An experimental study by Dillen et al. (1999) explores stress-induced velocity anisotropy due to triaxial state of stress in a low-porosity sandstone. Once again, these authors confirm the already known fact that anisotropic stresses result in anisotropic speeds of wave propagation. Another elaborate study on stress-induced velocity anisotropy using a spherical sample is by Nadri et al. (2011). Later, Bhuiyan and Holt (2016) presented experimental results on velocity anisotropy in dry and saturated sand as the axial stress varied between 1 and 15 MPa.
Recent publications by Gong et al. (2018) and Ramos et al. (2019) explore, experimentally and theoretically, the effects of clay mineralogy and lamination, respectively, on elastic anisotropy in shale samples. Let us also bring the reader’s attention to a recent important publication by Barbosa et al. (2019), where the authors estimate fracture compliance from attenuation and velocity analysis using full-waveform wireline data.
Because the elastic anisotropy is sometimes related to crack orientation that, in turn, may affect the transport property anisotropy, many attempts have been made to infer the latter from the former. One of the most recent examples is by Falcon-Suarez et al. (2020) whose experiments indicate that in a weakly consolidated sandstone, the stress orientation affects the elastic and electrical properties in a congruent way. Recent work by Cilli and Chapman (2021) presents a fundamental theoretical analysis linking the elastic and electrical properties of rocks with the crack aspect ratio being a critical variable.
Earlier rigorous experimental and theoretical studies linking the elastic to permeability anisotropy are by Rasolofosaon and Zinszner (2002), as well as by Gueguen and Schubnel (2003). Teng (1998) explores relations between the seismic anisotropy of fractured formations and fluid flow. This study also provides an extensive overview of the theories of fracture-induced elastic anisotropy.
Needless to say that stress-induced anisotropy (and anisotropy in general) has provided a comfortable target for numerous, often unnecessary elaborate, theories. Once again, we have no way of quoting all these theories here. Ciz and Shapiro (2009) discuss the applicability of theoretically derived stress-induced anisotropy in transversely isotropic media to experimental data from shale samples. A series of publications by Gurevich et al. (2011); Collet and Gurevich (2013); and Collet et al. (2014) puts forward an elaborate analytical apparatus for modeling elastic anisotropy resulting from triaxial state of stress. Bandyopadhyay (2009) presented an exhaustive theoretical study on stress-induced anisotropy invoking third-order elasticity, as well as discussing contact-based effective-medium models for stress-induced anisotropy in granular materials.
It is important to mention a substantial body of theoretical work by Mark Chapman and collaborators discussing elastic and attenuation anisotropy, as well as the effects of the pore fluid saturation and viscosity and frequency on velocity anisotropy (e.g., Chapman et al., 2003; Chapman, 2009; and Amalokwu et al., 2015).
Additional references on the subject follow. Smith (1963) reviews various theories existed at the time and compares them to experimental data concentrating mostly on the effect of shear wave birefringence in metals. A rigorous report discussing the theoretical and experimental aspects of stress-induced seismic anisotropy is by Rasolofosaon (1998). Yin (1992) presents pioneering experimental results on stress-induced attenuation and elastic anisotropy under three-dimensional polyaxial loading. Majmudar and Behringer (2005) present an experimental study on stress-induced anisotropy in granular materials. They address the fundamental phenomenon of the heterogeneity of the contact stress chains in such dry particulates under different boundary conditions. Hu et al. (2010) report the emergence of stress-induced anisotropy in sands due to cyclic loading and only using numerical two-dimensional discrete element method simulations. Johnson and Rasolofosaon (1996) discuss, in detail, stress-induced anisotropy in rocks on the basis of non-linear elasticity, as well as compare their theoretical results with the existing experimental data. Kuhn et al. (2015) employ three-dimensional discrete element method simulations, together with the Lattice-Boltzmann method for simulating fluid flow to numerically explore the elastic and permeability anisotropy in granular packs as a result of biaxial plane-strain compression with constant mean stress. An early experimental work on two-dimensional granular assemblies made of plastic is by Oda et al. (1985).
We believe that the most relevant and, coincidentally, elegant theoretical development came from Mavko et al. (1995), by far preceding (and perhaps triggering) the avalanche of the later theories. These authors derived a simple analytical transform to predict stress-induced elastic anisotropy in stress-sensitive materials just from the isotropic Vp and Vs measured versus hydrostatic pressure. This is the theory we will use here to support and explain our new experimental data.
The question that triggered the new experimental work presented here is whether the elastic-wave velocities measured in the laboratory under hydrostatic stress conditions are approximately the same as the vertical velocities in the crust where the stresses are anisotropic but the vertical stress is the same as the hydrostatic stress in the laboratory. Perhaps the answer is buried in the multitude of earlier experimental and theoretical results. Yet, to the best of our knowledge, nobody before has explicitly asked this question and provided a clear answer.
To this end and to clearly answer the question posed, we have conducted experiments on 6 samples, including sandstones, glass beads, and carbonates. These experiments were done 1) at pure hydrostatic stress and 2) at a uniaxial state of stress. In the latter experiments, the confining hydrostatic stress was kept constant, while the axial stress was gradually increased. The vertical velocities were compared to those measured at pure hydrostatic stress matching the total axial stress.
This comparison indicates that the answer to the posed question is “yes, approximately.” These results are confirmed by the Mavko et al. (1995) theory.
Theory
The Mavko et al. (1995) theory allows for inferring the velocities along the axial direction at anisotropic uniaxial loading from those measured at pure hydrostatic stress. The essence of this theory is that the part of the pore space represented by compliant cracks is characterized by compressional and shear compliances that are derived from Vp and Vs measured at hydrostatic loading.
Two important assumptions allow us to transform the compliances under hydrostatic stress to those under uniaxial stress: 1) The compliant cracks that are solely responsible for the stress dependence of the elastic-wave velocities are planar and, hence, their normal and shear deformations can be decoupled from each other. So is the in-plane and out-of-plane deformation. Mathematically this means that the crack compliance tensor is sparse. 2) For a thin crack under any stress field, it is predominantly the normal stress component, as resolved on the crack’s face, that is responsible for the crack’s closure and, hence, for the stress-dependence of the elastic properties of the rock containing these cracks.
These assumptions allow one to use the elastic-wave velocities measured versus hydrostatic stress to be mapped to those at any applied anisotropic state of stress. Hence, the only required inputs are Vp and Vs obtained during hydrostatic loading.
This theory is formulated in terms of the compliance tensor
where
The change in the elastic compliance at any state of stress
where
Next, all cracks having approximately the same orientation are combined into n < q sets of cracks. The unit vector
where
The final equation for the compliance increments versus stress
where
Mavko et al. (1995) illustrate the applicability of their theory by using the Barre granite and Massillon sandstone examples. Here we apply this theory to the new experimental data reported in the previous sections. These theoretical computations are based on the pure hydrostatic velocity data shown as black circles in Figures 3–8. The resulting velocities computed at uniaxial stress are shown in the same figures as light squares and compared to the respective velocities measured at the same uniaxial stress (light circles). The theory is reasonably close to the data even in the presence of strong stress anisotropy with the confining stress 1 MPa. As this stress increases, the match between the theory and experiment further improves and becomes practically perfect at high stress.
Not only does this theoretical exercise somewhat validate our experimental data. It also presents a “yes” answer to the question posed that motivated this work.
Samples and experiments
A total of six samples were selected for this study, three sandstones, two carbonates, and loose glass beads. The three sandstone samples were low-clay-content medium porosity rocks. The glass beads used were well-sorted and had high sphericity. The two carbonates, essentially pure calcite, had porosity about 10%. The porosities and mineralogies of these samples are listed in Table 1, together with the dimensions of the samples.
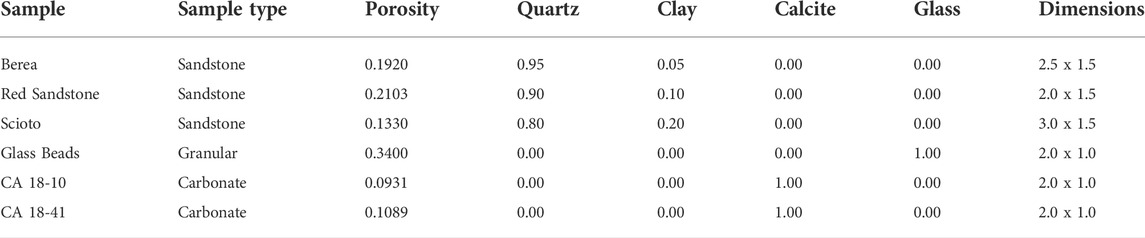
TABLE 1. Samples used in the experiments, their porosities, mineralogies, and dimensions (length by diameter in inches).
The velocity measurements were conducted in AutoLab1500 machine manufactured by New England Research. It is a triaxial frame used for ultrasonic, triaxial, as well as permeability and resistivity tests. The ultrasonic module contains a set of piezoelectric sensors located in the coreholders with the frequency 750 kHz. The source sends three input impulses: one P- and two S-waves (the latter two with the normal to each other polarization) through the sample. The arrivals are captured at the receiver at the base of the coreholder.
Each sample was placed in a rubber sleeve (holder) subject to hydrostatic pressure exerted by the surrounding mineral oil. Additional vertical axial stress was applied by a piston through the end caps in the holder. All samples were room-dry. The length of the sample was recorded by a pair of linear variable differential transformers (LVDT). The schematic depiction of the experimental setup is shown in Figure 1.
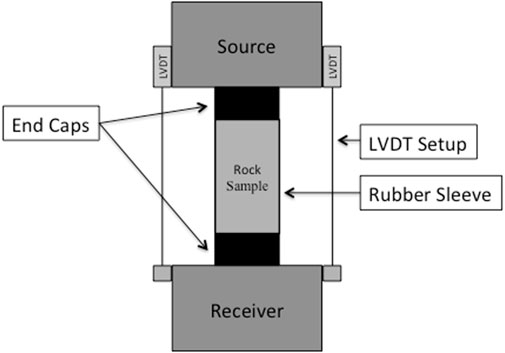
FIGURE 1. Schematic depiction of the experimental setup.
The P- and S-wave velocities were computed by dividing the sample length by the signal arrival time (first break). The sample length used was variable as recorded by LVDT. The latter was picked at the first arrival as shown in Figure 2 (an example for Berea sandstone).
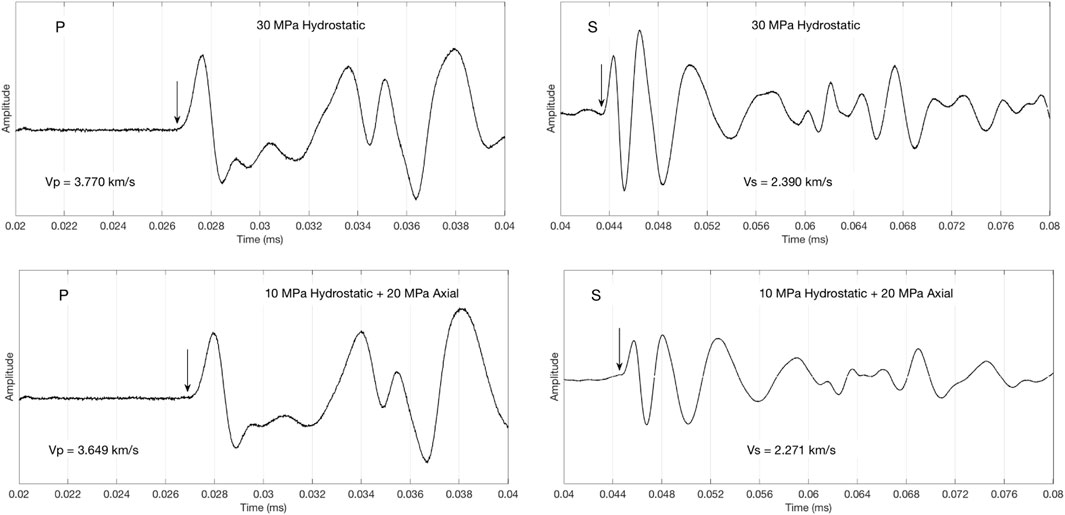
FIGURE 2. P-wave (left) and S-wave (right) waveforms in Berea sandstone at 30 MPa pure hydrostatic stress (top) and 10 MPa hydrostatic stress plus 20 MPa axial stress (bottom), equivalent to 30 MPa total axial stress. The arrows show the first arrival picks.
The P-wave arrival was picked at the first break while the S-wave arrivals were picked at the first trough (as shown in Figure 2). These picks were first determined at high stress where the arrivals appeared very clear. Then the waveform features thus established were tracked to the lower-stress arrivals. The errors in velocity determination did not exceed 1%.
Each sample was subject to five separate experiments: 1) pure hydrostatic loading from zero to 40 MPa with a 10 MPa increment and 2) four constant confining stress stations of 1, 10, 20, and 30 MPa with the axial stress gradually increasing at each station with a 10 MPa increment. Maximum stress never exceeded 40 MPa. In all cases, the samples were subjected to several loading/unloading cycles to arrive at repeatable velocity-stress behaviors. During the final two cycles (loading and unloading) the velocity versus stress curves were practically the same. No hysteretic behaviors were observed.
In the case of glass beads, we were only able to obtain reliable results with the 10 MPa difference between the hydrostatic and axial stress. Past that stress difference, the sample simply collapsed.
In all cases, the S-wave splitting was minimal, hence indicating very small (practically negligible) anisotropy in the relevant direction.
Results: Sandstones
The experimental results for Berea sandstone are shown in Figure 3. Here, we compare Vp and Vs measured at pure hydrostatic stress with those measured at the equivalent total axial stress. The differences appear to be significant at the 1 MPa fixed hydrostatic stress station, but become small at 10 MPa station even where the contrast between the total axial and fixed hydrostatic stress is as high as 30 MPa.
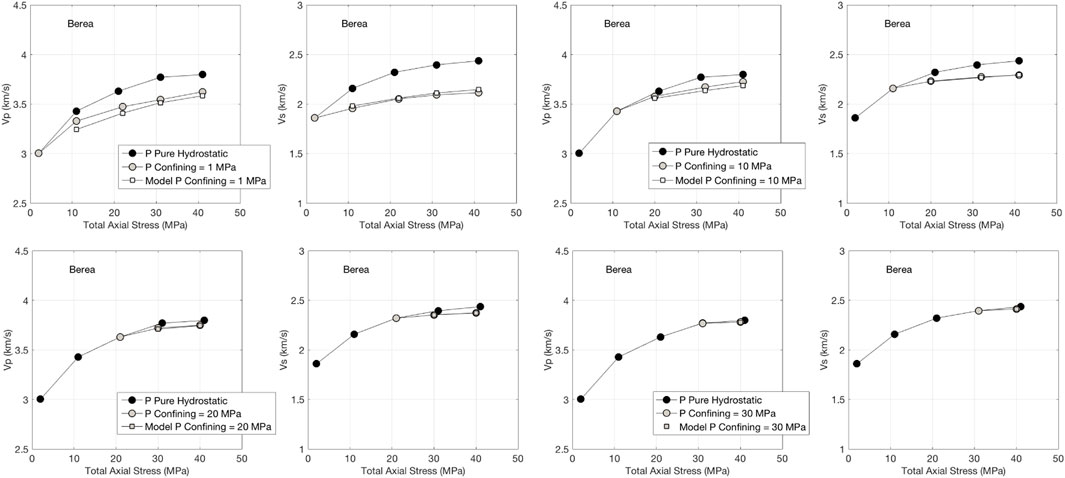
FIGURE 3. P-wave and S-wave velocities in Berea sandstone for pure hydrostatic loading as denoted by black symbols; and fixed hydrostatic stress 1 and 10 MPa (top) and 20 and 30 MPa (bottom) with the increasing axial stress as denoted by open symbols. The latter results are compared to those from the Mavko et al. (1995) model (denoted by open-square symbols).
These velocity differences become hardly noticeable at the 20 and 30 MPa fixed hydrostatic stress stations hence proving that even in the presence of large stress anisotropy, the vertical velocities at pure hydrostatic stress are approximately the same as at the equivalent total axial stress.
The same results, but for the “Red Sandstone” sample are shown in Figure 4. The conclusion here is the same as in the case of Berea sandstone. This conclusion also holds for Scioto sandstone sample (Figure 5).
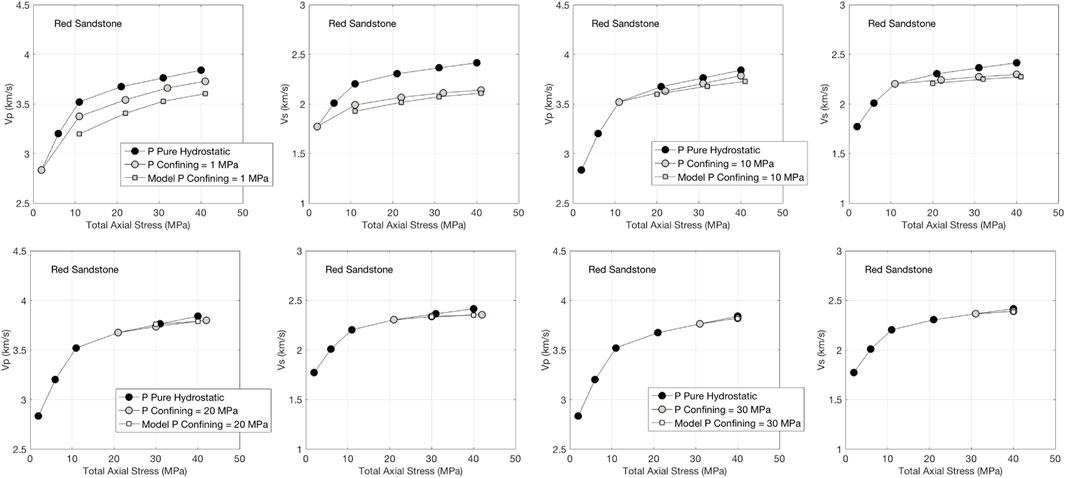
FIGURE 4. Same as Figure 3, but for Red sandstone.
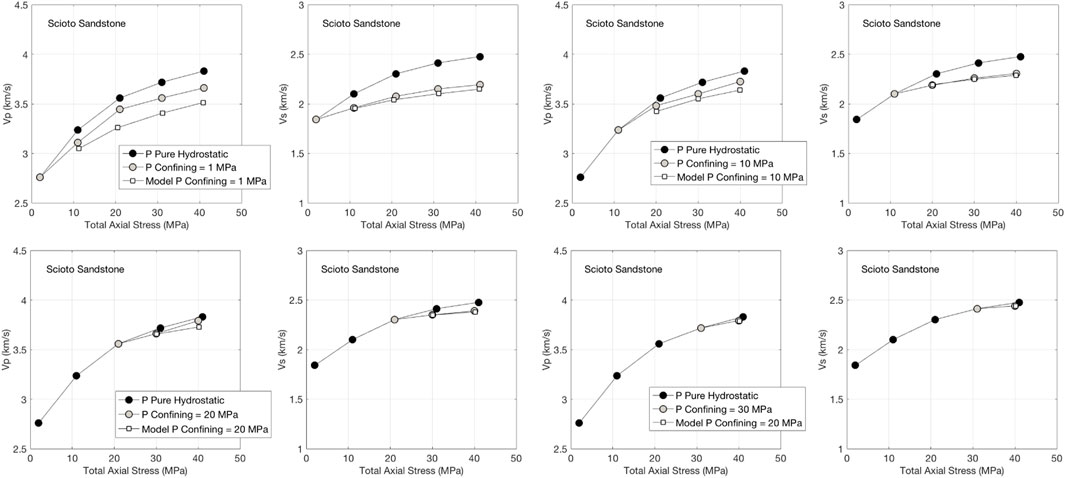
FIGURE 5. Same as Figure 3, but for Scioto sandstone.
Results: Glass beads
Because the glass beads sample was very friable, we could only register coherent ultrasonic signals at uniaxial loading where the difference between the axial and confining hydrostatic stress did not exceed 10 MPa. Past this threshold, the sample uncontrollably deformed. Specifically, we can only compare the velocities measured at 1) the total axial stress 20 MPa with 10 MPa confining pressure to those measured at pure hydrostatic stress 20 MPa; 2) at the total axial stress 30 MPa with 20 MPa confining pressure to those measured at pure hydrostatic stress 30 MPa; and 3) at the total axial stress 40 MPa with 30 MPa confining pressure to those measured at pure hydrostatic stress 40 MPa.
The results shown in Figure 6 indicate that the relative difference in Vp in the first case is about 3%, while that in Vs is about 6%. In the second case, these differences are even smaller, while they are practically zero in the third case.
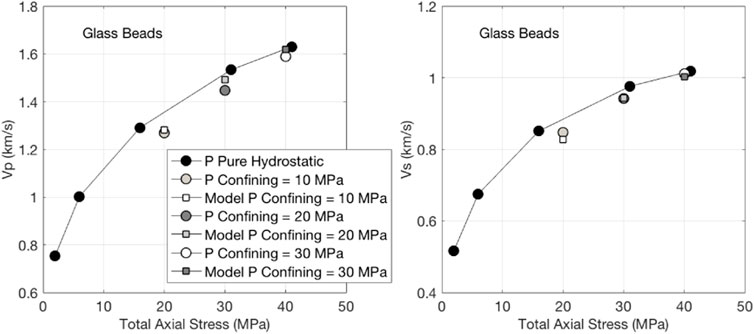
FIGURE 6. Same as Figure 3, but for glass beads.
Results: Carbonates
The measurement results for the carbonate CA 18-10 are shown in Figure 7. The relative velocity difference at 40 MPa total axial stress and 1 MPa confining hydrostatic stress is about 5% in Vp and 7% in Vs. However, as the confining hydrostatic stress increases, these differences are reduced and become very small at 30 MPa confining hydrostatic stress.
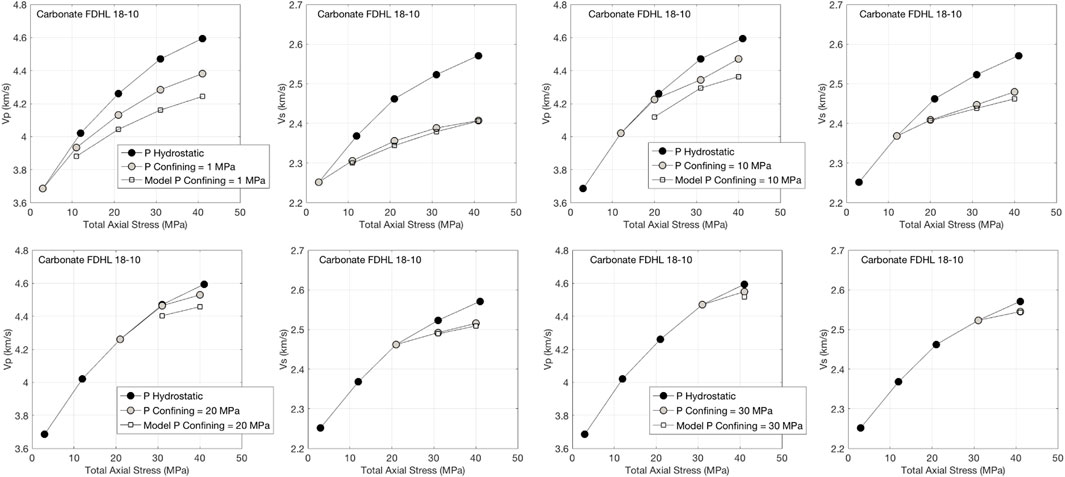
FIGURE 7. Same as Figure 3, but for carbonate CA 18-10.
Similarly, the differences between the velocities measured at pure hydrostatic stress and those measured at the equivalent total axial stress, the latter at anisotropic loading, appear quite small for carbonate CA 18-41 (Figure 8). These results confirm the conclusion derived from the experiments conducted on sandstones and glass beads that the vertical velocities even at significant stress anisotropy are close to those at the equivalent hydrostatic stress.
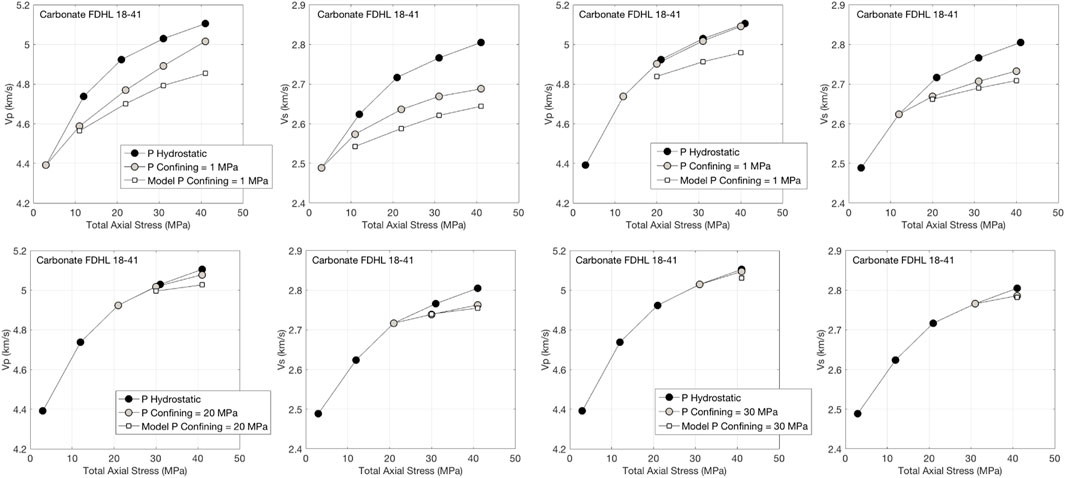
FIGURE 8. Same as Figure 3, but for carbonate CA 18-41.
Discussion
We show, by example, that the vertical P- and S-wave velocities measured at uniaxial stress are close to those measured at the same hydrostatic stress even in the presence of very strong stress anisotropy. Predictably, this match improves as the stress anisotropy is reduced. These velocities are practically the same even where the axial stress exceeds the confining hydrostatic pressure by 10 MPa and at 40 MPa total axial stress, which amounts to 25% stress anisotropy.
The Mavko et al. (1995) theory confirms this conclusion, albeit only for materials approximately elastically isotropic under isotropic stress. The match between the theory and experiment is practically perfect at high stress and deteriorates at very small stress. One reason is the idealization present in the theoretical assumptions. For example, some cracks may open at very high anisotropic stress, while the theory assumes uniform crack closure. Also, the theory assumes the initially elastically isotropic material, while some of the samples used may be structurally anisotropic. Finally, due to these theoretical assumptions, the theory underestimates the data at high anisotropic stress differences. Mavko et al. (1995) show a similar behaviors in some of their examples.
Of course, as in any robust scientific argumentation, a counterexample is needed to show where this conclusion is invalid, thus hedging the realm of its applicability. To address this issue, additional experiments are in order, perhaps dealing with naturally strongly anisotropic rocks, such as laminated shale.
Another issue not covered by the present study is that of spatial scale. Namely, how these results obtained on inch-sized samples can be translated into the reservoir and/or basin scales. Clearly, controlled experiments at such scales are hardly tenable. Perhaps analytical techniques can be used to address this question in the future.
Conclusion
We have provided clear proof that the elastic-wave velocities measured in a vertical borehole under generally anisotropic state of stress are very close to those measured in the laboratory at purely hydrostatic stress equal to the vertical stress in the crust. This proof is by example. The examples include medium-porosity sandstones, an unconsolidated glass bead pack, and low-to-medium porosity carbonates. An existing analytical theory confirms this result. A practical aspect of this conclusion is that the velocities measured on the samples extracted from the borehole and at variable hydrostatic stress can be used to predict and interpret the time-lapse seismic data as the pore pressure changes during production. Another practical implication is for seismic processing, as well as impedance inversion. Specifically, the elastic properties measured in a vertical borehole or obtained in hydrostatic laboratory experiments can be used in the aforementioned procedures. Finally, our results can be relevant in digital rock physics experiments where a hydrostatic laboratory experiment can serve as a calibration for digitally-derived elastic property computations.
Data availability statement
The raw data supporting the conclusions of this article will be made available by the authors, without undue reservation.
Author contributions
All authors listed have made a substantial, direct, and intellectual contribution to the work and approved it for publication.
Funding
This work was provided by the Center for Integrative Petroleum Research of College of Petroleum Engineering and Geosciences at King Fahd University of Petroleum and Minerals, the Kingdom of Saudi Arabia.
Acknowledgments
We thank Gary Mavko for providing the code to compute the velocities at uniaxial stress from those measured at hydrostatic stress. Thanks go to our imaging team, Rizwanullah Hussaini, Nadeem Ahmed, and Hani Al-Mukainah for supplying CT-scan images of the samples under examination. We thank Marjory Matic for editing the text.
Conflict of interest
The authors declare that the research was conducted in the absence of any commercial or financial relationships that could be construed as a potential conflict of interest.
Publisher’s note
All claims expressed in this article are solely those of the authors and do not necessarily represent those of their affiliated organizations, or those of the publisher, the editors and the reviewers. Any product that may be evaluated in this article, or claim that may be made by its manufacturer, is not guaranteed or endorsed by the publisher.
References
Amalokwu, K., Chapman, M., Best, A. I., Minshull, T. A., and Li, X.-Y. (2015). Water saturation effects on P-wave anisotropy in synthetic sandstone with aligned fractures. Geophys. J. Int. 202, 1088–1095. doi:10.1093/gji/ggv192
Bandyopadhyay, K. (2009). Seismic anisotropy: Geological causes and its implications to reservoir geophysics. Stanford, CA: Stanford University. Ph.D. thesis.
Barbosa, N. D., Caspari, E., Rubino, J. G., Greenwood, A., Baron, L., and Holliger, K. (2019). Estimation of fracture compliance from attenuation and velocity analysis of full-waveform sonic log data. J. Geophys. Res. Solid Earth 124, 2738–2761. doi:10.1029/2018jb016507
Bhuiyan, M. H., and Holt, R. M. (2016). Anisotropic parameters of dry and saturated sand under stress. Geophysics 81, C229–C241. doi:10.1190/geo2015-0354.1
Chapman, M., Maultzsch, S., Liu, E., and Li, X.-Y. (2003). The effect of fluid saturation in an anisotropic multi-scale equant porosity model. J. Appl. Geophys. 54, 191–202. doi:10.1016/j.jappgeo.2003.01.003
Chapman, M. (2009). Modeling the effect of multiple sets of mesoscale fractures in porous rock on frequency-dependent anisotropy. Geophysics 74, D97–D103. doi:10.1190/1.3204779
Cilli, P. A., and Chapman, M. (2021). Linking elastic and electrical properties of rocks using cross-property DEM. Geophys. J. Int. 225, 1812–1823. doi:10.1093/gji/ggab046
Ciz, R., and Shapiro, S. A. (2009). Stress-dependent anisotropy in transversely isotropic rocks: Comparison between theory and laboratory experiment on shale. Geophysics 74, D7–D12. doi:10.1190/1.3008546
Collet, O., and Gurevich, B. (2013). Fluid dependence of anisotropy parameters in weakly anisotropic porous media. Geophysics 78, WC137–WC145. doi:10.1190/geo2012-0499.1
Collet, O., Gurevich, B., Madadi, M., and Pervukhina, M. (2014). Modeling elastic anisotropy resulting from the application of triaxial stress. Geophysics 79, C135–C145.
Crampin, S. (1985). Evaluation of anisotropy by shear-wave splitting. Geophysics 50, 142–152. doi:10.1190/1.1441824
Dillen, M. W. P., Cruts, H. M. A., Groenenboom, J., Fokkema, J. T., and Duijndam, A. J. W. (1999). Ultrasonic velocity and shear-wave splitting behavior of a Colton sandstone under a changing triaxial stress. Geophysics 64, 1603–1607. doi:10.1190/1.1444664
Falcon-Suarez, I. H., North, L., Callow, B., Bayrakci, G., Bull, J., and Best, A. (2020). Experimental assessment of the stress-sensitivity of combined elastic and electrical anisotropy in shallow reservoir sandstones. Geophysics 85, MR271–MR283. doi:10.1190/GEO2019-0612.1
Gong, F., Di, B., Wei, J., Ding, P., Pan, X., and Zu, S. (2018). Ultrasonic velocity and mechanical anisotropy of synthetic shale with different types of clay minerals. Geophysics 83, MR57–MR66. doi:10.1190/GEO2016-0590
Gueguen, Y., and Schubnel, A. (2003). Elastic wave velocities and permeability of cracked rocks. Tectonophysics 370, 163–176. doi:10.1016/S0040-1951(03)00184-7
Gurevich, B., Pervukhina, M., and Makarynska, D. (2011). An analytic model for the stress-induced anisotropy of dry rocks. Geophysics 76, WA125–WA133. doi:10.1190/1.3567950
Hu, M., O’Sullivan, C., Jardine, R. R., and Jiang, M. (2010). Stress-induced anisotropy in sand under cyclic loading. Granul. Matter 12, 469–476. doi:10.1007/s10035-010-0206-7
Hudson, J. A. (1980). Overall properties of a cracked solid. Math. Proc. Camb. Phil. Soc. 88, 371–384. doi:10.1017/S0305004100057674
Johnson, P. A., and Rasolofosaon, P. N. J. (1996). Nonlinear elasticity and stress-induced anisotropy in rock. J. Geophys. Res. 101, 3113–3124. doi:10.1029/95jb02880
Johnson, K. L. (1985). Contact mechanics. Cambridge, England: Cambridge University Press, 452. doi:10.1017/CBO9781139171731
Kuhn, M. R., Sun, W, C., and Wang, Q. (2015). Stress-induced anisotropy in granular materials: Fabric, stiffness, and permeability. Acta Geotech. 10, 399–419. doi:10.1007/s11440-015-0397-5
Majmudar, T. S., and Behringer, R. P. (2005). Contact force measurements and stress-induced anisotropy in granular materials. Nature 435, 1079–1082. doi:10.1038/nature03805
Mavko, G., Mukerji, T., and Godfrey, N. (1995). Predicting stress-induced velocity anisotropy in rocks. Geophysics 60, 1081–1087. doi:10.1190/1.1443836
Nadri, D., Bona, A., Brajanovski, M., and Lokajicek, T. (2011). Estimation of stress-dependent anisotropy from P-wave measurements on a spherical sample. Geophysics 76, WA91–WA100. doi:10.1190/1.3552703
Nur, A., and Simmons, G. (1969). Stress-induced velocity anisotropy in rock: An experimental study. J. Geophys. Res. 74, 6667–6674. doi:10.1029/jb074i027p06667
Nur, A. (1971). Effects of stress on velocity anisotropy in rocks with cracks. J. Geophys. Res. 76, 2022–2034. doi:10.1029/jb076i008p02022
Oda, M., Nemat-Nasser, S., and Konishi, J. (1985). Stress-induced anisotropy in granular masses. Soils Found. 25, 85–97. doi:10.3208/sandf1972.25.3_85
Ramos, M. J., Espinosa, D. N., Laubach, S. E., and Torres-Verdin, C. (2019). Quantifying static and dynamic stiffness anisotropy and nonlinearity in finely laminated shales: Experimental measurement and modeling. Geophysics 84, MR25–MR36. doi:10.1190/GEO2018-0032.1
Rasolofosaon, P. N. J., and Zinszner, B. E. (2002). Comparison between permeability anisotropy and elasticity anisotropy of reservoir rocks. Geophysics 67, 230–240. doi:10.1190/1.1451647
Rasolofosaon, P. N. J. (1998). Stress-induced seismic anisotropy revisited. Rev. Inst. Fr. Pet. 53, 679–692. http://hal-ifp.archives-ouvertes.fr/hal-02079038. doi:10.2516/ogst:1998061
Smith, R. T. (1963). Stress-induced anisotropy in solids—the acousto-elastic effect. Ultrasonics 1, 135–147. doi:10.1016/0041-624X(63)90003-9
Teng, L. (1998). Seismic and rock-physics characterization of fractured reservoirs. Stanford, CA: Stanford University. Ph.D. thesis.
Yin, H. (1992). Acoustic velocity and attenuation in rocks: Isotropy, intrinsic anisotropy, and stress-induced anisotropy. Stanford, CA: Stanford University. Ph.D. thesis.
Keywords: velocity, anisotropy, stress, elastic moduli, hydrostatic
Citation: Muqtadir A, Al-Dughaimi S, Alzaki T and Dvorkin J (2022) Vertical velocity at hydrostatic and anisotropic stresses. Front. Earth Sci. 10:978647. doi: 10.3389/feart.2022.978647
Received: 26 June 2022; Accepted: 27 July 2022;
Published: 29 August 2022.
Edited by:
Luan Thanh Pham, VNU University of Science, VietnamReviewed by:
Bikash Sinha, Schlumberger Doll Research, United StatesNicolás Barbosa, Université de Lausanne, Switzerland
Copyright © 2022 Muqtadir, Al-Dughaimi, Alzaki and Dvorkin. This is an open-access article distributed under the terms of the Creative Commons Attribution License (CC BY). The use, distribution or reproduction in other forums is permitted, provided the original author(s) and the copyright owner(s) are credited and that the original publication in this journal is cited, in accordance with accepted academic practice. No use, distribution or reproduction is permitted which does not comply with these terms.
*Correspondence: Jack Dvorkin, amFja2R2b3JraW4wMDdAZ21haWwuY29t