 Mingwen Lu
 Jianshe Lei
- Key Laboratory of Crustal Dynamics, National Institute of Natural Hazards, MEMC, Beijing, China
To better understand the anisotropic structure and mantle dynamics in and around the Luxi uplift segment of the Tanlu fault zone in East China, we collect waveform data recorded at 47 NCISP (Northern China Interior Structure Project) portable seismic stations during November 2000 to August 2001. Using the minimum transverse energy grid-search method of SKS wave splitting measurement, effective splitting results at 35 stations are obtained. Our results show that the fast wave polarization direction (FPD) in the study area is dominated by a nearly E-W direction, with a range of 70°–116° and an average FPD of N98°E, which is generally perpendicular to the trend of the Tanlu fault zone. The splitting time varies from 0.6 to 1.5 s with an average of 0.94 s. Although there are subtle differences in FPDs of different tectonic units, it is still evident that larger splitting times amounting to ∼1.2 s are located north of the Luxi uplift, which is closely associated with the E-W horizontal flow in the big mantle wedge (BMW). In contrast, smaller splitting times are visible between the two branches of the Tanlu fault zone, indicating the existence of upwelling flow in the BMW. These complex mantle flow suggests that the BMW structure has played an important role in the deep dynamic processes beneath East Asia.
Introduction
The NNE-SSW trending Tanlu fault zone is the largest active fault zone in eastern China with a total length of more than 2,400 km in China (Figure 1). It starts from Guangji, Hubei Province on the North Bank of the Yangtze River in the south, passes through Lujiang, Anhui Province, Suqian, Jiangsu Province, Tancheng, Shandong Province, and Bohai Bay in the north, then it is divided into the Yilan-Yitong fault in the western branch and the Dunhua-Mishan fault in the eastern branch (Figure 1) (e.g., Zheng et al., 1988; Xu and Zhu, 1994; Zhu et al., 2004a; Deng et al., 2013). Since the Mesozoic, the Tanlu fault zone has undergone complex evolution processes including strong left lateral displacement, extension and compression (e.g., Xu and Zhu, 1994; Wang et al., 2000; Zhu et al., 2001; Ren et al., 2002; Zhang et al., 2003a; Zhang et al., 2003b; Zhu et al., 2008). At the end of the Permian, the North China Craton collided with the South China plate and formed the Dabie-Sulu orogenic belt (e.g., Yin and Nie, 1993; Li, 1994; Lin et al., 1998). During the Jurassic to the early Cretaceous, the fault zone experienced many large-scale left lateral translations (e.g., Xu, 1980; Xu and Zhu, 1994; Wang et al., 2000), but it was in a tensile environment with a large number of volcanic activities and extensional basins from the early Cretaceous to the early Tertiary (e.g., Zhu et al., 2001; Zhang et al., 2003a; Zhu et al., 2008). Since the late Tertiary, the fault zone showed a type of dextral strike-slipping (e.g., Wang et al., 2000; Ren et al., 2002; Zhang et al., 2003b; Zhu et al., 2004a). The Tanlu fault zone is still active, and many small earthquakes frequently occurred on the Luxi uplift segment of the fault zone (e.g., Yin et al., 2019; Lei et al., 2020; Tian et al., 2020). Furthermore, the 1668 Tancheng M 8.5 earthquake also occurred there (Figure 1). Thus, it is important to investigate the deep structure and dynamics of the Tanlu fault zone. Although many investigations have been carried out on the Tanlu fault zone (e.g., Chen et al., 2006; Meng et al., 2019; Lei et al., 2020; Ma et al., 2020; Tian et al., 2020), the formation mechanism and evolutional processes of the fault zone are still unclear.
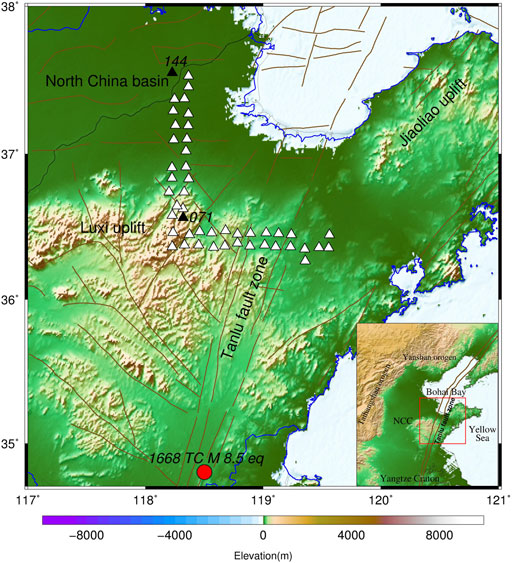
FIGURE 1. Tectonic map of the Luxi uplift segment of the Tanlu fault zone and the distribution of seismic stations used in this study. Triangles denote 47 NCISP portable seismic stations (www.iris.edu), of which two black triangles denote Stations 071 and 144 used in Figure 3. The red circle denotes the epicenter of the 1668 Tancheng (TC) M 8.5 earthquake. The inset shows the location of the study region. NCC, the North China Craton. The red lines denote major active faults (Deng et al., 2002).
The results from geoscience cross section showed that the Tanlu fault zone is a deep and large fault zone with steep fault planes, suggesting that the lithosphere controls the upwelling of mantle thermal material and magma intrusion (e.g., Ma et al., 1991; Chen et al., 1993; Zhao and Xu, 2009; Liu et al., 2015). Magnetotelluric soundings showed that the Tanlu zone is a strike-slipping structure that cuts through the Moho and extends downward to the upper mantle in the deep mantle, whereas in the shallow mantle there are an extensional fault and a depression basin (Ye et al., 2009; Zhang et al., 2010). Receiver function analyses and deep seismic soundings showed that the Moho and LAB (Lithosphere-Asthenosphere-Boundary) depth near the Tanlu zone is ∼32–35 and ∼60–80 km, respectively (e.g., Chen et al., 2006; Zheng et al., 2008; Guo et al., 2012), whereas ambient noise tomography showed obvious changes on the eastern and western sides of the fault zone in the crust (e.g., Liu et al., 1987; Li et al., 2011; Meng et al., 2019; Ma et al., 2020). Several Pn anisotropic tomography models showed segmented features of lithospheric deformation under the Tanlu fault zone, but their results focused on the lithospheric lid (e.g., Gu et al., 2016, 2020; Yin et al., 2019; Miao et al., 2021). To better understanding the upper-mantle deformation and dynamics, many SKS splitting measurements in eastern China illustrated some significant results (e.g., Zheng et al., 1994; Zhao et al., 2005, 2011; Chang et al., 2009, 2012; Gao et al., 2010; Wu et al., 2012; Yang et al., 2019). However, different researchers adopted different data sets and methods, thus there are some subtle contrasts in the upper mantle structure, which leads to hard understand the mantle dynamics of the Tanlu fault zone. Therefore, in this study, we collect the SKS waveform data from densely portable seismic stations in the Luxi uplift segment of the Tanlu fault zone, and measure the reliable anisotropic features by SKS splitting method. Our results provide new insights into the dynamics of the upper mantle around the Tanlu fault zone in eastern China.
Geological setting
The Tanlu fault zone is a large-scale NNE-SSW trending deep fault in eastern China, which runs through the North China basin and crosses different geological structural units, and plays an important role in the deformation process of Mesozoic and Cenozoic basins. The Tanlu fault in the Mesozoic era is a strong left lateral strike slip fault (e.g., Xu and Zhu, 1994; Zhu et al., 2001; 2004a). Since the Cenozoic, it has shown strong compressive properties and dextral strike slip characteristics (e.g., Wang et al., 2000; Ren et al., 2002; Zhang et al., 2003b; Zhu et al., 2004a), reflecting the change of tectonic stress field since the Cenozoic in eastern Chinese mainland.
Our present study area is located at 118° -120°E and 36° -38°N, belonging to the middle part of the Tanlu fault zone. The geological structure of the study area is relatively complex. The main geological units are the North China basin, the Luxi uplift, and the Jiaoliao uplift (Figure 1). There are the same crystalline basements in the Luxi uplift and the North China basin, their tectonic evolution process has significant differentiation since the Cenozoic (Li et al., 2007). The basement of the North China basin developed to be extensive rifting in the Cenozoic, and then turned into a period of thermal silence (e.g., Zhu et al., 2001; Guo et al., 2012). The Luxi uplift entered a period of intense crustal movements with typical mantle derived magmatic activities in the Mesozoic and Cenozoic (e.g., Lin et al., 1996; Qiu et al., 2001; Zhu et al., 2004b). The Mesozoic intrusive rocks are widely distributed and of various types (Zhang et al., 2007), whereas the Cenozoic magma is mainly composed of diabase and basalt (e.g., Niu et al., 2004; Qiu et al., 2005). Furthermore, the results inferred from xenoliths in this area showed mantle partial melting, invasion and upwelling since the Cenozoic (e.g., Niu et al., 2004; Qiu et al., 2005).
Data and method
The waveform data used in this study were recorded at the 47 dense portable seismic stations of the NCISP (Northern China Interior Structure Project) array during November 2000 to August 2001 (Chen et al., 2006). These portable stations were deployed across the Luxi uplift segment of the Tanlu fault zone (Figure 1). Figure 2 shows the spatial distribution of 133 teleseismic events with epicenter distances larger than 83° and magnitudes greater than 5.5. It is visible that these events have good azimuth coverage around the study area.
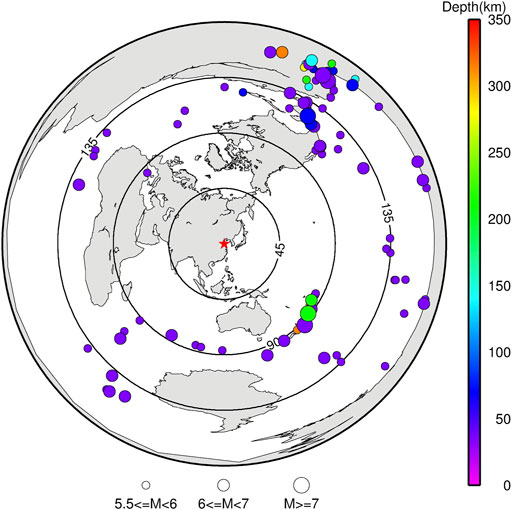
FIGURE 2. Epicentral distribution of teleseismic events used in this study. The size and color of the dots denote the event magnitude and focal depth, whose scales are shown at the bottom and on the right, respectively. The red star denotes the center of our study region.
Shear-wave splitting technique is one of the important methods to study the anisotropy of the upper mantle. When S wave passes through the anisotropic medium in the mantle, it will split into a pair of fast and slow waves with orthogonal polarization directions. The fast wave direction φ and splitting time δt are used to describe the anisotropy of the upper mantle. In this study, the SC method (minimum transverse energy grid search method; Silver and Chan, 1991) is used to obtain the anisotropic structural characteristics under each station in the Luxi uplift segment of the Tanlu fault zone. The anisotropic parameters and their errors can be determined by calculating the results from a single event in different directions. For multiple teleseismic events recorded at the same station, the anisotropic parameters under the station can be processed using the similar method of Vinnik et al. (1989). Most of the SKS splitting measurements in eastern China show that the splitting time is ∼0.5–1.5 s (e.g., Chang et al., 2009, 2012; Wu et al., 2012; Yang et al., 2019). Thus, we perform a grid search for fast wave direction from −90° to 90° in step of 1° and splitting time from 0 to 3 s in step of 0.05 s, respectively. The uncertainties are estimated by the 95% confidence areas using the F-test. The SKS waveform time window used for splitting measurements contains at least one full SKS phase. The bandpass filter frequency is from 0.04 to 0.5 Hz, which contains the S wave dominant frequency of 0.125 Hz. Details of the calculation procedures can be found in the work of Lu et al. (2020). Figure 3 shows examples of shear-wave splitting results at Stations 071 and 144 (see Figure 1 for the station locations). It can be seen from Figure 3 that the energy of the transverse component becomes very small after anisotropic correction, the pattern of the particle motion changes from elliptical to nearly linear, and the initial phase of the fast and slow waves after correction also becomes basically the same, suggesting that the anisotropic splitting parameters can be obtained using this method.
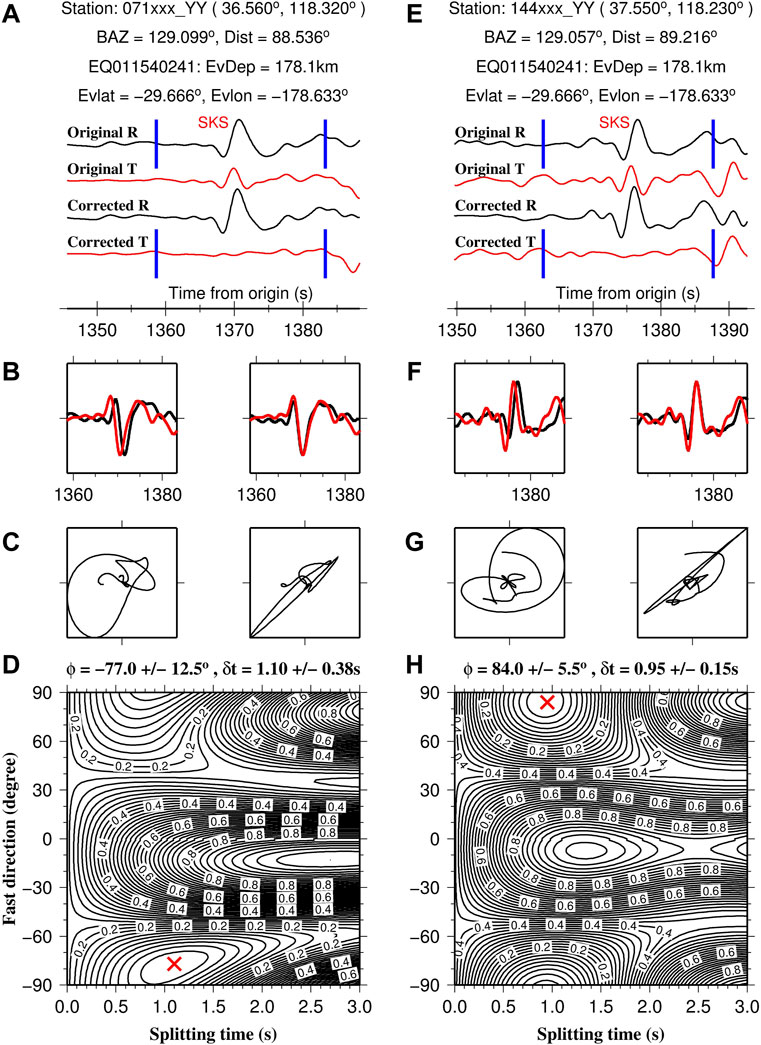
FIGURE 3. Two examples of the SKS splitting analyses at Stations 071 (A–D) and 144 (E–H) as shown in Figure 1. (A,E) Original and corrected radial (R) and transverse (T) SKS seismograms. (B,F) Original (left) and corrected (right) fast (red) and slow (black) waves. (C,G) Original (left) and corrected (right) SKS particle motion patterns. (D,H) Contour plots of transverse energy. The red cross represents the optimal splitting parameters.
Results
In this study, 819 pairs of splitting parameters of 47 portable stations are analyzed using the SC method (Silver and Chan, 1991). The measurements are ranked into good, fair, null and poor using three parameters (Liu et al., 2008), 1) Ror, the signal to noise ratio (SNR) on the original radial component, 2) Rot, the SNR on the original transverse component, 3) Rct, the SNR on the corrected transverse component. If the result is good, then Ror ≥ 10, Rot ≥ 2, and Rct/Rot ≤ 0.7. If the result is fair, then 3 ≤ Ror ≤ 10, Rot ≥ 2, and Rct/Rot ≤ 0.7. If the result is null, then Ror ≥ 3 and Rot < 2. If the result is poor, then Ror < 3. To ensure the reliability of our results, the measurements are checked manually based on the following criteria. For good and fair measurements, the particle motion is corrected from ellipse before to linearity after anisotropy removal. However, for null measurements, the particle motion keeps linear due to the absence of shear-wave splitting or shear-wave orientation parallel or perpendicular to the polarization direction of the incoming waveform (Barruol et al., 1997; Qiang et al., 2017; Yang et al., 2019). After careful manual selection with the criteria as described above, invalid splitting results of 12 stations are removed, whereas the effective splitting parameters of 35 stations are retained, as shown in Table 1 and Figure 4. For the station recording multiple events, the good and fair measurement is obtained by averaging the splitting results from all the events. For details, see Vinnik et al. (1989). It is visible from Figure 4 that the FPD is nearly E-W, though there exist some detailed differences. Figure 5 shows histograms of teleseismic events and stations with the FPD and splitting time. The FPD in the study area is mainly near E-W direction, with a range of 70°–116° and an average FPD of N98°E, which is largely perpendicular to the trend of the Tanlu fault zone. To straightforward see the variation of splitting times beneath the stations, Figure 6 distinguishes the extent of splitting times beneath the stations in colors. The splitting time varies from 0.6 to 1.5 s with an average of 0.94 s, and most of them are fallen between 0.7 and 1.1 s. To clearly illustrate more details of our measurements, Figure 7 and Table 1 show our splitting results including all null measurements beneath the stations recording an individual event. The null results indicate shear-wave orientation parallel or perpendicular to the polarization direction of the incoming waveform (Wüstefeld and Bokelmann, 2007). Most null measurements in our study region are distributed in the Luxi uplift and Tanlu fault zone (Figure 7), suggesting the existence of complex anisotropic structure (Yang et al., 2019).
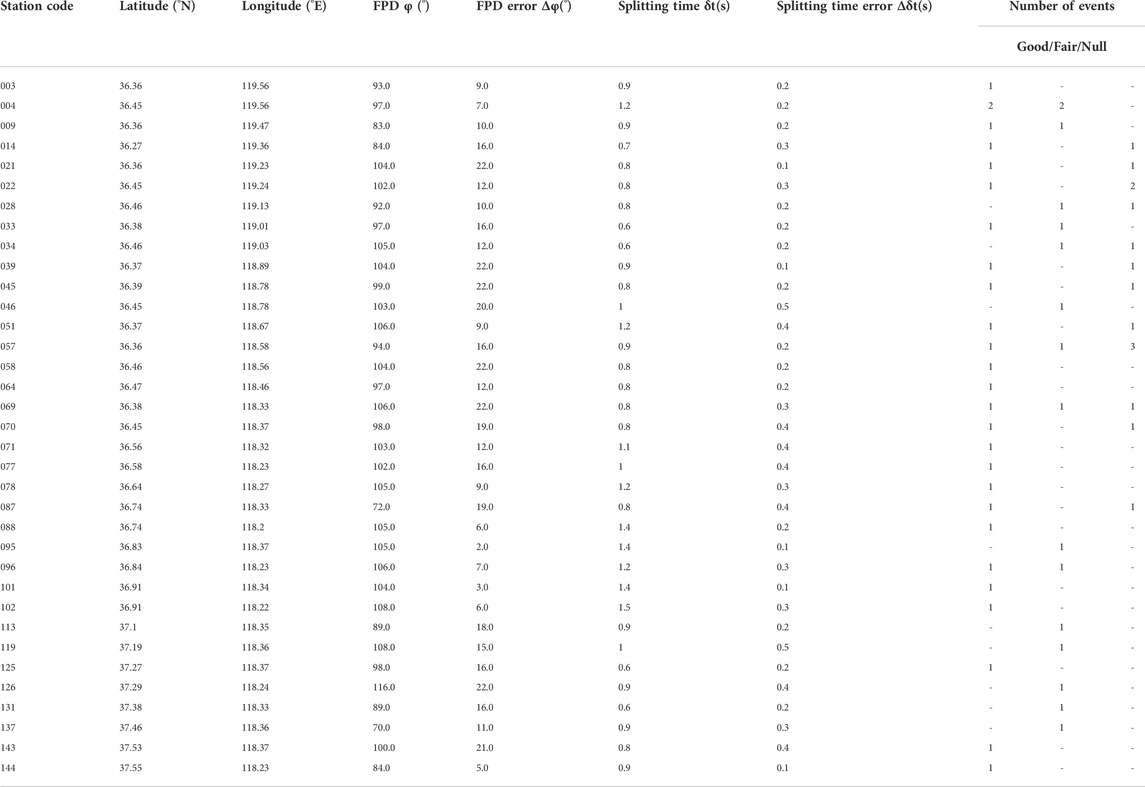
TABLE 1. The obtained valid SKS splitting results at 35 seismic stations around the Luxi uplift segment of the Tanlu fault zone.
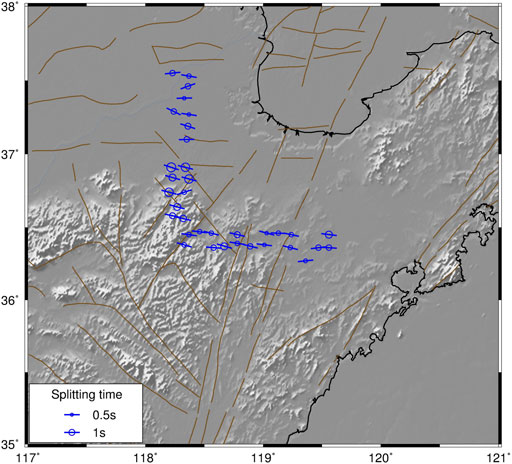
FIGURE 4. Obtained SKS splitting results in our study region. The orientation of each short bar denotes the fast direction, whereas the size of each circle is proportional to the splitting time. The red lines denote major active faults (Deng et al., 2002).
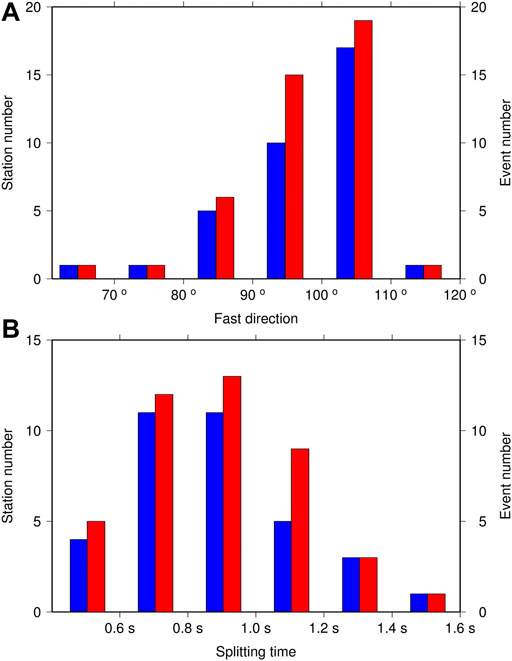
FIGURE 5. Histogram of the obtained fast directions (A) and splitting times (B) in our study region. The blue and red histograms denote the numbers of seismic stations and events, respectively.
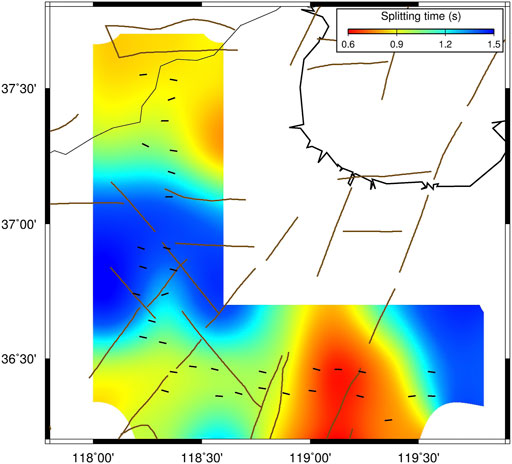
FIGURE 6. The same as Figure 4 but for the colors expressing the splitting times at the stations. The red and blue colors denote small and large splitting times, respectively, whose scale is shown at the upper-right corner of the map. The orientation of each short bar denotes the fast direction. The red lines denote major active faults (Deng et al., 2002).
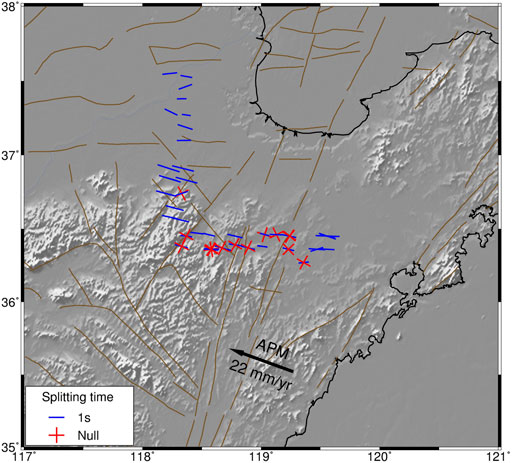
FIGURE 7. Individual (blue bar) and null (red cross) shear-wave splitting measurements at each station. The orientation of each short bar denotes the fast direction, whereas the length of the short bar is proportional to the splitting time. The black arrow denotes the direction of absolute plate motion (APM). The red lines denote major active faults (Deng et al., 2002).
In the North China basin to the west of the Tanlu fault zone, the effective splitting results of 8 stations are obtained (Figure 4). From north to south, the FPDs change from near E-W to NWW-SEE, and then gradually change to E-W again. The average FPD and splitting time are N94°E and 0.8 s, respectively.
In the north part of the Luxi uplift, the FPDs of 9 stations are relatively consistent, with an average direction of N101°E. The splitting times under these stations are the largest, ∼1.2 s on average, in the whole study area. The FPDs of these stations in the eastern Luxi uplift are similar to those in the north. Their splitting times become relatively smaller, but they tend to increase gradually from west to east, which are consistent with those from Wu et al. (2012).
Within the Tanlu fault zone, the average FPD and splitting time of 4 stations are N99°E and 0.7 s, respectively, which are almost the same as those in the North China basin. Smaller splitting times are distributed between the two branches of the Tanlu fault zone, similar to the North China basin (Figures 4, 6), which is closely associated with the partial melting and hot mantle upwelling (e.g., Tian et al., 2009; Zhao et al., 2009; Lei, 2012; Wei et al., 2012, 2015; Lei et al., 2020).
To the east of the Tanlu fault zone and the south of the Jiaoliao uplift, the effective splitting results of 6 stations are obtained (Figure 4). It is visible that the FPDs change from nearly E-W in the west to NWW-SEE in the east, and the splitting time gradually increases.
Discussion
Origin of anisotropy in the Tanlu fault zone
Previous studies showed that the anisotropy of the upper mantle is mainly caused by the orientation arrangement of olivine lattice resulting from the lithospheric deformation and/or asthenospheric flow (e.g., Hess, 1964; Christensen, 1984; Nicolas and Christensen, 1987). However, crustal anisotropy can reflect the alignment of fractures and fluids in pores in the crust (e.g., Crampin, 1978; Gao et al., 2010). Because the crustal thickness is far less than the mantle lithospheric and asthenospheric thickness, the crustal anisotropy is much smaller than that in the mantle. Silver (1996) found that the average splitting time caused by crustal anisotropy is about 0.2 s. Iidaka and Niu (2001) calculated the crustal anisotropy under Station MDJ, and their results showed that the splitting time is less than 0.1 s. Li et al. (2014) indicated that the average crustal thickness in eastern China is less than 40 km. Kong et al. (2016) showed that the delay time in the western part of our study area with a thick crust is generally less than 0.3 s. In addition, Wu et al. (2012) measured the upper mantle splitting times of the stations including the Luxi uplift areas around the Tanlu fault zone and found that the splitting time of anisotropy is 0.5–1.63 s in eastern China, which support our present results showing the time delay of ∼0.94 s on average ranging from 0.6 to 1.5 s. Thus, it is generally accepted that the amount of crustal anisotropy is quite smaller than that of the mantle anisotropy. These results suggest that our present SKS measurements mainly reflect the upper mantle anisotropy. Nevertheless, in the future work, we will calculate the crustal anisotropy below each station and further analyze whether the effect of crustal anisotropy could be ignored, because there is the well-developed fault system in the study area (Figure 1).
Comparison with previous results
To confirm the reliability of our results, we compare our anisotropy results with previous studies (Figure 8). In general, our splitting observations show approximate E-W or NWW-SEE fast directions, generally coincident with those inferred from the previous SKS measurements by Zhao and Zheng (2005) and Yang et al. (2019), P-wave upper-mantle anisotropic tomography by Wei et al. (2016), and surface-wave upper-mantle tomography by Luo et al. (2022), confirming the reliability of our results. However, the delay times obtained in our present study are smaller than those from Zhao and Zheng (2005) and Yang et al. (2019). These discrepancies could be caused by different bandpass filter ranges used. Zhao and Zheng (2005) used a low-pass filter with a frequency of 0.2 Hz in their work, and Yang et al. (2019) used a band-pass filter with a frequency range of 0.02–0.2 Hz, whereas our present study utilizes a band-pass filtering range of 0.04–0.5 Hz. These different filtering ranges could lead to various anisotropic results (Sun and Lei, 2019).
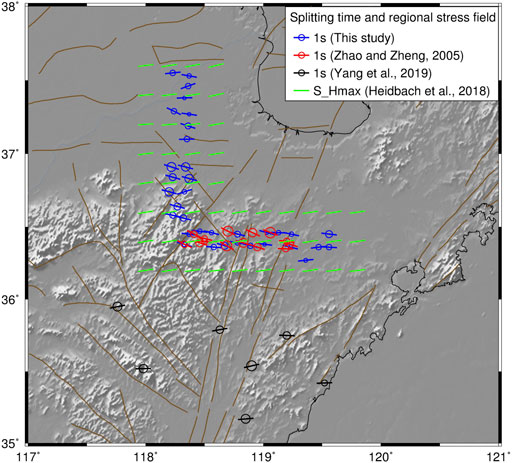
FIGURE 8. Comparison of shear-wave splitting measurements by this study (blue bars and circles) with Zhao and Zheng (2005) (red bars and circles) and Yang et al. (2019) (black bars and circles). The orientation of each short bar denotes the fast direction, whereas the size of each circle is proportional to the splitting time. The green bars represent maximum horizontal stress field with 0.2° gridding (Heidbach et al., 2018). The red lines denote major active faults (Deng et al., 2002).
Seismic anisotropy and the deep subduction of Pacific slab
Our splitting results showed that the anisotropic splitting time obtained in this study is 0.6–1.5 s (Figures 4, 6). If we use the relationship L = δt/Ks × β0 (Barruol and Fontaine, 2013) to calculate the thickness of anisotropic layer, where Ks is the intrinsic anisotropy (∼4%, Silver, 1996; Yang et al., 2019) and β0 denotes the isotropic shear velocity (∼4.5 km/s), then the anisotropic layer thickness is 67–169 km in the study areas, which is much larger than the crustal thickness of 30–35 km (Guo et al., 2012; Duan et al., 2016) and also larger than the lithospheric thickness of 60–80 km (Chen et al., 2006; Guo et al., 2012). P-wave anisotropy tomography shows that the stronger anisotropy exists between 60 and 200 km depths in eastern China (Wei et al., 2016). Due to the westward deep subduction of the Pacific plate down to the mantle transition zone (MTZ) under eastern Asia, the asthenospheric mantle flow under eastern China shows anisotropy and its fast direction may reflect the direction of absolute plate motion (APM). The APM direction in our study area calculated from the HS3-NUVEL-1A model (Gripp and Gordon, 2002) is N70°W (Figure 7). The fast directions of our measurements at most stations are more or less parallel to the APM direction. These results demonstrate that the anisotropy in the study area is not only related to the lithosphere deformation in the North China basin but also the asthenosphere under the Tanlu fault zone.
Figure 8 shows the NEE-SWW trending maximum horizontal stress field with 0.2° gridding (Heidbach et al., 2018) and the NWW-SEE fast-wave directions from the present and previous studies. The regional horizontal stress field mainly reflects the recent crustal deformation, whereas the shear-wave splitting mainly shows the mantle deformation direction. The difference between the two directions indicates that the crust and mantle lithosphere may be decoupled.
Generally, the rocks in the crust and mantle are simplified as materials with hexagonal symmetry. If the hexagonal symmetry is generally assumed to be horizontal, then azimuthal anisotropy can be measured (e.g., Eberhart-Phillips and Henderson, 2004; Wang and Zhao, 2008), whereas it is assumed to be vertical, then radial anisotropy could be studied (e.g., Wang and Zhao, 2013). Our present SKS splitting results show that the azimuthal anisotropic FPDs are nearly E-W, but there are obvious changes of splitting times within different tectonic units (Figures 4, 6). Larger splitting times amounting to ∼1.2 s are located north of the Luxi uplift, which is closely associated with the E-W horizontal flow in the big mantle wedge (BMW) formed by the deep subduction of the Pacific plate (e.g., Zhao, 2004; Lei and Zhao, 2005, 2006; Huang and Zhao, 2006; Lei, et al., 2018). In contrast, smaller splitting times are visible between the two branches of the Tanlu fault zone (Figures 4, 6), integrating with strong radial anisotropy (e.g., Jiang et al., 2020), low-velocity anomalies in the upper mantle (e.g., Tian et al., 2009; Lei, 2012; Lei et al., 2020), and thinned crustal and lithosphere (e.g., Chen et al., 2006) under the Tanlu fault zone, possibly suggesting the existence of vertical upwelling flow under the Tanlu fault zone in the BMW, in addition to the horizontal flow of asthenosphere material.
The existence of vertical upwelling flow of asthenosphere under the Tanlu fault zone could be caused by the continental extension and lithospheric thinning in eastern China during the Mesozoic and Cenozoic. This is supported by a thin lithospheric thick inferred from receiver function analyses of Chen et al. (2006) and Guo et al. (2012), but also supported by seismic tomographic results. Ambient noise tomography with a short-period dense seismic array illustrated clear low-V anomalies in the upper crust along the eastern and western boundaries of the Tanlu fault zone (Ma et al., 2020). Teleseismic crustal tomography results inferred from a short-period dense array demonstrated continuous low-V anomalies in the entire crust (Tian et al., 2020). Teleseismic tomographic results showed obvious low-V anomalies in the upper mantle under the Tanlu fault zone (e.g., Tian et al., 2009; Zhao et al., 2009; Lei, 2012; Wei et al., 2012, 2015; Lei et al., 2020; Huang et al., 2021).
On the basis of the previous studies and our present results, we propose a schematic model (Figure 9) explaining the anisotropic structure and deep dynamics beneath the Tanlu fault zone. The black arrow denotes the moving direction of the Pacific slab, whereas the bold red arrows represent the directions of horizontal and vertical flows in the BMW. The BMW was formed due to the deep subduction, long stagnancy, and deep dehydration (the small red arrows) of the Pacific slab in the MTZ under East Asia (e.g., Lei and Zhao, 2005, 2006; Huang and Zhao, 2006; Zhao et al., 2007, 2009; Wei et al., 2012, 2015; Lei et al., 2013, 2018, 2020; Liu et al., 2017; Ma et al., 2019; Huang et al., 2021). The horizontal material flow can cause the E-W fast direction (the white arrow) of azimuthal anisotropy in our study region. Meanwhile, hot and wet upwelling flows also occur in the BMW under the Tanlu fault zone. Such an upwelling flow could disturb the horizontal flow in the BMW. This may explain the complex changes of the fast directions and splitting times in different tectonic units revealed by our SKS measurements. These results suggest that the BMW structure has played an important role in the deep dynamic processes beneath the Tanlu fault zone.
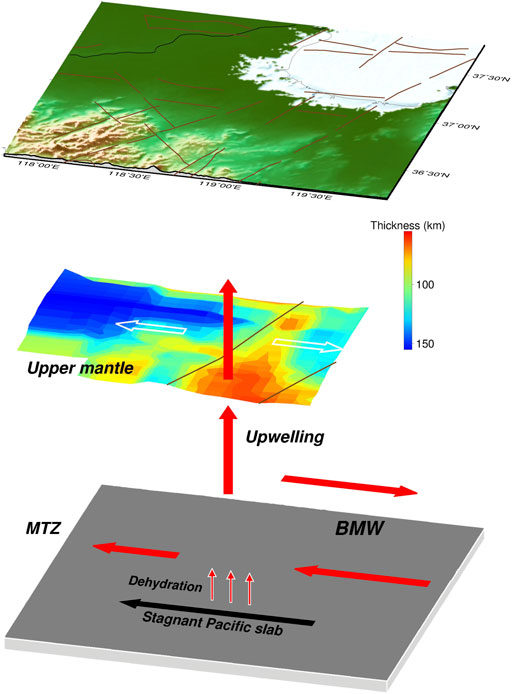
FIGURE 9. A schematic model showing the anisotropic structure and dynamics beneath the Tanlu fault zone. The black arrow indicates the moving direction of the Pacific slab in the mantle transition zone (MTZ). The white arrows represent horizontal material flow proposed by the fast direction of azimuthal anisotropy in the present study. The bold red arrows show the directions of horizontal and vertical flows in the big mantle wedge (BMW) due to the long stagnancy and deep dehydration (small red arrows) of the subducted Pacific slab in the MTZ. The colors in the middle panel denote the thickness of the mantle anisotropic layer determined by assuming an average anisotropy of 4%. The layer thickness scale is shown on the right.
Conclusion
In this study, we collect waveform data recorded at 47 portable broadband seismic stations in and around the Luxi uplift segment of the Tanlu fault zone. Using the minimum transverse energy grid-search method of SKS wave splitting, effective splitting results at 35 stations are obtained. Our results show that the FPDs in the study area are dominated by E-W direction, which is generally perpendicular to the trend of the Tanlu fault zone. Significant variations in splitting time are from 0.6 to 1.5 s between the Tanlu fault zone and Luxi uplift. Larger splitting times are located north of the Luxi uplift, whereas smaller ones are visible between the two branches of the Tanlu fault zone. Complex horizontal flow in different tectonic units is mainly related to vertical flow horizontal flow under the Tanlu fault zone in the BMW structure formed by the deep subduction and dehydration of the long stagnant Pacific slab in the MTZ. Our results provide important seismological constraints on the mantle dynamics beneath the Tanlu fault zone in East Asia.
Data availability statement
Publicly available datasets were analyzed in this study. This data can be found here: The IRIS Data Management Center provides the waveform data recorded at the NCISP portable seismic stations (www.iris.edu).
Author contributions
ML, Data processing, draft writing, analysis; JL, Revision, formal analysis.
Funding
This work was supported by National Natural Science Foundation of China (U1939206, 41530212, 41674091 and 42004082).
Acknowledgments
We thank Prof. Stephen S. Gao for providing codes for the SKS splitting analysis, and the IRIS Data Management Center for providing the waveform data recorded at the NCISP portable seismic stations (www.iris.edu). Most of the figures are made using the GMT software (Wessel and Smith, 1998). Professor Nibir Mandal (the Editor) and two reviewers provided constructive comments and suggestions, which have improved this paper.
Conflict of interest
The authors declare that the research was conducted in the absence of any commercial or financial relationships that could be construed as a potential conflict of interest.
Publisher’s note
All claims expressed in this article are solely those of the authors and do not necessarily represent those of their affiliated organizations, or those of the publisher, the editors and the reviewers. Any product that may be evaluated in this article, or claim that may be made by its manufacturer, is not guaranteed or endorsed by the publisher.
References
Barruol, G., and Fontaine, F. (2013). Mantle flow beneath La Reunion hotspot track from SKS splitting. Earth Planet. Sci. Lett. 362, 108–121. doi:10.1016/j.epsl.2012.11.017
Barruol, G., Silver, P., and Alain, V. (1997). Seismic anisotropy in the eastern United States: Deep structure of a complex continental plate. J. Geophys. Res. 102 (B4), 8329–8348. doi:10.1029/96jb03800
Chang, L., Wang, C., and Ding, Z. (2009). Seismic anisotropy of upper mantle in eastern China. Sci. China Ser. D-Earth. Sci. 52 (6), 774–783. doi:10.1007/s11430-009-0073-4
Chang, L., Wang, C., and Ding, Z. (2012). Upper mantle anisotropy beneath North China. Chin. J. Geophys. (in Chinese) 55 (3), 886–896.
Chen, H., Zhou, X., Li, D., and He, S. (1993). Geosciences transect of lingbi-fengxian (HQ-13) in eastern China (in Chinese). Beijing, China: Geological Publishing House.
Chen, L., Zheng, T., and Xu, W. (2006). A thinned lithospheric image of the Tanlu fault zone, eastern China: Constructed from wave equation based receiver function migration. J. Geophys. Res. 111, B09312. doi:10.1029/2005jb003974
Christensen, N. (1984). The magnitude, symmetry and origin of upper mantle anisotropy based on fabric analyses of ultramafic tectonites. Geophysical Journal International 76 (1), 89–111. doi:10.1111/j.1365-246x.1984.tb05025.x
Crampin, S. (1978). Seismic-wave propagation through a cracked solid: Polarization as a possible dilatancy diagnostic. Geophys. J. Int. 53, 467–496. doi:10.1111/j.1365-246x.1978.tb03754.x
Deng, Q., Zhang, P., Ran, Y., Yang, X., Mi, W., and Chu, Q. (2002). General characteristics of China active tectonics. Science China (Series D) 32 (12), 1021–1030.
Deng, Y., Fang, W., Zhang, Z., and Badal, J. (2013). Geophysical evidence on segmentation of the Tancheng-Lujiang fault and its implications on the lithosphere evolution in East China. Journal of Asian Earth Sciences 78 (S1), 263–276. doi:10.1016/j.jseaes.2012.11.006
Duan, Y., Wang, F., Zhang, X., Lin, J., Liu, Z., Liu, B., et al. (2016). Three-dimensional crustal velocity structure model of the middle-eastern north China Craton (HBCrust1.0). Sci. China Earth Sci. 59, 1477–1488. doi:10.1007/s11430-016-5301-0
Eberhart-Phillips, D., and Henderson, C. (2004). Including anisotropy in 3-D velocity inversion and application to Marlborough, New Zealand. Geophysical Journal International 156, 237–254. doi:10.1111/j.1365-246x.2003.02044.x
Gao, Y., Wu, J., Yi, G., and Shi, Y. (2010). Crust-mantle coupling in North China: Preliminary analysis from seismic anisotropy. Chin. Sci. Bull. 55 (31), 3599–3605. doi:10.1007/s11434-010-4135-y
Gripp, A., and Gordon, R. (2002). Young tracks of hotspots and current plate velocities. Geophysical Journal International 150, 321–361. doi:10.1046/j.1365-246x.2002.01627.x
Gu, Q., Ding, Z., Kang, Q., and Zhao, Q. (2016). Pn wave velocity and anisotropy in the middle-southern segment of the Tan-Lu fault zone and adjacent area. Chinese Journal of Geophysics (in Chinese) 59 (2), 504–515.
Gu, Q., Kang, Q., Ding, Z., Li, X., Zhao, Q., Xing, K., et al. (2020). Uppermost mantle Pn-wave velocity and anisotropy structure beneath the Shandong-Jiangsu-Anhui segment of the Tan-Lu fault zone and its adjacent regions. Chinese Journal of Geophysics (in Chinese) 63 (7), 2548–2565.
Guo, Z., Tang, Y., Chen, Y., Ning, J., Feng, Y., and Yue, H. (2012). A study on crustal and upper mantle structures in east part of North China Craton using receiver functions. Chinese Journal of Geophysics (in Chinese) 55 (11), 3591–3600.
Heidbach, O., Rajabi, M., Cui, X., Fuchs, K., Muller, B., Reinecker, J., et al. (2018). The world stress map database release 2016: Crustal stress pattern across scales. Tectonophysics 744, 484–498. doi:10.1016/j.tecto.2018.07.007
Hess, H. (1964). Seismic anisotropy of the uppermost mantle under oceans. Nature 203 (4945), 629–631. doi:10.1038/203629a0
Huang, J., and Zhao, D. (2006). High-resolution mantle tomography of China and surrounding regions. J. Geophys. Res. 111, B09305. doi:10.1029/2005jb004066
Huang, Z., Gou, T., and Wang, L. (2021). P and S wave tomography of east-central China: Insight into past and present mantle dynamics. Tectonophysics 809, 228859. doi:10.1016/j.tecto.2021.228859
Iidaka, T., and Niu, F. (2001). Mantle and crust anisotropy in the eastern China region inferred from waveform splitting of SKS and PpSms. Earth Planets Space 53 (3), 159–168. doi:10.1186/bf03352373
Jiang, G., Zhang, G., Zhao, D., Lü, Q., Shi, D., Li, H., et al. (2020). Mantle flow and dynamics beneath Central-East China: New insights from P-wave anisotropic tomography. JGR. Solid Earth 126, e2020JB020070. doi:10.1029/2020jb020070
Kong, F., Wu, J., Liu, K., and Gao, S. (2016). Crustal anisotropy and ductile flow beneath the eastern Tibetan Plateau and adjacent areas. Earth and Planetary Science Letters 442, 72–79. doi:10.1016/j.epsl.2016.03.003
Lei, J. (2012). Upper-mantle tomography and dynamics beneath the north China craton. J. Geophys. Res. 117, B06313. doi:10.1029/2012JB009212
Lei, J., Xie, F., Fan, Q., and Santosh, M. (2013). Seismic imaging of the deep structure under the Chinese volcanoes: An overview. Physics of the Earth and Planetary Interiors 224 (4), 104–123. doi:10.1016/j.pepi.2013.08.008
Lei, J., and Zhao, D. (2006). Global P-wave tomography: On the effect of various mantle and core phases. Physics of the Earth and Planetary Interiors 154, 44–69. doi:10.1016/j.pepi.2005.09.001
Lei, J., and Zhao, D. (2005). P-wave tomography and origin of the Changbai intraplate volcano in Northeast Asia. Tectonophysics 397 (3-4), 281–295. doi:10.1016/j.tecto.2004.12.009
Lei, J., Zhao, D., Xu, X., Du, M., Mi, Q., and Lu, M. (2020). P-wave upper-mantle tomography of the Tanlu fault zone in eastern China. Physics of the Earth and Planetary Interiors 299, 106402. doi:10.1016/j.pepi.2019.106402
Lei, J., Zhao, D., Xu, Y., Fan, Q., Mi, Q., Du, M., et al. (2018). Is there a gap in the stagnant Pacific slab in the mantle transition zone under the Changbaishan volcano? Acta Petrologica Sinica 34, 13–22.
Li, L., Zhong, D., and Shi, X. (2007). Cenozoic uplifting/subsidence coupling between the west Shandong rise and the jiyang depression, northern China. Acta Geologica Sinica (in Chinese) 81 (9), 1215–1228.
Li, S., Lai, X., Liu, B., Wang, Z., He, J., and Sun, Y. (2011). Differences in lithospheric structures between two sides of Taihang Mountain obtained from the Zhucheng-Yichuan deep seismic sounding profile. Sci. China Earth Sci. 54 (6), 871–880. doi:10.1007/s11430-011-4191-4
Li, Y., Gao, M., and Wu, Q. (2014). Crustal thickness map of the Chinese mainland from teleseismic receiver functions. Tectonophysics 611, 51–60. doi:10.1016/j.tecto.2013.11.019
Li, Z. (1994). Collision between the North and south China blocks: A crustal-detachment model for suturing in the region east of the Tanlu fault: Comment and reply. Geology 22, 574–576.
Lin, A., Miyata, T., and Wan, T. (1998). Tectonic characteristics of the central segment of the Tancheng-Lujiang fault zone, Shandong peninsula, eastern China. Tectonophysics 293, 85–104. doi:10.1016/s0040-1951(98)00087-0
Lin, J., Tan, D., and Jin, Y. (1996). 40Ar/39Ar ages of Mesozoic igneous activities in Western Shandong. Acta Petrologica et Mineralogical 15 (3), 213–220.
Liu, B., Feng, S., Ji, J., Shi, J., Tan, Y., and Li, Y. (2015). Fine lithosphere structure beneath the middle-southern segment of the Tan-Lu fault zone. Chinese Journal of Geophysics (in Chinese) 58 (5), 1610–1621.
Liu, C., Liu, G., and Du, G. (1987). Preliminary study on the crustal structure of mid-section of the fossil Tanlu rift valley-interpretation result by the method of two-dimensional dynamic ray tracing. North China Earthquake Sciences (in Chinese) 5 (2), 1–12.
Liu, K., Gao, S., Gao, Y., and Wu, J. (2008). Shear wave splitting and mantle flow associated with the deflected Pacific slab beneath northeast Asia. J. Geophys. Res. 113, B01305. doi:10.1029/2007jb005178
Liu, X., Zhao, D., Li, S., and Wei, W. (2017). Age of the subducting Pacific slab beneath East Asia and its geodynamic implications. Earth and Planetary Science Letters 464, 166–174. doi:10.1016/j.epsl.2017.02.024
Lu, M., Lei, J., Zhao, D., Ai, Y., Xu, X., and Zhang, G. (2020). SKS splitting measurements in NE China: New insights into the Wudalianchi intraplate volcanism and mantle dynamics. J. Geophys. Res. Solid Earth 125, e2019JB018575. doi:10.1029/2019JB018575
Luo, S., Yao, H., Zhang, Z., and Bem, T. (2022). High-resolution crustal and upper mantle shear-wave velocity structure beneath the central-southern Tanlu fault: Implications for its initiation and evolution. Earth and Planetary Science Letters 595, 117763. doi:10.1016/j.epsl.2022.117763
Ma, C., Lei, J., and Xu, X. (2020). Three-dimensional shear-wave velocity structure under the Weifang segment of the Tanlu fault zone in eastern China inferred from ambient noise tomography with a short-period dense seismic array. Physics of the Earth and Planetary Interiors 309, 106590. doi:10.1016/j.pepi.2020.106590
Ma, J., Tian, Y., Zhao, D., Liu, C., and Liu, T. (2019). Mantle dynamics of western pacific and East Asia: New insights from P-wave anisotropic tomography. Geochem. Geophys. Geosyst. 20, 3628–3658. doi:10.1029/2019GC008373
Ma, X., Liu, C., and Liu, G. (1991). Xiangshui (Jiangsu Province) to mandal (nei monggol) geoscience transect. Acta Geologica Sinica (in Chinese) 5 (3), 199–215.
Meng, Y., Yao, H., Wang, X., Li, L., Feng, J., Hong, D., et al. (2019). Crustal velocity structure and deformation features in the central-southern segment of Tanlu fault zone and its adjacent area from ambient noise tomography. Chinese Journal of Geophysics (in Chinese) 62, 2490–2509.
Miao, Q., Lei, J., He, J., Du, M., Yin, W., Zhang, Z., et al. (2021). Pn velocity and anisotropy beneath the Yishu fault zone and surrounding areas. Chinese Journal of Geophysics (in Chinese) 64 (7), 2324–2335.
Nicolas, A., and Christensen, N. (1987). Formation of anisotropy in upper mantle peridotites: A review, in composition structure and dynamics of the lithosphere-asthenosphere system. Geodynamics Series 16, 111–123.
Niu, S., Hu, H., Mao, J., Sun, A., Xu, C., and Hou, Q. (2004). Structure in Western Shandong and its genetic mechanism. Acta Geologica Sinica (in Chinese) 31 (1), 34–39.
Qiang, Z., Wu, Q., Li, Y., Gao, M., Demberel, S., Ulzibat, M., et al. (2017). Complicated seismic anisotropy beneath south-central Mongolia and its geodynamic implications. Earth and Planetary Science Letters 465, 126–133. doi:10.1016/j.epsl.2017.02.035
Qiu, J., Xu, X., and Luo, Q. (2001). 40Ar-39Ar dating and provenance tracing of K-rich volcanics and lamprophyre in Western Shandong. Chinese Science Bulletin 46 (18), 1500–1508.
Qiu, R., Deng, J., Zhou, S., Li, J., Xiao, Q., Wu, Z., et al. (2005). Lithosphere types in North China: Evidence from geology and geophysics. Sci. China Ser. D-Earth. Sci. 48 (11), 1809–1827. doi:10.1360/03yd0380
Ren, J., Tamaki, K., Li, S., and Zhang, J. (2002). Late Mesozoic and Cenozoic rifting and its dynamic setting in eastern China and adjacent areas. Tectonophysics 344, 175–205. doi:10.1016/s0040-1951(01)00271-2
Silver, P., and Chan, W. (1991). Shear wave splitting and subcontinental mantle deformation. J. Geophys. Res. 96 (B10), 16429–16454. doi:10.1029/91jb00899
Silver, P. (1996). Seismic anisotropy beneath the continents: Probing the depths of geology. Annu. Rev. Earth Planet. Sci. 24 (1), 385–432. doi:10.1146/annurev.earth.24.1.385
Sun, C., and Lei, J. (2019). Frequency-dependent Pms splitting measurements across the Longmenshan thrust belt in the eastern Tibetan Plateau. Journal of Asian Earth Sciences 185, 104027. doi:10.1016/j.jseaes.2019.104027
Tian, F., Lei, J., and Xu, X. (2020). Teleseismic P-wave crustal tomography of the weifang segment on the Tanlu fault zone: A case study based on short-period dense seismic array experiment. Physics of the Earth and Planetary Interiors 306, 106521. doi:10.1016/j.pepi.2020.106521
Tian, Y., Zhao, D., Sun, R., and Teng, J. (2009). Seismic imaging of the crust and upper mantle beneath the North China Craton. Physics of the Earth and Planetary Interiors 172, 169–182. doi:10.1016/j.pepi.2008.09.002
Vinnik, L., Farra, V., and Romanowicz, B. (1989). Azimuthal anisotropy in the Earth from observations of SKS at GEOSCOPE and NARS broadband stations. Bulletin of the Seismological Society of America 79 (5), 1542–1558.
Wang, J., and Zhao, D. (2008). P-wave anisotropic tomography beneath Northeast Japan. Physics of the Earth and Planetary Interiors 170, 115–133. doi:10.1016/j.pepi.2008.07.042
Wang, J., and Zhao, D. (2013). P-wave tomography for 3-D radial and azimuthal anisotropy of Tohoku and Kyushu subduction zones. Geophysical Journal International 193, 1166–1181. doi:10.1093/gji/ggt086
Wang, X., Li, Z., Chen, B., Chen, X., Dong, S., and Zhang, Q. (2000). On tan-Lu fault zone (in Chinese). Beijing, China: Geological Publishing House.
Wei, W., Xu, J., Zhao, D., and Shi, Y. (2012). East Asia mantle tomography: New insight into plate subduction and intraplate volcanism. Journal of Asian Earth Sciences 60, 88–103. doi:10.1016/j.jseaes.2012.08.001
Wei, W., Zhao, D., Xu, J., Wei, F., and Liu, G. (2015). P and S wave tomography and anisotropy in Northwest Pacific and East Asia: Constraints on stagnant slab and intraplate volcanism. J. Geophys. Res. Solid Earth 120, 1642–1666. doi:10.1002/2014JB011254
Wei, W., Zhao, D., Xu, J., Zhou, B., and Shi, Y. (2016). Depth variations of P-wave azimuthal anisotropy beneath Mainland China. Sci. Rep. 6, 29614. doi:10.1038/srep29614
Wessel, P., and Smith, W. (1998). New, improved version of generic mapping tools released. Eos Trans. AGU. 79 (47), 579. doi:10.1029/98eo00426
Wu, P., Wang, C., Ding, Z., Chang, L., and Li, Z. (2012). Seismic anisotropy of upper mantle beneath the Dabie-Sulu and its adjacent areas. Chinese Journal of Geophysics (in Chinese) 55 (8), 2539–2550.
Wüstefeld, A., and Bokelmann, G. (2007). Null detection in shear-wave splitting measurements. Bulletin of the Seismological Society of America 97 (4), 1204–1211. doi:10.1785/0120060190
Xu, J. (1980).The great left-lateral horizontal displacement of Tancheng-Lujiang fault zone, eastern China, Journal of Heifei Polytechnic University, 1. 1–26. (in Chinese).
Xu, J., and Zhu, G. (1994). Tectonic models of the Tan-Lu fault zone, eastern China. International Geology Review 36 (8), 771–784. doi:10.1080/00206819409465487
Yang, X., Li, H., Li, Y., Lv, Q., Zhang, G., Jiang, G., et al. (2019). Seismic anisotropy beneath eastern China from shear wave splitting. Geophysical Journal International 218, 1642–1651. doi:10.1093/gji/ggz242
Ye, G., Wei, W., Jin, S., and Jing, J. (2009). Study of the electrical structure and its geological meanings of the middle part of Tancheng-Lujiang fault zone. Chinese Journal of Geophysics (in Chinese) 52 (11), 2818–2825.
Yin, A., and Nie, S. (1993). An indentation model for the north and south China collision and the development of the tan-Lu and honam fault systems, eastern Asia. Tectonics 12, 801–813. doi:10.1029/93tc00313
Yin, W., Lei, J., Du, M., Yang, Y., Mi, Q., Lu, M., et al. (2019). Uppermost-mantle Pn velocity and anisotropic tomography of the Tanlu fault zone and adjacent areas. Chinese Journal of Geophysics (in Chinese) 62 (11), 4227–4238.
Zhang, J., Zhao, G., Xiao, X., and Tang, J. (2010). Analysis of electric structure of the central Tan-Lu fault zone (Yi-Shu fault zone, 36°N) and seismogenic condition. Chinese Journal of Geophysics (in Chinese) 53 (3), 605–611.
Zhang, X., Zhang, Y., and Ji, W. (2007). Fault distribution patterns of the Luxi block, Shandong, and Mesozoic sedimentary-magmatic-structural evolution sequence. Journal of Geomechanics (in Chinese) 13 (2), 163–172.
Zhang, Y., Dong, S., and Shi, W. (2003a). Cretaceous deformation history of the middle Tan-Lu fault zone in Shandong Province, eastern China. Tectonophysics 363, 243–258. doi:10.1016/s0040-1951(03)00039-8
Zhang, Y., Ma, Y., Yang, N., Shi, W., and Dong, S. (2003b). Cenozoic extensional stress evolution in North China. Journal of Geodynamics 36, 591–613. doi:10.1016/j.jog.2003.08.001
Zhao, D. (2004). Global tomographic images of mantle plumes and subducting slabs: Insight into deep earth dynamics. Physics of the Earth and Planetary Interiors 146, 3–34. doi:10.1016/j.pepi.2003.07.032
Zhao, D., Maruyama, S., and Omori, S. (2007). Mantle dynamics of western pacific and East Asia: Insight from seismic tomography and mineral physics. Gondwana Research 11, 120–131. doi:10.1016/j.gr.2006.06.006
Zhao, D., Tian, Y., Lei, J., Liu, L., and Zheng, S. (2009). Seismic image and origin of the Changbai intraplate volcano in East Asia: Role of big mantle wedge above the stagnant Pacific slab. Physics of the Earth and Planetary Interiors 173 (3-4), 197–206. doi:10.1016/j.pepi.2008.11.009
Zhao, L., Zheng, T., Lu, G., and Ai, Y. (2011). No direct correlation of mantle flow beneath the north China craton to the India-eurasia collision: Constraints from new SKS wave splitting measurements. Geophysical Journal International 187 (2), 1027–1037. doi:10.1111/j.1365-246x.2011.05201.x
Zhao, L., and Zheng, T. (2005). Using shear wave splitting measurements to investigate the upper mantle anisotropy beneath the North China Craton: Distinct variation from east to west. Geophys. Res. Lett. 32 (10), L10309. doi:10.1029/2005gl022585
Zhao, Z., and Xu, J. (2009). Three-dimensional crustal velocity structure of P-wave in East China from wide-angle reflection and refraction surveys. Sci. Bull. (Beijing). 54 (8), 1389–1397. doi:10.1007/s11434-009-0022-9
Zheng, L., Gao, W., and Zheng, C. (1988). The segmentation of the Tan-Lu fault zone and activity in the Yishu fault zone. Earthquake Research in China 4, 129–135. (in Chinese).
Zheng, S., and Gao, Y. (1994). Azimuthal anisotropy in lithosphere on the Chinese mainland from observations of SKS at CDSN. Acta Seismologica Sinica 7 (2), 177–186.
Zheng, T., Zhao, L., Xu, W., and Zhu, R. (2008). Insight into modification of north China craton from seismological study in the Shandong Province. Geophys. Res. Lett. 35 (22), L22305. doi:10.1029/2008gl035661
Zhu, G., Hu, Z., Chen, Y., Niu, M., and Xie, C. (2008). Evolution of early cretaceous extensional basins in the eastern North China craton and its implication for the craton destruction. Geological Bulletin of China 27, 1594–1604.
Zhu, G., Liu, G., Dunlap, J. W., Teyssier, C., Wang, Y., and Niu, M. (2004b). 40Ar/39Ar geochronological constraints on syn-orogenic strike-slip movement of Tan-Lu fault zone. Chinese Sci. Bull. 49, 499–508. doi:10.1360/03wd0357
Zhu, G., Wang, D., Liu, G., Niu, M., and Song, C. (2004a). Evolution of the Tan-Lu fault zone and its responses to plate movements in West Pacific Basin. Chinese Journal of Geology 39, 36–49.
Keywords: Luxi uplift segment, Tanlu fault zone, seismic anisotropy, SKS splitting measurement, mantle dynamics
Citation: Lu M and Lei J (2023) Complex mantle flow beneath the Luxi uplift segment of the Tanlu fault zone inferred from SKS splitting measurements. Front. Earth Sci. 10:978433. doi: 10.3389/feart.2022.978433
Received: 26 June 2022; Accepted: 31 October 2022;
Published: 12 January 2023.
Edited by:
Nibir Mandal, Jadavpur University, IndiaReviewed by:
Junling Pei, Chinese Academy of Geological Sciences (CAGS), ChinaZhouchuan Huang, Nanjing University, China
Copyright © 2023 Lu and Lei. This is an open-access article distributed under the terms of the Creative Commons Attribution License (CC BY). The use, distribution or reproduction in other forums is permitted, provided the original author(s) and the copyright owner(s) are credited and that the original publication in this journal is cited, in accordance with accepted academic practice. No use, distribution or reproduction is permitted which does not comply with these terms.
*Correspondence: Jianshe Lei, anNobGVpX2NqQGhvdG1haWwuY29t