 Jacqueline Otto
 Felicity A. Holmes
 Nina Kirchner
- 1Department of Physical Geography, Stockholm University, Stockholm, Sweden
- 2Bolin Centre for Climate Research, Stockholm University, Stockholm, Sweden
Along the Greenland Ice Sheet margin, supraglacial lakes store and redistribute ice sheet surface run off, and comprise an important potential hydrological link between the ice surface and the base, with ramifications for subglacial drainage systems and ice flow. As a consequence of increasing global mean surface air temperatures, these lakes have been predicted to expand further inland and to affect larger areas of the ice sheet. However, as contemporary dynamics of such supraglacial lake expansion are not well studied, any assessment of their future implications remains afflicted with uncertainty. Here, recent changes in supraglacial lake distribution and expansion, and in their drainage behavior and frequency, are presented for Ryder Glacier, Northern Greenland, as concluded from a remote sensing based analysis. The 35-year time span covered in the analysis allows for the detection of trends in lake processes and ice velocity, which otherwise were found to exhibit large inter-annual variability. It also reveals the first occurrence of a coupled lake drainage event in 2002. By linking supraglacial lake expansion, drainage modes, and drainage frequency to the efficiency of the subglacial drainage system and ice flow on seasonal and decadal timescales, a contribution is made to better understand the complexity of coupled glacio-hydrological processes, and to help reduce uncertainties in predictions of future mass loss from the Greenland Ice Sheet.
1 Introduction
In recent decades, the Greenland Ice Sheet (GrIS) has experienced accelerated mass loss, and represents now the largest single contributor to global mean sea level rise (Bamber et al., 2018; Meredith et al., 2019; Mouginot et al., 2019; The IMBIE Team et al., 2020). A dominant factor in GrIS mass loss is increased melting and runoff at the ice sheet surface during the melt season, with summer melt intensity since 1990 being the highest over the past 350 years (IPCC, 2019). Along the GrIS margin, during summer, surface melt water gathers in supraglacial streams and accumulates in surface depressions, forming supraglacial lakes (e.g. Das et al., 2008; Howat et al., 2013; Koenig et al., 2015; Miles et al., 2017; Macdonald et al., 2018; Lampkin et al., 2020). Water stored in these lakes can drain rapidly within a few hours or days through hydrofracture, by which a direct hydrological link between the lake basin and the ice sheet base is created (Krawczynski et al., 2009; Doyle et al., 2013; Macdonald et al., 2018). After drainage, this surface-to-bed connection may close, or remain open as a hydrological conduit, also referred to as a moulin (e.g. Das et al., 2008; Liang et al., 2012; Stevens et al., 2015; Hoffman et al., 2018). In contrast to rapid drainage, lakes can also drain slowly through overspilling and flow into connecting supraglacial streams, or not drain at all (e.g. Catania et al., 2008; Tedesco et al., 2013; Cooley and Christoffersen, 2017; Macdonald et al., 2018). Undrained lakes freeze over by the end of the melt season, then freeze through the entire water column, or maintain liquid water during the winter, in which case they are referred to as buried lakes (Koenig et al., 2015; Miles et al., 2017; Lampkin et al., 2020). Buried lakes may remain entirely or largely ice covered during one or several following years without draining (Schröder et al., 2020). While lake drainage has long been linked to the summer season, the drainage of buried lakes has recently been observed to occur also during the winter season (Schröder et al., 2020; Benedek and Willis, 2021).
How meltwater is spatio-temporally distributed and delivered to the glaciers’ drainage system determines its capacity and efficiency throughout the melt season (Tedesco et al., 2013; Smith et al., 2015). At the base, surface melt adds to basal melt, which together contribute to ice dynamical feedbacks between melt, basal friction, ice dynamics and mass loss (Karlsson et al., 2021). While several studies confirm that lake drainage events induce short-term speed-ups of ice flow (e.g. Joughin et al., 1996; Zwally, 2002; Doyle et al., 2013; Joughin et al., 2013; Tedesco et al., 2013; Stevens et al., 2015; Neckel et al., 2020), the impact of lake processes on ice dynamics on seasonal and annual scales is still debated. While a positive correlation between increased melt water availability and ice flow acceleration has been proposed as a direct response of the GrIS to climate warming (e.g. Zwally, 2002; IPCC, 2007), the coupling between glacio-hydrological processes is more complex than expressed by this simplified relation (e.g. van de Wal et al., 2008; Schoof, 2010). Previous studies have observed that the seasonal velocity pattern of the majority of GrIS outlet glaciers is controlled by surface melt-induced evolution of the subglacial drainage system (Vijay et al., 2019). At the beginning of the melt season, the drainage system is still inefficient, so that the delivery of large amounts of meltwater to the glacier base overburdens the capacity of the drainage system. This leads to increased basal water pressures, enhanced basal sliding and speed-up of ice velocities. However, this speed-up is often short lived as continued meltwater supply causes the drainage system to evolve and to drain higher water volumes more efficiently, decreasing basal water pressures and decelerating ice flow (e.g. Howat et al., 2010; Schoof, 2010; Hoffman et al., 2011; Sole et al., 2011; Ahlstrøm et al., 2013; Hewitt, 2013; Moon et al., 2014; Andrews et al., 2018; Hoffman et al., 2018; Vijay et al., 2019; Davison et al., 2020). How increased meltwater availability impacts summer velocities, if increased summer velocities may be compensated by winter velocities, and how this may impact overall annual ice velocities of outlet glaciers around the GrIS is still uncertain (e.g. Sole et al., 2013; Doyle et al., 2014; van de Wal et al., 2015; Davison et al., 2020).
Due to increasing surface air temperatures and greater meltwater availability, GrIS supraglacial lakes have expanded inland to higher elevations over the past decades, a trend that is predicted to continue (e.g. Howat et al., 2013; Leeson et al., 2015; Igneczi et al., 2016; Miles et al., 2017). Hence, wider areas of the GrIS margin may be affected by lake processes in the future. Yet, the complexity of supraglacial lake behaviour, i.e. their formation, drainage, and decay, their role in the glacio-hydrological system and the resulting ice dynamical feedback, are not yet fully understood (e.g. McGrath et al., 2011; Banwell et al., 2012; Arnold et al., 2014; Clason et al., 2015; Banwell et al., 2016; Yang and Smith, 2016; Pitcher et al., 2020). This represents an uncertainty in predicting future GrIS mass loss and the associated sea level rise.
Here, we present the distribution and drainage behaviour of supraglacial lakes on Ryder Glacier on a multi-annual as well as seasonal scale. Examining supraglacial lake formation and evolution at Ryder Glacier over recent decades, trends of lake expansion are investigated and analysed in relation to changes in annual ice velocities. Also, ice velocities are investigated on a seasonal scale and linked to inter-annual variations in lake drainage behaviour. We explore whether there is evidence for an increased inland expansion of lakes at Ryder Glacier since 2000, and whether there have been changes in lake drainage behaviour, with more frequent drainage events, increasingly at higher elevations, over the past decades. Focusing on seasonal scales, we ask whether the absence or presence of lake drainage events impact the ice velocity pattern over the course of the melt season, and what the role of lake behaviour is regarding the formation of the subglacial drainage system. Focusing on annual scales, we examine whether the observed recent changes in lake behavior coincide with the sustained increase of annual ice velocities over the past decade. A better understanding of the connection between trends in lake processes and ice velocities contributes to future investigations on lake behavior in order to fully comprehend GrIS glacier dynamics.
2 Regional setting
Ryder Glacier, Northern Greenland, terminates in Sherard Osborn Fjord (Figure 1A) connecting to the central Arctic Ocean via the Lincoln Sea. Ryder Glacier drains c. 1.4% of the GrIS, representing the third largest source of ice discharge (grounding line flux ca. 3.9 km3/yr) in northern Greenland, after Petermann and Humboldt glaciers with grounding line fluxes of ca. 12.8 km3/yr and 6.2 km3/yr, respectively (Hill et al., 2017), based on calculations by Rignot et al. (2001) for the years 1992–1996. Between 2000 and 2018, mass loss in the northern GrIS region was dominated by changes in surface mass balance (ca. 85%) rather than discharge (ca. 15%) (Mouginot et al., 2019), while ice sheet wide, surface melting and runoff (accounting for
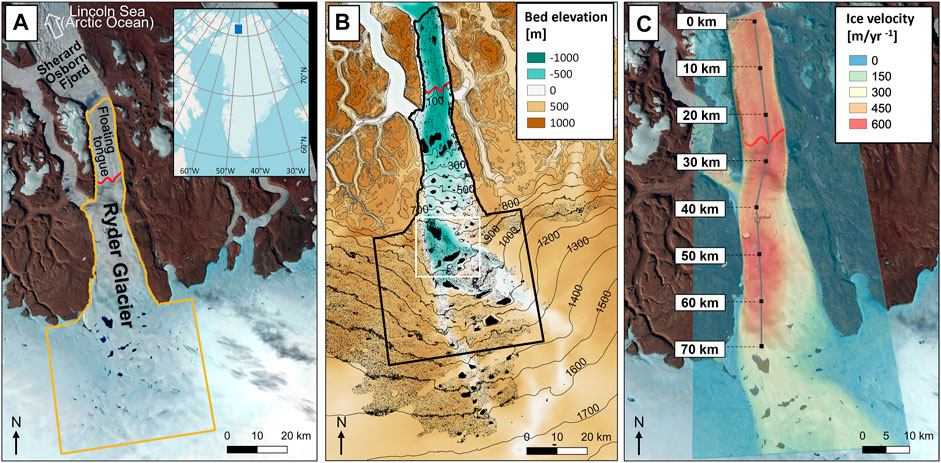
FIGURE 1. (A) Study area at Ryder Glacier (ca. 3,200 km2, enclosed by yellow solid line, extending from the ice tongue into the GrIS marginal zone), encompassing all lakes visible in the melt season 2020. Red line: approximate grounding line position (IceBridge BedMachine Greenland V4, Morlighem et al. (2021); Morlighem et al. (2017)). Background image: Landsat 8, 2020-07-10 (courtesy of the U.S. Geological Survey). Overview map (OpenStreetMap basemap QGIS 3.16.10) upper right corner: location of Ryder Glacier (blue square) along the North GrIS coast. (B) Topography, bathymetry and isolines of ice surface elevation in the larger Ryder Glacier region (NASA MEaSUREs GIMP, Howat et al. (2015); Howat et al. (2014), IceBridge BedMachine Greenland V4, Morlighem et al. (2021); Morlighem et al. (2017)). Study area and grounding line (cf. panel (A)): black solid and red solid line, respectively. Thin black lines: contour lines of ice surface topography. Labels: elevation above sea level (in meters). Black filled features: surface depressions on the ice sheet/glacier surface. White box encompasses the central ice plain, where several of the largest supraglacial lakes are located. In the background, the elevation of the bed topography is shown according to colorscale in the legend. (C) Example of ice surface velocities generated from Landsat 8 satellite imagery (Supplementary Material S3) with the Glacier Image Velocimetry toolbox (Van Wyk de Vries and Wickert, 2021) for July 2020. Gray solid line: transect from calving front upstream and across the grounding line (red line). Black solid square markers along the transect: 10 km interval points where velocities were analysed in detail between glacier terminus and 70 km up-glacier, corresponding to the section of highest quality in available velocity data. Background image: Landsat 8, 2020-07-10 (courtesy of the U.S. Geological Survey).
Seaward of its grounding line, Ryder Glacier features a floating ice tongue c. 25 km long and c. 10 km wide (Hill et al., 2017; Wilson et al., 2017; Holmes et al., 2021). Episodically, calving takes place from this tongue (Wilson et al., 2017), with calving styles described in detail in Holmes et al. (2021). Over the last century, Ryder Glacier has experienced an overall retreat (Koch, 1928; Jakobsson et al., 2020). Upstream of the grounding line, located at c. 1,000 m below sea level (bsl) (Morlighem et al., 2021, 2017), the flow of Ryder Glacier is topographically controlled and continues in a c. 10 km wide bedrock trough with a reverse slope, increasing to c. 200 m bsl at the fjord entrance, where a bedrock ridge at the eastern flank of the fjord deflects ice flow to the west. Upstream of the fjord entrance, bedrock deepens over an area of about 200 km2 to up to c. 800 m bsl, with steep increase of slope to c. 600 asl at the margins of the depression, then branching into two bedrock troughs reaching further inland towards east and west (Figure 1B). The surface elevation of Ryder Glacier increases gently to c. 200 m asl over the first 50 km from the calving front, then steepening to c. 800 m asl at the fjord entrance c. 70 km upstream, followed by a c. 200 km2 large surface plain before surface elevation increases to c. 900–1,000 m asl levelling in with the surrounding ice sheet, and also branching into an eastern and a western tributary (Figure 1B).
During 1985–2018, multi-annual mean ice surface velocities from the NASA MEaSUREs ITS_LIVE dataset (Gardner et al., 2021) show an increase from less than 50 m/yr to c. 250 m/yr as the fjord entrance is approached at c. 70 km upstream of the terminus, with little variation between years. Towards the calving front, velocities increase to c. 400–600 m/yr, and vary spatially, e.g. the lowest velocities are observed just upstream of the present day grounding line. An example of recent (2020) ice surface velocities is shown in Figure 1C. A short-lived, threefold increase in ice velocity was observed at the end of the melt season 1995, leading Joughin et al. (1996) to propose that Ryder Glacier may be of surge type, and that rapid drainage of supraglacial lakes may have caused the surge in 1995.
Supraglacial lake processes at northern Greenland’s outlet glaciers have recently received some attention (e.g. Sundal et al., 2009; Hill et al., 2017; Macdonald et al., 2018; Holmes et al., 2021). Earlier, Ryder Glacier was included in an ice-sheet wide study of seasonal supraglacial lake evolution during the melt seasons 2003 and 2005–2007 (Sundal et al., 2009), revealing strong inter-annual variations in the timing of the maximum total lake area as well as the annual onset of lake formation. Holmes et al. (2021) investigated the correlation between ice velocities and monthly supraglacial lake formation during 2015–2019, however no direct relationship was found, supposedly due to the too coarse temporal resolution of the lake dataset utilized. Observed supraglacial accumulation of melt water at the terminus of Ryder Glacier was suggested to contribute to floating tongue instability by inducing fracturing and triggering calving at these points of weaknesses, but no evidence for upstream effects on ice velocities including potential speed-up and associated higher ice fluxes across the grounding line was found (Holmes et al., 2021). For the neighboring Petermann Glacier, modelling results indicate that the seasonal variation in velocity of the glacier is mainly controlled by forcings effective at and upstream of the grounding line, with surface meltwater triggering basal lubrication on grounded ice being the main influence on glacier acceleration instead of calving at the floating tongue (Nick et al., 2012). Hence, investigating how surface meltwater in form of supraglacial lakes upstream of the grounding line of Ryder Glacier influences the ice flow could deliver important insights of dynamics of outlet glaciers with a floating tongue.
3 Methods and data
3.1 Pre-processing of satellite imagery
Landsat-5 TM, Landsat-7 ETM+ and Landsat-8 OLI satellite imagery was downloaded for the years 1985–2020 (earthexplorer.usgs.gov). Landsat 7 images affected by a scanline error, resulting from a malfunction of the Landsat 7 Scan Line Corrector, were corrected using the Landsat toolbox in ArcMap. All images used are listed in the Supplementary Materials S1A,B, S2A,B, S3), illustrating their temporal coverage and density and providing context for subsequent discussion and interpretation of results. For lake area detection (Section 3.2, Supplementary Materials S1A,B), lake area and volume estimation (Section 3.5) and retrieval of monthly velocity maps (Section 3.7, Supplementary Material S3) only largely cloud-free images were used. For lake drainage classification (Section 3.4), also partly cloud-covered satellite images were used (Supplementary Material S2A,B). Years 1986, 1996, 2001, and 2003 were excluded due to limited availability of suitable satellite imagery as a consequence of extended periods of heavy cloud coverage over the course of the melt season, which prevented retrieval of sufficient information on lake processes (Supplementary Materials S1B, S2B).
To capture the melting season including its onset and end, largely cloud-free images were retrieved for the months May–September (Howat et al., 2010; Sole et al., 2011; Miles et al., 2017; Macdonald et al., 2018). All images used for the lake analysis with the FASTER algorithm (Section 3.5) were first projected (WGS 1984 UTM Zone 22N (USGS, 2001)). Using the Extract-by-Mask tool in ArcMap (Version 10.6.1), they were then cropped to the study area (Figure 1A), utilizing the ice-sheet mask provided by the MEaSUREs Greenland Ice Mapping Project (Howat et al., 2015; Howat et al., 2014; Williamson et al., 2018a). To ensure that the ice surface is free of shadows from the surrounding fjord walls, particularly due to the changing solar zenith towards the end of the melt season, the lateral margins of Ryder Glacier’s floating glacier tongue were cropped from the images when needed (Fitzpatrick et al., 2014). The same projection and cropping procedures were used to pre-process the 105 images (c. 15 per year) used for velocity analysis (Supplementary Material S3), with the study area extent and location of the velocity transect shown in Figure 1C.
3.2 Lake area detection
Lakes were detected from satellite imagery based on the Normalized Difference Water Index (NDWI). NDWI classifies pixels as either representing a water-covered or a water-free surface (Huggel et al., 2002; Doyle et al., 2013; Fitzpatrick et al., 2014; Miles et al., 2017; Williamson et al., 2017), depending on whether a pixel’s NDWI value is below or above an empirically defined threshold. The NDWI is defined as
and results, when applied to an image, in a binary mask henceforth referred to as the NDWI lake mask (Miles et al., 2017; Williamson et al., 2017). The threshold is image-specific and set to accurately represent all lake surfaces based on a comparison of the NDWI lake mask with the corresponding true color image (Miles et al., 2017), hence allowing for readjustment in case of misclassification (Howat et al., 2013). Depending on the satellite image source, the threshold was set to values ranging between 0.15 and 0.5, see Supplementary Figure S1 in the Supplementary Material S1B.
3.3 Annual lake mask and lake zone boundary
To analyze the spatio-temporal evolution of lake formation on a multi-annual scale, a single composite annual lake mask was created that represents a maximum (though not time synchronous) total lake extent at Ryder Glacier during a specific year’s peak melt season (Howat et al., 2013). For this composite mask, all NDWI lake masks for the months of July and August were merged, because these are the months during which lake area peaks and lake drainage starts. In the case of lack of suitable July images an image from the end of June was added. All individual lakes in each annual lake mask were delineated, and for each lake, its area was calculated according to the pixel size and number encompassed by the individual lake outline. As the availability of suitable satellite images varies over the years (Supplementary Material S1A), composite annual lake masks are not based on a fixed number of NDWI lake masks (Supplementary Material S1B).
For each annual lake mask the boundary of that year’s lake zone was delineated. By overlaying this boundary on a Digital Elevation Model (DEM) (Howat et al., 2014, 2015), the maximum elevation of lake occurrence for each year is determined. By definition, no lakes have formed at higher elevations over the course of a melt season than the maximum elevation of the lake zone boundary. Also, in order to facilitate the detection of a lake expansion trend during 1985–2020, and to avoid over-emphasising individual years considering the biases potentially being induced by limitations of satellite data, the annual lake masks of 5-year intervals were merged to outline the boundary of the lake zone of each composite 5-year lake mask.
3.4 Classification of lake drainage mode
Investigating chronological and cloud-free satellite imagery allows for the determination of modes of cessation of a lake. Either, a lake drains entirely. Or, the lake freezes over at the end of the season, after which it either freezes through entirely, or remains liquid beneath the ice-cover. Accordingly, lake drainage mode was classified into three categories: Drainage is identified if comparison of two successive satellite images (here referred to as first and second) supports that the entire area classified as lake in the first image appears as largely or entirely non water-covered, fractured ice surface in the second one, exposing the lake basin (Figure 2A). The basin is then visible in all subsequent images until the beginning of the next melt season, when it starts to refill with water. If two successive images showing a lake drainage event are at most a few days apart, drainage is classified as rapid and its estimated date must lie within the range of dates between both images. Freeze-over is identified when a lake forms at the onset of the melt season, but does not drain. Instead, an ice cover forms on a lake’s surface towards the end of the melt season, eventually getting snow-covered and creating a smooth surface where the ice/snow covered lake is located (Figure 2B). If this smooth surface is then visible in the satellite images at the beginning of the following melt season, slowly opening up, entirely or partly, towards the peak of the melt season and revealing the lake’s water surface, it is assumed that the lake remained water-filled throughout the winter. A lake that retained water the previous winter, does not drain but freezes over and retains water also the following winter, is classified as buried lake. When limited availability of suitable satellite data prevented lake drainage classification according to the above defined categories, it is classified as unknown.
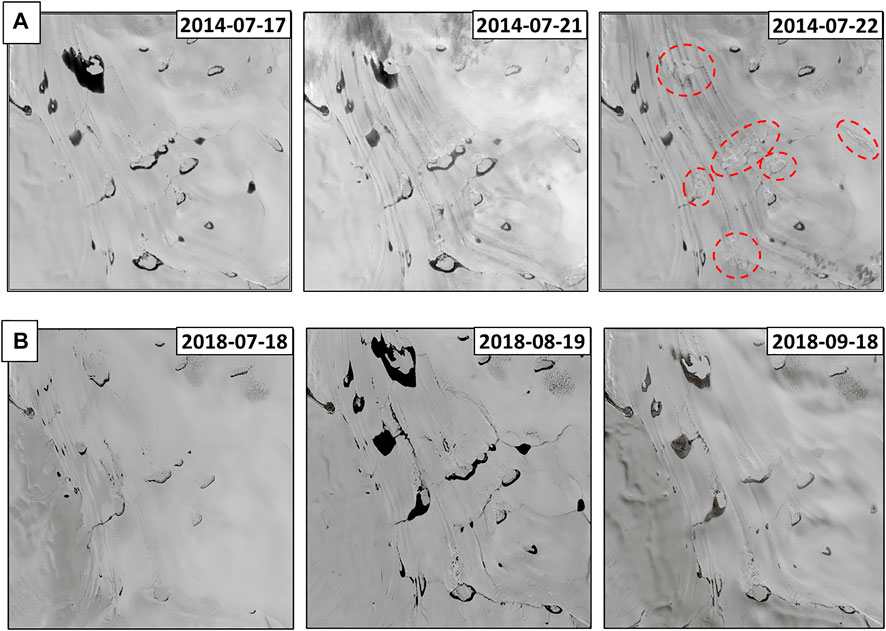
FIGURE 2. Examples of lake cessation modes. Landsat 8 images (courtesy of the U.S. Geological Survey) show area encompassed by the white box in Figure 1B.(A) Coupled lake drainage during 17–22 July 2014 (drained lake locations indicated by stippled red lines). (B) Lake freeze-over. Lakes that did not drain during the melt season 2017 (visible in image from 2018-07-18) reappear in 2018, persist during the summer, and become ice covered (buried) during winter.
3.5 Lake area and volume estimates
Lake area and volume estimates were extracted using the FASTER algorithm developed by Williamson et al. (2018a), and applied to Landsat 8 images. Hence, lake parameters were retrieved for the years between 2013–2020 for which a sufficient number of cloud-free Landsat 8 images are available (2015, 2016, 2018, 2019, and 2020). FASTER applies NDWI to detect lakes and measure their area. Lake volume is estimated as the sum of the pixel-wise product of lake depth and lake surface area, for each identified lake surface pixel. Lake depth is calculated trough a physically-based method applied by Pope et al. (2016), originally developed by Sneed and Hamilton (2007), utilizing that the reflectance of a pixel changes with water depth. This is because of an increasing attenuation of optical wavelengths with depth within the water column (Pope et al., 2016).
3.6 Ice surface and bedrock topography, and surface and basal flow accumulation
Ice surface topography was retrieved in 10 m elevation intervals from the MEaSUREs GIMP Digital Elevation Model Version 1 (created from data acquired during 2003–2009, gridded to 30 × 30 m spatial resolution, (Howat et al., 2014, 2015)), GIMP tile 2.5. Surface depressions were identified and visualized using the Cut Fill—Spatial Analyst Tool in ArcMap, following Igneczi et al. (2016). As GIMP tile 2.5 extends further southward of the lake zone, surface depressions were mapped beyond the lake zone because of their potential relevance for future supraglacial lake formation. Bed topography was retrieved from the IceBridge BedMachine dataset with a spatial resolution of 150 × 150 m (Morlighem et al., 2021, 2017).
Flow accumulation on the bed surface was investigated using the Arc Hydro Toolbox in ArcMap to identify Ryder Glacier’s potential subglacial drainage network pathways. These are governed by flow direction, determined by comparing the elevation of neighboring cells, since flow will go towards the lowest elevation, while flow accumulation is determined by the number of cells that drain into a particular cell of the bed surface DEM (Jenson and Domingue, 1988; Tarboton et al., 1991). By applying a threshold of 2888.36, which corresponds to the default value of 1% of the maximum flow accumulation, the main subglacial pathways of the strongest flow accumulation are highlighted.
3.7 Ice surface velocities
Ice surface velocities were analysed along a flowline (Figure 1C). For a multi-decadal analysis, mean annual ice velocity maps for 1985–2018 were downloaded from the NASA MEaSUREs ITS_LIVE dataset (Gardner et al., 2018; Gardner et al., 2021). A polynomial trendline (order 4) was created to illustrate the trend of velocity de-/increase over time. For investigating seasonal velocities, recent monthly mean ice surface velocities (50 m spatial resolution) were derived from Landsat 8 imagery during the melt seasons 2014–2020 (Supplementary Material S3) using the Glacier Image Velocimetry (GIV) toolbox (Van Wyk de Vries and Wickert, 2021). Applying GIVs default parameters and the maximum temporal oversampling factor, monthly weighted mean velocities were calculated, resulting in 34 monthly velocity maps. Satellite images prior to 2014 did not allow retrieval of velocity maps of sufficient high quality and were therefore not considered for the seasonal velocity analysis.
4 Results
4.1 Supraglacial lake dynamics and extent at Ryder Glacier, 1985–2020
Between 1985 and 2020, the number of satellite images suitable for supraglacial lake analysis increased (Supplementary Material S1A). Also, total lake number and area increased, aligning with the trend of increasing mean annual air temperatures (Figure 3). Annual total lake number and total lake area are positively correlated to mean annual air temperature (Pearsson coeffcients of 0.69 and 0.59, with p-values of 1.074953e-05 and 3.273101e-04, respectively). Comparing the annual lake zone outlines of the years 1985 and 2020 (Figure 4) reveals an extension of the maximum elevation of lake occurrence at Ryder Glacier from c. 1,230 m asl (1985) to c. 1,320 m asl (2020).
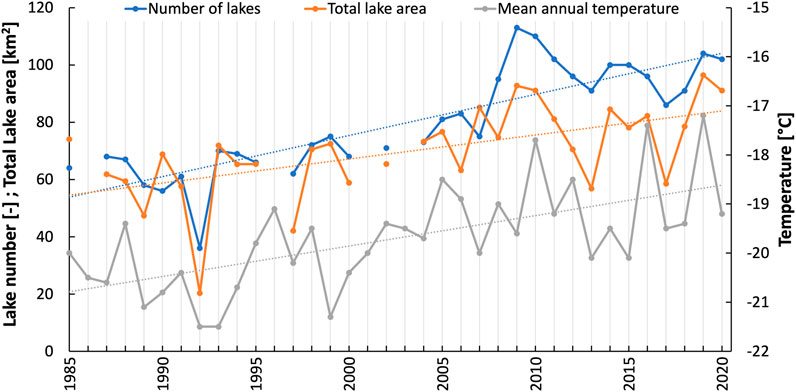
FIGURE 3. Number of delineated lakes (blue dots), and total lake area (orange dots), from each annual lake mask (Section 3.3); mean annual temperature in the Ryder Glacier area (grey dots), from ERA5 reanalysis data (Hersbach et al., 2019). For each data set, trendlines (color-coded, dotted) are plotted.
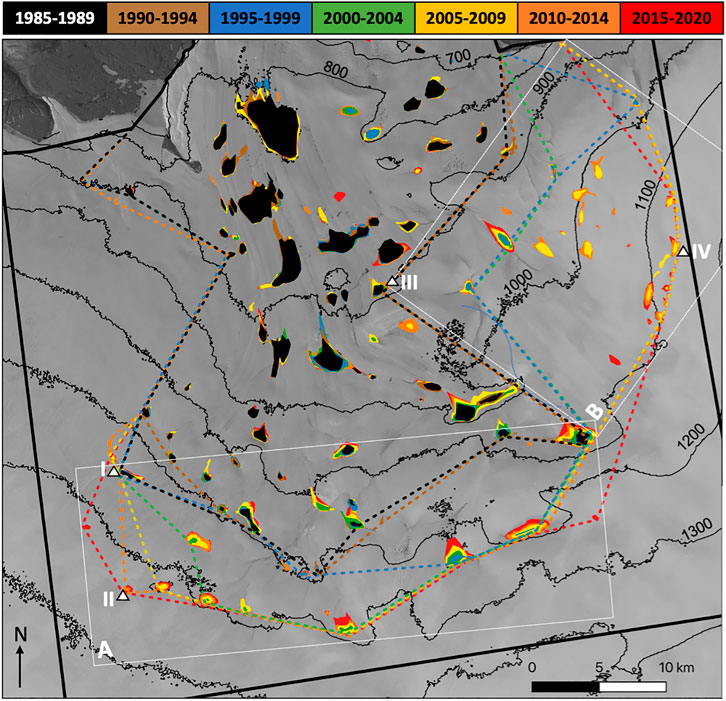
FIGURE 4. Ryder Glacier: Lake development in 5-year intervals (against Landsat 8 - Band 4 image, 2020-07-01, courtesy of the U.S. Geological Survey). Lakes: solid filled colors. Stippled coloured lines: lake zone boundaries. White boxes (A) and (B): areas with different lake development; White triangles I to IV: lakes that mark the maximum elevation of the lake zone in 1985 and 2020 in box (A) (I, II) and in box (B) (III, IV).
Expansion of supraglacial lakes did not progress in a spatio-temporally uniform pattern and intensity over the past decades. Across the western sector (Figure 4A), along the southern lake zone boundary, lakes migrated c. 5–8 km upstream and to c. 90 m higher elevations (from c. 1,230 m asl in 1985 to 1,320 m asl in 2020). Between 1985 and 1994, the lake zone outline in this region largely remained constant, however, lakes at the boundary of the lake zone grew in size. Between 1995 and 1999, the lake outline expanded with new lake formation along the central-southern margin, and between 2000 and 2004 lake expansion can be observed also along the south-western margin of the lake zone. Generally, both existing and newly formed lakes across the western tributary gradually increased in lake area since 1985. After 2005, existing lakes continue to increase in area but only little inland-expansion of lakes occurs, reaching the present day maximum elevation of lake occurrence at Ryder Glacier during 2010–2015 (1,320 m asl).
Across the eastern sector, lakes migrated c. 15 km upstream, shifting the lake occurrence elevation by c. 280 m, from 870 m asl (in 1985) to 1,150 m asl (in 2020). Supraglacial lake distribution showed little variation before 1995 (Figure 4B), after which lake expansion to elevations between 900 and 1,000 m asl took place for roughly a decade, yet, without areal expansion of individual lakes. Intensified lake formation and expansion happened during 2005–2009, when the maximum lake zone outline expanded to c. 1,150 m asl. This also marks its elevation in the year 2020, indicating it has remained constant since 2010. However new lakes formed and the growth of existing lakes continued across the lake zone of the eastern sector.
In contrast, only little change is recorded during 1985–2020 for a number of large lakes that are situated on the central plain, at the confluence of the eastern and western tributaries (Figure 4). These lakes only gained slightly in area, and some new lakes formed between these large and relatively persistent lakes. Similarly, few new lakes formed during 1985–2020 in the region between the fjord entrance and grounding line (not shown), while existing lakes changed in size and shape but remained at their locations.
4.2 Changes in supraglacial lake drainage patterns between 1985 and 2020
Figure 5A shows the relative proportion of lakes that are classified as exhibiting drainage, freeze-over or burial, versus the proportion of lakes which cannot be classified because of a lack of suitable satellite imagery (Supplementary Material S2A,B). Until the late 1990s, the majority of lakes classified persisted as buried lakes, interrupted by occasional drainage of a small number of lakes (Figures 5, 6). After 2000, drainage events became more frequent, and a simultaneous rapid drainage of several lakes on the central plain (Figure 5B) (hereafter referred to as coupled drainage), was observed for the first time in 2002 (Figure 6), and then in 2005 and 2008. During 2010–2020, a coupled drainage event was detected in most years and involved not only an increasing number of lakes but also gradually included lakes located farther inland (Figures 5B, 6). Years 2013, 2017 and 2018 were characterized by absence of coupled lake drainage events, few individual drainage events inland of the fjord entrance, and a freeze-over dominated cessation of lakes (Figure 6).
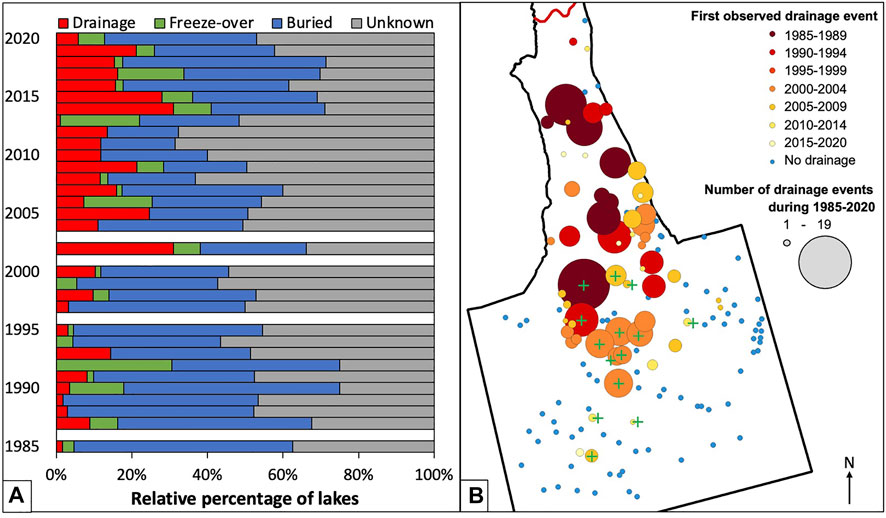
FIGURE 5. (A) Modes of lake cessation over time. Relative percentage of lakes (per annual lake mask) that drain (red), freeze over (green), or get buried (blue). White: Years with no data. Grey: Unclassified lakes. (B) Number of drainage events (according to circle size) and first observed year of drainage (color-coded) for all lakes during 1985–2020. Lakes connected to coupled drainage network marked by green cross.
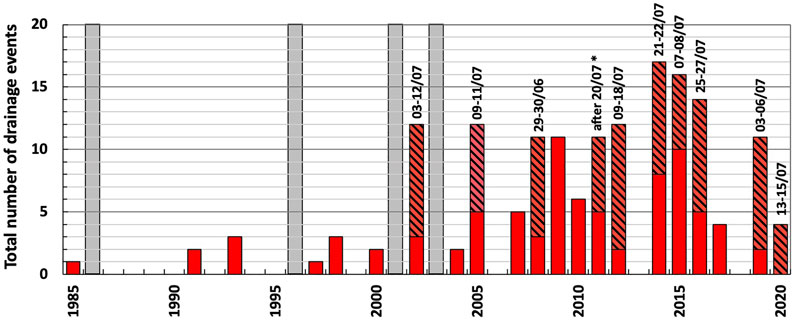
FIGURE 6. Lake drainage inland of the fjord entrance (Figure 4). Red bars: events per melt season. Black hatched: coupled drainage, and approximate date range (Section 3.4). In 2011 (*), a coupled drainage event likely occurred after July 20, but available imagery does not allow to define the exact timing. Grey bars: years with no data.
The lakes over the western and eastern tributary showed overall few lake drainage events, and new lakes were dominantly classified as buried (Figure 5B). Across the eastern tributary, three lakes started draining after 2005, of which one individual lake that drained in 2014 and 2019 was linked to the coupled drainage network. Across the western tributary, four lakes that already existed since 1985 started gradually draining after 2005, of which three became connected to the coupled drainage network.
Between the fjord entrance and the grounding line, a number of smaller lakes which did not necessarily form every year, drained frequently since 1985, but not during each melt season (Figure 5B). Similarly, four larger lakes about c. 15 km from grounding line would drain in some years and freeze over in others, the water surface remaining almost entirely ice-covered in individual years.
4.3 Seasonal evolution and inter-annual variability of total lake area and volume
Total lake area and volume (Section 3.5) show inter-annual differences in progression over the course of the melt season (June-August). First occurrence of lakes takes place around mid-June, after which lake area increases. In years 2015, 2016, 2019, and 2020, total lake area and volume peak in July, and then decrease until the end of the melt season, after a pronounced drop in July (exemplified by 2016 and 2020, stippled red boxes, in Figure 7), matching the timing of a coupled drainage event (Figure 6). In 2018, total lake area and volume estimates show a different progression: The total lake area increases slowly at the beginning of the melt season (Figure 7) due to the gradual loss of ice-cover on lakes which froze over and did not drain during the previous melt season 2017 (Figure 6). Total lake area peaks in August in 2018 which is explained by the lack of any drainage events during the melt season 2018. After the peak, total lake area decreases until the end of the melt season when lake surfaces gradually become ice-covered and eventually freeze over again.
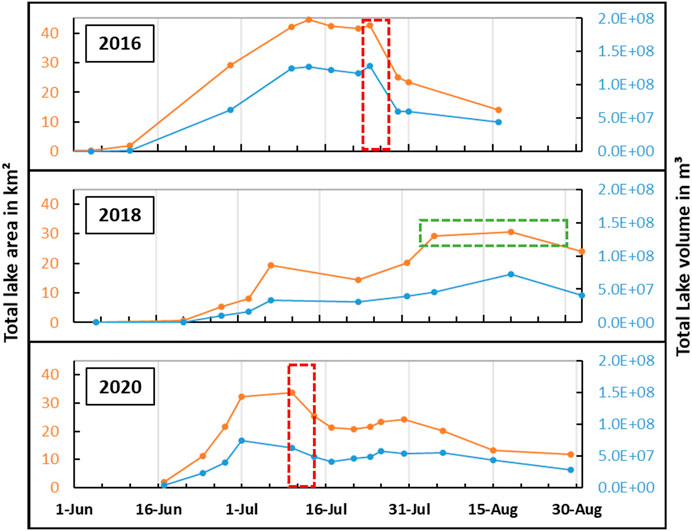
FIGURE 7. Total lake area (orange) and volume (blue) for melt seasons 2016, 2018, and 2020, retrieved from Landsat 8 imagery using the FASTER algorithm (Williamson et al., 2018b). Similar to 2016 and 2020 are 2015 and 2019 (not shown). Red stippled boxes highlight drop in total lake area after a coupled drainage event. Green stippled box highlights late peak in total lake area and volume in 2018.
4.4 Supraglacial lake formation in relation to surface and bed topography
Comparing lake locations during the melt season 2020 with the location of topographic glacier surface lows from the MEaSUREs GIMP DEM (Howat et al., 2015, 2014) (Section 3.6) shows that nearly all lakes have formed in ice surface depressions (Figures 1B, 8). The largest ones also encompass the largest lakes.
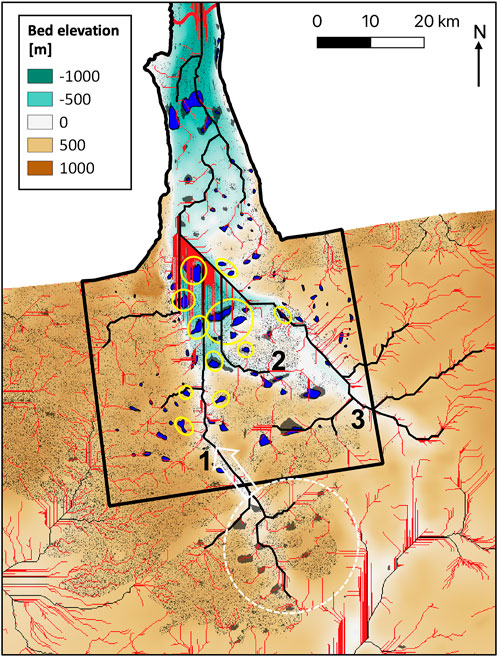
FIGURE 8. Subglacial drainage pathways beneath Ryder Glacier. Basal flow accumulation (red lines) and main basal meltwater streams (black lines, thickness of major flow paths 1, 2, 3 is exaggerated) are overlain onto the bed topography (Figure 1B). Grey filled features: ice surface depressions. Blue filled features: supraglacial lakes (melt season 2020). Yellow circles: encompass lakes involved in coupled drainage events. White stippled circle: encompasses cluster of surface depressions located beyond the current (2020) lake zone. White arrow: indicates connection between flow path 1 and the cluster of surface depressions.
Melt water reaching the glacier base is routed along three major flow paths coinciding with subglacial topographic troughs (Figure 8), and accumulates in a bedrock depression beneath the western central surface plain, from where it is topographically steered to the glacier terminus. Above the subglacial flow path 1, in the western sector (Figure 4 box A), several supraglacial lakes are located, of which four are affected by drainage (Figure 5B). Further inland, flow path 1 aligns with a cluster of surface depressions (Figure 8, white stippled circle) that lies beyond the lake zone 2020 and that is hence not yet occupied by supraglacial lakes.
At the eastern tributary, supraglacial lakes are located in close proximity to subglacial flow path 2 (Figure 8), and slightly farther scattered from flow path 3, above which one lake of the coupled drainage network is located. The central bedrock depression, where basal melt water from both the eastern and western tributary accumulates, is located in the same area where the cluster of large lakes is situated on the ice surface, which frequently drain in form of coupled drainage events after 2000 (Figures 2A, 5B).
4.5 Ice surface velocities
Figure 9 shows mean annual ice surface velocities along the flowline (Figure 1C) at Ryder Glacier during 1985–2020. Despite strong inter-annual fluctuations, an overall trend of mean annual velocity decrease can be seen between 1985 and 2010. Yet, since 2010, a rather strong trend of velocity increase with only small fluctuations is observed. For instance, from 2012 to 2018 annual velocities increased about 80–100 m yr−1 between the terminus and c. 50 km upstream, with slightly lesser velocity increase beyond (c. 45 m yr−1).
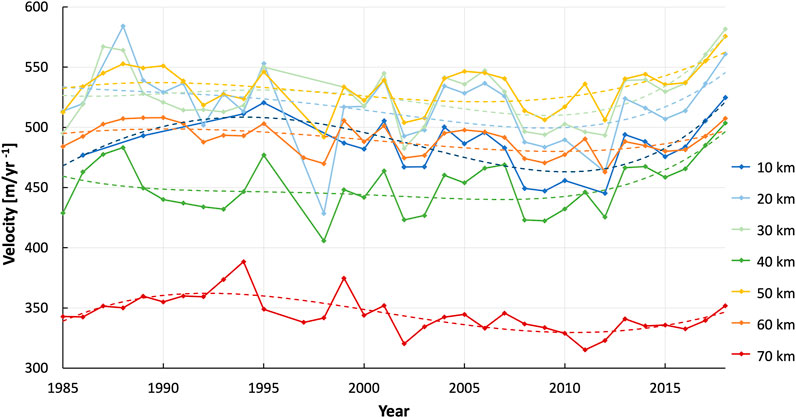
FIGURE 9. Mean annual ice velocities (solid lines) during 1985–2018 (Data source: NASA MEaSUREs ITS_LIVE, Gardner et al. (2021)), upstream of the glacier terminus (0 km), at 10 km interval markers (Figure 1C). Dotted lines: trendline (polynomial order 4).
Exemplified by data from 2017 to 2019, Figure 10 shows contrasting patterns of seasonal evolution of ice velocities, derived from monthly velocity maps for melt seasons (May-Sept) 2014–2020 along the Ryder Glacier transect (Figure 1C). In most years, the seasonal velocity pattern showed highest mean monthly velocities in May, followed by a gradual decrease, irrespective of where along the transect velocities are recorded, until the lowest velocities were reached in September. However, in years 2017–2018, the opposite pattern was observed with monthly velocities being lowest in May and gradually increasing towards the end of the melt season, when they peak. An inter-annual comparison of mean monthly velocities (Figure 11) shows that ice velocities at the beginning of the melt season (May) are similar in all years, but in years 2017–2018 significantly higher at the end of the melt season (September), resulting in an overall higher seasonal velocity in these two years. This coincides with a larger number of lakes freezing over and the absence of (coupled) lake drainage events inland of the fjord entrance in 2017–2018 as compared to other years during 2014–2020 (Section 4.2, Figures 5A, 6).
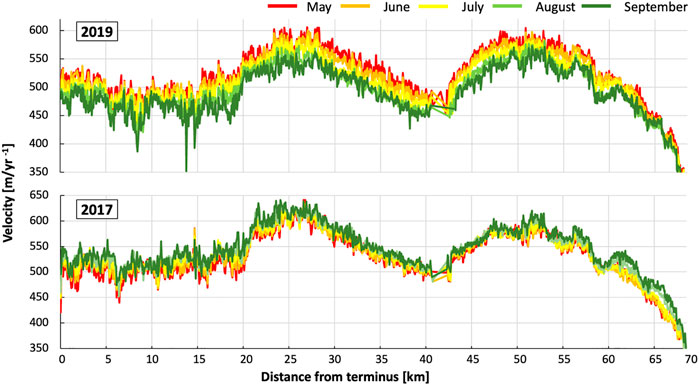
FIGURE 10. Monthly (May-September) ice velocities (Data source: from Landsat 8 imagery, courtesy of the U.S. Geological Survey (Supplementary Material S3), calculated with GIV toolbox (Van Wyk de Vries and Wickert, 2021) along Ryder Glacier transect (Figure 1C). Upper panel: Data from 2019, similar to 2020, 2016, 2015, and 2014. Lower panel: Data from 2017, similar to 2018.
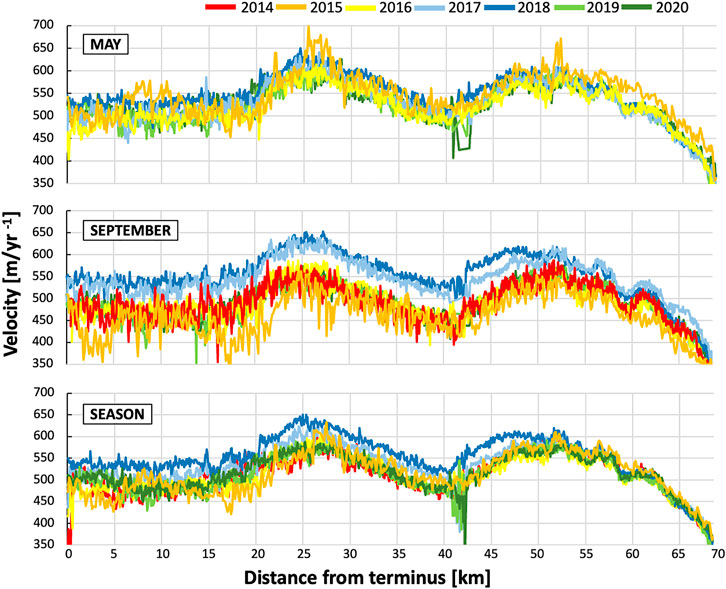
FIGURE 11. Monthly May and September, and mean seasonal (May-September) ice velocities, from Landsat 8 imagery, courtesy of the U.S. Geological Survey (Supplementary Material S3), calculated with GIV toolbox (Van Wyk de Vries and Wickert, 2021)) for 2014–2020 along Ryder Glacier transect (Figure 1C).
5 Discussion
5.1 Data, spatio-temporal resolution and tools
The results presented in Section 4 are based on the analysis of satellite images (Section 3.1, Supplementary Material S1–S3). As the results, their accuracy, and their interpretation can be affected by the quality and suitability of the satellite data, pre-processing modifications applied to the images, and the selected tools for data analysis, these need to be discussed. Since 1985, the spatial (30 m for Landsat 4–5, 15 m for Landsat 7–8) and temporal resolution (availability of cloud-free images) of satellite images has increased, rendering better prerequisites to detect supgraglacial lakes. Annual ice velocity analysis is facilitated by the NASA MEaSUREs ITS_LIVE dataset (Figure 9), but has limitations due to especially winter data scarcity prior to the launch of Landsat 8 in 2013, with a more complete annual coverage only after 2013 (Gardner et al., 2021). Yet, winter velocities are needed to comprehensively investigate how overall annual velocities are affected by changes in surface melt distribution throughout the year (e.g. Schoof, 2010; Sole et al., 2013, 2011; Doyle et al., 2014; van de Wal et al., 2015; Davison et al., 2020).
The inhomogeneous temporal distribution of suitable satellite images implies the risk to fail to accurately capture e.g. the maximum extent of individual lakes, or their drainage mode (Figure 2), in years when only few images are available. Unclassified lakes (Figure 5) emphasize this problem, and also raise awareness for the possibility of false classification, particularly since drainage events occur within a time-span of only a few days and lakes can be small in size (e.g. Sundal et al., 2009; Fitzpatrick et al., 2014; Williamson et al., 2017). Furthermore, differences in temporal resolution of the available cloud-free satellite imagery might induce a bias in the number of drainage events classified as rapid (Cooley and Christoffersen, 2017).
Moreover, applying pre-processing modifications to images used for lake analysis, such as the selection of study area extent (also for monthly velocity maps), or shadow correction procedures (due to clouds or marginal fjord topography) may imply that a number of lakes could have been overlooked (Section 3.1). Also, the empirically defined threshold, required in the NDWI procedure, may influence lake area detection and lake zone definition (Section 3.2, Figure 4) (e.g. Doyle et al., 2013; Miles et al., 2017; Williamson et al., 2017). The observed need for a non-constant threshold in the NDWI (Supplementary Material S1B) to achieve more accurate lake surface detection motivates to test variable thresholds in other applications (e.g. (semi-)automated Greenland-wide/regional lake detection). Likewise, exclusively relying on optical imagery presents a challenge in precisely detecting the occurrence and extent of buried supraglacial lakes (e.g. Koenig et al., 2015; Miles et al., 2017). A more accurate classification of buried supraglacial lakes would rely on radar imagery, revealing the underlying water body (e.g. Koenig et al., 2015; Miles et al., 2017; Benedek and Willis, 2021). In view of these factors, we checked the here detected annual total lake area and number against true-color imagery, and found good agreement. We suggest therefore that lake number and area have not been overestimated, however, they may have been underestimated due to temporal gaps in suitable satellite data. Lake volume was extracted with the FASTER algorithm as an additional lake parameter, and is shown in Figure 7 for completeness, but not further discussed as it mirrors the same trend as the lake area estimates that present a more directly obtained lake measurement (Georgiou et al., 2009; Fitzpatrick et al., 2014).
In addition, the coarse resolution of available ice surface and bed topography datasets available for the GrIS can affect interpretations regarding the relation between topography and supraglacial lake processes (e.g. Joughin et al., 2013; Leeson et al., 2013; Igneczi et al., 2018). Ice surface elevation is averaged over 2003–2009 in the here utilized GIMP DEM, thus temporal changes in ice surface elevation during, or after, this time (e.g. due to ice thinning, ice flow related features such as crevasses, snow-/ice-filled depressions) might not accurately represent ice surface during 1985–2020 (Howat et al., 2014; Igneczi et al., 2016). Similarly, flow paths inland of the fjord entrance could only be identified approximately (Figure 8). Depression-filling, as one step for creating the flow accumulation map in ArcGIS, is utilized to ensure that flow paths terminate at the data set edge instead of inside depressions. Consequently, the larger sized depression inland of the fjord entrance is likely represented as a larger flat area after applying the initial depression-filling. Flat areas create challenging conditions for determining flow direction and accurate flow paths, as they are based on slope. This will likely produce wide, straight lines as seen in the flow accumulation map where the bed depression is located (Jenson and Domingue, 1988). A more advanced method to delineate flow paths may be required to resolve this issue.
Despite these caveats, we argue that results obtained here are confident and reflect the overall pattern of supgraglacial lake dynamics at Ryder Glacier during 1985–2018 well. First, even though fewer satellite images were available in earlier years, they were still well distributed over the entire melt season May-September (on average 20 images per summer, see Supplementary Material S2B). Second, the percentage of lake drainage mode classified as unknown is not significantly higher in earlier years despite fewer images, see Figure 5A. Third, we have based our analysis of trends in lake dynamics on 5-year intervals, through which we aim to reduce errors from over-emphasising individual years (because individual lakes which may have been missed in 1 year may have been detected in the following year instead). Fourth, classification of lakes and their drainage dynamics was—despite better availability of satellite images—more challenging in the years after 2000, because newly-formed lakes tend to be small (Figure 4), whereas lake properties and behavior prior to 2000 showed a higher degree of inter-annual consistency facilitating lake classification. Finally, the consistent occurrence of drainage events in the fjord area, over all years studied (Figure 5B) despite variability in suitable satellite images, supports the interpretation that the observed changes in drainage behavior inland of the fjord area are not strongly influenced by variability in suitable satellite imagery, either.
5.2 Accelerated lake expansion, and implications for future lake expansion
Our results provide evidence for an increase in total supraglacial lake area and lake number at Ryder Glacier, as well as an inland-expansion of these lakes to higher elevations during 1985–2020 (with an intensified expansion since 2000), when an increasing availability of melt water on the ice surface due to rising air temperatures is observed (Figures 3, 4). This is in agreement with previous studies, which also reported an inland-expansion of GrIS supraglacial lakes, particularly since 2000 (e.g. Howat et al., 2013; Doyle et al., 2014; Fitzpatrick et al., 2014; Leeson et al., 2015; Igneczi et al., 2016; Miles et al., 2017).
We have also shown that lake expansion on Ryder Glacier has largely followed the pattern of surface depressions (Figure 8), as these provide favorable conditions for supraglacial lake formation (e.g. Lüthje et al., 2006; Igneczi et al., 2018). This is relevant for predictions of future lake distribution, because the identified cluster of surface depressions beyond the current maximum elevation of lake distribution (Figure 8) hints at a potential location for future lake formation (e.g. Howat et al., 2013; Leeson et al., 2015; Igneczi et al., 2016). Yet, in some areas lakes can be detected where surface depressions cannot be identified, which could be attributed to coarse spatial resolution of the ice surface DEM, cf. Section 5.1, as exemplified by contemporary lake distribution over the eastern sector of Ryder Glacier (Figures 1B, 8). Hence, predictions for future lake expansion in this sector are uncertain. Even if spatial resolution issues were resolved, predictions for future lake distribution over the GrIS based on surface topography data must account for the dynamic thinning of the ice sheet if uncertainties in decadal to centennial predictions shall be reduced (e.g. Brown et al., 2018; Igneczi et al., 2018; Moon et al., 2020).
5.3 Changes in lake drainage behavior since 1985
At lower elevations, on the central plain of Ryder Glacier, a significant change in drainage behavior of supraglacial lakes, from annually refreezing and not draining, to frequently and rapidly draining, was observed since 2000 (Figures 5, 6). Lakes at increasingly higher elevations were affected over time (Figure 5B), supporting predictions that rapid drainage events will spread over larger areas of the GrIS with continued increase in temperature and melt intensity (e.g. Das et al., 2008; Liang et al., 2012; Fitzpatrick et al., 2014). A network of lakes, connected through main subglacial flow paths (Figure 8), drained more frequently in the form of annually reoccurring coupled drainage events, gradually incorporating lakes increasingly further inland (Figures 5B, 6). Coupled lake drainage events have been proposed to start from one individual drainage, which then induces tensile-stress perturbations that transfer fractures into surrounding ice, triggering fracture driven drainage of neighboring lakes along the same subglacial drainage pathway (Fitzpatrick et al., 2014; Christoffersen et al., 2018). The inland cluster of surface depressions at the western tributary beyond the present-day (2020) lake zone (Figure 8, white stippled circle), connects to the network of coupled lakes through the same flow path (Figure 8, flow path 1) and could possibly link future inland lakes to coupled lake drainage events. Also at the eastern tributary, an individual lake, connected to the central plain through subglacial flow path 3 (Figure 8), was linked to the coupled drainage network in recent years (Figures 5B, 8). More lakes along this flow path might become connected to the central coupled lake network over time. However, by solely analysing satellite imagery it remains unclear whether individual lakes of the coupled lake network all drain through hydrofracture, or whether some drain through overflow into supraglacial streams linked to neighbouring lakes (e.g. Catania et al., 2008; Das et al., 2008; Morriss et al., 2013; Cooley and Christoffersen, 2017): Fractured empty lake basins, visible after a drainage event (Figure 2A), might hint at hydrofracture-induced drainage (Das et al., 2008; Stevens et al., 2015), and the network of surface streams, connecting the coupled lakes, might provide evidence for partly supraglacial lake drainage.
In contrast, at higher elevations, newly formed lakes beyond the lake zone boundary of 1985 mostly appeared as buried lakes (Figure 5B), supporting findings of previous studies that report the predominant occurrence of buried lakes at higher elevations, usually between 1,000 and 2000 m asl (e.g. Miles et al., 2017; Lampkin et al., 2020). Buried lakes contribute to the storage of meltwater on the ice surface over one or multiple melt seasons, instead of releasing it directly to the glacio-hydrological system (Koenig et al., 2015). From the analyzed imagery it is not entirely clear if all buried lakes retain liquid water during winter or freeze through entirely, refilling during the next melt season. Recent studies report lake drainage events of buried lakes during the winter season (e.g. Schröder et al., 2020; Benedek and Willis, 2021), presenting a need to extend future lake monitoring beyond the melt season (Pitcher et al., 2020).
In the future, buried lakes at higher elevations might undergo a similar shift towards rapid drainage behavior as already observed at lower elevations of Ryder Glacier (Figure 5B), increasing the delivery of meltwater to the glacier bed and impacting ice flow (Miles et al., 2017). Buried lakes can contribute to softening and fracturing the ice locally (Koenig et al., 2015; Lampkin et al., 2020). Yet, it is unclear whether there is an altitudinal limit to the potential of rapid lake drainage and hydrofracture as a result of increasing ice thickness and restricted formation of crevasses with higher elevations (e.g. Poinar et al., 2015; Williamson et al., 2018b). Instead, lakes might more likely drain via surface streams into preexisting moulins and crevasses located at lower elevations (e.g. Catania et al., 2008; Poinar et al., 2015; Stevens et al., 2015). While previous observations indicate that local lake drainage can be a prerequisite for the formation of moulins in areas of thick ice (Catania et al., 2008), creep closure rates increase with ice thickness and lower the chances for surface-to-bed connections to persist (Schoof, 2010; Fitzpatrick et al., 2014).
5.4 Inter-annual variability in lake drainage behavior
At Ryder Glacier, lake dynamics over the course of a melt season showed strong inter-annual variations (Figures 2, 6), similarly observed elsewhere at the GrIS (e.g. Sundal et al., 2009; Morriss et al., 2013; Fitzpatrick et al., 2014). Yet, two patterns can be distinguished, from which a season’s dominant lake drainage mode as well as the timing of coupled drainage events can be derived. Firstly, in the drainage dominated years of 2015, 2016, 2019, and 2020, distinct drops in total lake area can be detected in the FASTER results (Figure 7), that match the timing of coupled drainage events (Figure 6). Sundal et al. (2009) presented data on the seasonal evolution of total lake area at Ryder Glacier for the years 2003 and 2005–2007, of which 2003 and 2005 follow a very similar progression of total lake area with a distinct drop in July. Image analysis for 2005 reveals a coupled drainage event between July 09-11 (Figure 6), matching the drop of total lake area shown in the data retrieved by Sundal et al. (2009). Secondly, non-drainage dominated years are characterized by a slow but steady increase in total lake area over the melt season. Our analysis identifies 2018 as such a year (Figure 7), also observed by Holmes et al. (2021), and a similar evolution of total lake area was shown by Sundal et al. (2009) for years 2006 and 2007 and supported by imagery analysed here for these years (Figure 6). Overall, lake area evolution over the melt season can therefore be seen as an indicator for identifying whether meltwater drainage or storage was the dominant process during a particular year.
The possibility of determining seasonal lake drainage patterns and melt season specific lake behavior from quantitative (semi-)automated lake area analysis can facilitate the assessment of lake behavior from larger datasets, without having to examine individual satellite images. However, in order to draw reliable conclusions from seasonal lake area datasets, a high temporal resolution of cloud-free satellite imagery datasets is required, yet not always available (e.g. Fitzpatrick et al., 2014; Cooley and Christoffersen, 2017). More comparative studies are needed to further test if the here identified patterns in seasonal evolution of lake area and its implications regarding lake drainage behavior apply to other glaciers around the GrIS.
5.5 Lake drainage mode affecting seasonal evolution of ice velocity regimes
The seasonal ice velocity pattern at Ryder Glacier in years 2017–2018 (Figures 10, 11) is remarkable, because it differs from the patters observed during all other years from 2014 to 2020, and because it coincides with an observed deviation in lake drainage behavior (Figure 6, Sections 4.2, 4.3, 4.5). This indicates a likely connection between ice flow and lake processes on a seasonal time-scale, and could be explained by a lake drainage triggered transition from an inefficient drainage system to an efficient one. Inter-annual variations in seasonal glacier velocity regimes, as observed at Ryder Glacier between 2014 and 2020, have been linked to annual changes in subglacial hydrology, runoff behavior or terminus changes (Moon et al., 2014). The seasonal ice flow regime at Ryder Glacier in years of extensive lake drainage, such as e.g. 2019, reflects a common meltwater driven seasonal velocity regime, prevalent at a large number of outlet glaciers around the GrIS (Moon et al., 2014; Vijay et al., 2019). It is characterized by an early-summer peak in velocities (May-June) as the first meltwater input overwhelms the drainage system. Velocities then decrease gradually towards the end of the melt season as higher meltwater input is compensated by an increasingly efficient drainage system (e.g. Schoof, 2010; Sole et al., 2011; Ahlstrøm et al., 2013; Hewitt, 2013; Moon et al., 2014; Hoffman et al., 2018; Davison et al., 2020). Once the meltwater input significantly decreases at the end of the melt season, the efficient drainage system collapses, and returns to an inefficient drainage system as the starting point of the following melt season (Howat et al., 2010). Lake drainage has been shown to contribute to establishing an efficient drainage system, whereby clustered lake drainage events support the rapid reorganisation of the drainage system (e.g. Sole et al., 2011; Andrews et al., 2018). Consequently, the continued velocity acceleration at Ryder Glacier towards the end of the melt season in lake freeze-over dominated years 2017–2018 (Figure 10) might be explained by the lack of high volume melt water input from simultaneous drainage events (Figure 6), preventing an efficient drainage system to evolve over the course of the melt season and resulting in an overall increased seasonal ice flow (Figure 11, lowest panel). Investigating melt seasons before 2014 could deliver additional information on seasonal ice-dynamical feedback to the observed shift in lake drainage behavior since 1985. Overall, linking lake processes to the seasonal ice velocity pattern can be used to better understand inter-annual variations of seasonal ice flow and to reveal insights about the efficiency of the drainage system over the course of a melt season. In addition to supraglacial lakes, supraglacial streams and rivers (e.g. Smith et al., 2015; Yang et al., 2021), as well as moulins (e.g. Banwell et al., 2016; Hoffman et al., 2016), have been found to be important contributors to the distribution and drainage of surface meltwater. A combined assessment of the different meltwater formations may provide a comprehensive understanding on how supraglacial meltwater processes impact glacier dynamics.
5.6 Evolution of lake processes and ice flow on decadal timescales
The shift from decreasing to increasing annual velocities, observed to occur around 2010 (Figure 9), coincides with an increased frequency and spatial expansion of rapid drainage events (Figures 5, 6), possibly revealing a connection between both trends. The expansion of supraglacial lakes to higher elevations has been proposed to affect glacier dynamics by inducing melt water to areas of the glacier bed that were previously unaffected by melt water drainage, resulting in increased basal lubrication (e.g. Liang et al., 2012; Howat et al., 2013; Leeson et al., 2015; Igneczi et al., 2016; Hoffman et al., 2018). At this point, the majority of newly formed lakes at higher elevations at Ryder Glacier were identified as buried lakes (Section 5.3, Figure 5B), with only few observed rapid drainage events. Therefore, it is unlikely that the areal expansion of lakes significantly affected the subglacial hydrology at higher elevations. However, the increased frequency of lake drainage events at lower elevations (Section 5.3) suggests an increased annual melt water input to the subglacial drainage system of Ryder Glacier, which could substantially impact ice dynamics, and may or may not lead to flow acceleration, depending on the dynamic evolution of the drainage system and its development into an ice flow regulating structure (cf. Section 5.5). Hence, the observed increase in frequency of drainage events may be more important than the sheer expansion of lakes to higher elevations with regards to the sustained annual velocity increase over the past decade. In the light of the observed increase of recent annual velocities at Ryder Glacier, it can thus be speculated that Ryder Glacier could have an inefficient, overburdened drainage system, or a seasonal acceleration too high to be compensated throughout the year, possibly as a consequence of increased melt water input from lake drainage intensification.
Increased summer velocities have been observed to be compensated by a subsequent slow-down in winter velocities, hence mitigating the effect of increased basal lubrication on overall annual velocities (e.g. Schoof, 2010; Sole et al., 2013, 2011; van de Wal et al., 2015; Davison et al., 2020). However, an increased melt water input to the glacier bed at further distance from the terminus could offset the balance between summer and winter motion and lead to increased annual ice flow (Sole et al., 2013). Adding investigations of ice velocities during the winter season could reveal crucial insights on how ice velocities respond to melt water input throughout the year (Sole et al., 2013; Doyle et al., 2014).
Similar to the observed acceleration of Ryder Glacier since 2012 (Figure 9), Mouginot et al. (2015) found accelerated annual ice flow across the grounding lines of Nioghalvfjerdsfjorden and Zachariae Isstrøm at the northeast GrIS margin, after 2006 and 2012, respectively, prior to which annual velocities were rather stable during 1976–2000. This has been attributed mainly to recent calving at these two outlet glaciers, and to the decay of Zachariae Isstrøm’s ice shelf since the beginning of the 21st century (Mouginot et al., 2015). At Ryder Glacier, calving was observed to occur in approx. 10 years intervals between 1995 and 2019, with major events in 1999, 2007, and 2016 (Holmes et al., 2021). Comparing annual ice velocities around these years, a uniform glacio-dynamical response to the calving events is not observed. In the year after the calving events in years 1999 and 2007 there is a drop in annual ice velocities, followed by a fluctuating annual ice flow. The calving event 2016 overlaps with a period of consistent increase in annual ice flow, but does not seem to impact the trajectory of this trend. Holmes et al. (2021) found that at this point calving events have only a limited ice-dynamical impact on Ryder Glacier as the stability of the floating tongue appears to be controlled by fjord geometry. Changes in the positioning of the floating tongue within the fjord walls, resulting e.g. from its detachment from the fjord walls or ice front retreat to wider fjord areas, could result in increased sensitivity of ice flow dynamics to calving events in the future.
The effect of surface meltwater induced enhanced basal lubrication to glacier flow, as in the case of supraglacial lake drainage, has been argued to be important but relatively small compared to other processes affecting the dynamics of marine-terminating glaciers such as calving and ice front retreat (Joughin et al., 2008). However, with greater distances from the glacier terminus (
6 Conclusion
Here, we have presented a remote sensing based analysis of supraglacial lake expansion and their drainage behavior as observed at Ryder Glacier, Northern Greenland, during 1985–2020. The 35-year time span allowed for the detection of trends in datasets that were found to exhibit large inter-annual variability. Specifically, we find that:
• Under rising air temperatures, supraglacial lakes have increased in total number and total area, and have also expanded inland from the GrIS margin (with 5–15 km) and to higher (90–280 m) ice sheet elevations. However, lake expansion does not progress in a spatio-temporarily uniform way.
• A coupled supraglacial lake drainage event was observed to occur for the first time in 2002, and to re-occur more frequently in the following years, including a growing number of lakes at increasingly higher elevations.
• Uncoupled lake drainage frequency increased at lower elevations, while new lakes at higher elevations largely store melt water supraglacially in form of buried lakes.
• Lake formation closely follows glacier surface depressions, revealing potential locations of future lake occurrence.
• Subglacial meltwater reaching the glacier base is routed along three major flow paths, coinciding with subglacial topographic troughs.
• By regulating the efficiency of the subglacial drainage system, lake behavior appears to determine the seasonal pattern of ice velocities.
• The seasonal evolution of total lake area as well as ice velocities may be used as indicators for the general assessment of a melt season’s prevailing lake drainage behavior, before initiating a more extensive analysis on the scale of individual consecutive satellite images.
• The effect of supraglacial lake evolution during 1985–2020 on annual ice velocities is not entirely clear, yet the intensification of lake drainage overlaps with a trend of increased annual ice flow since 2012.
Data availability statement
The dataset for the presented supraglacial lake analysis generated and analyzed for this study is available from The Bolin Centre Database, doi.org/10.17043/otto-2022-supraglacial-lakes-1 . Landsat satellite imagery (earthexplorer.usgs.gov), ERA5 reanalysis data (Hersbach et al., 2019), the MEaSUREs GIMP Digital Elevation Model (DEM) (Howat et al. (2015), (2014)), bed topography data from IceBridge BedMachine (Morlighem et al. (2021); (2017)) as well as mean annual ice velocity maps for the GrIS (NASA MEaSUREs ITS LIVE (Gardner et al., 2021, 2018) are freely available..
Author contributions
JO and NK designed and developed the study. JO analysed the data, and wrote the first draft of the manuscript. JO, NK, and FH discussed and wrote the manuscript.
Funding
JO has been supported by funds from the Bolin Centre for Climate Research at Stockholm University.
Acknowledgments
Financial support from the Bolin Centre for Climate Research at Stockholm University is gratefully acknowledged. We thank the two reviewers and the editor for constructive feedback and comments on the manuscript. JO would like to thank A. Prakash for his help in applying the FASTER algorithm to the Ryder Glacier study area, M. Van Wyk de Vries for his support with the use of the GIV toolbox, and A. Frampton for providing feedback on her MSc thesis (Otto, 2021) from which the work presented here was further developed. We would also like to thank all providers of open source data, see above.
Conflict of interest
The authors declare that the research was conducted in the absence of any commercial or financial relationships that could be construed as a potential conflict of interest.
Publisher’s note
All claims expressed in this article are solely those of the authors and do not necessarily represent those of their affiliated organizations, or those of the publisher, the editors and the reviewers. Any product that may be evaluated in this article, or claim that may be made by its manufacturer, is not guaranteed or endorsed by the publisher.
Supplementary Material
The Supplementary Material for this article can be found online at: https://www.frontiersin.org/articles/10.3389/feart.2022.978137/full#supplementary-material.
References
Ahlstrøm, A. P., Andersen, S. B., Andersen, M. L., Machguth, H., Nick, F. M., Joughin, I., et al. (2013). Seasonal velocities of eight major marine-terminating outlet glaciers of the Greenland ice sheet from continuous in situ GPS instruments. Earth Syst. Sci. Data 5, 277–287. doi:10.5194/essd-5-277-2013
Andrews, L. C., Hoffman, M. J., Neumann, T. A., Catania, G. A., Lüthi, M. P., Hawley, R. L., et al. (2018). Seasonal evolution of the subglacial hydrologic system modified by supraglacial lake drainage in western Greenland. JGR. Earth Surf. 123, 1479–1496. doi:10.1029/2017JF004585
Arnold, N. S., Banwell, A. F., and Willis, I. C. (2014). High-resolution modelling of the seasonal evolution of surface water storage on the Greenland Ice Sheet. Cryosphere 8, 1149–1160. doi:10.5194/tc-8-1149-2014
Bamber, J. L., Westaway, R. M., Marzeion, B., and Wouters, B. (2018). The land ice contribution to sea level during the satellite era. Environ. Res. Lett. 13, 063008. doi:10.1088/1748-9326/aac2f0
Banwell, A. F., Arnold, N. S., Willis, I. C., Tedesco, M., and Ahlstrøm, A. P. (2012). Modeling supraglacial water routing and lake filling on the Greenland Ice Sheet. J. Geophys. Res. 117, F04012. doi:10.1029/2012JF002393
Banwell, A., Hewitt, I., Willis, I., and Arnold, N. (2016). Moulin density controls drainage development beneath the Greenland ice sheet. J. Geophys. Res. Earth Surf. 121, 2248–2269. doi:10.1002/2015JF003801
Barnett, J., Holmes, F., and Kirchner, N. (2022). Modelled dynamic retreat of Kangerlussuaq Glacier, southeast Greenland, strongly influenced by the consecutive absence of an ice mélange in Kangerlussuaq Fjord. J. Glaciol., 1–12. doi:10.1017/jog.2022.70
Benedek, C. L., and Willis, I. C. (2021). Winter drainage of surface lakes on the Greenland Ice Sheet from Sentinel-1 SAR imagery. Cryosphere 15, 1587–1606. doi:10.5194/tc-15-1587-2021
Brown, S., Nicholls, R. J., Goodwin, P., Haigh, I. D., Lincke, D., Vafeidis, A. T., et al. (2018). Quantifying land and people exposed to sea-level rise with No mitigation and 1.5°C and 2.0°C rise in global temperatures to year 2300. Earth's. Future 6, 583–600. doi:10.1002/2017EF000738
Catania, G. A., Neumann, T. A., and Price, S. F. (2008). Characterizing englacial drainage in the ablation zone of the Greenland ice sheet. J. Glaciol. 54, 567–578. doi:10.3189/002214308786570854
Christoffersen, P., Bougamont, M., Hubbard, A., Doyle, S. H., Grigsby, S., and Pettersson, R. (2018). Cascading lake drainage on the Greenland Ice Sheet triggered by tensile shock and fracture. Nat. Commun. 9, 1064. doi:10.1038/s41467-018-03420-8
Clason, C. C., Mair, D. W. F., Nienow, P. W., Bartholomew, I. D., Sole, A., Palmer, S., et al. (2015). Modelling the transfer of supraglacial meltwater to the bed of Leverett Glacier, Southwest Greenland. Cryosphere 9, 123–138. doi:10.5194/tc-9-123-2015
Cooley, S. W., and Christoffersen, P. (2017). Observation bias correction reveals more rapidly draining lakes on the Greenland ice sheet: Bias in rapid lake drainage detections. J. Geophys. Res. Earth Surf. 122, 1867–1881. doi:10.1002/2017JF004255
Das, S. B., Joughin, I., Behn, M. D., Howat, I. M., King, M. A., Lizarralde, D., et al. (2008). Fracture propagation to the base of the greenland ice sheet during supraglacial lake drainage. Science 320, 778–781. doi:10.1126/science.1153360
Davison, B. J., Sole, A. J., Cowton, T. R., Lea, J. M., Slater, D. A., Fahrner, D., et al. (2020). Subglacial drainage evolution modulates seasonal ice flow variability of three tidewater glaciers in southwest Greenland. J. Geophys. Res. Earth Surf. 125, 5492. doi:10.1029/2019JF005492
Doyle, S. H., Hubbard, A., Fitzpatrick, A. A. W., van As, D., Mikkelsen, A. B., Pettersson, R., et al. (2014). Persistent flow acceleration within the interior of the Greenland ice sheet. Geophys. Res. Lett. 41, 899–905. doi:10.1002/2013GL058933
Doyle, S. H., Hubbard, A. L., Dow, C. F., Jones, G. A., Fitzpatrick, A., Gusmeroli, A., et al. (2013). Ice tectonic deformation during the rapid in situ drainage of a supraglacial lake on the Greenland Ice Sheet. Cryosphere 7, 129–140. doi:10.5194/tc-7-129-2013
Fitzpatrick, A. A. W., Hubbard, A. L., Box, J. E., Quincey, D. J., van As, D., Mikkelsen, A. P. B., et al. (2014). A decade (2002–2012) of supraglacial lake volume estimates across Russell Glacier, West Greenland. Cryosphere 8, 107–121. doi:10.5194/tc-8-107-2014
Gardner, A. S., Fahnestock, M. A., and Scambos, T. A. (2021). MEaSUREs ITS_LIVE regional glacier and ice sheet surface velocities, Version 1Greenland. Boulder, Colorado USA: NASA National Snow and Ice Data Center Distributed Active Archive Center. doi:10.5067/6II6VW8LLWJ7
Gardner, A. S., Moholdt, G., Scambos, M., Fahnstock, M., Ligtenberg, S., and van den Broeke, M. (2021). Increased West Antarctic and unchanged East Antarctic ice discharge over the last 7 years. The Cryosphere 12 (2), 521–547. doi:10.5194/tc-12-521-2018
Georgiou, S., Shepherd, A., McMillan, M., and Nienow, P. (2009). Seasonal evolution of supraglacial lake volume from ASTER imagery. Ann. Glaciol. 50, 95–100. doi:10.3189/172756409789624328
Hersbach, H., Bell, B., Berrisford, P., Biavati, G., Horányi, A., Muñoz Sabater, J., et al. (2019). “ERA5 monthly averaged data on single levels from 1959 to present,” in Copernicus climate change service (C3S) climate data store (CDS). Accessed March 13, 2021. doi:10.24381/cds.f17050d7
Hewitt, I. (2013). Seasonal changes in ice sheet motion due to melt water lubrication. Earth Planet. Sci. Lett. 371-372, 16–25. doi:10.1016/j.epsl.2013.04.022
Hill, E. A., Carr, J. R., and Stokes, C. R. (2017). A review of recent changes in major marine-terminating outlet glaciers in northern Greenland. Front. Earth Sci. (Lausanne). 4, 111. doi:10.3389/feart.2016.00111
Hoffman, M. J., Andrews, L. C., Price, S. F., Catania, G. A., Neumann, T. A., Lüthi, M. P., et al. (2016). Greenland subglacial drainage evolution regulated by weakly connected regions of the bed. Nat. Commun. 7, 13903. doi:10.1038/ncomms13903
Hoffman, M. J., Catania, G. A., Neumann, T. A., Andrews, L. C., and Rumrill, J. A. (2011). Links between acceleration, melting, and supraglacial lake drainage of the western Greenland Ice Sheet. J. Geophys. Res. 116, F04035. doi:10.1029/2010JF001934
Hoffman, M. J., Perego, M., Andrews, L. C., Price, S. F., Neumann, T. A., Johnson, J. V., et al. (2018). Widespread moulin formation during supraglacial lake drainages in Greenland. Geophys. Res. Lett. 45, 778–788. doi:10.1002/2017GL075659
Holmes, F. A., Kirchner, N., Prakash, A., Stranne, C., Dijkstra, S., and Jakobsson, M. (2021). Calving at Ryder glacier, northern Greenland. J. Geophys. Res. Earth Surf. 126, 5872. doi:10.1029/2020JF005872
Howat, I. M., Box, J. E., Ahn, Y., Herrington, A., and McFadden, E. M. (2010). Seasonal variability in the dynamics of marine-terminating outlet glaciers in Greenland. J. Glaciol. 56, 601–613. doi:10.3189/002214310793146232
Howat, I. M., de la Peña, S., van Angelen, J. H., Lenaerts, J. T. M., and van den Broeke, M. R. (2013). Brief communication: Expansion of meltwater lakes on the Greenland ice sheet. Cryosphere 7, 201–204. doi:10.5194/tc-7-201-2013
Howat, I. M., Negrete, A., and Smith, B. E. (2014). The Greenland Ice Mapping Project (GIMP) land classification and surface elevation data sets. Cryosphere 8, 1509–1518. doi:10.5194/tc-8-1509-2014
Howat, I., Negrete, A., and Smith, B. (2015). Measures Greenland ice mapping Project (GIMP) digital elevation Model, version 1. Boulder, Colorado USA: NASA national snow and ice data center distributed. Active Archive Center. doi:10.5067/NV34YUIXLP9W
Huggel, C., Kääb, A., Haeberli, W., Teysseire, P., and Paul, F. (2002). Remote sensing based assessment of hazards from glacier lake outbursts: A case study in the Swiss alps. Can. Geotech. J. 39, 316–330. doi:10.1139/t01-099
Igneczi, A., Sole, A. J., Livingstone, S. J., Leeson, A. A., Fettweis, X., Selmes, N., et al. (2016). Northeast sector of the Greenland Ice Sheet to undergo the greatest inland expansion of supraglacial lakes during the 21st century: Expansion of Surface Lakes on the GrIS. Geophys. Res. Lett. 43, 9729–9738. doi:10.1002/2016GL070338
Igneczi, A., Sole, A. J., Livingstone, S. J., Ng, F. S. L., and Yang, K. (2018). Greenland ice sheet surface topography and drainage structure controlled by the transfer of basal variability. Front. Earth Sci. (Lausanne). 6, 101. doi:10.3389/feart.2018.00101
IPCC (2007). Climate change 2007: The physical science basis: Contribution of working group I to the fourth assessment report of the intergovernmental panel on climate change. Cambridge ; New York: Cambridge University Press.
IPCC (2019). IPCC special report on the ocean and cryosphere in a changing climate. Editors H.-O. Pörtner, D. C. Roberts, V. Masson-Delmotte, P. Zhai, M. Tignor, E. Poloczanskaet al. (Cambridge, UK and New York, NY, USA: Cambridge University Press). doi:10.1017/9781009157964
Jakobsson, M., Mayer, L. A., Nilsson, J., Stranne, C., Calder, B., O’Regan, M., et al. (2020). Ryder Glacier in northwest Greenland is shielded from warm Atlantic water by a bathymetric sill. Commun. Earth Environ. 1, 45. doi:10.1038/s43247-020-00043-0
Jenson, S. K., and Domingue, J. O. (1988). Extracting topographic structure from digital elevation data for geographic information system Analysis. Photogrammetric Eng. Remote Sens. 54, 1593
Joughin, I., Das, S. B., Flowers, G. E., Behn, M. D., Alley, R. B., King, M. A., et al. (2013). Influence of ice-sheet geometry and supraglacial lakes on seasonal ice-flow variability. Cryosphere 7, 1185–1192. doi:10.5194/tc-7-1185-2013
Joughin, I., Das, S. B., King, M. A., Smith, B. E., Howat, I. M., and Moon, T. (2008). Seasonal speedup along the western flank of the Greenland ice sheet. Science 320, 781–783. doi:10.1126/science.1153288
Joughin, I., Tulaczyk, S., Fahnestock, M., and Kwok, R. (1996). A mini-surge on the Ryder glacier, Greenland, observed by satellite radar interferometry. Science 274, 228–230. doi:10.1126/science.274.5285.228
Karlsson, N. B., Solgaard, A. M., Mankoff, K. D., Gillet-Chaulet, F., MacGregor, J. A., Box, J. E., et al. (2021). A first constraint on basal melt-water production of the Greenland ice sheet. Nat. Commun. 12, 3461. doi:10.1038/s41467-021-23739-z
Koenig, L. S., Lampkin, D. J., Montgomery, L. N., Hamilton, S. L., Turrin, J. B., Joseph, C. A., et al. (2015). Wintertime storage of water in buried supraglacial lakes across the Greenland Ice Sheet. Cryosphere 9, 1333–1342. doi:10.5194/tc-9-1333-2015
Krawczynski, M. J., Behn, M. D., Das, S. B., and Joughin, I. (2009). Constraints on the lake volume required for hydro-fracture through ice sheets. Geophys. Res. Lett. 36, L10501. doi:10.1029/2008GL036765
Lampkin, D. J., Koenig, L., Joseph, C., and Box, J. E. (2020). Investigating controls on the formation and distribution of wintertime storage of water in supraglacial lakes. Front. Earth Sci. (Lausanne). 8, 370. doi:10.3389/feart.2020.00370
Leeson, A. A., Shepherd, A., Briggs, K., Howat, I., Fettweis, X., Morlighem, M., et al. (2015). Supraglacial lakes on the Greenland ice sheet advance inland under warming climate. Nat. Clim. Chang. 5, 51–55. doi:10.1038/nclimate2463
Leeson, A. A., Shepherd, A., Sundal, A. V., Malin Johansson, A., Selmes, N., Briggs, K., et al. (2013). A comparison of supraglacial lake observations derived from MODIS imagery at the western margin of the Greenland ice sheet. J. Glaciol. 59, 1179–1188. doi:10.3189/2013JoG13J064
Liang, Y.-L., Colgan, W., Lv, Q., Steffen, K., Abdalati, W., Stroeve, J., et al. (2012). A decadal investigation of supraglacial lakes in West Greenland using a fully automatic detection and tracking algorithm. Remote Sens. Environ. 123, 127–138. doi:10.1016/j.rse.2012.03.020
Lüthje, M., Pedersen, L., Reeh, N., and Greuell, W. (2006). Modelling the evolution of supraglacial lakes on the west greenland ice-sheet margin. J. Glaciol. 52, 608–618. doi:10.3189/172756506781828386
Macdonald, G. J., Banwell, A. F., and MacAyeal, D. R. (2018). Seasonal evolution of supraglacial lakes on a floating ice tongue, petermann glacier, greenland. Ann. Glaciol. 59, 56–65. doi:10.1017/aog.2018.9
McGrath, D., Colgan, W., Steffen, K., Lauffenburger, P., and Balog, J. (2011). Assessing the summer water budget of a moulin basin in the Sermeq Avannarleq ablation region, Greenland ice sheet. J. Glaciol. 57, 954–964. doi:10.3189/002214311798043735
Miles, K. E., Willis, I. C., Benedek, C. L., Williamson, A. G., and Tedesco, M. (2017). Toward monitoring surface and subsurface lakes on the Greenland ice sheet using sentinel-1 SAR and landsat-8 OLI imagery. Front. Earth Sci. (Lausanne). 5, 58. doi:10.3389/feart.2017.00058
Moon, T. A., Gardner, A. S., Csatho, B., Parmuzin, I., and Fahnestock, M. A. (2020). Rapid reconfiguration of the Greenland ice sheet coastal margin. JGR. Earth Surf. 125, 5585. doi:10.1029/2020JF005585
Moon, T., Joughin, I., Smith, B., van den Broeke, M. R., van de Berg, W. J., Noël, B., et al. (2014). Distinct patterns of seasonal Greenland glacier velocity: Seasonal velocity. Geophys. Res. Lett. 41, 7209–7216. doi:10.1002/2014GL061836
Morlighem, M., Williams, C. N., Rignot, E., An, L., Arndt, J. E., Bamber, J. L., et al. (2017). BedMachine v3: Complete bed topography and ocean bathymetry mapping of Greenland from multibeam echo sounding combined with mass conservation. Geophys. Res. Lett. 44, 11051–11061. doi:10.1002/2017GL074954
Morlighem, M., Williams, C. N., Rignot, E., An, L., Arndt, J. E., Bamber, J. L., et al. (2021). IceBridge BedMachine Greenland, version 4. Boulder, Colorado USA: NASA National Snow and Ice Data Center Distributed Active Archive Center. [Date Accessed: 2021-12-15]. doi:10.5067/VLJ5YXKCNGXO
Morriss, B. F., Hawley, R. L., Chipman, J. W., Andrews, L. C., Catania, G. A., Hoffman, M. J., et al. (2013). A ten-year record of supraglacial lake evolution and rapid drainage in West Greenland using an automated processing algorithm for multispectral imagery. Cryosphere 7, 1869–1877. doi:10.5194/tc-7-1869-2013
Mouginot, J., Rignot, E., Bjørk, A. A., van den Broeke, M., Millan, R., Morlighem, M., et al. (2019). Forty-six years of greenland ice sheet mass balance from 1972 to 2018. Proc. Natl. Acad. Sci. U. S. A. 116, 9239–9244. doi:10.1073/pnas.1904242116
Mouginot, J., Rignot, E., Scheuchl, B., Fenty, I., Khazendar, A., Morlighem, M., et al. (2015). Fast retreat of zachariæ Isstrøm, northeast Greenland. Science 350, 1357–1361. doi:10.1126/science.aac7111
Neckel, N., Zeising, O., Steinhage, D., Helm, V., and Humbert, A. (2020). Seasonal observations at 79°N glacier (Greenland) from remote sensing and in situ measurements. Front. Earth Sci. (Lausanne). 8, 142. doi:10.3389/feart.2020.00142
Nick, F., Luckman, A., Vieli, A., Van Der Veen, C., Van As, D., Van De Wal, R., et al. (2012). The response of Petermann Glacier, Greenland, to large calving events, and its future stability in the context of atmospheric and oceanic warming. J. Glaciol. 58, 229–239. doi:10.3189/2012JoG11J242
Otto, J. (2021). Recent changes in supraglacial lake distribution and its impact on glacier dynamics, Ryder Glacier, Northern Greenland. Master thesis. Sweden: Stockholm University.
Pitcher, L. H., Smith, L. C., Gleason, C. J., Miège, C., Ryan, J. C., Hagedorn, B., et al. (2020). Direct observation of winter meltwater drainage from the Greenland ice sheet. Geophys. Res. Lett. 47, 86521. doi:10.1029/2019GL086521
Poinar, K., Joughin, I., Das, S. B., Behn, M. D., Lenaerts, J. T. M., and Broeke, M. R. (2015). Limits to future expansion of surface-melt-enhanced ice flow into the interior of western greenland. Geophys. Res. Lett. 42, 1800–1807. doi:10.1002/2015GL063192
Pope, A., Scambos, T. A., Moussavi, M., Tedesco, M., Willis, M., Shean, D., et al. (2016). Estimating supraglacial lake depth in West Greenland using Landsat 8 and comparison with other multispectral methods. Cryosphere 10, 15–27. doi:10.5194/tc-10-15-2016
Rignot, E., Gogineni, S., Joughin, I., and Krabill, W. (2001). Contribution to the glaciology of northern Greenland from satellite radar interferometry. J. Geophys. Res. 106, 34007–34019. doi:10.1029/2001JD900071
Schoof, C. (2010). Ice-sheet acceleration driven by melt supply variability. Nature 468, 803–806. doi:10.1038/nature09618
Schröder, L., Neckel, N., Zindler, R., and Humbert, A. (2020). Perennial supraglacial lakes in northeast Greenland observed by polarimetric SAR. Remote Sens. 12, 2798. doi:10.3390/rs12172798
The IMBIE Team Shepherd, A., Ivins, E., et al. (2020). Mass balance of the Greenland ice sheet from 1992 to 2018. Nature 579, 233–239. doi:10.1038/s41586-019-1855-2
Smith, L. C., Chu, V. W., Yang, K., Gleason, C. J., Pitcher, L. H., Rennermalm, A. K., et al. (2015). Efficient meltwater drainage through supraglacial streams and rivers on the southwest Greenland ice sheet. Proc. Natl. Acad. Sci. U. S. A. 112, 1001–1006. doi:10.1073/pnas.1413024112
Sneed, W. A., and Hamilton, G. S. (2007). Evolution of melt pond volume on the surface of the Greenland Ice Sheet. Geophys. Res. Lett. 34, L03501. doi:10.1029/2006GL028697
Sole, A. J., Mair, D. W. F., Nienow, P. W., Bartholomew, I. D., King, M. A., Burke, M. J., et al. (2011). Seasonal speedup of a Greenland marine-terminating outlet glacier forced by surface melt–induced changes in subglacial hydrology. J. Geophys. Res. 116, F03014. doi:10.1029/2010JF001948
Sole, A., Nienow, P., Bartholomew, I., Mair, D., Cowton, T., Tedstone, A., et al. (2013). Winter motion mediates dynamic response of the greenland ice sheet to warmer summers. Geophys. Res. Lett. 40, 3940–3944. doi:10.1002/grl.50764
Stevens, L. A., Behn, M. D., McGuire, J. J., Das, S. B., Joughin, I., Herring, T., et al. (2015). Greenland supraglacial lake drainages triggered by hydrologically induced basal slip. Nature 522, 73–76. doi:10.1038/nature14480
Sundal, A., Shepherd, A., Nienow, P., Hanna, E., Palmer, S., and Huybrechts, P. (2009). Evolution of supra-glacial lakes across the greenland ice sheet. Remote Sens. Environ. 113, 2164–2171. doi:10.1016/j.rse.2009.05.018
Tarboton, D. G., Bras, R. L., and Rodriguez-Iturbe, I. (1991). On the extraction of channel networks from digital elevation data. Hydrol. Process. 5, 81–100. doi:10.1002/hyp.3360050107
Tedesco, M., Willis, I. C., Hoffman, M. J., Banwell, A. F., Alexander, P., and Arnold, N. S. (2013). Ice dynamic response to two modes of surface lake drainage on the Greenland ice sheet. Environ. Res. Lett. 8, 034007. doi:10.1088/1748-9326/8/3/034007
USGS (2001). The universal transverse mercator (UTM) grid. Fact sheet 077-01. Reston/Virginia: United States geological Survey. Tech. Rep.
van de Wal, R. S. W., Boot, W., van den Broeke, M. R., Smeets, C. J. P. P., Reijmer, C. H., Donker, J. J. A., et al. (2008). Large and rapid melt-induced velocity changes in the ablation zone of the greenland ice sheet. Science 321, 111–113. doi:10.1126/science.1158540
van de Wal, R. S. W., Smeets, C. J. P. P., Boot, W., Stoffelen, M., van Kampen, R., Doyle, S. H., et al. (2015). Self-regulation of ice flow varies across the ablation area in south-west greenland. Cryosphere 9, 603–611. doi:10.5194/tc-9-603-2015
Van Wyk de Vries, M., and Wickert, A. D. (2021). Glacier Image Velocimetry: An open-source toolbox for easy and rapid calculation of high-resolution glacier velocity fields. Cryosphere 15, 2115–2132. doi:10.5194/tc-15-2115-2021
Vijay, S., Khan, S. A., Kusk, A., Solgaard, A. M., Moon, T., and Bjørk, A. A. (2019). Resolving seasonal ice velocity of 45 Greenlandic glaciers with very high temporal details. Geophys. Res. Lett. 46, 1485–1495. doi:10.1029/2018GL081503
Williamson, A. G., Arnold, N. S., Banwell, A. F., and Willis, I. C. (2017). A Fully Automated Supraglacial lake area and volume Tracking (“FAST”) algorithm: Development and application using MODIS imagery of West Greenland. Remote Sens. Environ. 196, 113–133. doi:10.1016/j.rse.2017.04.032
Williamson, A. G., Banwell, A. F., Willis, I. C., and Arnold, N. S. (2018a). Dual-satellite (Sentinel-2 and Landsat 8) remote sensing of supraglacial lakes in Greenland. Cryosphere 12, 3045–3065. doi:10.5194/tc-12-3045-2018
Williamson, A. G., Willis, I. C., Arnold, N. S., and Banwell, A. F. (2018b). Controls on rapid Supraglacial lake drainage in west Greenland: An exploratory data analysis approach. J. Glaciol. 64, 208–226. doi:10.1017/jog.2018.8
Wilson, N., Straneo, F., and Heimbach, P. (2017). Satellite-derived submarine melt rates and mass balance (2011–2015) for Greenland’s largest remaining ice tongues. Cryosphere 10, 2773–2782. doi:10.5194/tc-11-2773-2017
Yang, K., Smith, L. C., Cooper, M. G., Pitcher, L. H., van As, D., Lu, Y., et al. (2021). Seasonal evolution of supraglacial lakes and rivers on the southwest greenland ice sheet. J. Glaciol. 67, 1–11. doi:10.1017/jog.2021.10
Yang, K., and Smith, L. C. (2016). Internally drained catchments dominate supraglacial hydrology of the southwest greenland ice sheet: Greenland internally drained catchment. J. Geophys. Res. Earth Surf. 121, 1891–1910. doi:10.1002/2016JF003927
Keywords: Greenland Ice Sheet, supraglacial lakes, lake drainage, lake expansion, glacier hydrology, subglacial drainage system
Citation: Otto J, Holmes FA and Kirchner N (2022) Supraglacial lake expansion, intensified lake drainage frequency, and first observation of coupled lake drainage, during 1985–2020 at Ryder Glacier, Northern Greenland. Front. Earth Sci. 10:978137. doi: 10.3389/feart.2022.978137
Received: 25 June 2022; Accepted: 20 September 2022;
Published: 05 October 2022.
Edited by:
Marco Tedesco, Columbia University, United StatesReviewed by:
Kang Yang, Nanjing University, ChinaBenjamin Smith, University of Washington, United States
Copyright © 2022 Otto, Holmes and Kirchner. This is an open-access article distributed under the terms of the Creative Commons Attribution License (CC BY). The use, distribution or reproduction in other forums is permitted, provided the original author(s) and the copyright owner(s) are credited and that the original publication in this journal is cited, in accordance with accepted academic practice. No use, distribution or reproduction is permitted which does not comply with these terms.
*Correspondence: Nina Kirchner, bmluYS5raXJjaG5lckBuYXRnZW8uc3Uuc2U=