 Yuping Yang
 Meng Liu1
 Jingping Xu
94% of researchers rate our articles as excellent or good
Learn more about the work of our research integrity team to safeguard the quality of each article we publish.
Find out more
ORIGINAL RESEARCH article
Front. Earth Sci., 09 September 2022
Sec. Geohazards and Georisks
Volume 10 - 2022 | https://doi.org/10.3389/feart.2022.975220
This article is part of the Research TopicSediment Dynamics and Geohazards in Estuaries and DeltasView all 14 articles
Sandwaves, a ubiquitous bedform commonly found in most coastal seas and sometimes in deep waters of continental slopes and submarine canyons, are often the subject of marine hazard studies because their frequent migration can pose potential threats to pipelines or other engineering structures in the ocean. Analyses of high-resolution bathymetric data collected along a 136-km multibeam bathymetric survey line demonstrate the co-existence of three different sizes of sandwaves: giant, primary dunes (∼10-15 m in height, up to 2,000 m in length); small, secondary sandwaves (∼1 m in height, ∼50 m in length) riding on the stoss side of the primary dunes; and mid-size dunes (∼5-10 m in height, ∼100-500 m in length) found in the trough of primary dunes. While the tidal current-driven, secondary sandwaves are migrating, the primary and mid-size dunes are immobile. Empirical model results suggest that the primary dunes are relict dunes that were most likely formed in geologic past when sea level was higher or the seabed elevation was lower, but water depth is probably not the only factor in limiting the formation of the primary dunes.
Sandwaves, also known as dunes, are both a sediment transport mechanism and a dynamic morphologic feature in subaqueous environments that are commonly found in submarine canyons and continental shelves around the world (Flemming, 1980; Ashley, 1990; Wynn and Stow, 2002). The rhythmic bed forms develop because of seabed deformation in response to various dynamic forces, such as tidal currents (Off, 1963; Stride et al., 1982; Amos and King, 1984; Besio et al., 2004) or storm waves (Bao et al., 2020). The size, shape, and distribution of sandwaves are determined by factors such as topography, sediment grain size, sediment supply, as well as global variations in climate and sea level (Rubin and McCulloch, 1980; Viana et al., 1998; Francken et al., 2004; Bartholdy et al., 2005). Kubo et al. (2004) and other researchers also pointed out that local topographic constraints (i.e., narrow channels and depressions) play a key role in accelerating bottom currents that promote the formation of giant sandwaves (Barrie et al., 2009; Rovere et al., 2019). Migrating giant sandwaves often become potential hazards to coastal engineering structures: destabilizing underwater drilling platforms, causing pipeline overhang and even creating fractures (Belde et al., 2017). Sandwave mobility (e.g., Ferret et al., 2010; Damen et al., 2018) or sediment transport (Dalrymple, 1984; Vandenberg, 1987; Hoekstra et al., 2004; Xu et al., 2008) are typically the focus of studies on sandwave migrations. The direction of sandwave migration can be determined by the geometrical asymmetry of sandwaves that normally have a steeper, shorter lee side (downstream) and a gentler, longer stoss side (upstream) (McCave, 1971; Bartholdy et al., 2002; Wynn and Stow, 2002; Zhou et al., 2018). The degree of sandwave asymmetry can be parameterized to help estimate the migration direction and rates (Knaapen, 2005; Xu et al., 2008). Observational studies indicate that giant sandwaves migrate slower than smaller ones because more sediment must be mobilized in larger sandwaves (i.e., Whitmeyer and FitzGerald, 2008). In addition, details of small scale, high resolution investigations (e.g., the relations between waves and wave-generated sand ripples and their migrations) have been obtained by video imaging analyses as well as numerical and physical modeling techniques (Xu, 2005; Li et al., 2011).
Since the first report of the phenomenon in the 1970s (Boggs, 1974), sandwaves have been intensively studied in the Taiwan Shoal, especially over the past 20 years (Cai et al., 2003; Kai-guo et al., 2009; Bao et al., 2014; Zhou et al., 2018; Zhou et al., 2020; Zhou et al., 2022). Synthetic-aperture radar (SAR) imagery provided a regional glimpse of the size and orientation of sandwaves in the Taiwan Shoal, with sandwave lengths between 500-5,000 m and heights between 2-6 m respectively (Huang et al., 2008). High-resolution multibeam images have enabled scientists to catalogue the various morphological types of sandwaves: giant sandwaves of ∼1,200 m in length and ∼15 m in height and small sandwaves of ∼50 m in length and ∼1.5 m in height (Zhou et al., 2018; Zhou et al., 2020). Hydrodynamic measurements, such as the acoustic Doppler current profiler (ADCP), have helped to establish empirical relationships between wave/current forces and the size/migration rate of sandwaves (Zhou et al., 2018; Bao et al., 2020). For reasons that are not specified in the literature, all previous multibeam surveys were collected along track lines (NW-SE) in small oblique angles to the dominant orientation of the sandwave crests. The cross-section bathymetric profile of sandwaves is the most important parameter in characterizing the static shape as well as the dynamic migration and transport of sandwaves. As a result, multibeam data from track lines that is perpendicular to the overall crest orientation would clearly be more ideal.
This study analyzes a dataset from a high-resolution multibeam survey collected on a research vessel heading southwest across the Taiwan Shoal, a track line that is almost perpendicular to the crest of the sandwaves. This allows us to more accurately 1) characterize the geometries and migration patterns of the sandwaves, 2) estimate the developmental conditions (for example, the flow velocity and water depth) of those sandwaves of different shapes and sizes.
Taiwan Strait is a narrow channel between the southeastern portion of mainland China and the island of Taiwan. The strait has an average width of 180 km, an average length of 360 km, and an average water depth of 60 m (Hu et al., 2013; Shen et al., 2021). The Taiwan Shoal (Figure 1) is an area of ∼13,000 km2 at the southwest corner of the strait, where average water depth is only 20 m (Zhou et al., 2018). Influenced by East Asian monsoons, the average wave height in the strait is about 2 m with a period of 4-5 s in winter, but only 1-1.25 m with a period of 4-5 s in summer (Zhou et al., 2020). When typhoons and tropical storms, which on average, occur six times a year, pass through the strait, wave heights can reach as high as 6 m (Zhou et al., 2020; Zhou et al., 2022). Tides in the strait are dominated by the semidiurnal M2, with an average current speed of about 0.46 m/s (Wang et al., 2003; Du et al., 2010; Zhou et al., 2018). The East Guangdong Coastal Current primarily occurs in summer and flows northeast along the coast at an average speed of 0.20-0.75 m/s. The Fujian-Zhejiang Coastal Current occurs mainly in winter and flows southwest at an average speed of 0.15-0.25 m/s (Hong et al., 2009; Zhou et al., 2022). The shoal, especially the sandwave field, is composed of well sorted, rounded medium-coarse sands of mean grain size of 0.50 ∼ 0.58 mm (Zhou et al., 2020). Borehole data suggests that the deposits of the giant sandwaves are relics from the Pleistocene and early Holocene (Wang et al., 2014) that consist of a great number of shell fragments, beach rock masses, and basalt gravels (Cai et al., 2003). Based on the orientation changing limit (OCL) of the sandwave field, Zhou et al. (2018) divided the Taiwan Shoal into two subareas (Figure 1): the north subarea in which sandwaves are primarily oriented NW-SE and the south subarea where the orientation is mainly W–E and NE–SW.
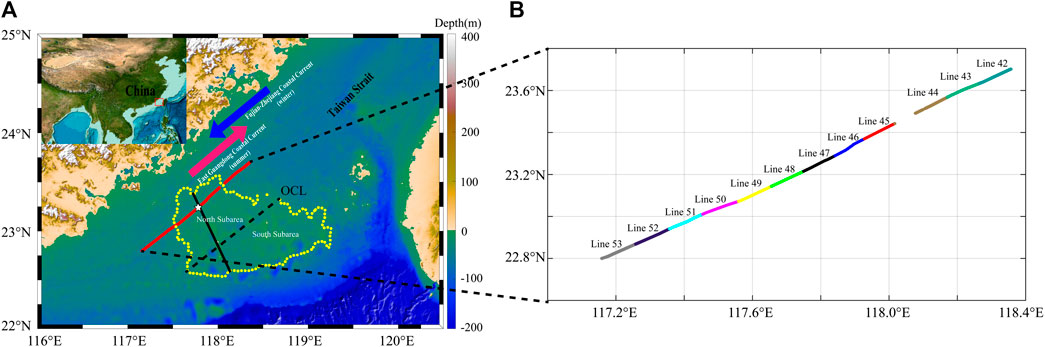
FIGURE 1. (A) A regional map showing the Taiwan Shoal (yellow dotted line), the two main coastal currents in the strait (thick red and blue arrows), the vessel’s path (red solid line, heading southwest), Zhou et al., 2018’s multibeam survey track (solid black line) and their arbitrary Orientation Changing Limit (dashed black line). The white pentagram at the crossing (117.7757°E 23.2510°N) for the two survey lines is the location whose current velocity and direction data were used in the numerical modelling. (B) Close up of the multibeam survey data in this study. For the ease of plotting and presentations, the track line is divided into 12 sections, Line 42-53.
The high-resolution multibeam data used in this study was collected by a ship of opportunity, the R/V Shenhaiyihao, which happened to pass through the Taiwan Shoal on her way to another field experiment site in the South China Sea. For nearly 5.5 h on 30th September 2020, this vessel travelled at a speed of 13 knots heading southwest (Figure 1). The multibeam bathymetric data was acquired using the EM 712 multibeam echo sounder (MBES) with a maximum of 1,600 soundings being conducted per ping over a swath width of 140 and in a range of 40–100 kHz, which allowed a maximum speed of 14 knots to measure profiles of the dunes. The system can accommodate an acquisition depth between 3–3,500 m below its transducers, depending on the array size.
The raw multibeam bathymetric data was first processed using sound velocity calibration, tide correction, data cleaning, and data quality control via the Qimera software (version 1.0.4.93). A Digital Bathymetric Model (DBM) with along-track resolution of 1.2 m in horizontal and 1 cm in depth, both maximum possible for a cruising speed of 13 knots, was constructed. The 136 km long, 150-200 m wide swath of sandwaves bathymetry were divided into a dozen 12 km sections (Lines 42–53) to facilitate the ensuring data analyses. One key different between the multibeam data from previous studies and this one is the orientation of the track lines. Track lines perpendicular to the crest of the sandwaves have clear advantages in more accurately measuring the bedform parameters such as periods and heights.
High-resolution DBM revealed the details of the morphological variation along the 136-km track line across the Taiwan Shoal (Figure 2). Based on the wave height and length, the recorded sandwaves are arbitrarily divided into three classes: The giant sandwaves of 10 m high and 1,000 m long are hereafter called primary dunes. The much smaller sandwaves of ∼1 m high and <100 m long are called secondary sandwaves. Anything in between are hereafter called midsize dunes. Figure 2 clearly shows that primary dunes first appear in Line 44, and gradually change from single crest to double-crest in Line 45-46. Their sizes decrease to midsize dunes in Line47 and continued in Line 48-50 before gradually tapering off in Line 51.

FIGURE 2. The overall morphological characteristics of dunes from the multibeam survey lines. The smaller secondary sandwaves are too small to be clearly identified.
Figure 3 plots the details bathymetrical profiles of several lines. Line 46 (Figure 3A) shows the presence of both the primary dunes and secondary sandwaves. The primary giant dunes are of ∼10-15 m in wave height and up to 2,000 m in wave length. Some of them have the typical double-crest shape described in earlier studies (Zhou et al., 2020). The much smaller secondary sandwaves (∼1 m in height, ∼50 m in length) are found to develop on the stoss side of the primary dunes. The asymmetry of both the primary dunes and secondary sandwaves indicates that both of them were likely formed by flows moving upcoast (against the ship heading).
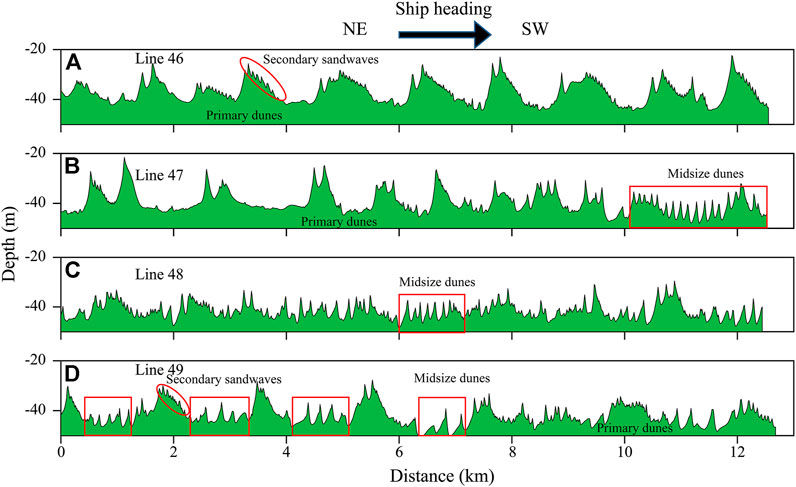
FIGURE 3. The morphological profile of sandwaves in Lines 46, 47, 48, and 49. (A) Line 46 contains mainly the primary (giant) dunes, with secondary (small) sandwaves riding on the stoss side of the primary. (B) Line 47 depicts the transition from primary to the midsize dunes that tend to reside in the troughs of the primary. (C) Line 48 is dominated by the midsize dunes such that primary dunes are hardly identifiable. (D) Line 49 has the primary dunes returned but also clearly shows the midsize dunes in the troughs and the secondary sandwaves on the stoss side of the primary dunes.
The primary dunes’ shape and size changed markedly in Line 47 (Figure 3B), with much longer wave length, less asymmetry, and lack of secondary sandwaves on their stoss side. Near the end of this line, the midsize dunes become more populated, present both in the trough and on the crest of the primary dunes, with 5-10 m height and 150 m wave length.
The dominance of midsize dunes continued in Line 48 (Figure 3C) with dune heights of ∼5-10 m and dune lengths of ∼120 m. The shape of the primary dunes can still be vaguely seen but far less clear than in Line 46 or Line 47. Secondary sandwaves are also seen on the stoss side of a few primary dunes.
Line 49 (Figure 3D) show cases a ‘family portrait’ of the three types of sandwaves, with the midsize dunes in the troughs of the primary dunes and the secondary sandwaves on the stoss side of primary dunes. Here the average wave height and length for the three classes of sandwaves are (12.0 m, 800 m) for the primary dunes, (6.3 m, 290 m) for the midsize dunes, and (1.2 m, 45 m) for the secondary sandwaves.
Table 1 lists the size parameter statistics estimated from the 4 lines in Figure 3. Filters were applied to the raw bathymetric profile data in order to separate the three different sandwave sizes and detailed information about filters is shown in the Table 2. Overall the statistical values in Table 1 are comparable to those in previous studies such as Zhou et al., 2018, 2020. For instance, the size of the primary dune class in this study is equivalent to the Double-crested (Dc-type) and the Single-crested (Sc-type) sandwaves (8-16 m in height, 1,000-2000 m in length) in Zhou et al., 2020. In the small area where the multibeam track lines from this study and Zhou et al., 2020 cross (Figure 1), manually measured sandwave parameters resulted in an average of 14 m in wave height and 510 m in wave length. While the mean wave heights from the two studies are about the same, the wave length in the present study is clearly shorter. This is perhaps, at least in part, due to the fact that the track line in this study is neary at a right angle with the crest lines of the sandwaves. Therefore, the wave length values from the present study is deemed more accurate.
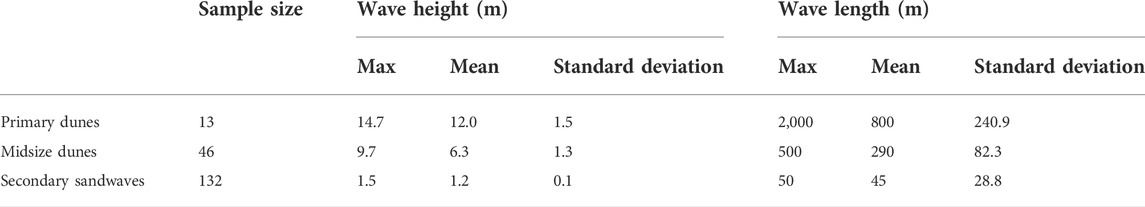
TABLE 1. The statistics of the sandwave parameters.
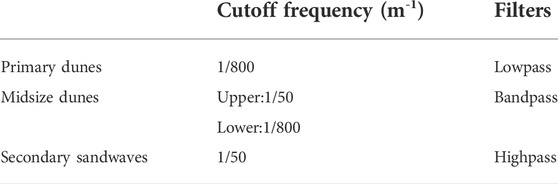
TABLE 2. The detailed information about filters.
The asymmetry of sandwaves profiles can be used to determine their migration direction because sandwaves tend to migrate towards the steeper (lee) side (McCave, 1971; Bartholdy et al., 2002; Zhou et al., 2018). Quantitative methods such as “asymmetry index” (Xu et al., 2008) were used in several studies with favorable results (Zhou et al., 2018). It starts with calculating the first derivative (namely dη/dx, the gradient) (Figure 4B) of the sandwave profiles (Figure 4A). The amplitude n (with signs) and the zero-crossing length l of the dη/dx waveform is then measured (Figure 4C). The “asymmetry index” is the sum of the n/l pairs for each sandwave (Figure 4D). A positive asymmetry index means that the sandwave migrates to the left, and a negative asymmetry index represents migration to the right. This method is used to compute the asymmetry index for all three sandwave classes in Lines 45 to 51 (Figure 5). Here a positive value of the asymmetry index represents upcoast migrating sandwaves (towards the northeast) and vice versa.
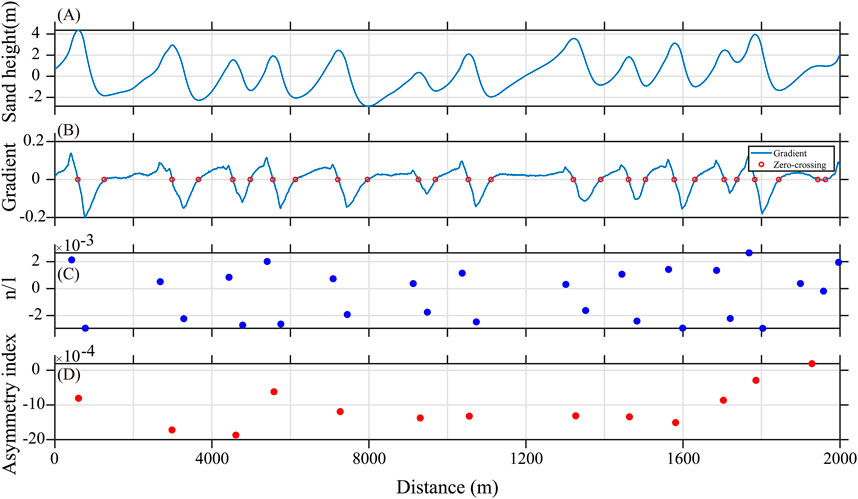
FIGURE 4. Correlation of sandwave migration direction with wave asymmetry. (A) a train of asymmetrical sandwaves from Line50. (B) the first derivative (gradient) of η. (C) the ratio of n/l (height/wavelength). (D) The asymmetry index is the sum of the n/l pair for each individual sandwave. This result (negative index) show that sandwave migrated to the right.
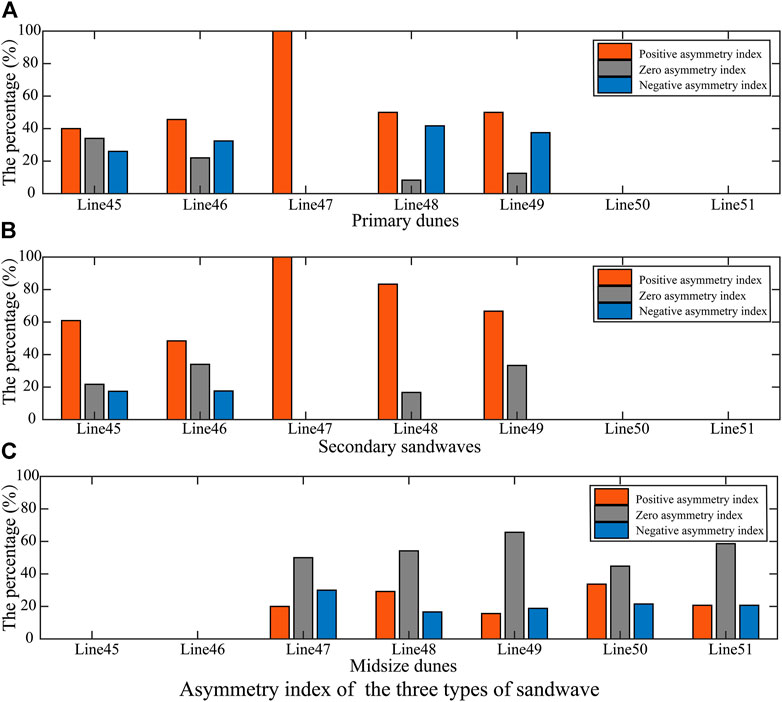
FIGURE 5. Histogram of frequency distribution of the asymmetry index (AI) of (A) primary dunes, (B) secondary sandwaves and (C) midsize dunes on each of the 7 sections of the survey line. The red represents the positive asymmetry index and blue represents the negative asymmetry index. The neutral index, in grey color, is defined as values between
Figure 5 plots the histograms of asymmetry index (AI) for all three classes of sandwaves found in each of the 7 sections (Line 45-51). The neutral index values represent sandwaves of nearly symmetrical, which is defined here to include index values between
The asymmetry statistics appear to correlate well with the line drawings of the bed surface: the primary dunes and secondary sandwaves, mostly observed inside the Taiwan Shoal boundary (Figure 1), showed a tendency of upcoast migration (toward northeast). The midsize dunes in the trough of the primary dunes within the shoal boundary are predominantly neutral, while the midsize dunes outside the shoal (e.g., Line 50) are downcoast-migrating dominant. (Figure 6).
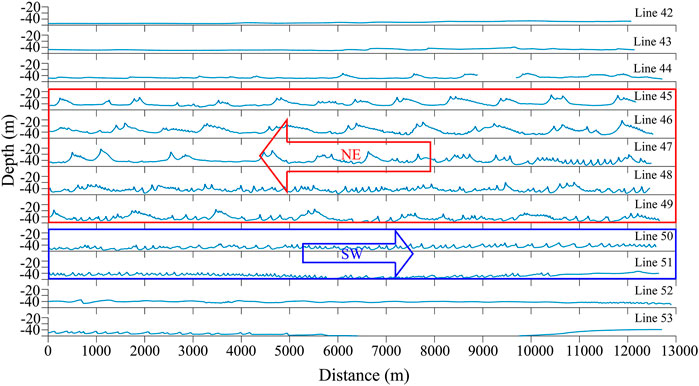
FIGURE 6. Overall sandwave migration patterns from profiles of survey lines. Lines in the red box are sandwaves primarily migrating upcoast (toward northeast); lines in the bule box are midsize sandwave migrating downcoast (toward southwest).
Subaqueous bedforms (ripples, sandwaves and dunes) are generally treated as cyclic depositional and erosional features formed mainly during the bedload transport process that are controlled by flow velocity, grain size, and water depth (Rubin and McCulloch, 1980; Flemming, 2000; Xu et al., 2008). An empirical relationship proposed by Yalin, 1964 is often used to calculate the bedform parameters:
where ŋ is bedform wave height,
The critical shear stress τc for non-viscous particles can be calculated using the empirical formulas (Soulsby, 1997):
where D is grain size diameter, ρ and ρs are respectively the density of water and sand grains, g the acceleration of gravity (9.8 m/s2), and
is the dimensionless grain size. Here ν is the kinematic viscosity of water.
The bed shear stress can be estimated via a simple quadratic equation (e.g., Huntley et al., 1994)
in which ρ (=1,026 kg/m3) is the density of seawater, CD is the drag coefficient with a nominal value 2×10⁻³ (Huntley et al., 1994; Green and McCave, 1995; Xu et al., 2008), and Uc100 is the current speed at 1 m above the seabed. These empirical formulas assume that grains of sand are of uniform size.
Grain size analysis from 98 bed samples collected in Taiwan Shoal showed that the shoal is primarily composed of sand with a median grain size of ∼0.5 mm (Zhou et al., 2020). The critical shear stress τc for this type of sand is ∼2.5 dyne/cm2. Assuming a mean water depth of 45 m and bedform height of 12 m, 5 m, 1 m, for the primary dunes, midsize dunes, and secondary sandwaves respectively, the flow velocity required for the development of the three classes of sandwaves can be estimated (Table 3). For dunes whose height is greater than around 8 m, the quadratic Eq. 5 resulted in velocities of imaginary values, namely, this equation has no solution, indicating that they cannot be formed in water depth of 45 m or less. For the midsize dunes and the secondary sandwaves, the required minimum velocity are about 0.8 and 0.4 m/s, respectively. In fact, we tested using 3 different coefficient parameters for the Yalin equation (Table 4) for sensitivity investigation. With the actual water depth and sandwave height in the Taiwan Shoal, we found that the calculated current velocities from using the different coefficients varied very little (Table 4). Thus, the coefficient of 1/6 for the Yalin equation can effectively calculate the required flow velocity for the development of the observed sandwaves in Taiwan Shoal.
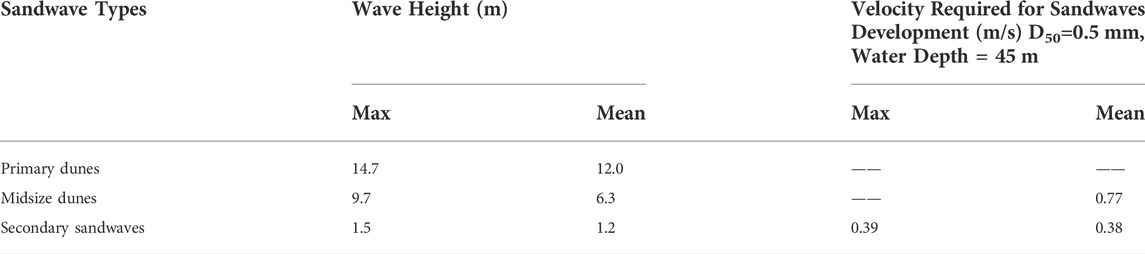
TABLE 3. Estimated flow velocity required for the development of the three sizes of sandwave observed in this study.
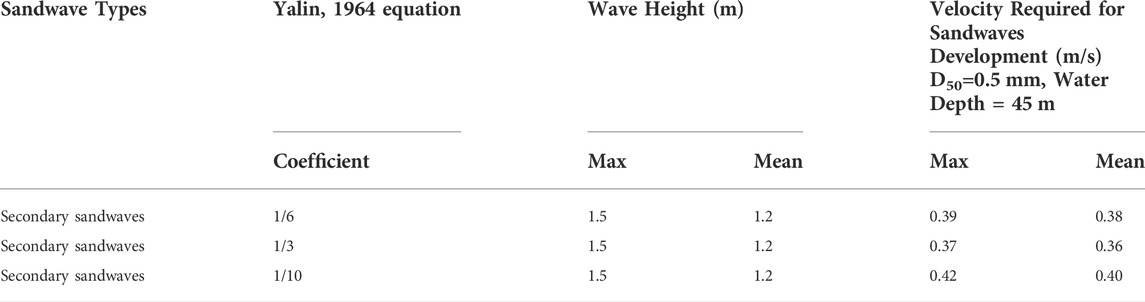
TABLE 4. Different coefficient parameters of the Yalin, 1964 equation to estimated flow velocity required for the development of the secondary sandwaves.
The same equations can also be used to estimate the minimum water depth required for the certain size of dunes to fully develop when the flow velocity is known. For the primary dunes of mean height of 12 m, for example, the minimum water depth for such dunes to form under flow velocity of 1, 2, and 3 m/s are respectively 82, 74, and 73 m. The tidal currents in Taiwan Strait are often greater than 1 m/s (Wang, 2004), especially during typhoons or storms, so the magnitude of flow velocity used in the above estimation is realistic. But the derived water depths are much greater than the current average water depth of the Taiwan Shoal, which is roughly 20 m at present time (Liu et al., 1998; Zhou et al., 2018). We could argue that the primary dunes of this study must have been formed in geologic past when the strait was much deeper, but published literatures showed that the highest sea level in the Holocene (∼7,000 years ago) was only 2-5 meters greater than today’s sea level (Chen and Liu, 1996; Liu et al., 2004). Adding these numbers to the today’s water depth today only comes to less than half of the water depth (∼70 m) required for the primary dunes to form according to the empirical formula. This discrepancy suggests that water depth is perhaps not the most important factor in limiting the formation of those large size primary dunes. Large submarine dunes like those on the Norwegian shelf (up to 4 m in height and 500 m in wavelengths) were formed by wave and current reworking of glacial and glaciomarine deposits during the eustatic sea level rise after the last glaciation (Bøe et al., 2009). Similarly, super large dunes (up to 36 m in height) found on the Irish shelf (Van Landeghem et al., 2009) were also formed on the shelf during the sea level rise (Scourse and Austin, 2002). It was postulated that these large dunes may have developed in marine transgression after the last glacial maximum, i.e., in much shallower water than the water depths of present day, from 80 to 100 m (Van Landeghem et al., 2009) to more than 200 m (Bøe et al., 2009).
Figure 7 shows one of several sections where smaller secondary sandwaves developed on one side of the much larger primary dunes (Figure 7A). According to the arguments in Section 5.1, the hydraulic conditions of present day are not adequate for the development of the primary dunes in the Taiwan Shoal. Because of this, we might also argue, the primary dunes should also be immobile. This is supported by previous studies (Zhou et al., 2022) whose three multibeam surveys revealed very low mobility of the primary dunes (called giant sandwaves in their studies). Those same studies also showed that the smaller secondary sandwaves were very active with much strong mobility. For instance, Ernstsen et al. (2006) showed that superimposed dunes (equivalent to the secondary sandwaves here) migrated 0.51–1.82 m during the tidal cycle. Zhou et al. (2022) showed a longterm average of migration rate of 5 m/year. Because tide is the primary force driving the formation and migration of sandwaves, it is natural to relate the mobility of those secondary sandwaves to tidal currents. Ernstsen et al. (2006) showed that during a tidal cycle, the asymmetry of the sandwaves changes from one tidal phase to the next, while the much larger primary dunes remain unchanged throughout the whole tidal cycle. Asymmetry index (Figure 5) can be used to describe the direction of sandwave migration. The overwhelming positive asymmetry index for the secondary sandwaves are primarily due to the fact that they were in the process of migrating upcoast during the survey when the tidal current was flowing upcoast. For the primary dunes, the value of asymmetry index can only indicate the migration direction at the time of their forming because they are at present immobile. For the same reason, the dominance of “zero asymmetry index” for the mid-size dunes suggest that they are either immobile like the primary dunes, or have a net migration of nearly zero.
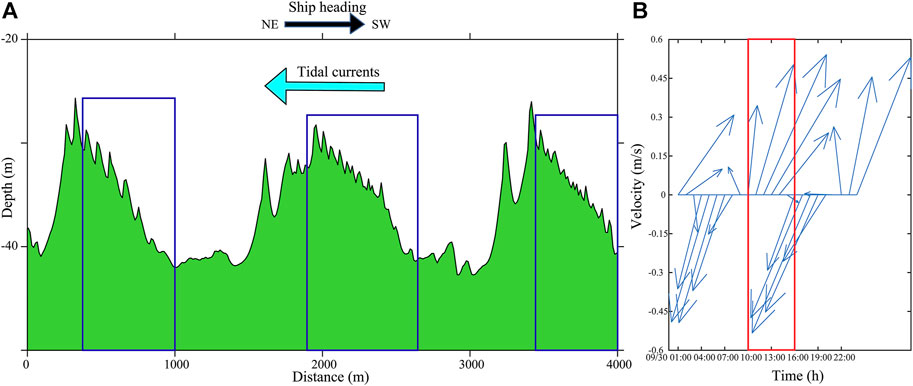
FIGURE 7. (A) A part of the multibeam bathymetric profile of Line 46 depicting the much smaller secondary sandwaves riding on the side of primary dunes. Both the ship heading and the direction of tidal current are also shown. (B) A time-series vector plot of the tidal flow generated using the TPXO data (https://tpxows.azurewebsites.net) for the position shown in Figure 1 (117.7757°E, 23.2510°N). The multibeam survey was collected in the time window (between the two red vertical lines) during which tidal currents flowed toward upcoast (toward northeast).
Today’s hydraulic conditions in the strait can generate those secondary sandwaves (see Table 3), and it is therefore reasonable to state that the secondary sandwaves, such as those shown in Figure 7, change their asymmetry with the reversing tidal currents. A multibeam bathymetric data taken during at least two opposite tidal phases would prove it. Additionally, some erosion on the top of the primary dunes is likely to occur during storm weather (Bao et al., 2020) even though they are generally immobile. Quantification of such changes requires further investigations.
A 136 km swath of high-resolution multibeam bathymetry, collected along a track line nearly perpendicular to the sandwave crests, allowed us to closely examine the dynamic and morphological characteristics of sandwaves in the Taiwan Shoal. The following conclusions have been drawn:
1) Three sizes of sandwaves co-exist on the Taiwan Shoal: primary dunes (∼10-15 m in height, up to 2,000 m in length); small, secondary sandwaves (∼1 m in height, ∼ 50 m in length), and midsize dunes (∼5-10 m in height, ∼100-500 m in length). Small secondary sandwaves often ride on the stoss side of the primary dunes whereas midsize dunes are often in the troughs of primary dunes.
2) Both primary and midsize dunes are probably immobile under present tidal flow conditions, even though asymmetry index suggests that they could have migrated in opposite directions. Multibeam data collected during both flooding and ebbing phases are required to further prove the arguments that the secondary sandwaves’ asymmetry is correlated to tidal currents.
3) The present water depth in Taiwan Shoal is too shallow for the primary dunes to develop. It is likely that these primary dunes were formed in geologic past when sea level was higher or the seabed elevation was lower, but water depth is probably not the only factor in limiting the formation of the primary dunes.
The datasets used in the article would be made accessible by contacting the corresponding author through email and describing the intended purpose of usage.
JX: Conceptualization, Methodology and Reviewing. YY: Conceptualization, Methodology, Analyses, Original draft preparation. ML: Methodology and Analyses. WX: Data collection and curation.
This study was supported by the Key Special Project for Introduced Talents Team of Southern Marine Science and Engineering Guangdong Laboratory (Guangzhou) (GML2019ZD0210) and the National Natural Science Foundation of China (41720104001). We would like to thank everyone who contributed to the field observations in the Taiwan Shoal. We would also like to thank Dr. Simin Gao for editing the English language draft of this manuscript.
The authors declare that the research was conducted in the absence of any commercial or financial relationships that could be construed as a potential conflict of interest.
All claims expressed in this article are solely those of the authors and do not necessarily represent those of their affiliated organizations, or those of the publisher, the editors and the reviewers. Any product that may be evaluated in this article, or claim that may be made by its manufacturer, is not guaranteed or endorsed by the publisher.
Amos, C.L., and King, E.L. (1984). Bedforms of the Canadian eastern seaboard: A comparison with global occurrences. Mar. Geol. 57 (1-4), 167–208. doi:10.1016/0025-3227(84)90199-3
Ashley, G.M. (1990). Classification of large-scale subaqueous bedforms-a new look at an old problem- SEPM Bedforms and Bedding Structure Research Symposium. J. Sediment. Petrology 60 (1), 160–172.
Bao, J.J., Cai, F., Ren, J.Y., Zheng, Y.L., Wu, C.Q., Lu, H.Q., et al. (2014). Morphological characteristics of sand waves in the middle taiwan shoal based on multi-beam data analysis. Acta Geol. Sin. - Engl. Ed. 88 (5), 1499–1512. doi:10.1111/1755-6724.12314
Bao, J.J., Cai, F., Shi, F.Y., Wu, C.Q., Zheng, Y.L., Lu, H.Q., et al. (2020). Morphodynamic response of sand waves in the Taiwan Shoal to a passing tropical storm. Mar. Geol. 426, 106196. doi:10.1016/j.margeo.2020.106196
Barrie, J.V., Conway, K.W., Picard, K., and Greene, H.G. (2009). Large-scale sedimentary bedforms and sediment dynamics on a glaciated tectonic continental shelf: Examples from the Pacific margin of Canada. Cont. Shelf Res. 29 (5-6), 796–806. doi:10.1016/j.csr.2008.12.007
Bartholdy, J., Bartholomae, A., and Flemming, B.W. (2002). Grain-size control of large compound flow-transverse bedforms in a tidal inlet of the Danish Wadden Sea. Mar. Geol. 188 (3-4), 391–413. doi:10.1016/s0025-3227(02)00419-x
Bartholdy, J., Flemming, B.W., Bartholoma, A., and Ernstsen, V.B. (2005). Flow and grain size control of depth-independent simple subaqueous dunes. J. Geophys. Res. 110 (4). doi:10.1029/2004jf000183
Belde, J., Reuning, L., and Back, S. (2017). Bottom currents and sediment waves on a shallow carbonate shelf, Northern Carnarvon Basin, Australia. Cont. Shelf Res. 138, 142–153. doi:10.1016/j.csr.2017.03.007
Besio, G., Blondeaux, P., Brocchini, M., and Vittori, G. (2004). On the modeling of sand wave migration. J. Geophys. Res. 109, C04018. doi:10.1029/2002jc001622
Bøe, R., Bellec, V.K., Dolan, M.F.J., Buhl-Mortensen, P., Buhl-Mortensen, L., Slagstad, D., et al. (2009). Giant sandwaves in the hola glacial trough off vesterålen, north Norway. Mar. Geol. 267 (1-2), 36–54. doi:10.1016/j.margeo.2009.09.008
Boggs, S. (1974). Sand-wave fields in Taiwan Strait. Geol. 2, 251–253. doi:10.1130/0091-7613(1974)2<251:sfits>2.0.co;2
Cai, A.Z., Zhu, Z.N., Li, Y.M., and Cai, Y. (2003). Sedimentary environment in the taiwan shoal. Mar. Georesources Geotechnol. 21 (3-4), 201–211. doi:10.1080/0264041031000071029
Chen, Y.G., and Liu, T.K. (1996). Sea level changes in the last several thousand years, Penghu Islands, Taiwan Strait. Quat. Res. 45 (3), 254–262. doi:10.1006/qres.1996.0026
Dalrymple, R.W. (1984). Morphology and internal structure of sandwaves in the Bay of Fundy. Sedimentology 31 (3), 365–382. doi:10.1111/j.1365-3091.1984.tb00865.x
Damen, J.M., van Dijk, T., and Hulscher, S. (2018). Spatially varying environmental properties controlling observed sand wave morphology. J. Geophys. Res. Earth Surf. 123 (2), 262–280. doi:10.1002/2017jf004322
Du, X.Q., Gao, S., and Li, Y. (2010). Hydrodynamic processes and bedload transport associated with large-scale sandwaves in the Taiwan Strait. J. Coast. Res. 26 (4), 688–698. doi:10.2112/08-1113.1
Ernstsen, V.B., Noormets, R., Winter, C., Hebbeln, D., Bartholomä, A., Flemming, B.W., et al. (2006). Quantification of dune dynamics during a tidal cycle in an inlet channel of the Danish Wadden Sea. Geo-Mar. Lett. 26 (3), 151–163. doi:10.1007/s00367-006-0026-2
Ferret, Y., Le Bot, S., Tessier, B., Garlan, T., and Lafite, R. (2010). Migration and internal architecture of marine dunes in the eastern English channel over 14 and 56 year intervals: The influence of tides and decennial storms. Earth Surf. Process. Landf. 35 (12), 1480–1493. doi:10.1002/esp.2051
Flemming, B.W. (1980). Sand transport and bedform patterns on the continental shelf between Durban and Port Elizabeth (southeast African continental margin). Sediment. Geol. 26 (1-3), 179–205. doi:10.1016/0037-0738(80)90011-1
Flemming, B.W. (2000). “The role of grain size, water depth and flow velocity as scaling factors controlling the size of subaqueous dunes,” in Marine Sandwave Dynamics, January 2000.
Francken, F., Wartel, S., Parker, R., and Taverniers, E. (2004). Factors influencing subaqueous dunes in the Scheldt Estuary. Geo-Marine Lett. 24 (1), 14–21. doi:10.1007/s00367-003-0154-x
Green, M.O., and McCave, I.N. (1995). Seabed drag coefficient under tidal currents in the eastern Irish Sea. J. Geophys. Res. 100 (C8), 16057–16069. doi:10.1029/95jc01381
Hoekstra, P., Bell, P., van Santen, P., Roode, N., Levoy, F., and Whitehouse, R. (2004). Bedform migration and bedload transport on an intertidal shoal. Cont. Shelf Res. 24 (11), 1249–1269. doi:10.1016/j.csr.2004.03.006
Hong, H., Zhang, C., Shang, S., Huang, B., Li, Y., Li, X., et al. (2009). Interannual variability of summer coastal upwelling in the Taiwan Strait. Cont. Shelf Res. 29 (2), 479–484. doi:10.1016/j.csr.2008.11.007
Hu, Y., Chen, J., Xu, J., Wang, L.M., Li, H.D., and Liu, H.S. (2013). Sand wave deposition in the taiwan shoal of China. Acta Oceanol. Sin. 32 (8), 26–34. doi:10.1007/s13131-013-0338-9
Huang, W., Fu, B., Yang, J., Zhang, H., Chen, P., Xiao, Q., et al. (2008). “SAR measurements of the taiwan shoal in China,” in Remote sensing of the ocean, sea ice, and large water regions 2008 (Bellingham, Washington, United States: International Society for Optics and Photonics), 71050O.()
Huntley, D.A., Nicholls, R.J., Liu, C.L., and Dyer, K.R. (1994). Measurements of the semi-diurnal drag coefficient over sand waves. Cont. Shelf Res. 14 (5), 437–456. doi:10.1016/0278-4343(94)90097-3
Kai-guo, F.A.N., Wei-gen, H., Ming-xia, H.E., and Bin, F.U. (2009). A review about shallow sea bottom topography mapping by SAR. Prog. Geophys. 24 (2), 714–720.
Knaapen, M.A.F. (2005). Sandwave migration predictor based on shape information. J. Geophys. Res. 110. doi:10.1029/2004jf000195
Kubo, Y., Soh, W., Machiyama, H., and Tokuyama, H. (2004). Bedforms produced by the kuroshio current passing over the northern izu ridge. Geo-Marine Lett. 24 (1), 1–7. doi:10.1007/s00367-003-0134-1
Li, Y., Lin, M.A., Jiang, W.B., and Fan, F.X. (2011). Process control of the sand wave migration in beibu gulf of the south China sea. J. Hydrodyn. 23 (4), 439–446. doi:10.1016/s1001-6058(10)60134-5
Liu, J.P., Milliman, J.D., Gao, S., and Cheng, P. (2004). Holocene development of the yellow river's subaqueous delta, north yellow sea. Mar. Geol. 209 (1-4), 45–67. doi:10.1016/j.margeo.2004.06.009
Liu, Z.X., Xia, D.X., Berne, S., Wang, K.Y., Marsset, T., Tang, Y.X., et al. (1998). Tidal deposition systems of China's continental shelf, with special reference to the eastern Bohai Sea (vol 145, pg 225, 1998). Mar. Geol. 148 (1-2), 115–115.
McCave, I.N. (1971). Sand waves in the north sea off the coast of holland. Mar. Geol. 10, 199–225. doi:10.1016/0025-3227(71)90063-6
Off, T. (1963). Rhythmic linear sand bodies caused by tidal currents. Am. Assoc. Pet. Geol. Bull. 47 (2), 324–341. doi:10.1306/BC743989-16BE-11D7-8645000102C1865D
Rovere, M., Pellegrini, C., Chiggiato, J., Campiani, E., and Trincardi, F. (2019). Impact of dense bottom water on a continental shelf: An example from the SW Adriatic margin. Mar. Geol. 408, 123–143. doi:10.1016/j.margeo.2018.12.002
Rubin, D.M., and McCulloch, D.S. (1980). Single and superimposed bedforms: A synthesis of san francisco bay and flume observations. Sediment. Geol. 26 (1-3), 207–231. doi:10.1016/0037-0738(80)90012-3
Scourse, J.D., and Austin, W.E.N. (2002). Quaternary shelf sea palaeoceanography: Recent developments in europe. Mar. Geol. 191, 87–94. doi:10.1016/s0025-3227(02)00526-1
Shen, X.T., Jian, X., Li, C., Liu, J.T., Chang, Y.P., Zhang, S., et al. (2021). Submarine topography-related spatial variability of the southern Taiwan Strait sands (East Asia). Mar. Geol. 436, 106495. doi:10.1016/j.margeo.2021.106495
Soulsby, R.L. (1997). The dynamics of marine sands: A manual for practical applications. London: Thomas Thelford.
Stride, A.H., Beldenson, R.H., and Kenyon, N.H. (1982). “Offshore tidal deposits: Sand sheet and sand bank facies,” in Offshore tidal sands processes and deposits (London, United Kingdom: Chapman & Hall), 95–125.
Van Landeghem, K.J.J., Uehara, K., Wheeler, A.J., Mitchell, N.C., and Scourse, J.D. (2009). Post-glacial sediment dynamics in the Irish sea and sediment wave morphology: Datamodel comparisons. Cont. Shelf Res. 29 (14), 1723–1736. doi:10.1016/j.csr.2009.05.014
Vandenberg, J.H. (1987). Bedform migration and bed load transport in some rivers and tidal environments. Sedimentology 34 (4), 681–698. doi:10.1111/j.1365-3091.1987.tb00794.x
Viana, A.R., Faugeres, J.C., and Stow, D.A.V. (1998). Bottom-current-controlled sand deposits - a review of modern shallow- to deep-water environments. Sediment. Geol. 115 (1-4), 53–80. doi:10.1016/s0037-0738(97)00087-0
Wang, L.B., Chen, Z.X., Zhao, J.T., Bai, F.L., Hu, B.Q., et al. (2014). Late Pleistocene and Holocene stratigraphy and paleoenvironmental evolution in the western taiwan shoal. Acta Sedimentol. Sin. (in Chinese). doi:10.14027/j.cnki.cjxb.2014.06.011
Wang, Y.-H. (2004). Analysis of flow at the gate of Taiwan Strait. J. Geophys. Res. 109, C02025. doi:10.1029/2003jc001937
Wang, Y.H., Jan, S., and Wang, D.P. (2003). Transports and tidal current estimates in the Taiwan Strait from shipboard ADCP observations (1999-2001). Estuar. Coast. Shelf Sci. 57 (1-2), 193–199. doi:10.1016/s0272-7714(02)00344-x
Whitmeyer, S.J., and FitzGerald, D.M. (2008). Episodic dynamics of a sand wave field. Mar. Geol. 252 (1-2), 24–37. doi:10.1016/j.margeo.2008.03.009
Wynn, R.B., and Stow, D.A.V. (2002). Classification and characterisation of deep-water sediment waves. Mar. Geol. 192 (1-3), 7–22. doi:10.1016/s0025-3227(02)00547-9
Xu, J.P. (2005). Observations of plan-view sand ripple behavior and spectral wave climate on the inner shelf of San Pedro Bay, California. Cont. Shelf Res. 25 (3), 373–396. doi:10.1016/j.csr.2004.10.004
Xu, J.P., Wong, F.L., Kvitek, R., Smith, D.P., and Paull, C.K. (2008). Sandwave migration in monterey submarine canyon, central California. Mar. Geol. 248 (3-4), 193–212. doi:10.1016/j.margeo.2007.11.005
Yalin, M. S. (1964). Geometrical properties of sand wave. J. Hydr. Div. 90 (5), 105–119. doi:10.1061/jyceaj.0001097
Zhou, J.Q., Wu, Z.Y., Jin, X.L., Zhao, D.N., Cao, Z.Y., and Guan, W.B. (2018). Observations and analysis of giant sand wave fields on the Taiwan Banks, northern South China Sea. Mar. Geol. 406, 132–141. doi:10.1016/j.margeo.2018.09.015
Zhou, J.Q., Wu, Z.Y., Zhao, D.N., Guan, W.B., Cao, Z.Y., and Wang, M.W. (2022). Effect of topographic background on sand wave migration on the eastern Taiwan Banks. Geomorphology 398, 108030. doi:10.1016/j.geomorph.2021.108030
Zhou, J.Q., Wu, Z.Y., Zhao, D.N., Guan, W.B., Zhu, C., and Flemming, B. (2020). Giant sand waves on the Taiwan Banks, southern Taiwan Strait: Distribution, morphometric relationships, and hydrologic influence factors in a tide-dominated environment. Mar. Geol. 427, 106238. doi:10.1016/j.margeo.2020.106238
Keywords: sandwaves, relict dunes, migration, Taiwan shoal, south China sea
Citation: Yang Y, Liu M, Xu J and Xu W (2022) Migrating sandwaves riding on relict dunes of Taiwan shoal, northern South China Sea. Front. Earth Sci. 10:975220. doi: 10.3389/feart.2022.975220
Received: 22 June 2022; Accepted: 26 August 2022;
Published: 09 September 2022.
Edited by:
Xiaolei Liu, Ocean University of China, ChinaReviewed by:
Peter Feldens, Leibniz Institute for Baltic Sea Research (LG), GermanyCopyright © 2022 Yang, Liu, Xu and Xu. This is an open-access article distributed under the terms of the Creative Commons Attribution License (CC BY). The use, distribution or reproduction in other forums is permitted, provided the original author(s) and the copyright owner(s) are credited and that the original publication in this journal is cited, in accordance with accepted academic practice. No use, distribution or reproduction is permitted which does not comply with these terms.
*Correspondence: Jingping Xu, eHVqcEBzdXN0ZWNoLmVkdS5jbg==
Disclaimer: All claims expressed in this article are solely those of the authors and do not necessarily represent those of their affiliated organizations, or those of the publisher, the editors and the reviewers. Any product that may be evaluated in this article or claim that may be made by its manufacturer is not guaranteed or endorsed by the publisher.
Research integrity at Frontiers
Learn more about the work of our research integrity team to safeguard the quality of each article we publish.