 Fei Yu1
 Shanxiong Chen
 Zhangjun Dai
- 1State Key Laboratory of Geomechanics and Geotechnical Engineering, Institute of Rock and Soil Mechanics, Chinese Academy of Sciences, Wuhan, China
- 2University of Chinese Academy of Sciences, Beijing, China
- 3School of Urban Construction, Wuhan University of Science and Technology, Wuhan, China
Repeated swelling-shrinking behaviors of red-bed mudstone poses a potential threat to high-speed railways. Through swelling test and dry-wet cycle test, the deformation law of mudstone samples was discussed. Using X-ray CT scanning, MIP and BET technology, the inner relationship between deformation and structural characteristics were clarified. The results showed that the surface of sample was chipped and peeled off after two cycles. During the dehumidification, the mudstone has undergone three stages of shrinkage adjustment, accelerated shrinkage and stable shrinkage. Uneven tensile stress caused by evaporation of water molecules in the initial stage of drying delayed the shrinkage. Initial water content was opposite to the changes of stable strain after water immersion and residual strain after dehydration, while it was positively correlated with environmental temperature. Porosity and connectivity keep increasing with the continuous cycle, and the number appeared to gradually descend from the two ends to the middle in space. Successive drying and wetting promoted a wider range of diameter-length ratio by the swelling of hydrophilic minerals and uneven shrinkage stress. Spatial orientation also transitioned to the polar angle. Specifically, the structure evolved from the layered shape to the tree-like and net-like in order. Microscopic scale mainly included uniform flat pores and wedge-shaped capillary pores, ranging from 10 to 80 Å. The number of cycles didn’t affect the morphology of micropores, but only caused volume and specific surface area to enlarge. The existence of clays generated irreversible deformation of micropores and initiated the gradual extension. This work will provide key data and necessary methods for the geohazard problems.
1 Introduction
The red-bed mudstone generally refers to the red sediments formed from Jurassic to Neogene. Its strength lies between loose and hard rock, widely distributed in southwest, central and southern China (Deng et al., 2016; Liu C. D. et al., 2021; Lyu et al., 2021.). As the typical unfavorable geological body, red-bed soft rock has the characteristics of low strength, strong hydrophilicity, weak capacity to resist weathering and poor water stability. These have resulted in many engineering disasters such as overarching of roadbed (Kong et al., 2017; Jiang et al., 2018), lining cracking and foundation sinking of tunnel (Liu W. et al., 2021; Ming et al., 2016), seriously endangering the lives and property safety of surrounding people as well as the stable operation of transportation.
The interaction of solid, liquid and gaseous media in the rock mass essentially determines the complexity of its physical and mechanical properties, but it is generally believed that the interaction between solid and liquid phase is dominant at current stage (Zhang et al., 2017; Song and Wang, 2019). Since the term “water-rock interaction” was first proposed by Soviet scholar named А.М.Овчинников in the 1950s (Shen and Wang, 2002), this topic has gradually become a Frontier direction in the fields of rock engineering and earth sciences. Red-bed mudstone mostly contain hydrophilic clay minerals such as montmorillonite, illite and kaolinite, which have a certain degree of swelling (ISRM 1983; Doostmohammadi et al., 2009). Recently, many scholars have carried out extensive and detailed research on the water-absorbing swelling of soft rock. In terms of factors affecting swelling, Ma et al. (2015) compared the swelling of mudstone in in-situ and laboratory tests under loaded conditions. The effects of water pressure on its swelling and deformation were considered (Ren et al., 2018). Fan et al. (2020) discussed the relationship between saturation and deformation through load and no-load tests. In addition to internal conditions, temperature and humidity have significant effects on the uniaxial mechanical properties (Wang et al., 2019; Zhang et al., 2020a), shear strength (Fu H. et al., 2019), and stress characteristics of crack damage of mudstone (Liu et al., 2020). Fu H. Y. et al. (2019) et al. emphasized that the synergistic effect of temperature and humidity is greater than the effect of independent factors on its mechanical properties. In previous studies, the hygroscopic expansion of mudstones under temperature/humidity has also received some attention (Chugh and Missavage, 1981; Serafeimidis and Anagnostou, 2015), but Yamaguchi et al. (1988) earlier demonstrated that temperature had almost no change to the breaking of soft rock for no moisture migration. Regarding deformation prediction and particle disintegration, researchers combined hydrological surveys, in-situ tests and laboratory experiments to analyze the main causes of subgrade deformation (Jing, 2019). Singh et al. (2005) discussed the disintegration resistance of soft rock based on fuzzy neural network algorithm. Zhong et al. (2019) and Dai et al. (2020) relied on measured data and utilized numerical methods to inversely predict the long-term deformation trend and found the swelling of the red bed has a typical time effect. Furthermore, the disintegration mechanism of swelling rock has been widely discussed in the past decade, focusing on the correlation between swelling and distribution of disintegrating particles (Wu et al., 2010; Zhang et al., 2020a; Zhang et al., 2020b). However, in the process of changes in temperature, rainfall and evaporation on the surface, the rock mass will experience a dynamic cycle of “moisture absorption-dehumidification”. Microstructures and mesoscale deformation parameters may continue to deteriorate (Liu C. D. et al., 2021). In thermomechanical theory, the thermal properties of particles, as well as the energy conversion and dissipation with water, clearly reflect the response of the thermo-hydro-mechanical process. This microstructural inhomogeneity plays an important role in the deformation characteristics at the macroscopic level (Bai et al., 2021; Bai et al., 2022). So far, the microscopic mechanism of red-bed mudstone has been little mentioned, but it is crucial to understand the characteristics and development laws of long-term deformation.
In the current work, the red-bed mudstone in the central region of Sichuan, China was selected as the research object. Firstly, the influence of the state of water immersion and the way of dehumidification on the swelling-shrinking behaviors of mudstone was studied. Then, the dry-wet cycle test was carried out from the macro level and X-ray computed tomography (μ-CT) test was operated from the mesoscale. Finally, combined with microscopic techniques such as mercury intrusion porosimetry (MIP) and low-temperature nitrogen adsorption (BET), the multi-scale deformation law and mechanism of mudstone during wet-dry cycles were illustrated.
2 Experiments
To achieve the research goals, experiments at different scales were carried out in turn, such as swelling test, dry-wet cycle test, μ-CT scanning, MIP and BET measurements. The main processing of the red-bed mudstone samples was shown in Figure 1.
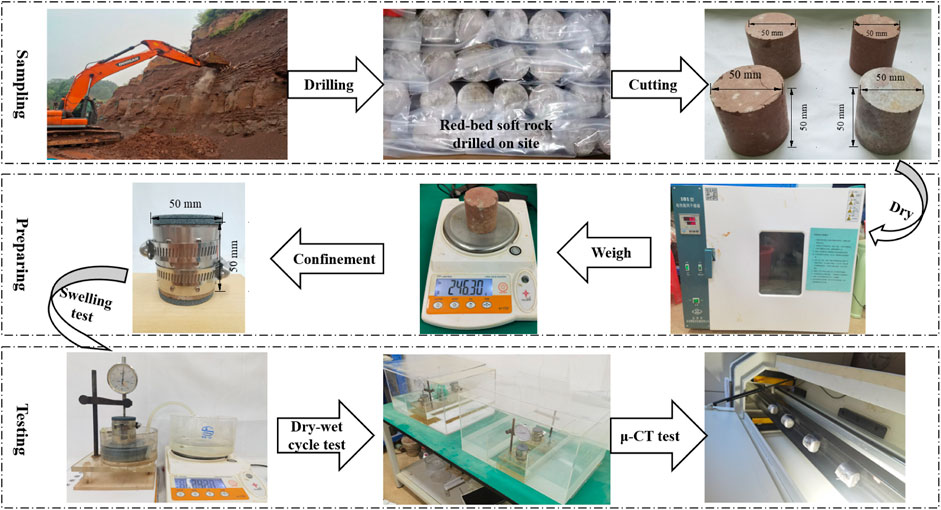
FIGURE 1. The processing of the red-bed mudstone samples.
2.1 Materials and testing procedures
The samples were selected from a mountain excavation site near the Yibin West High-speed Railway Station in Sichuan, China, with a sampling depth of 1.2–3.6 m. By excavation and drilling, the natural red-bed mudstone samples on site were selected and classified. After wrapping the mudstone with plastic film, it was sent back to the laboratory for drilling and cutting. During the cutting process, the parallel error (<0.01 mm) of the two end faces and the diameter error (<0.3 mm) along the height of the specimen should be strictly controlled. As shown in the third figure in Figure 1, a cylindrical sample (50 mm in diameter, 50 mm in height) could be obtained accordingly. To avoid the influence of water on the mechanical properties of mudstone, drilling and polishing were done in anhydrous conditions. In addition, samples with uneven or cracked surfaces were discarded. The remaining samples were subjected to further wave velocity testing and retained samples with similar wave velocities. After the samples were determined, the natural mudstone samples were first dried in an oven at 105 °C for 24 h. Next, the samples were dried and weighed according to the ISRM (ISRM, 1979). Finally, it was sequentially applied in swelling test, wet-dry cycle test and CT test (Figure 1).
In the meantime, basic physical experiments such as water content, particle density and block density have been successively carried out (Figure 2). Specifically, the tests of water content and dry saturated absorbed water ratio referred to “Specification of soil test “SL237-1999 and “Code for Rock Test of Railway Engineering” TB10115-2014. Particle density and block density followed the “ Specification for rock tests in water conservancy and hydroelectric engineering” SL264-2016 for operation. The measured physical parameters were listed in Table 1.
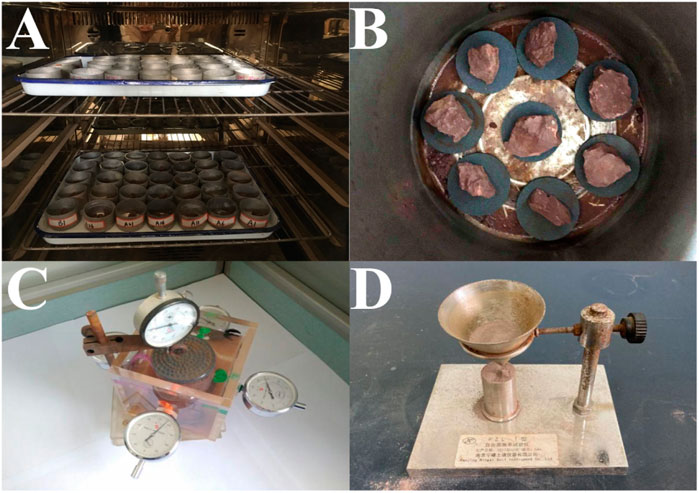
FIGURE 2. Snapshots of basic physical experiments. (A) Water content; (B) Dry saturated absorbed water; (C) Three-directional swelling; and (D) Free swelling of rock powder.
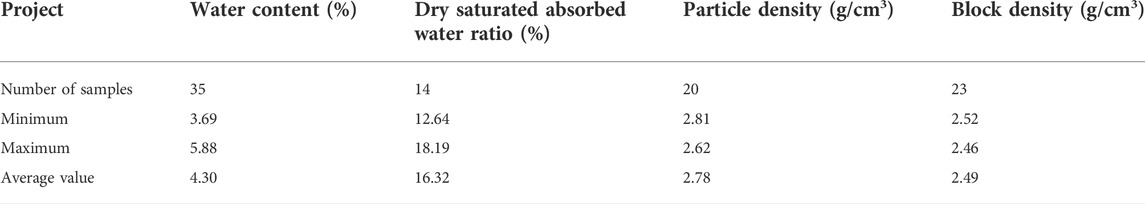
TABLE 1. Basic physical parameters.
To determine the content of various minerals in red-bed mudstone, original samples collected on site were tested by XRD parallel identification. Quantitative content of each mineral was listed in Table 2. Obviously, mudstone contains hydrophilic clay minerals such as montmorillonite (9.83–10.89%), illite (8.95–14.63%) and kaolinite (5.33–6.43%).
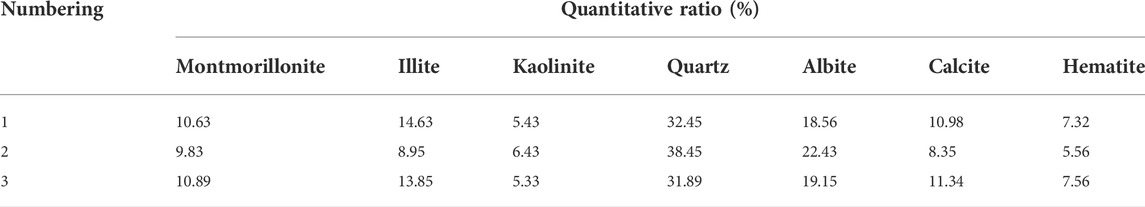
TABLE 2. Mineral composition and quantitative ratio.
2.2 Swelling evaluation
Before the dry-wet cycle test, swelling capacity of samples need to be evaluated. In accordance with the “Suggested Methods for Laboratory Testing of Argillaceous Swelling Rocks” and “Code for Rock Test of Railway Engineering” TB10115-2014, the tests of lateral swelling rate and three-directional swelling rate of rock masse, as well as free swelling ratio of rock powder have been implemented (Figure 2). Free swelling ratio and dry saturated absorbed water ratio were chosen to clarify its swelling abilities. Experimental results showed that average dry saturated absorbed water ratio of 14 groups of undisturbed/original rocks (not disturbed) was 16.32%, which is less than 25%. Under confined conditions, the swelling ratio of 10 groups of samples were all lower than 3%, so it is in the non-expandable interval. Average free swelling ratio of rock powder was 41.21%, belonging to weakly swelling rock in the range of 40–65%. Thus, by following the current evaluation criteria for swelling rocks (Sun et al., 2010; Xun-Guo and Yang, 2009), the selected red-bed mudstone can be preliminarily judged as weak swelling.
2.3 Dry-Wet cycle test
To restore the deformation phenomena of distributed mudstones during dry-wet cycle, standard rock samples (diameter and height of 50 mm) after cutting and polishing were selected to carry out the experiments in an environment with controlled humidity (Figure 3).
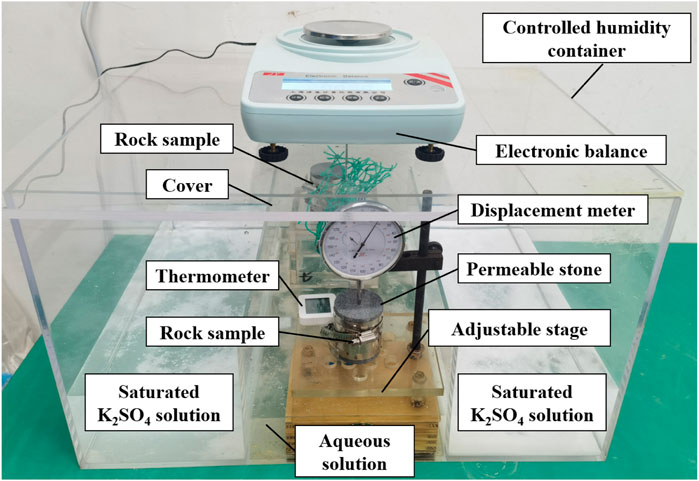
FIGURE 3. Test device for dry-wet deformation of mudstones.
According to the instructions of international organization OIML (Organisation Internationale de Métrologie Légale (OIML), 1996) for saturated solutions and standard relative humidity, K2SO4 was finally selected to configure the standard salt solution by considering its chemical properties, temperature stability and economic efficiency. Figure 3 corresponded to snapshots of the experimental device for dry and wet cycles. The constant humidity container (length, width, and height respectively 500 mm, 500 and 700 mm) was made of polypropylene, which has the advantages of high temperature resistance (<120°C), corrosion resistance and easy cleaning. Related research (Cui 2007) pointed out that distribution of the humidity field inside the container was not uniform, and the humidity near the liquid level was closest to the international standard. To this end, saturated salt solutions were symmetrically placed on both sides of the device to facilitate contact with air and regular replacement. The sample adopted confined conditions and permeable stone was placed on it to ensure that the sample can be in full contact with the surrounding environment. The thermohygrometer was used to monitor the temperature and pressure inside the device in real time (Figure 3).
The test mainly consists of two steps, namely water immersion and dehydration. When the sample was immersed in water, it will slowly drop and begin to swell (Figure 3). The displacement was the stable deformation when displacement meter remains constant. During the dehumidification, adjustable platform will rise to promote the separation of sample from aqueous solution. Electronic balance was utilized to weigh the real-time mass of the sample, thereby calculating the change in its water content.
In this experiment, samples with an initial water content of 3 and 5% were set up to explore the effect of initial water content on the swelling-shrinking behaviors under dry-wet conditions. To figure out whether the way of dehumidification influences its deformation, two ways of “slow dehumidification at room temperature” and “rapid dehumidification in the drying box (60°C)” were studied. In fact, three parallel samples were set for each method. If there are debris peeling off the surface of samples, it will no longer be suitable for cycling, but the subsequent micro-observations should be carried out in time. (Zhang and Gao, 2020)
2.4 μ-CT scanning
With repeated drying and wetting, the structure of mudstones will further deteriorate, but it is difficult to capture them by conventional means (Wang et al., 2020). For this reason, the samples in the wet-dry cycle test were CT-scanned by Zeiss Xradia 410Versa micro-scale CT scanner (Carl Zeiss Management Co., Ltd.) after each cycle.
The specific steps are as follows. Firstly, the rock sample was placed on the bottom of instrument, and the device was controlled by NanovoxelScan software for three-dimensional processing. The main working parameters are as follows: working voltage, current, exposure time, scanning accuracy and time were set to 120 kV, 150 μA, 0.8 s, 0.0278 mm and 40 min, respectively. The VoxelStudio Recon software was operated to reconstruct the samples and export the slice data. Finally, the models were imported into Dragonfly software in turn, followed by the steps of “Data trimming and cropping—
2.5 MIP and BET measurements
To clearly characterize the changes of pores and micro-cracks in mudstones, the distribution of transition pores-macropores (>100 nm) was treated by mercury intrusion according to “Xoaotb decimal pore classification standard”. The nature of micropores (10–100 nm) was acquired by nitrogen adsorption method.
The AutoPore IV 9500 mercury porosimeter and the miromeritics ASAP 2469 automatic specific surface area and pore size analyzer produced by Mike Instruments Inc. were used in MIP and BET experiments, respectively. Since the adsorption medium of the mercury intrusion method is liquid metal mercury, the conductivity of mercury can be used to monitor the changes of electrical signal to obtain pore distribution. For the nitrogen adsorption method, nitrogen with a purity greater than 99.99% is viewed as an adsorbate. Nitrogen adsorption capacity at different equilibrium pressures could be measured under the supercritical conditions (−196°C, 127 kPa). Its surface area and saturated adsorption capacity of single layer will be calculated according to BET equation (Brunauer et al., 1938) :
Among them,
3 Results and discussion
3.1 Deformation of the samples under dry-wet cycles
After the second cycle, there were certain reticulated cracks distributed on the surface of sample. The soft rock with a height of about 10–15 mm from the end of sample has been basically softened. At this time, mudstone won’t be suitable for successive circulation. and the period of dry and wet cycle was determined to be 2 times.
Figure 4A,B plotted the dry-wet curves of mudstone at room temperature (25 ± 2°C). In general, the deformation curve was shaped like an “n” shape. The irreversible dilatancy and the increase of interlayer spacing resulted in the second dry-wet curve being located above the first curve. The samples YS-1 and YS-2 quickly swelled after being immersed in water for the first time and deformation became stable within 100 h. Through the first dehumidification at 91.83 h, the rock mass was out of contact with water and the total duration was about 220 h. In the early stage of dehumidification, the curve exhibited a small swelling. On the one hand, it may be due to the uneven spatial distribution of swelling and shrinking clay minerals contained in the samples. On the other hand, the distribution of the temperature field inside the mudstone may not be uniform (Bai et al., 2021; Bai et al., 2022). In this case, the moisture and stress fields in the porous media changed during the dehumidification process, resulting in uneven shrinkage stress and further crack propagation. Compared with the shrinkage caused by dehumidification, the swelling induced by fissures and microcracks was slightly larger, so the rock mass manifested overall vertical swelling and deterioration. However, as the drying continued, the shrinkage strain gradually increased and stabilized.
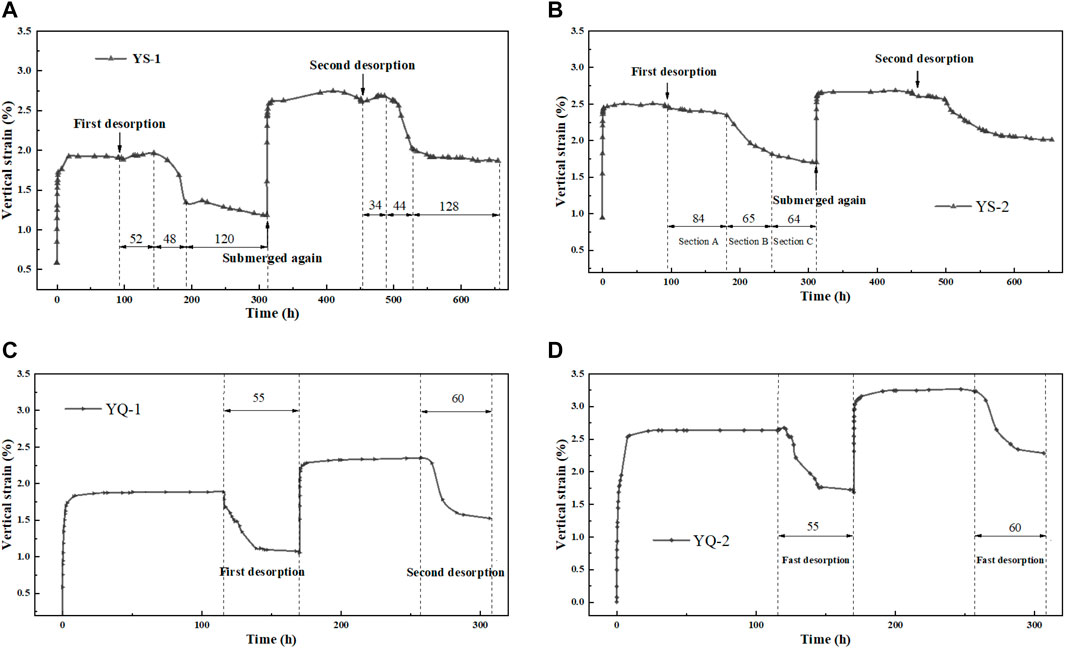
FIGURE 4. Time-effect characteristic curve of dry-wet deformation. (A) Dry at room temperature with initial water content of 5%; (B) Dry at room temperature with initial water content of 3%; (C) Dry in a drying oven at 60 °C with initial water content of 5% and (D) Dry in a drying oven at 60 °C with initial water content of 3%.
Accordingly, the drying curve in Figure 4A∼B can be roughly divided into three stages: the first was the adjustment stage of shrinkage (corresponding to Section A marked in Figure 4A∼B). When the soft rock just begun to dehumidify, its saturated state decreased from the outside to the inside. Because the outer surface dried firstly, so its dehumidified rate will be greater than that of the inside. As the tension cracks created by the evaporation of water molecules delayed the shrinking to a certain extent, the samples may have a small range of swelling. Secondly, the curve will transition to the accelerated shrinkage stage (corresponding to Section B marked in Figure 4A∼B). The main feature was the gradual increase in shrinkage rate. This may be attributed to the fact that the shrinking was controlled by the deformation of inner unwetted rock formation. The minerals inside started to experience drying, prompting the rapid release of originally accumulated shrinkage potential. The third was the stable stage of shrinkage (corresponding to Section C marked in Figure 6A∼B). When the humidity between air and sample was in equilibrium, the dehumidification rate will slow down. After a period, deformation stabilized to 1.18% (Table 5). Fissures were the most prone to losing water as the diffusion path of humidity, but it had little effect on the bound water film between crystal layers of minerals (the matrix suction between micro-scale particles is greater than the macro-scale). The second water immersion started at 312 h, and the stable swelling strain was 2.62%. In contrast, it increased by 36% compared with the first time (Table 5), suggesting that repeated dry-wet processes promote the deterioration of mudstone structures and the release of swelling potential. Through the dry-wet cycles, the fissures kept developing, expanding and penetrating, leading to irreversible deformation. Meanwhile, hydrophilic minerals inside the sample were activated swelled during the second water immersion to be much greater than the first. From the dry-wet curves of two times, it can be found the width of Section A in the second time was significantly reduced, which should be related to the further deterioration of sample.
The curves of samples YS-1 and YS-2 were basically similar, but the swelling strain of the latter after the first wetting was slightly larger than that of the former. This may be because the larger the initial water content, the more thorough the swelling of hydrophilic minerals. The swelling potential of mudstone was relatively small, so the swelling rate was faster. Sample YS-2 also contained three stages, but there were two main differences from sample YS-1. On the one hand, the curve did not present a small rise in the early stage of drying (Section A). This could be due to the large swelling strain of the sample and a high degree of peeling. Consequently, the shrinking due to desorption was greater than the swelling due to crack propagation. On the other hand, the boundary between the accelerated shrinkage stage (Section B) and the stable stage of shrinkage (Section C) was not obvious, implying that the high crack ratio promoted deformation compatibility of inner and outer layers. The residual strain of sample YS-2 after the second dehumidification reached 1.99% (Table 5), which was basically close to the initial water immersion. Above phenomena once again prove that the swelling potential of sample was small, and there were a large number of degraded cracks distributed.
In view of the long duration of dehumidification at room temperature (mostly more than 200 h) and the difficulty of uniform environmental temperature, it is necessary to explore the influence of rapid dehumidification on the shrinkage of rock mass, so as to clarify the development of fissures and microcracks at different drying speeds. To prevent the excessively high temperature from making the rapid rate of water loss, which is not conducive to the timely collection of data, the temperature-controlled ventilated drying box was set to 60°C.
Figure 4C∼D presented the results of rapid dehumidification, which was closer to the standard “n" curve. The swelling process will not be repeated here. From Figure 4C∼D, the first shrinkage strain of samples YQ-1 and YQ-2 was roughly stable at 170.4 h. The entire dehumidified process lasted about 55 h, which was much smaller than the dehumidification at room temperature. For the curve of first rapid dehumidification, the sample had only slight deformation and fluctuations at the beginning and then rapidly shrunk. Compared with Figure 4A∼B, the adjustment stage of shrinkage in Figure 4C∼D was very short, and the stable stage of shrinkage was not significant. When drying reached a certain level, rapid shrinkage occurred. Then the deformation remained unchanged in a balanced humidity state. In contrast, rapid dehumidification was mainly affected by evaporation. The humidity of sample didn’t change much. Its dehumidified rate was fast and constant. Water content and deformation occurred almost simultaneously at this moment, and the curve will directly transition to the rapid shrinkage stage. If it continues, the structure will deteriorate or even be destroyed. The statistical results in Table 3 showed that the ratio of residual strain to stable strain in the first rapid dehumidification curve was 0.56 and 0.65, respectively, which is lower than 0.61 and 0.69 of the dehumidified sample at room temperature. This finding indicated that the shrinking of samples at 60°C were more severe. In addition, the ratio in the second rapid dehumidification curve was 0.65 and 0.70, respectively, which increased by 0.09 and 0.05 compared with initial state. Thus, the fissures and microcracks of rock mass developed steadily and the residual strain rate enhanced. The above results suggested that with the rise of temperature, the time required for mudstone to shrink from the initial deformation to stability was greatly reduced. The residual strain and stable strain also became smaller. More importantly, when the temperature was raised from 30 to 60°C, the delayed shrinkage of the sample in the first dehumidification stage disappeared.
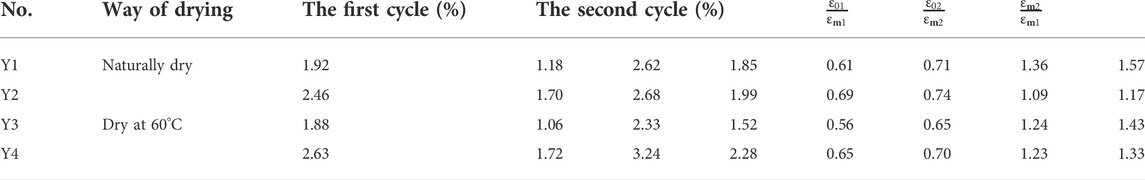
TABLE 3. Statistics of dry-wet deformation.
To sum up, increasing environmental temperature can make the dehumidification of soft rock more thorough, but the impact on final shrinkage is limited. Both above dry-wet tests reflected the evolution of structures in the mudstone. When water content dynamically reached to a certain range, uneven shrinkage stress will be distributed in the sample, so that repeated dry-wet cycles will generate new cracks. The deformation law of water immersion in Figure 4 was almost the same as previous research. Most of them used the stable strain after the first water absorption to evaluate the swelling property of mudstone. The above experiments have demonstrated that not only dehumidification could cause dilatancy, but also water absorption will produce greater swelling. Therefore, it is very problematic to evaluate the swelling potential through single wetting deformation experiment, which may reduce the engineering risk.
3.2 Deteriorating structures
3.2.1 Distribution of fissures and microcracks
Since the upper and lower ends of samples were severely damaged (particle disintegration and fragmentation) after repeated wet-dry cycles, it is necessary to cut the reconstructed rock mass and obtain CT slices of different depths after noise reduction through median filtering. It can be seen intuitively from Figure 5A that the size, shape, position and number of fissures displayed significant differences with the depth of sample and the number of cycles. Affected by seepage, if the slice was closer to the surface, the number and proportion of fissures will be greater. Figure 6 has confirmed this in a quantitative form. There are fissures and microcracks of various sizes and shapes at different vertical depths of rock mass, reflecting its unevenness and anisotropy. Large-scale fissures had obvious directionality, while small-scale microcracks were mostly distributed in irregular lines. The latter mainly branched, expanded and connected on the basis of the former. The porosity in the middle of samples in Figure 6 reached about 4%. The discovery suggested that the pores in the red-bed mudstone occupied a larger proportion of the total volume than the general rock mass, which may be closely connected to the spatial distribution of hydrophilic minerals.
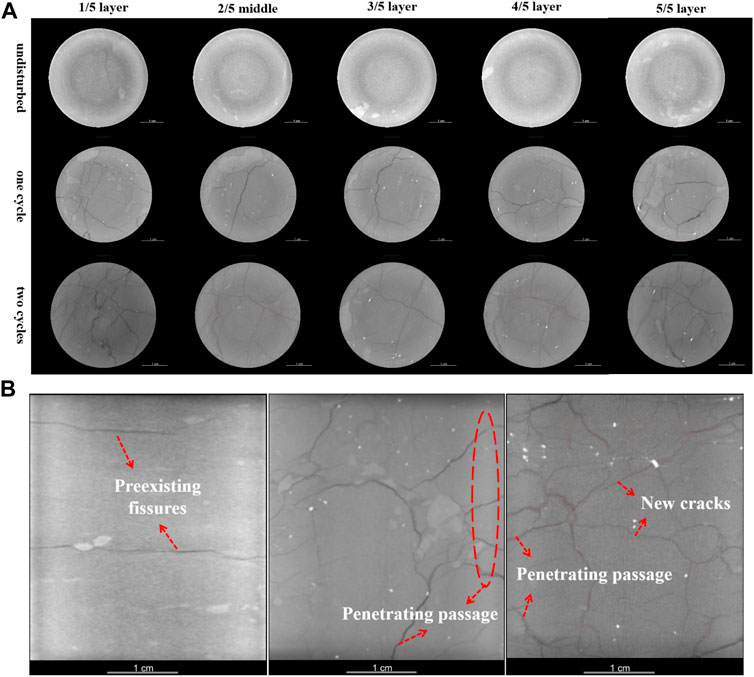
FIGURE 5. Propagation of fissures and microcracks under different dry-wet cycle. (A) At different vertical depths; (B) In the profile (from left to right: original, after one cycle and after two cycles).
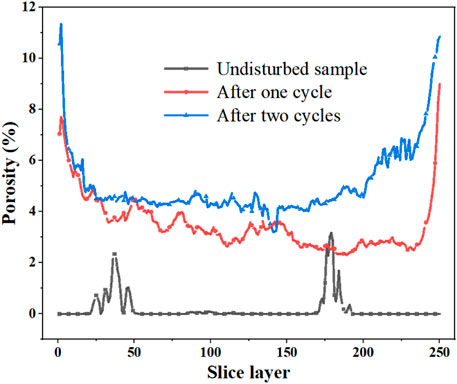
FIGURE 6. Distribution of porosity with vertical slice.
Due to the limitation of test conditions, initial mudstones under different cycles were selected as the parallel samples. Even if there were two cracks in the middle of original sample (Figures 5A,B), it didn’t hinder the discussion of overall law. Longitudinal comparison presented that with the continuation of the dry-wet cycle, the number of cracks and microcracks increased, and the structure changed from “tree-like” to “net-like”. The porosity at the end of samples after 0 cycles, one cycle and two cycles were 0, 8.03 and 10.75%, respectively. At the end of the second cycle, the porosity of the middle section of sample was similar, so the seepage path may be the same. The morphology, position and size of fissures of three middle representative slices in Figure 5A have supported this conjecture. In contrast, there was a certain difference in the development of middle-level cracks when the first dry-wet cycle was completed. Since micro-cracks have not fully expanded at this stage, they displayed anisotropy in space. For Figure 4, the essential difference between the curves under different cycles was manifested in the structural changes in the rock mass aroused by uneven shrinkage stress. After the second cycle, a connected seepage channel has been formed inside the sample.
To figure out the influence of dry-wet cycle on seepage path, CT profiles were taken separately (Figure 5B). Except for the original cracks (Figure 5B), multiple fissures appeared on the surface of mudstone. For expansive clay minerals, uneven swelling stress produced tension in the cracks and the inward migration of water made the gap between crystal layers to expand. During the dehumidification, water molecules continuously evaporated and shrinking stress occurred between crystal layers. As a result, the development and extension of the fissures were intensified. A local “tree-like” seepage channel was finally formed. At the beginning of second water immersion, the seepage of external water produced more cracks and microcracks (Figure 5B). Besides, the expanded fissures were gradually filled with water, and the water pressure or the second dehumidification further realized the connection, thereby forming “net-like” crisscross structures that runs through the entire sample. From the perspective of spatial distribution of pores, the scale and number of them on the surface were much larger than those at the center. The main reason may be that the sample at the edge had the most intensive contact with the environment.
3.2.2 Three-dimensional pore model
In Table 4, the porosity of sample after 0, 1 and 2 cycles were 0.17, 3.5 and 5.05%. The connectivity rate was 0.09, 2.95 and 4.59%, respectively. Combining the number of pores and the corresponding volume ratio, they were mainly connected after the dry-wet cycles, accounting for 84.29% of the total in one cycle. The second cycle promoted further connection of fissures or microcracks and derived more small pores.
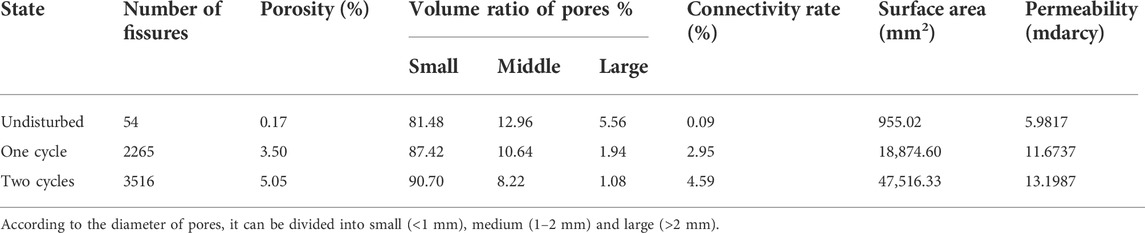
TABLE 4. Statistics of overall characteristics of pores.
Figure 7 displayed the 3-D pore model after different wet-dry cycles. Figure 7A presented the undisturbed red-bed mudstone. The pores were not developed. Only the middle section of sample contained a few layered cracks. Original cracks may be affected by sedimentary environment and unloading. The pore model after one cycle was shown in Figure 7B. There were many cracks on the surface in the range of 0–10 mm. Several “tree-like” seepage channels were distributed around the edges, gradually expanding from outside to inside. In contrasted with original sample, its structure was obviously deteriorated. It can be inferred from the fissures that the swelling position of mudstone was mainly concentrated on the outside, and the swelling of central core around 20 mm from the upper and lower surfaces was less than that of the two ends, which is consistent with the phenomena in Figure 4. According to the development of internal fissures, the sample can be vertically divided into the fully infiltrated area (0–10 mm), partially infiltrated area (10–15 mm) and lateral seepage area (15–25 mm). The model after two cycles was shown in Figure 7C. Based on the first cycle, more pores and microcracks were distributed inside the core, whereas the swelling potential of clay minerals in the middle of rock mass can be fully released during second water immersion. Comparing the slight increase of deformation in initial stage of drying, although the two cycles were under same situation, the deterioration was different. The uncoordinated shrinkage stress at various positions during water loss aggravated the extension and dilatation of cracks.
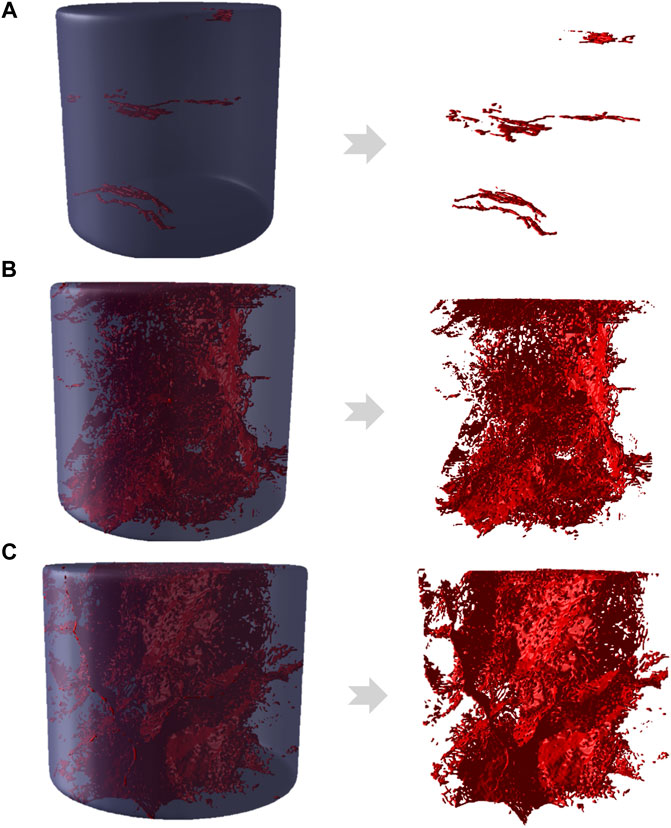
FIGURE 7. Three-dimensional pore model. (A) Undisturbed sample; (B) After one cycle; and (C) After two cycles.
3.2.3 Geometry size
The number of cycles seriously affected the aperture, size and connectivity of pores, microcracks and fissures. The diameter-length ratio (ie, the ratio of diameter to length) and Feret diameter were selected to describe geometric characteristics (Figure 8). The larger the diameter-length ratio, the narrower and longer the shape of pores. If it is infinitely close to 1, the pore will be approximately circular. For Figure 8A, the diameter-length ratio varied mainly from 0.1 to 0.6. As the cycle continued, the diameter-to-length ratio presented a trend of first decreasing and then increasing, indicating that the growth rate of microcracks and pores was much greater than that of fissures. For undisturbed mudstone, the range of diameter-length ratio was nearly 0.01–0.58. The changes of the fissures were inversely proportional to it, so most of them were closed and semi-closed flat pores. The diameter-length ratio ranged after the first and second cycles were 0.02–0.78 and 0.01–0.87, respectively, and the ratio below 0.5 accounted for more than 90%. The widening of numerical interval means the enlarging number of small pores. The changes in the shape and size of pores obeyed the normal distribution, with the largest proportion in the range of 0.3–0.4. From the first to the second cycle, the swelling of hydrophilic minerals and uneven thermal shrinkage stress all resulted in expanded scale (Bai et al., 2021; Bai et al., 2022), accompanied by the formation of some new pores and microcracks. (Figure 8).
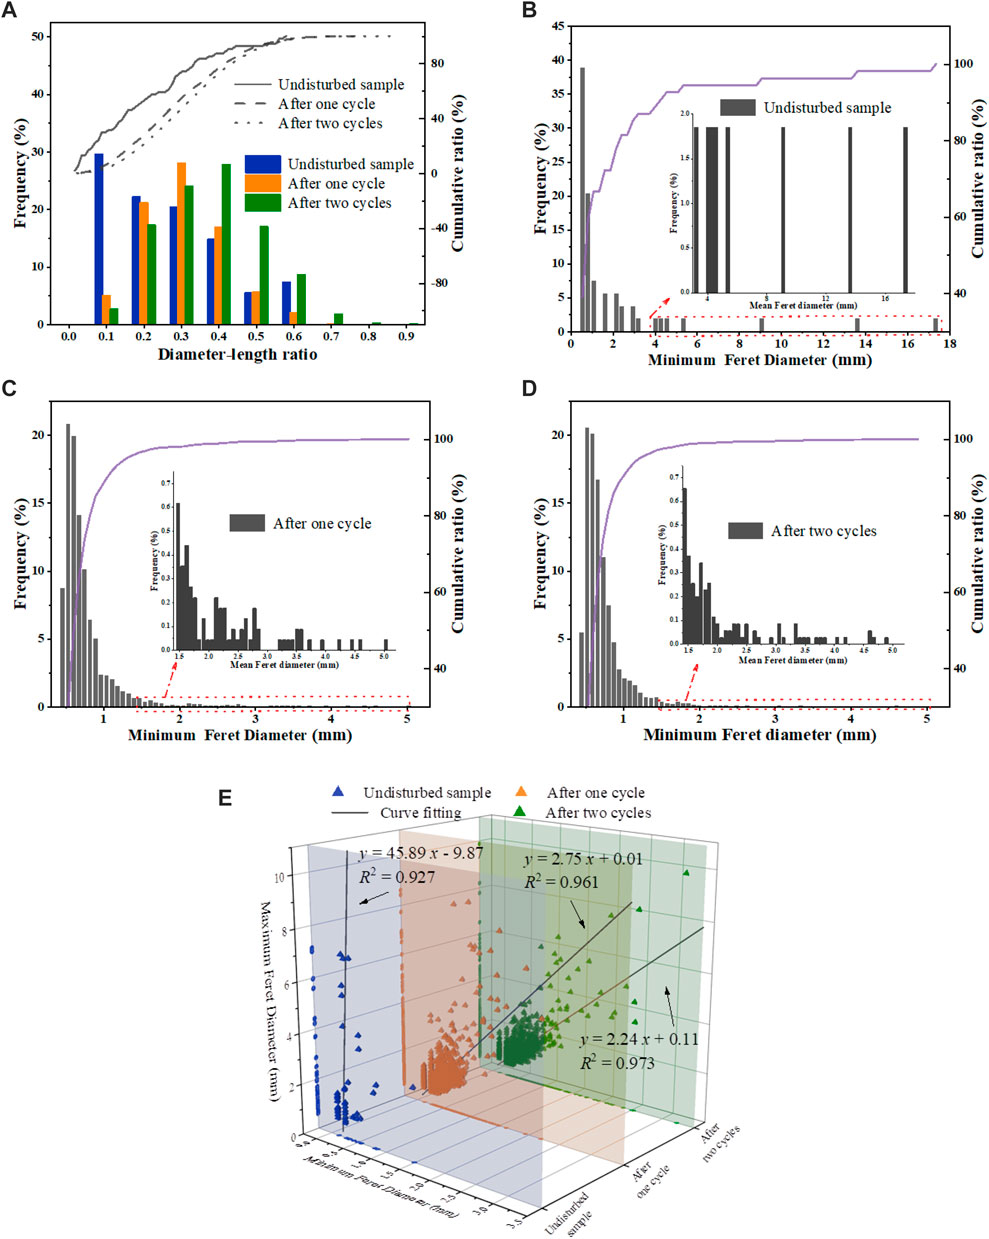
FIGURE 8. Statistics of geometric parameters. (A) Changes of diameter-length ratio; (B) Minimum Ferret diameter of undisturbed sample; (C) Minimum Ferret diameter after one cycle; (D) Minimum Ferret diameter after two cycles; and (E) Size distribution of pores: minimum Ferret diameter vs. maximum Ferret diameter.
Feret’s diameter (caliper diameter) is a commonly used parameter to describe the size of irregular particle/pore. Assume that the object to be measured is placed inside the jaws of a caliper, with the caliper oriented at a specified angle. By maintaining that angle and closing the jaws tightly against the object, the distance between the jaws is its Feret diameter.
Therefore, the diameter passing through the center of the particle in any direction is called a Feret diameter. Feret diameter is not the real diameter, but the common basis of a group of diameters. A Feret diameter can be taken every 10° direction. Generally, these 36 Feret diameters are used as a common basis for a group of diameters to describe a particle (Mark and Neil. 2010). By calculating enough Feret diameters at different angles and then selecting the maximum and minimum (ie,
Considering that Figure 8 only displayed statistical geometric parameters, it is highly difficult to comprehensively highlight the size of pores. Hereby, the following will analyze the spatial distribution, two-dimensional projection and fitting curve of scattered points in Figure 8E. The number of scattered points expresses the number of pores, which was proportional to the number of wet-dry cycles (Figure 8E). From the spatial density of scattered points, it could be intuitively classified into three scales: small pores (0 <
3.2.4 Orientation
Directional indicators such as Phi and Theta convey the direction, representing the angle between the projection of vector on the XOY or XOZ plane and x or z axis, respectively. By using these two variables, spatial orientation of cracks may be determined and its dynamic evolution can be clarified. Directional frequency
Where
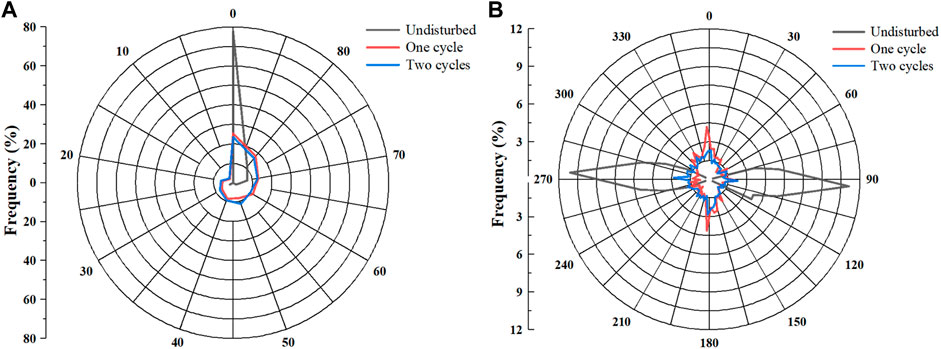
FIGURE 9. Directional frequency distribution of fissures and microcracks. (A) Phi and (B) Theta.
From Figure 9A, the orientation of cracks in the undisturbed sample was parallel to the x axis, corresponding to Figure 5B. No matter how many dry-wet cycles were experienced, directional frequencies of fissures and microcracks were always concentrated at approximately 0° and 80–90° (structure of the branch was roughly perpendicular to the main fissure in the x-direction), while the rest of the intervals were relatively stable. The reason may be that the lateral seepage channels were mainly horizontal. Affected by long-term sedimentation and climatic factors, the density, mineral and content of rock mass in a specific area were almost fixed. The swelling direction of remaining fissures may be connected to the distribution of hydrophilic clay minerals and have a degree of stubbornness. For the projection of cracks on the XOZ plane (Figure 9B), the horizontally oriented original cracks were orthogonal to the z-axis, thus their orientation frequency appeared to be 90° or 270°. However, with the participation of dryness and wetness, it is most significant near polar angles (such as 0°, 90°, 180°, and 270°). After one cycle, the number at 0° and 90° was the largest. In this case, the structure was in a “tree-like” state. When the second cycle was over, the cracks were distributed isotropically at four polar angles and the cracks were uniformly “net-like” (Figure 5B). The above findings fully illustrated that spatial orientation of fissures depended on the long-term deposition state of hydrophilic minerals, seepage, and the number of dry-wet deformation. The fissures of red-bed mudstone roughly followed the gradual development law of “horizontal original structure-branched extended structure-networked connected structure".
3.3 Changes in microscopic pores
Regarding the deterioration of micro-scale pore structures, a combined method of low-temperature nitrogen adsorption and mercury intrusion analysis was adopted to determine the changes in the shape, number, and size of the pores before and after wetting and drying.
3.3.1 Joint pore size
According to the characteristics of BJH method and mercury intrusion method at different scales, microscopic and mesoscopic pores were connected at a size of 100 nm. Figure 10A presented the joint distribution of pore size of undisturbed mudstone. Logarithmic abscissa can better reflect the full range of pore behaviors. In Figure 10A, the pores in the sample spanned a wide scale (10–105 nm), covering micropores and mesopores. As for micropores, the peak of pore size was at 40 nm. This scale roughly corresponds to interlayer spacing of clay minerals such as montmorillonite, illite, and kaolinite (Zhang et al., 2017; Song and Wang, 2019). The mesoporous part in Figure 10A also had several peaks (100–1500 nm), belonging to the category of pores and microcracks. Pores larger than 1500 nm were not obvious and can be ignored. Hereby, the compactness of undisturbed mudstone was confirmed again. Since the number of pores in the sample was small and most of them were interlayer spacing, it created an indispensable material foundation and spatial conditions for the development of pores and microcracks in the dry-wet cycle.
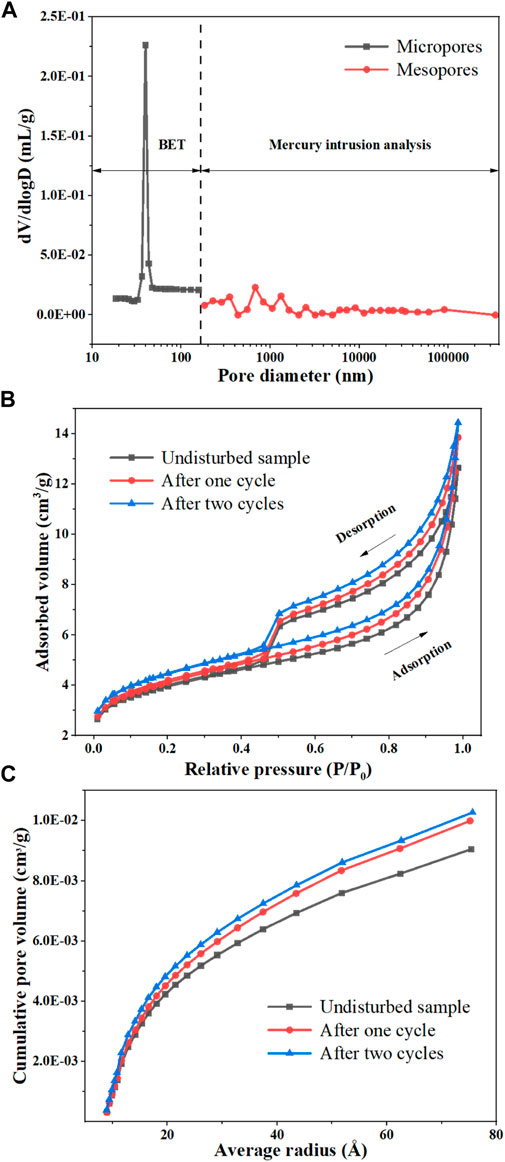
FIGURE 10. Changes in pore of mudstone samples by MIP and BET. (A) Distribution curve of continuous pores in undisturbed mudstone; (B) Isothermal adsorption curve under different cycles; and (C) Cumulative curve of pore volume.
3.3.2 Isothermal adsorption curve
There was the loop in curve of low-temperature nitrogen adsorption. The shape of the loop was closely related to the pore structure (Liu and Yang. 2014). Figure 10B plotted the isothermal adsorption curves for different cycles. The bottom and top of curve presented the processes of adsorption and desorption, respectively. The curve in Figure 10B was approximately S-shaped, and it was convex when the relative pressure was lower than 0.4. Subsequently, it rose gently, which was specifically manifested by the adsorption of monolayer. As relative pressure climbed, monolayer will gradually become saturated with adsorption and the adsorption of multi-layer will begin. When relative pressure reached 1, the curve rose sharply. The adsorption layer also approached infinity and capillary condensation occurred. According to definition of isothermal adsorption by IUPAC, this type of loop was similar to type II (Jin and Huang, 2015). But during the desorption period, the curve decreased rapidly in the early stage. The curve in Figure 10B was roughly equivalent to the combination of the adsorption curve of type B and the isothermal adsorption curve of type II. Accordingly, it can be judged that microporous structures of mudstone should include uniform parallel pores and wedge-shaped capillary pores with openings on all sides, belonging to the interlayer spacing and particle pores composed of various minerals, respectively. In connection with geological environment of rock mass, under the combined influence of sedimentation and cementation, the above-mentioned layered pore structure was prone to forming.
In contrast, the shapes of three curves were similar. Successive circulation led to an increase in the amount of adsorption and desorption at the same relative pressure. Morphology and size of the micropores in the sample remained generally unchanged, only enlarging the volume and specific surface area (Table 5).
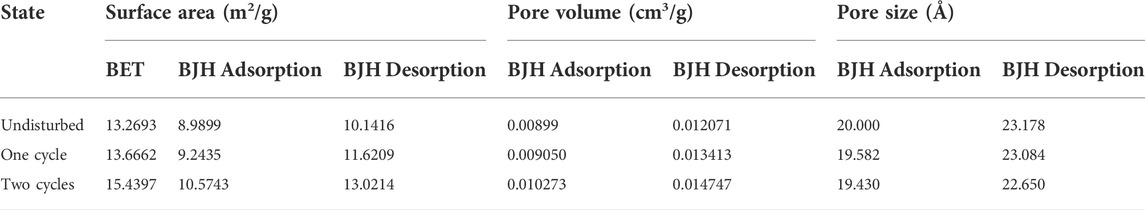
TABLE 5. Characteristics of micropores.
3.3.3 Changes in pore volume
Figure 10C described the accumulation and distribution of pore volume of microscopic pores in the range of 10–80 Å. The aperture was inversely proportional to the slope of curve. The larger the pore size, the smaller the number of pores. The curve rose fastest within 10–20 Å, and this interval has been proved to be mostly the interlayer spacing caused by parallel aggregation of clay flakes. The pores larger than 20 Å usually were the pores (wedge-shaped capillary pores) inside a single particle. In summary, nano-scale pores of the sample were still dominated by flat plates, meaning the clay minerals are widely distributed.
From the original state to the first cycle and finally to the second cycle, the curves almost overlapped when the pore size was less than 15 Å. Thus, the impact of wet-dry environments on the pores in this range was minimal (Figure 10C). The pores of this scale may be the basal spacing of non-clay minerals such as quartz, albite, and calcite. But above its size, pore volume of the sample increased significantly after being immersed in water and dried. With consecutive periods of dry-wet deformation, the increment of pore volume continued to descent. Moreover, clay minerals swelled after hydration, and dehumidification will make water molecules evaporate and produce irreversible shrinkage deformation. When the second cycle was over, swelling potential of clay minerals was almost completely released. The above results have fully demonstrated the speculation and analysis.
4 Conclusions
In this paper, typical red-bed mudstone in central Sichuan was taken as the study object. The mechanism of tensile stress caused by evaporation of water molecules in the initial stage of drying delayed the shrinkage was considered. The effect of water immersion, residual strain after dehydration and environmental temperature on the mechanical behaviors of mudstone were discussed. Based on this, the variation of structural features such as fissures, microcracks and pores inside the mudstone with continuous dry-wet cycles were discussed. By linking the swelling-shrinking performance between scales, multi-scale mechanism of structures during dry-wet process was illustrated.
Data availability statement
The original contributions presented in the study are included in the article/Supplementary Material, further inquiries can be directed to the corresponding author.
Author contributions
FY: Methodology, Data curation, Writing–original draft. K-WT: Investigation, Methodology, Writing–original draft. Z-HF: Investigation, Methodology. G-SF: Investigation, Data curation. ZZ: Investigation, Data curation. S-XC: Supervision, Validation. Z-JD: Supervision, Funding acquisition, Writing–review and editing.
Funding
This research was funded by the National Natural Science Foundation of China (No. 42172308) and the Youth Innovation Promotion Association CAS (No. 2022331).
Conflict of interest
The authors declare that the research was conducted in the absence of any commercial or financial relationships that could be construed as a potential conflict of interest.
Publisher’s note
All claims expressed in this article are solely those of the authors and do not necessarily represent those of their affiliated organizations, or those of the publisher, the editors and the reviewers. Any product that may be evaluated in this article, or claim that may be made by its manufacturer, is not guaranteed or endorsed by the publisher.
References
Bai, B., Wang, Y., Rao, D., and Bai, F. (2022). The effective thermal conductivity of unsaturated porous media deduced by pore-scale SPH simulation. Front. Earth Sci. 10, 1–9. doi:10.3389/feart.2022.943853
Bai, B., Zhou, R., Cai, G., Hu, W., and Yang, G. (2021). Coupled thermo-hydro-mechanical mechanism in view of the soil particle rearrangement of granular thermodynamics. Comput. Geotechnics 137 (8), 104272. doi:10.1016/j.compgeo.2021.104272
Barrett, E. P., Joyner, L. G., and Halenda, P. P. (1951). The determination of pore volume and area distributions in porous substances. I. Computations from nitrogen isotherms. J. Am. Chem. Soc. 73 (1), 373–380. doi:10.1021/ja01145a126
Brunauer, Stephen., Emmett, P., Teller, S., Emmett, P. H., and Teller, E. (1938). Adsorption of gases in multimolecular layers. J. Am. Chem. Soc. 60, 309–319. doi:10.1021/ja01269a023
Chugh, Y. P., and Missavage, R. A. (1981). Effects of moisture on strata control in coal mines. Eng. Geol. 17 (4), 241–255. doi:10.1016/0013-7952(81)90001-6
Cui, Y. (2007). Theory and uncertainty evaluation of the saturation salt solution humidity generator. China Instrum. 3, 77–79. doi:10.3969/j.issn.1005-2852.2007.03.019
Dai, Z. J., Guo, J. H., Zhou, Z., Chen, S. X., Yu, F., and Li, J. (2020). Inversion and prediction of long-term uplift deformation of high-speed railway subgrade in central Sichuan red-bed. Chin. J. Rock Mech. Eng. 39 (S2), 3538–3548. doi:10.13722/j.cnki.jrme.2019.1149
Deng, H. F., Zhou, M. L., and Li, J. L. (2016). Mechanical properties deteriorating change rule research of red-layer soft rock under water-rock interaction. Chin. J. Rock Mech. Eng. 35 (A02), 3481–3491. doi:10.13722/j.cnki.jrme.2016.0810
Doostmohammadi, R., Moosavi, M., Mutschler, T., and Osan, C. (2009). Influence of cyclic wetting and drying on swelling behavior of mudstone in south west of Iran. Environ. Geol. 58 (5), 999. doi:10.1007/s00254-008-1579-3
Fan, Q. Y., Liang, X., and Han, J. S. (2020). Experimental study on saturation and swelling-shrinkage characteristics of unsaturated expansive rocks. Chin. J. Rock Mech. Eng. 039 (001), 45–56.
Fu, H., Chen, J., and Zeng, L. (2019a). Experiment on the effects of temperature and humidity on uniaxial mechanical properties of silty mudstone. Tumu Gongcheng Xuebao/China Civ. Eng. J. 52 (1), 89–98.
Fu, H. Y., Chen, X. W., and Chen, J. C. (2019b). Impact of temperature and humidity on rock mass shear strength of silty-mudstone slope. J. Chang'an Univ. Nat. Sci. Ed. 39 (1), 25–33. doi:10.3969/j.issn.1671-8879.2019.01.005
Hentschel, L. H., and Page, W. P. (2003). Selection of descriptors for particle shape characterization. Part. Part. Syst. Charact. 20 (1), 25–38. doi:10.1002/ppsc.200390002
Huang, L. (2016). Experimental study on mechanical and microscopic pore properties of one-time thawing clay soil. Xuzhou: China University of Mining and Technology.
ISRM (1979). Suggested methods for determining water content, porosity, density, absorption and related properties and swelling and slake durability index properties. engineering materials and technology.
Jiang, G. L., Chen, W. Z., Liu, X. F., Yuan, S., Wu, L., and Zhang, C. (2018). Field study on swelling-shrinkage response of an expansive soil foundation under high-speed railway embankment loads. Soils Found. 58 (6), 1538–1552. doi:10.1016/j.sandf.2018.09.008
Jin, Y. R., and Huang, Z. X. (2015). Adsorption and pore size distribution. Beijing: National Defense Industry Press.
Jing, H. W. (2019). Water-Physical property of sichuan central redbeds and IT'S influence on the deformation mechanism analysis ballastless track. J. Geol. Hazards Environ. Preserv. 119 (02), 36–41.
Kong, L. W., Zeng, Z. W., Bai, W., and Wang, M. (2017). Engineering geological properties of weathered swelling mudstones and their effects on the landslides occurrence in the yanji section of the jilin-hunchun high-speed railway. Bull. Eng. Geol. Environ. 77 (4), 1491–1503. doi:10.1007/s10064-017-1096-2
Liu, B., Sun, Y., Wang, J., and Zhang, G. (2020). Characteristic analysis of crack initiation and crack damage stress of sandstone and mudstone under low-temperature condition. J. Cold Reg. Eng. 34 (3), 1–10. doi:10.1061/(asce)cr.1943-5495.0000225.1943-5495.0000225
Liu, C. D., Cheng, Y., Jiao, Y. Y., Zhang, G. H., Zhang, W. S., Ou, G. Z., et al. (2021a). Experimental study on the effect of water on mechanical properties of swelling mudstone. Eng. Geol. 295, 106448. doi:10.1016/j.enggeo.2021.106448.enggeo.2021.106448
Liu, W., Zheng, L., Zhang, Z., Liu, G., Wang, Z., Yang, C., et al. (2021b). A micromechanical hydro-mechanical-damage coupled model for layered rocks considering multi-scale structures. Int. J. Rock Mech. Min. Sci. 142, 104715. doi:10.1016/j.ijrmms.2021.104715.ijrmms.2021.104715
Liu, X., and Yang, S. (2014). Three-dimensional numerical simulation of methane drainage by high-level drill holes in a lower protective coal seam with a "U" type face. Int. J. Coal Sci. Technol. 1 (4), 434–440. doi:10.1007/s40789-015-0053-6
Ma, L., Yan, S., and Zhang, R. (2015). Experimental research on soaking swelling deformation of mudstone with low content of clay minerals. Ind. Constr. 45 (011), 111–115. doi:10.13204/j.gyjz201511021
Ming, L., Jiaming, Z., and Zhiping, Z. (2016). Analysis of the surrounding rock stability and supporting time of a soft rock tunnel in the red bed area. Saf. Environ. Eng. 2020, 8842976. doi:10.13578/j.cnki.issn.1671-1556.2016.03.025
Organisation Internationale de Métrologie Légale (OIML) (1996). The scale of relative humidity of AirCertified against saturated salt solutions. Recommendation R, 121.
Ren, S., Wu, J. X., and Oy, X. (2018). Influence of pressured water on the swelling of anhydrite rock. Rock Soil Mech. 39 (12), 63–71. doi:10.16285/j.rsm.2017.0862
Serafeimidis, K., and Anagnostou, G. (2015). The solubilities and thermodynamic equilibrium of anhydrite and gypsum. Rock Mech. Rock Eng. 48 (1), 15–31. doi:10.1007/s00603-014-0557-1
Shen, Z. L., and Wang, Y. X. (2002). Review and outlook of water-rock interaction studies. Earth Sci. J. China Univ. Geosciences 27 (2), 127–133. doi:10.3321/j.issn:1000-2383.2002.02.001
Singh, T., Verma, A., Singh, V., and Sahu, A. (2005). Slake durability study of shaly rock and its predictions. Env. Geol. 47 (2), 246–253. doi:10.1007/s00254-004-1150-9
Song, X., and Wang, M. (2019). Molecular dynamics modeling of a partially saturated clay‐water system at finite temperature. Int. J. Numer. Anal. Methods Geomech. 43 (13), 2129–2146. doi:10.1002/nag.2944
Sun, Y. C., Shang, Y. J., and Yong-Xin, Q. U. (2010). Application of projection pursuit model to swelling identification and grading of argillaceous rock. Rock Soil Mech. 31 (08), 2570–2574. doi:10.3969/j.issn.1000-7598.2010.08.037
Tarazona, P. (1985). Free-energy density functional for hard spheres. Phys. Rev. A 31 (4), 2672–2679. doi:10.1103/physreva.31.2672.31.2672
Wang, Q., Zhang, Y., Wang, X., Chen, L., and Zhang, X. (2019). Experimental study on mechanical behaviors of mudstone under real-time temperature. AIP Conf. Proc. 2106, 020003. doi:10.1063/1.5109326
Wang, Y., Feng, W. K., Hu, R. L., and Li, C. H. (2020). Fracture evolution and energy characteristics during marble failure under triaxial fatigue cyclic and confining pressure unloading (FC-CPU) conditions. Rock Mech. Rock Eng. 54, 799–818. doi:10.1007/s00603-020-02299-6
Wu, D., Liu, H., and Wang, G. (2010). Laboratory experimental study of slaking characteristics of red-bed soft rock. Chin. J. Rock Mech. Eng. 29 (02), 4173–4179.
Xun-Guo, Z., and Yang, Q. (2009). Identification and classification of swelling rock. Rock Soil Mech. 30 (2), 174–177. doi:10.1007/978-3-642-40630-0_1
Yamaguchi, H., Yoshida, Y., and Kuroshima, I. (1988). “Slaking and shear properties of mudstone,” in ISRM International Symposium, September 12–16, 1988 (Madrid, Spain: OnePetro), 133–144.
Yu, L. L., Wu, H. J., An, Y. P., and Wang, B. T. (2019). Experimental study on the brittle-ductile response of a heterogeneous soft coal rock mass under multifactor coupling. Geofluids 2019 (04), 1–15. doi:10.1155/2019/5316149
Zhang, C., Liu, Z., and Dong, Y. (2017). Effects of adsorptive water on the rupture of nanoscale liquid bridges. Appl. Clay Sci. 146, 487–494. doi:10.1016/j.clay.2017.07.002
Zhang, L. Y., Mao, X. B., Li, M., Li, B., Liu, R., and Lu, A. (2020a). Brittle–ductile transition of mudstone in coal measure rock strata under high temperature. Int. J. Geomech. 20 (1), 1–6. doi:10.1061/(asce)gm.1943-5622.0001549(ASCE)GM.1943-5622.0001549
Zhang, Z., and Gao, W. (2020). Effect of different test methods on the disintegration behaviour of soft rock and the evolution model of disintegration breakage under cyclic wetting and drying. Eng. Geol. 279, 105888. doi:10.1016/j.enggeo.2020.105888
Zhang, Z., Gao, W., Zeng, C., Tang, X. Y., and Wu, J. (2020b). Evolution of the disintegration breakage of red-bed soft rock using a logistic regression model. Transp. Geotech. 24, 100382. doi:10.1016/j.trgeo.2020.100382
Keywords: red-bed mudstone, deformation, dry-wet cycle, fissures and microcracks, multi-scale
Citation: Yu F, Tong K, Fu Z, Feng G, Zhou Z, Chen S and Dai Z (2022) Multi-scale deformation characteristics and mechanism of red-bed mudstone in dry-wet environment. Front. Earth Sci. 10:974707. doi: 10.3389/feart.2022.974707
Received: 21 June 2022; Accepted: 08 July 2022;
Published: 04 August 2022.
Edited by:
Xiaoping Zhou, Chongqing University, ChinaReviewed by:
Wu Liu, Hefei University of Technology, ChinaBing Bai, Beijing Jiaotong University, China
Copyright © 2022 Yu, Tong, Fu, Feng, Zhou, Chen and Dai. This is an open-access article distributed under the terms of the Creative Commons Attribution License (CC BY). The use, distribution or reproduction in other forums is permitted, provided the original author(s) and the copyright owner(s) are credited and that the original publication in this journal is cited, in accordance with accepted academic practice. No use, distribution or reproduction is permitted which does not comply with these terms.
*Correspondence: Zhangjun Dai, empkYWlAd2hyc20uYWMuY24=