 Changshuo Wang
 Rui Yong1*
 Chuxia Huang
94% of researchers rate our articles as excellent or good
Learn more about the work of our research integrity team to safeguard the quality of each article we publish.
Find out more
ORIGINAL RESEARCH article
Front. Earth Sci., 30 August 2022
Sec. Geohazards and Georisks
Volume 10 - 2022 | https://doi.org/10.3389/feart.2022.974455
This article is part of the Research TopicAdvancement in Quantitative Risk Analysis of Geological Disaster in Reservoir AreasView all 8 articles
The direct shear test is commonly used to determine the shear strength of rock joints. The measured shear strength, however, varies greatly with specimen positions due to the heterogeneity of rock joints. As a result, selecting specimens that represent the overall properties of rock joints is usually difficult. This paper aims to investigate the heterogeneity of rock joints and propose a new sampling method for selecting representative specimens. The roughness and shear strength variations of specimens taken from different positions of a natural rock joint were analyzed, and it was discovered that the heterogeneity of rock joint roughness is responsible for the heterogeneity of shear strength. The limitations of the traditional sampling method based on visual judgment were extensively investigated, revealing that shear strength parameters acquired by the traditional method contain large coefficient of variation (COV) values. To acquire trustworthy shear strength parameters, we proposed a representative sampling method based on the maximum likelihood estimation of the overall properties of rock joints. The number of determined representative specimens increases with the increase of normal stress. Representative specimens determined under low normal stresses can likewise exhibit the overall properties of the rock joint when subjected to high normal stresses. The Mohr-Coulomb and a nonlinear criterion were used to validate the derived representative specimens, demonstrating that the proposed method can produce reliable shear strength parameters and shear strength envelopes. Particularly, the determined representative specimens could derive shear strength parameters with relative errors less than 10% and COV values less than 0.1. The proposed method provides a quantitative and reliable tool for determining representative specimens to obtain reliable shear strength of rock joints.
The rock mass stability is strongly influenced by the shear behavior of rock joints (Khan et al., 2021; Klimeš et al., 2021; Paixão et al., 2022). The shear strength of rock joints is one of the significant factors controlling the shear behavior of rock joints (Barton, 2013; Wu et al., 2020; Fathipour-Azar, 2022), which is one of the most critical parameters in designing appropriate supporting systems (Kusumoto and Gudmundsson, 2014; Tang et al., 2016; Aaron et al., 2020). Therefore, determining shear strength for rock joints is an emerging priority. Researchers and engineers have long recognized the laboratory direct shear tests on relatively small specimens (laboratory-scale specimens) as the most practical method to determine the shear strength of rock joints (Muralha et al., 2014; Renaud et al., 2019; Bista et al., 2020). However, the rock joint properties vary significantly with position, even when testing on the same joint and along the same direction; this is referred to as the rock joint heterogeneity (Du et al., 2022).
The rock joint heterogeneity can cause variabilities in the selection of rock joint specimens, leading to the misinterpretation of direct shear test results. Thus, the specimen collection is of great importance in direct shear tests, in which the heterogeneity of rock joints should not be ignored (Yong et al., 2018; Kulatilake et al., 2021). Many guidelines suggest that specimens should be taken from test horizons with similar characteristics and represent the host properties as nearly as practicable (JGS, 2008; Muralha et al., 2014; ASTM, 2016). Referred to these guidelines, the characteristics of selected test specimens for the direct shear tests should be representative and similar. The rock joint specimens representing the host properties are traditionally selected based on visual judgment, which contains subjectivity and relies on experiences. Some researchers found that the uncertainty associated with rock joint shear strength can be reduced by increasing the number of specimens (Magner et al., 2017; Renaud et al., 2019). However, the parameter uncertainty of shear strength is difficult to ideally eliminate by this approach since the number of specimens used to perform direct shear tests is generally limited in practice (Casagrande et al., 2017; Abdulai and Sharifzadeh, 2018; Jorda-Bordehore and Herrera, 2018). Furthermore, although the sampling problem has been proved to be a severe issue in determining joint shear strength, the influence of the traditional sampling method on estimating shear strength is lack of evaluation. Thus, an effort should be made to find effective sampling methods for the direct shear test to reduce the uncertainty and increase the shear strength accuracy.
The heterogeneity of shear strength for well-matched rock joints is dependent on the joint roughness when the joint wall materials, the joint scale, and the applied normal stress are the same (Barton, 1973; Niktabar et al., 2017; Wang et al., 2019; Rullière et al., 2020; Saadat and Taheri, 2020). For example, Hencher et al. (2010) found that the roughness of specimens taken from different locations along the same joint was different and resulted in different shear strengths under the same normal stress. Similarly, Bahaaddini et al. (2014) found that the laboratory-scale rock joints (length < 200 mm) produced significant variability in the results of both physical and numerical shear box tests due to the local variability in effective roughness. Based on quantitatively characterizing the joint roughness, many researchers (Barton and Choubey, 1977; Bandis et al., 1981; Grasselli et al., 2002; Xia et al., 2014; Thirukumaran and Indraratna, 2016) proposed shear strength criteria, which are still the fundamentals of the theories of rock mechanics. Therefore, in this study, the heterogeneity of rock joints is investigated based on a simplified procedure in which the shear strength is quantitatively estimated based on the joint roughness. After characterizing the heterogeneity of rock joints, the specimen selection can be simplified into a process of exploring the representative shear strength specimens.
This paper aims to provide a method to determine the representative specimens for laboratory testing on the shear strength of rock joints. First, a natural large rock joint is collected, and the heterogeneity of rock joints is studied. Then, the limitations of the traditional sampling method based on visual judgment are thoroughly investigated. Finally, a representative specimen sampling method is proposed considering the heterogeneity of rock joints, and the determined representative specimens are validated with the Mohr-Coulomb and a non-linear criterion.
To systematically disclose the influence of the heterogeneity of rock joints on the estimation of shear strength, we conducted a case study on a natural slate rock joint with a cross-section area of 1,000 mm2 × 1,000 mm2 collected from the Heshangnong quarry. The site is at Qingshi Town, southeast of Changshan County, Zhejiang Province, China (Figures 1A,B). Exploiting this quarry requires a pit with a length of 87 m and a width of 59 m. In this pit, the overburdened rock mass mainly consists of calcareous slates, originating from Ordovician argillaceous limestone under light metamorphism. The grayish-green slate rock wall is foliated, very fine-grained, and formed by the metamorphosis of intermediate tuff. The stability of this pit is controlled by the slate foliation that generally dips about 55° to the NW. The distinct, continuous foliation planes in the overburdened rock mass are oriented with strikes approximately parallel to the pit walls and dip towards the bottom of the pit (Figure 1C).
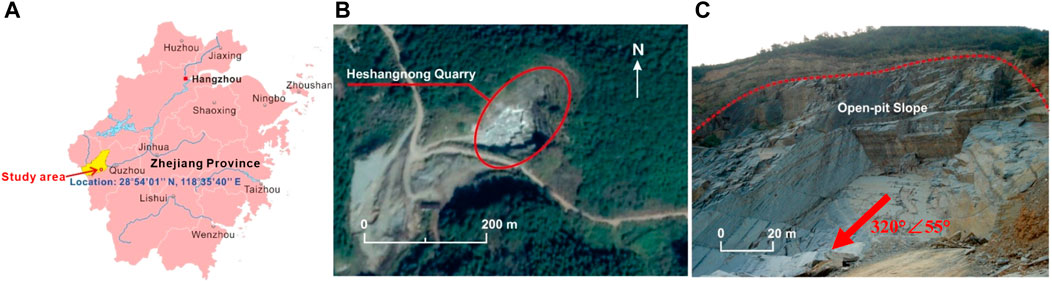
FIGURE 1. Sites selected for the investigation. (A) Location map of the study site; (B) Satellite view of the Heshangnong Quarry; (C) View of the structurally-controlled open-pit slope (Du et al., 2022).
The joint surface geometry was measured using a laser scanning system, MetraScan 750, with a maximum accuracy of 0.030 mm (Figure 2A). The digitized rock joint was equally divided into 100 mm × 100 mm specimens with a total number of 100 (Figure 2B). All specimens were denoted by SR-C, where R and C represent the row and the column of specimen location, respectively.
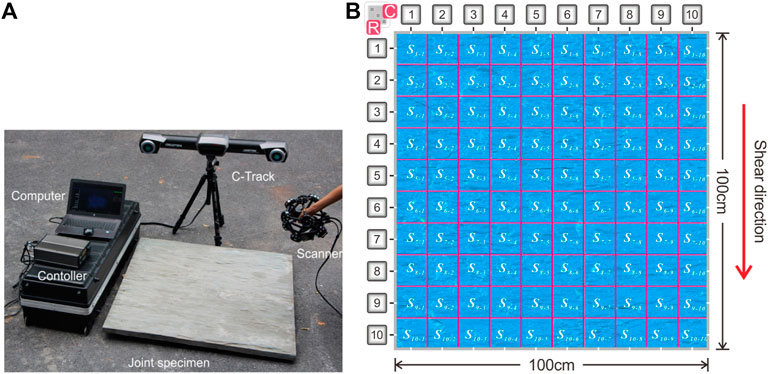
FIGURE 2. Joint surface scanning and digitization. (A) Scanning of the joint surface (Du et al., 2022); (B) Digitized joint surfaces of specimens with sizes of 100 mm2 × 100 mm2.
To investigate the heterogeneity of rock joints, the roughness and shear strength of specimens located on the different positions of the rock joint should be quantatively characterized. Many parameters have been proposed to quantify the roughness of rock joint. Among them, the roughness metric
where
After quantitatively characterizing the roughness of specimens, the shear strength (τp) values of the extracted specimens along the shear direction were predicted by the shear strength criterion proposed by Xia et al. (2014). This criterion considers the influences of the 3D roughness and tensile strength of materials on the shear strength of joints, which is advantageous in predicting the shear strength of rock joints. It is expressed as follows:
The tensile stress σt of the slate rock is 7.8 MPa, and the basic friction angle of the slate joint φb is 32°. According to the Eqs 1, 2, the roughness and shear strength of specimens located on the different positions of the slate joint should were quantitatively characterized. The color blocks in Figure 3 represent the joint roughness and shear strength of the specimens at their corresponding position and indicate their variations. As shown in Figures 3A,B, the surface roughness of the specimens has a distinct spatial variability. The roughness metric
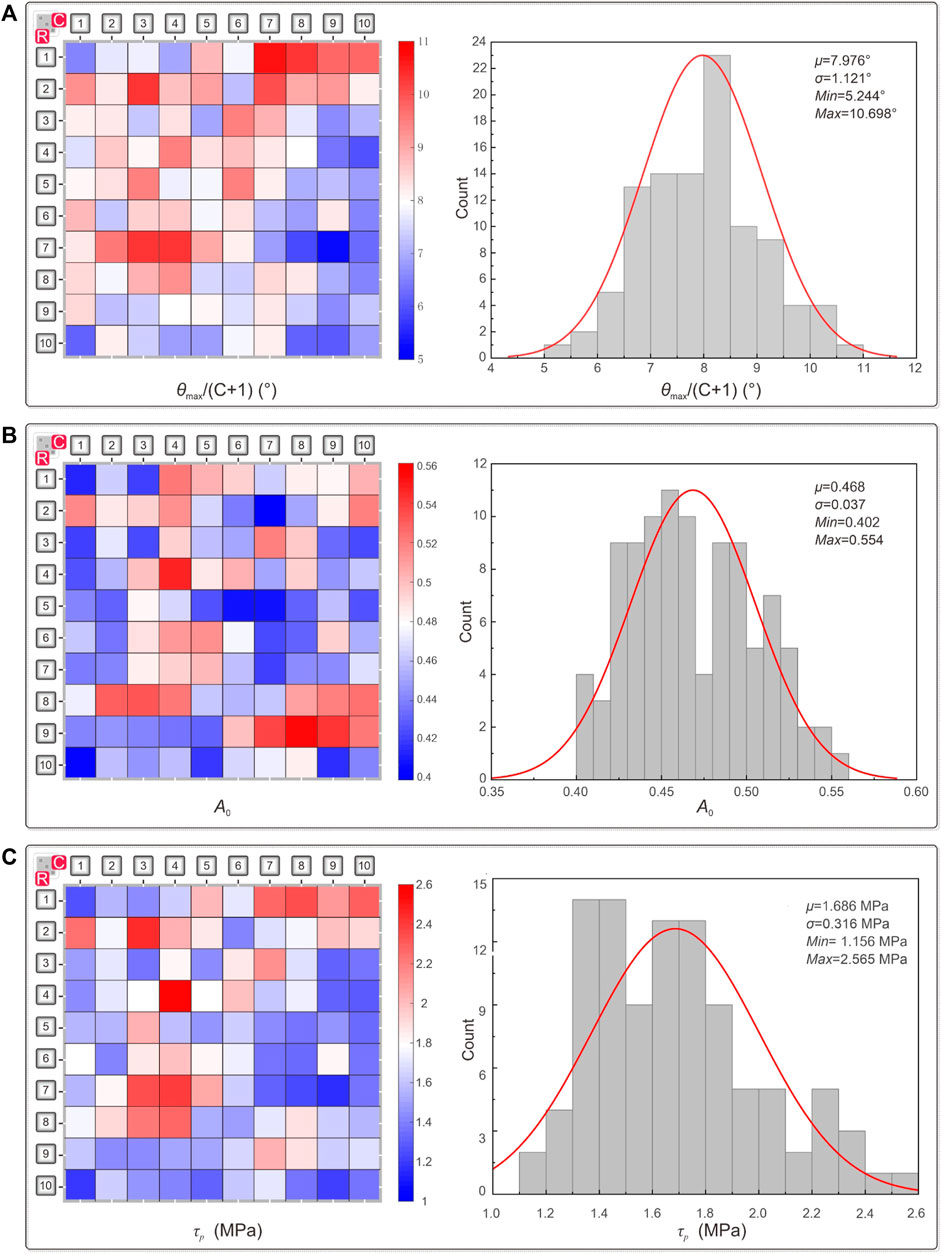
FIGURE 3. The heterogeneity of roughness and shear strength of the specimens. (A)
Test specimen selection from a natural rock joint is a subjective process. The locations of selected specimens primarily rely on personal judgment and experience. Assuming that specimens are randomly selected from the natural slate joint, the specimen selection can be simplified to a combination problem in mathematics: k objects are selected from a set of n objects to produce subsets without ordering. A formula for its evaluation is
According to Eq. 3, 161,700 (i.e.,
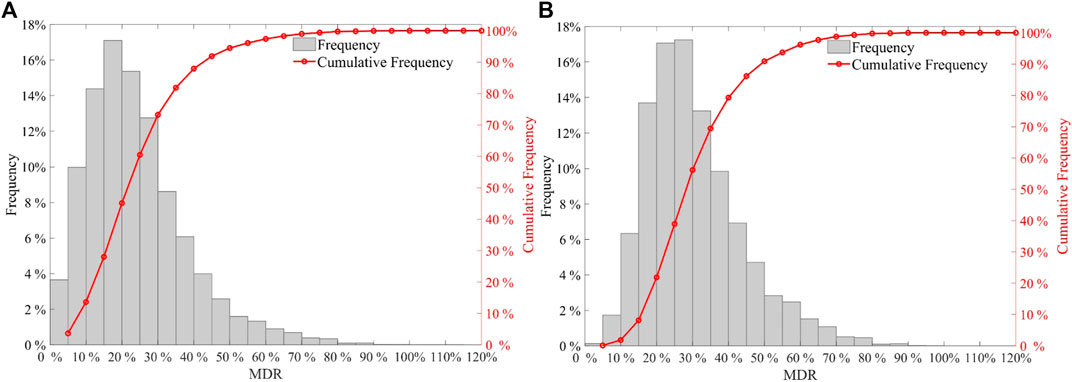
FIGURE 4. The histograms of maximum difference ratios (MDR) under the normal stress of 1.0 MPa. (A) Combinations containing 3 specimens; (B) Combinations containing 5 specimens.
In the direct shear test, each rock joint specimen is subjected to a normal stress σn perpendicular to the shearing plane, and a shear stress τ induces a shear displacement δs. The shear stress increases until the peak shear strength (τp) is reached. A typical stress-strain plot of the direct shear tests is shown in Figure 5. The relationship between the peak shear strength and the normal stress for rock joints can be presented by various criteria, such as the Mohr-Coulomb criterion and the Barton-Bandis criterion (Barton and Choubey, 1977; Bandis et al., 1981; Behnia et al., 2020). The Mohr-Coulomb criterion has been widely used in engineering practices among various shear strength criteria. The Mohr-Coulomb criterion, benefitting from its simplicity, facilitates deterministic methods to deal with rock engineering problems, such as limit equilibrium methods, numerical methods, and kinematic analysis methods (Casagrande et al., 2017; Prassetyo et al., 2017; Behnia et al., 2020). Although the shear strength envelopes of rock joints are generally nonlinear, they can be considered linear over a limited range of normal stresses (Muralha et al., 2014). Therefore, the Mohr-Coulomb criterion is usually suitable to adequately model test results. In this case, the shear strength parameters have two components: friction angle φ and apparent cohesion c. Plotting the peak shear strength values on a shear stress-normal stress diagram (Figure 5), the values will approximately fall along a linear line. The slope of the peak shear strength line denotes the friction angle φ, and the intersection between the line and the shear stress axis yields the apparent cohesion c.
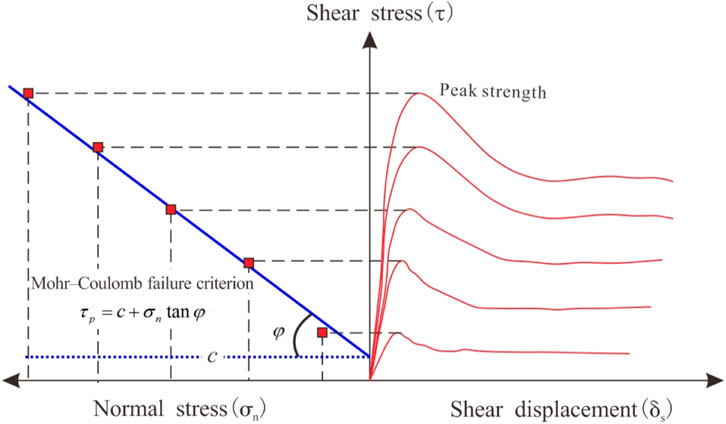
FIGURE 5. Typical presentation of direct shear test results (Muralha et al., 2014).
Considering the difficulty in preparing rock joint specimens with similar characteristics, the specimens collected by different researchers and engineers by a visual judgment may be inconsistent. Consequently, the inconsistent specimens may induce variabilities in shear strength parameters. Furthermore, normal stress assignments on rock joint specimens may differ among researchers and engineers, leading to additional variabilities in shear strength parameters. Such limitations of the traditional sampling method are quantitatively investigated in this section.
The 75,287,520 combinations containing 5 specimens were taken as examples to show the influence of inconsistent rock joint specimens on the shear strength parameters. First, specimens for each combination were applied to five levels of normal stresses (i.e., 0.2, 0.6, 1.0, 1.4, and 1.8 MPa) to calculate shear strength values based on Eq. 2. Then, the Mohr-Coulomb criterion was adopted to fit the shear strength results, by which 75,287,520 groups of apparent c and φ values were captured and plotted in Figure 6.
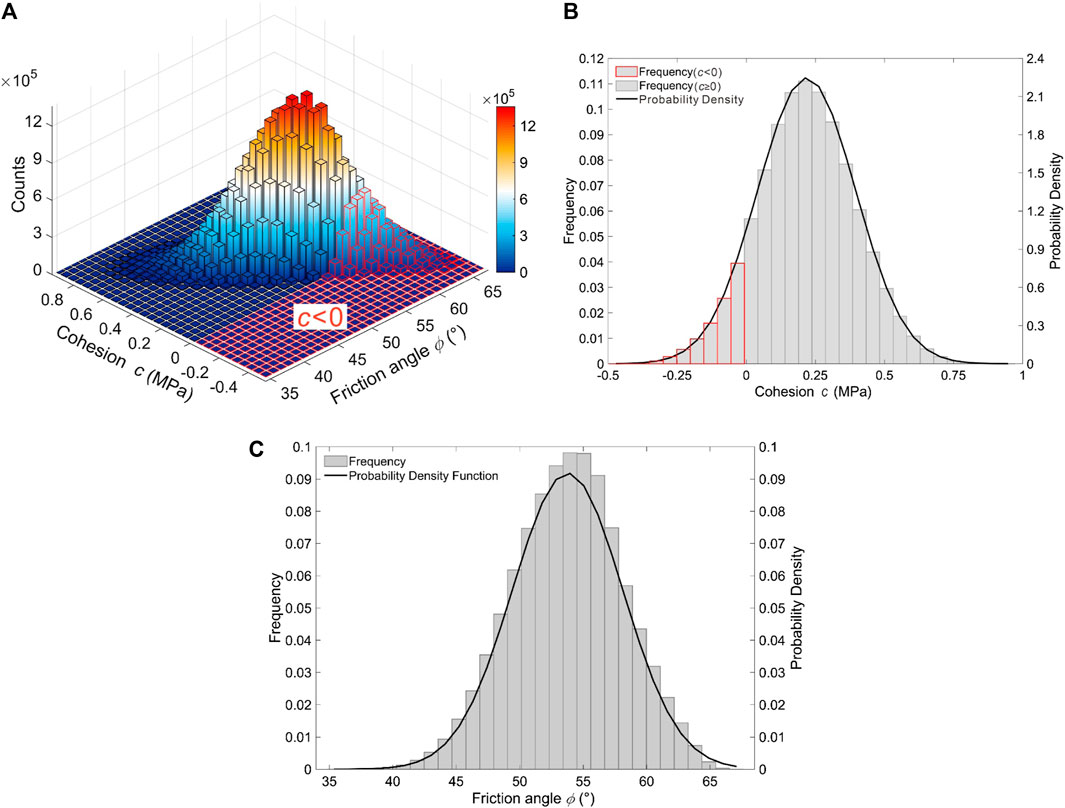
FIGURE 6. Distribution of the apparent cohesion and friction angle based on rock joint combinations each containing 5 specimens. (A) Distribution of the apparent cohesion and friction angle; (B) Distribution of the apparent cohesion; (C) Distribution of the friction angle.
As shown in Figure 6, the apparent c and φ approximately follow the normal distribution. The minimum and maximum values of the φ are 34.8°and 67.6°, respectively, and the apparent c ranges from −0.497 to 0.972 MPa. The inappropriate specimen combinations, of which the values of apparent c are negative, account for 10% of the total number of testing results. The main reason for the resulted negative cohesion values can be attributed to the large degree of heterogeneity of rock joint specimens collected with the traditional sampling method. The coefficient of variation (COV) values for the apparent c and φ are 0.813 and 0.081, respectively. Compared with the friction angle, the apparent cohesion value has more significant variability and is more challenging to determine accurately. Thus, engineers tend to ignore cohesion and only consider the friction angle in engineering practice (Duzgun et al., 2002; Barton, 2013; Bista et al., 2020). Nevertheless, shear strength estimations are likely biased when direct shear tests are conducted on a group of random specimens. More seriously, the negative c values may be obtained if the combination of specimens is inappropriate.
Considering a given group of k specimens, the total permutations of possible normal stress assignments are the factorial of k (i.e., k!). The influences of normal stress assignment permutations can be neglected for direct shear tests conducted on flat rock joints, such as the planar joints used to determine the basic friction angle (Mehrishal et al., 2016). However, because of heterogeneity in rock joint roughness, the morphology of natural rock joint specimens in a group for direct shear tests is generally not the same. Thus, the direct shear test results may differ when the permutations of assigned normal stresses are changed. Consequently, the apparent c and φ obtained through the Mohr-Coulomb criterion fitting of the test results will vary. Therefore, engineers and experimenters may get varying shear strength parameters from the same group of specimens.
Five specimens were randomly selected from the slate rock joint to investigate the effect of the inconsistent normal stress assignments on direct shear test results. Then, the five specimens were randomly assigned five levels of normal stresses (0.2, 0.6, 1.0, 1.4, and 1.8 MPa) to determine the corresponding shear strength values. There are 120 (i.e., 5!) permutations of normal stress assignments. Accordingly, 120 groups of apparent c and φ were obtained by fitting the results with the Mohr-Coulomb criterion. The linear fitted lines and the captured apparent c and φ were plotted in Figure 7.
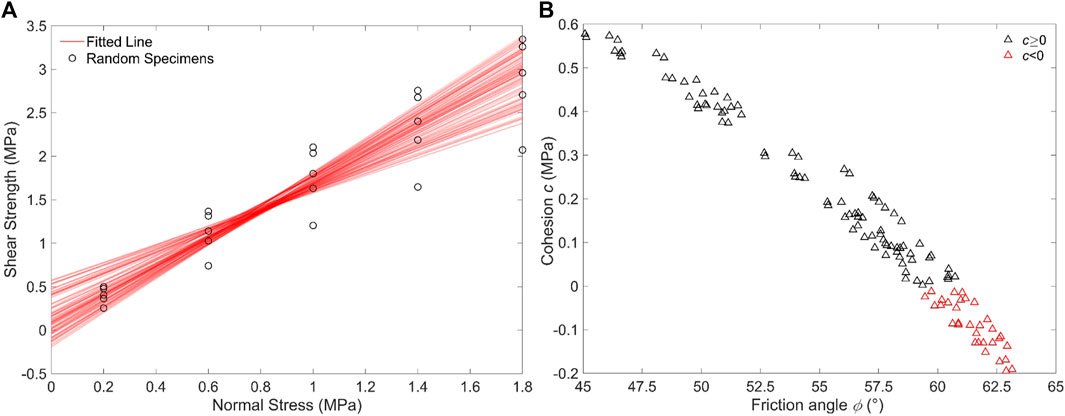
FIGURE 7. Shear strength parameters for 5 specimens under 120 permutations of normal stress assignments. (A) Linear fitted lines with the Mohr-Coulomb criterion; (B) Scatter plot of the captured apparent cohesion and friction angle.
It can be seen in Figure 7A that both the shear strength and the fitted lines are not consistent under different normal stress permutations. Accordingly, the captured apparent c and φ are distributed in wide ranges (the apparent c ranges from −0.195 to 0.578 MPa, and the friction angle ranges from 45.1° to 63.1°); and, 26.67% of the apparent c is negative (Figure 7B). Therefore, the influence of the normal stress assignments is not neglectable when conducting direct shear tests on natural rock joints.
Since both the apparent c and φ obtained from different engineers and experimenters may be inconsistent, an intuitive method for solving this problem is to conduct direct shear tests on all the permutations of specimens. Accordingly, the selection of specimens from the natural slate rock joint in the case study can be simplified as a permutation problem in mathematics: k objects are selected from a set of n objects to produce subsets with ordering. A formula for its evaluation is:
According to Eq. 4, there are 9,034,502,400 (i.e.,
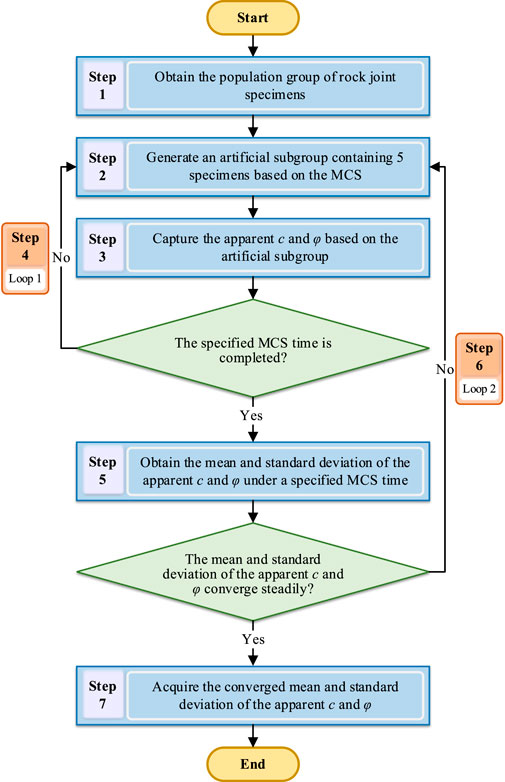
FIGURE 8. Flowchart illustrating the procedure for acquiring the converged mean and standard deviation of the apparent c and φ.
Step 1. Obtain the population group of rock joint specimens. Herein, the 100 rock joint specimens in the case study were taken as a population group (Figure 3B), as illustrated in Section 2.
Step 2. Generate an artificial subgroup containing 5 specimens based on the MCS. According to the labels of specimens in the population group, the MCS was adopted to select 5 labels randomly. The specimens that corresponded to the selected labels were taken as a subgroup.
Step 3. Capture the apparent c and φ based on the artificial subgroup. Five levels of normal stresses (i.e., 0.2, 0.6, 1.0, 1.4, and 1.8 MPa) were assigned randomly to the specimens within the artificial subgroup to calculate shear strength values with Eq. 2. Then, the apparent c and φ for the subgroup were captured through the linear fitting of the Mohr-Coulomb criterion.
Step 4. Repeat Steps 2–3 until a specified MCS time is performed, as illustrated with loop 1 in Figure 7. The MCS was repeated for a specified time, and a series of apparent c and φ were captured based on the generated subgroups.
Step 5. Obtain the mean and standard deviation of the apparent c and φ under the specified MCS time. The mean and standard deviation of the apparent c and φ were obtained based on the specified number of MCS results. Note that the MCS can consider the influences of specimen combinations and normal stress assignment permutations simultaneously because each MCS is independent.
Step 6. Repeat steps 2–5 until the mean and standard deviation of the apparent c and φ converge steadily with an MCS time, as illustrated with loop 2 in Figure 8. The MCS time began with three and increased by one interval (4, 5, 6, etc.) until the mean and standard deviation of the apparent c and φ converged steadily.
Step 7. Acquire the converged mean and standard deviation of the apparent c and φ.The mean and standard deviation of the apparent c and φ as the MCS time increases were shown in Figure 9. The figure shows that the mean and standard deviation of the shear strength parameters yield a very wide scatter when the MCS time is less than 1,000 but tend to be almost constant as the MCS time exceeds 10,000. The converged mean and standard deviation of the apparent c is 0.135 and 0.189 MPa, respectively; the mean and standard deviation of the φ converged steadily at 55.8° and 4.4°, respectively. However, collecting numerous subgroups of joint specimens is costly and impractical in engineering practices. Thus, it is necessary to propose an effective sampling method to capture reliable apparent c and φ.
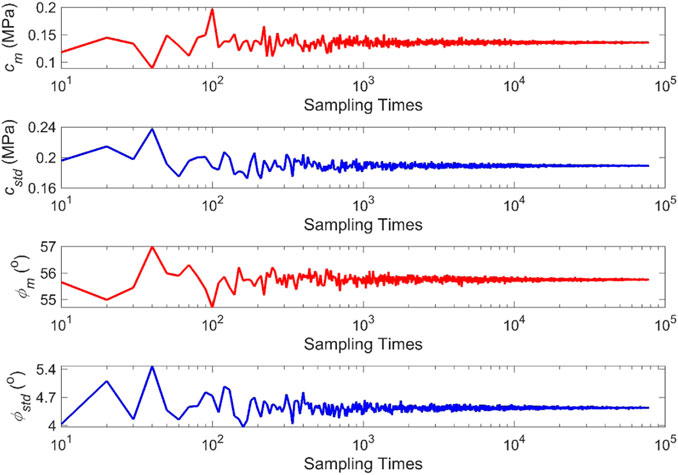
FIGURE 9. Mean and standard deviation of the apparent c and φ as the MCS time increases (cm and cstd are respectively the mean and standard deviation of c; and, ϕm and ϕstd are respectively the mean and standard deviation of φ).
The main disadvantage of traditional sampling methods is that the selected specimens based on visual judgment may not represent the population characteristics of the host discontinuity. Therefore, as described in Section 3, traditional sampling methods usually cause uncertainty when estimating shear strength parameters. Herein, a method for quantitatively selecting representative specimens is proposed, which is essential before conducting direct shear tests (Muralha et al., 2014).
The purpose of representative specimen sampling is to find specimens representing the overall characteristics of the host discontinuity. Therefore, the population characteristics of target rock joints should be estimated first to be taken as a reference for determining representative specimens. Herein, the maximum likelihood approach, which has been shown to effectively deal with the effect of variability (Lee et al., 2022), is adopted to estimate the population characteristics. As shown in Section 2, the shear strength of specimens on the field slate rock joint matches the normal distribution. Thus, the algorithm to estimate the population characteristics based on the maximum likelihood approach can be summarized as follows:
where μ is the population mean of the shear strength, σ is the population standard deviation of the shear strength, τpi is the shear strength of the ith rock joint specimen, and N is the number of rock joint specimens.
In statistical analysis, the population mean μ is considered the best estimate of the shear strength of rock joints. The principal geomechanical features can be analyzed based on the population mean shear strength (Brady and Brown, 1993). Thus, this paper takes the population mean μ as the representative shear strength. However, it is impractical to find a specimen with a shear strength equal to μ. Thus, the specimens whose shear strength differs from the representative value within 5% are taken as the representative specimens.
Herein, the representative specimen sampling method was presented under the normal stress of 1.0 MPa. First, the shear strength of all the 100 specimens under the normal stress of 1.0 MPa was calculated with Eq. 2. Then, the representative shear strength was calculated by Eq. 5, which is 1.686 MPa. Finally, 23 representative specimens were sampled, as shown in Figure 10B. The shear strength value of the representative specimens under the normal stress of 1.0 MPa ranges from 1.689 to 1.766 MPa, and the relative errors of the shear strength to the representative shear strength were all lower than 5%. The specimen (S2-7) with the shear strength of 1.689 MPa was taken as the most representative specimen, with a minimum relative error (only 0.178%) to the representative shear strength (1.686 MPa).
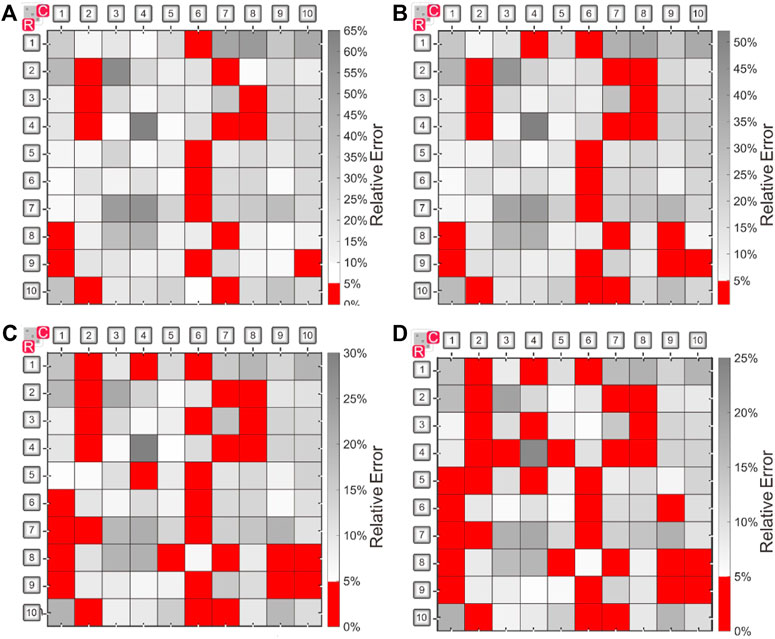
FIGURE 10. The locations of representative specimens determined under different normal stresses. (A) σn = 0.2 MPa; (B) σn = 1.0 MPa; (C) σn = 5.0 MPa; (D) σn = 10.0 MPa.
The locations of representative specimens at the normal stress of 0.2, 1.0, 5.0, and 10.0 MPa were plotted in Figure 10. As shown by the figure, the locations of representative specimens at different normal stresses are similar. Therefore, a specimen that belongs to the representative specimens under low normal stress can still be taken as a representative specimen when the normal stress increases. The figure also shows that the maximum relative error relative to the representative shear strength decreases with the increase of normal stress: the maximum relative errors when the normal stress is 0.2, 1.0, 5.0, and 10.0 MPa are 64.41%, 52.12%, 29.83%, and 23.49%, respectively. Given that the number of representative specimens under the lower normal stress is less than that under the relative higher normal stresses and that the maximum relative errors of shear strength for specimens under the lower normal stress are larger, it is suggested that special care be taken in selecting representative specimens under the lower normal stress.
Considering that the normal stress is a significant factor affecting the shear strength of rock joints, it is essential to investigate how the number and location of representative specimens change in response to normal stresses. Normal stresses ranging from 0.1 to 10.0 MPa were adopted to investigate the influence of normal stress on the representative specimens. As shown in Figure 11, the number of representative specimens has an increasing trend with the increase of normal stress, and the increase rate gradually slows down as the normal stress increases. At the extremely low normal stress of 0.1 MPa, the number of representative specimens accounts for 16% of the total specimens. At the relatively higher normal stress of 10 MPa, the proportion of representative specimens increases to 36%. The proportion of representative specimens increases as the normal stress increases, meaning the heterogeneity degree of rock joints under high normal stresses is lower than that under low normal stress. Direct shear test results in the literature (Barton and Choubey, 1977; Tatone and Grasselli, 2014; Bahaaddini et al., 2016) show that the rock joints are mainly slipping failure under lower normal stress, and few asperities are sheared off. When the normal stress is larger, most asperities displayed on the joint surface will be sheared off. As the heterogeneity of rock joints mainly depends on the roughness variety, the heterogeneity will be less apparent as the asperities are sheared off. However, the representative specimens are less than one-third of the total specimens under low normal stresses. This phenomenon also shows that collecting representative specimens based on visual judgment is not feasible using the traditional sampling method.
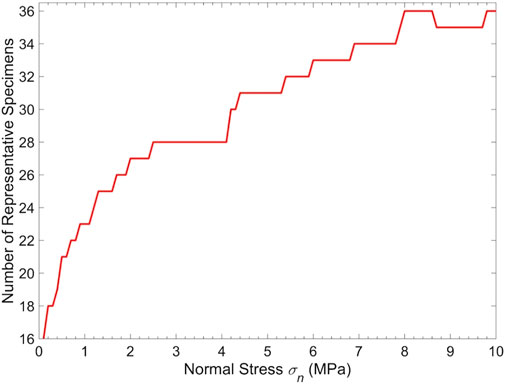
FIGURE 11. Relationship between the number of representative specimens and the applied normal stress.
The computed normal stress acting on the slate rock joint (see Figure 3) studied in this work is about 1.0 MPa because it was taken from a mine slop with a cut height of 38.5 m and the unit weight of the rock mass is 26 kN/m3. Therefore, the representative specimens were determined based on the shear strength of the specimens under normal stress of 1.0 MPa. As indicated in Section 4, the most representative specimen under normal stress of 1.0 MPa was S2-7 with a shear strength of 1.689 MPa, and the top five representative specimens under normal stress of 1.0 MPa were S2-7, S3-8, S9-10, S10-7, and S9-6 with shear strengths of 1.689, 1.689, 1.697, 1.700, and 1.671 MPa. The locations and morphology of the top five representative specimens were shown in Figure 12. These representative specimens under the normal stress of 1.0 MPa are also representative specimens under normal stresses of 0.2, 5.0, and 10.0 MPa, as illustrated in Figure 10.
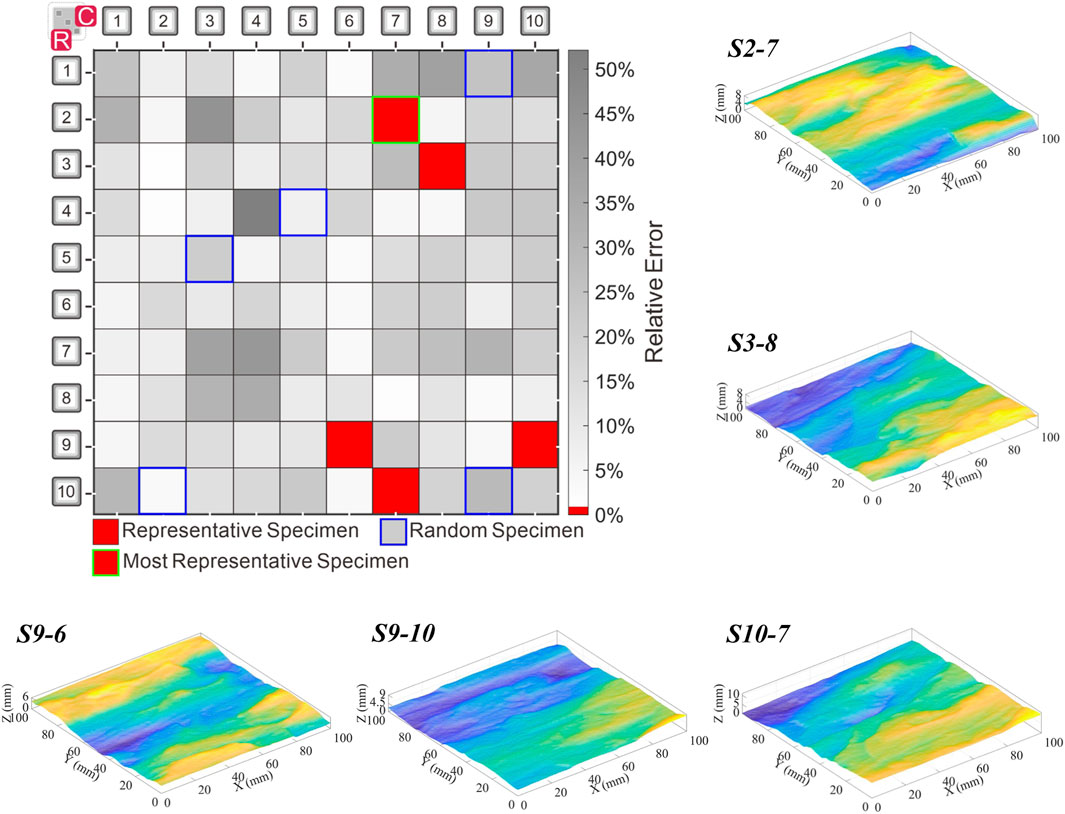
FIGURE 12. Locations and morphology of the top five representative specimens (note: the shear direction is along the negative direction of the Y-axis).
Two approaches were utilized to determine shear strength parameters based on the collected representative specimens. For method (1), five levels of normal stresses (i.e., 0.2, 0.6, 1.0, 1.4, and 1.8 MPa) were given to the most representative specimen (S1-7) to determine corresponding shear strength values. In method (2), the top five representative specimens (S1-7, S2-8, S9-0, S9-7, and S8-6) were randomly assigned five levels of normal stresses (i.e., 0.2, 0.6, 1.0, 1.4, and 1.8 MPa), from which 120 combinations of shear strength values were obtained. The Mohr-Coulomb criterion was used for both methods to determine shear strength parameters.
The shear strength values obtained from method (1), method (2), and the traditional method (i.e., five random specimens) were presented in Table 1. The table shows that the shear strength values derived by methods (1) and (2) are consistent with the representative shear strength at each level of normal stresses. The maximum relative error between the shear strength obtained by method (1) and the representative shear strength is only 1.1%. Affected by normal stress assignment permutations, the shear strength values obtained by method (2) are distributed in a limited interval with a maximum COV of 0.028. The mean relative error between the shear strength obtained by method (2) and the representative shear strength ranges from 0.5% to 2.3%. The minor relative errors demonstrate that the selected representative specimens can present the overall characteristics of the natural slate joint. In contrast, the mean relative error between the shear strength obtained by the traditional method and the representative shear strength ranges from 14.4% to 20.5%, much larger than methods (1) and (2). Furthermore, the shear strengths acquired using the traditional method have a large dispersion, with the COV ranging from 0.178 to 0.247, which is an order of magnitude greater than the method (2). Consequently, as shown in Figure 13A, the fitted Mohr-Coulomb linear lines based on methods (1) and (2) are consistent with the results based on the representative shear strength. However, the Mohr-Coulomb fitted linear lines for the traditional method are distributed in a large range, which induces uncertainties in shear strength parameters.
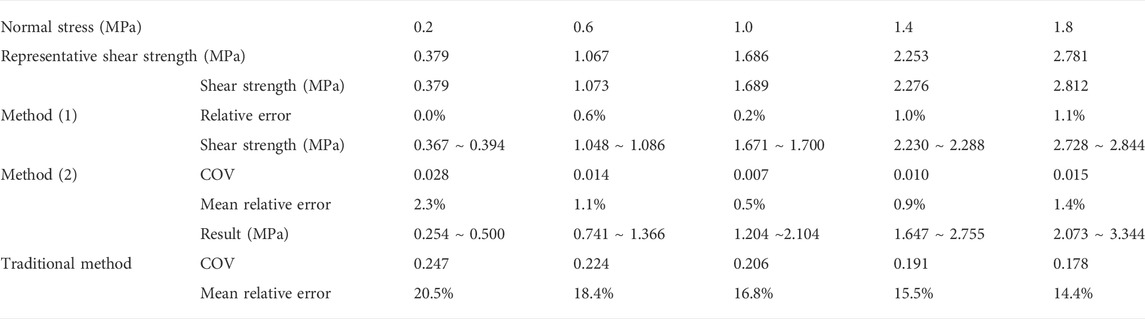
TABLE 1. Shear strength based on different methods.
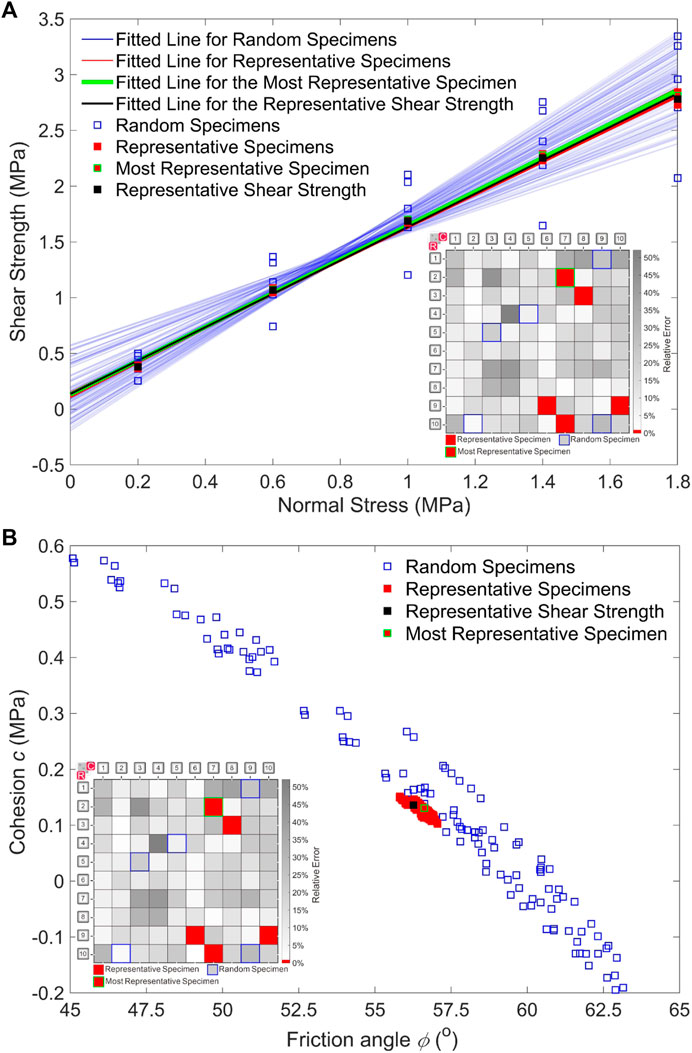
FIGURE 13. Shear strength parameters determined with different methods. (A) Linear fitted lines with different sampling methods; (B) Apparent cohesion and friction angles with different sampling methods.
The shear strength parameters obtained from different methods were presented in Figure 13B and Table 2. As shown by the figure and the table, the shear strength parameters obtained by methods (1) and (2) are located around the true information (i.e., the shear strength parameters obtained with the representative shear strength) within small relative errors. The relative errors of the apparent c and φ between the method (1) and the true information are 3.7% and 0.5%. As the shear strength values obtained by method (2) are affected by normal stress assignment permutations, the apparent c and φ obtained with method (2) are distributed in limited intervals with the COV of 0.093 and 0.006. The mean relative errors between the apparent c and φ obtained by method (2) and the true information are 8.7% and 0.6%. Therefore, methods (1) and (2) can derive satisfied shear strength parameters. However, the mean relative errors between the apparent c and φ obtained by the traditional method and the true information are 130.2% and 7.3%. Furthermore, the shear strength parameters produced using the traditional method have a large scatter, with COV values an order of magnitude higher than the method (2). Considering the large relative error of apparent c and the large variation of the apparent c and φ, one cannot obtain reliable shear strength parameter results based on the traditional method. It should be noted that the shear strength parameters determined by the proposed method have slight biases compared to true information. These kinds of biases are caused by the heterogeneity of rock joints and cannot be ideally eliminated.
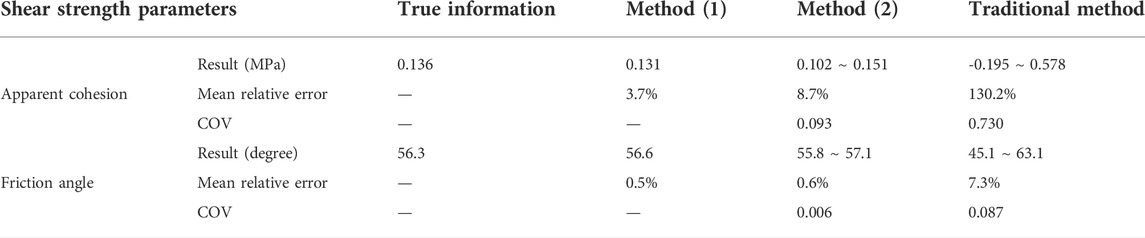
TABLE 2. Shear strength parameters based on different methods.
In addition, the nonlinear shear strength criterion of Xia et al. (2014) was considered to fit the results. As shown in Figure 14, the fitted envelopes based on the five representative specimens present a narrower envelope range than the randomly selected specimens. As expected, the fitted envelopes of the representative specimens are consistent with the envelopes of the most representative specimen and the envelopes of representative shear strength, which demonstrates the efficiency of the determined representative specimens in obtaining reliable shear strength envelopes.
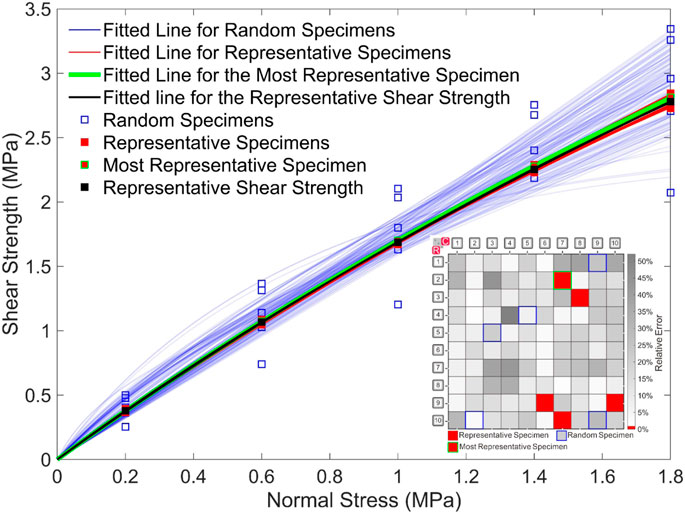
FIGURE 14. Nonlinear shear strength envelopes determined with different methods.
The limits of the traditional sampling method based on visual judgment were explained in this paper, and a representative sampling method for direct shear tests was provided. The study’s key findings are summarized as follows.
The surface roughness and shear strength of rock joints were discovered to exhibit significant spatial variabilities in the case study, and the heterogeneity of joint roughness is accountable for the heterogeneity of shear strength. The acquisition of specimens was generalized in mathematics as a combination problem, and the maximum difference ratios (MDR) of shear strength suggest that the goal of collecting a few specimens with identical features is difficult to attain. The shear strength parameters determined using the traditional sampling method have high COV values, particularly for the apparent cohesion. The MCS analysis reveals that the convergent shear strength parameters may be acquired using the traditional sampling method only if the MCS time exceeds 10,000.
The representative specimens were determined considering the heterogeneity of rock joints under different normal stresses. Representative specimens identified under low normal stress can also present the overall properties of the rock joint under high normal stress, and the number of representative specimens grows as normal stress increases. Comparisons were made among Mohr-Coulomb criterion fitted results obtained by different methods, including the representative shear strength, the most representative specimen, the top five representative specimens, and the traditional method. It is validated that the determined representative specimens can yield trustworthy shear strength parameters with relative errors of less than 10% and COV values of less than 0.1. Furthermore, a nonlinear shear strength criterion was used to fit shear strength values obtained by different methods, demonstrating the efficiency of the representative specimens.
Considering the numerous combinations of rock joint specimens, we demonstrated the proposed representative specimen sampling method based on the relationship between the shear strength and joint roughness. It should be noted that the determination of representative specimens relies on the accuracy of the relationship between the shear strength and joint roughness. Nevertheless, the proposed method can be readily updated in the future when a better shear strength criterion is derived. Experimental studies on the heterogeneity of shear strength of different rock joints will be carried out in future studies. In addition, the scale effect of shear strength will be considered in the representative specimen determination process.
The original contributions presented in the study are included in the article/supplementary material, further inquiries can be directed to the corresponding author.
CW: Conceptualization, data curation, formal analysis, methodology, writing—original draft, validation. RY: Conceptualization, data curation, formal analysis, resources, methodology, writing—original draft, validation, funding acquisition. SD: Conceptualization, visualization, resources, validation, supervision, funding acquisition. ZL: Investigation, writing—review and editing, validation. CH: Writing—review and editing, validation. JY: Writing—review and editing.
This study was supported by the National Natural Science Foundation of China (Nos. 42177117, 41502300, 41427802), the Zhejiang Provincial Natural Science Foundation, China (No. LQ16D020001), and the Engineering Research Center of Rock-Soil Drilling & Excavation and Protection, Ministry of Education (No. 202205).
The authors appreciated the help provided by their friends during the study. We would like to thank reviewers for their suggestions.
The authors declare that the research was conducted in the absence of any commercial or financial relationships that could be construed as a potential conflict of interest.
All claims expressed in this article are solely those of the authors and do not necessarily represent those of their affiliated organizations, or those of the publisher, the editors and the reviewers. Any product that may be evaluated in this article, or claim that may be made by its manufacturer, is not guaranteed or endorsed by the publisher.
SR-C, Specimen label, where R and C represent the row and the column of specimen location; A0, The maximum possible contact area; θ*, The apparent dip angle in the shear direction; θ*max, The maximum apparent dip angle in the shear direction; Aθ*, The potential contact area corresponding to the minimum θ* in the shear direction; C, A dimensionless fitting parameter characterizing the distribution of the apparent dip angles over the joint surface; σt, Tensile stress; φb, The basic friction angle; τ, Shear stress; σn, Normal stress; δs, Shear displacement; τp, Peak shear strength; τpi, The shear strength of the ith rock joint specimen; μ, Population mean; σ, Population standard deviation; c, The apparent cohesion; φ, The friction angle; cm, The mean of the apparent cohesion; cstd, The standard deviation of the apparent cohesion; ϕm, The mean of the friction angle; ϕstd, The standard deviation of the friction angle; COV, Coefficient of variation; MDR, Maximum difference ratio.
Aaron, J., Wolter, A., Loew, S., and Volken, S. (2020). Understanding failure and runout mechanisms of the flims rockslide/rock avalanche. Front. Earth Sci. (Lausanne). 8, 224. doi:10.3389/feart.2020.00224
Abdulai, M., and Sharifzadeh, M. (2018). Uncertainty and reliability analysis of open pit rock slopes: a critical review of methods of analysis. Geotech. Geol. Eng. (Dordr). 37 (3), 1223–1247. doi:10.1007/s10706-018-0680-y
ASTM (2016). Standard test method for performing laboratory direct shear strength tests of rock specimens under constant normal force. West Conshohocken: ASTM International.
Bahaaddini, M., Hagan, P. C., Mitra, R., and Hebblewhite, B. K. (2014). Scale effect on the shear behaviour of rock joints based on a numerical study. Eng. Geol. 181, 212–223. doi:10.1016/j.enggeo.2014.07.018
Bahaaddini, M., Hagan, P. C., Mitra, R., and Khosravi, M. H. (2016). Experimental and numerical study of asperity degradation in the direct shear test. Eng. Geol. 204, 41–52. doi:10.1016/j.enggeo.2016.01.018
Bandis, S., Lumsden, A., and Barton, N. (1981). Experimental studies of scale effects on the shear behaviour of rock joints. Int. J. Rock Mech. Min. Sci. Geomechanics Abstr. 18 (1), 1–21. doi:10.1016/0148-9062(81)90262-X
Barton, N., and Choubey, V. (1977). The shear strength of rock joints in theory and practice. Rock Mech. 10, 1–54. doi:10.1007/bf01261801
Barton, N. (1973). Review of a new shear-strength criterion for rock joints. Eng. Geol. 7 (4), 287–332. doi:10.1016/0013-7952(73)90013-6
Barton, N. (2013). Shear strength criteria for rock, rock joints, rockfill and rock masses: problems and some solutions. J. Rock Mech. Geotechnical Eng. 5 (4), 249–261. doi:10.1016/j.jrmge.2013.05.008
Behnia, M., Nateghpour, B., Tavakoli, J., and Broujerdi, M. S. (2020). Comparison of experimental and empirical methods for estimating the shear strength of rock joints based on the statistical approach. Environ. Earth Sci. 79, 361. doi:10.1007/s12665-020-09080-6
Bista, D., Sas, G., Johansson, F., and Lia, L. (2020). Influence of location of large-scale asperity on shear strength of concrete-rock interface under eccentric load. J. Rock Mech. Geotechnical Eng. 12 (3), 449–460. doi:10.1016/j.jrmge.2020.01.001
Brady, B. H. G., and Brown, E. T. (1993). Rock mechanics: for underground mining. New York, NY: Springer Science & Business Media.
Casagrande, D., Buzzi, O., Giacomini, A., Lambert, C., and Fenton, G. (2017). A new stochastic approach to predict peak and residual shear strength of natural rock discontinuities. Rock Mech. Rock Eng. 51 (1), 69–99. doi:10.1007/s00603-017-1302-3
Du, S.-G., Lin, H., Yong, R., and Liu, G.-J. (2022). Characterization of joint roughness heterogeneity and its application in representative sample investigations. Rock Mech. Rock Eng. 55, 3253–3277. doi:10.1007/s00603-022-02837-4
Duzgun, H. S. B., Yucemen, M. S., and Karpuz, C. (2002). A probabilistic model for the assessment of uncertainties in the shear strength of rock discontinuities. Int. J. Rock Mech. Min. Sci. 39 (6), 743–754. doi:10.1016/S1365-1609(02)00050-3
Fathipour-Azar, H. (2022). New interpretable shear strength criterion for rock joints. Acta Geotech. 17, 1327–1341. doi:10.1007/s11440-021-01442-z
Grasselli, G., Wirth, J., and Egger, P. (2002). Quantitative three-dimensional description of a rough surface and parameter evolution with shearing. Int. J. Rock Mech. Min. Sci. 39 (6), 789–800. doi:10.1016/s1365-1609(02)00070-9
Hencher, S. R., Lee, S. G., Carter, T. G., and Richards, L. R. (2010). Sheeting joints: characterisation, shear strength and engineering. Rock Mech. Rock Eng. 44 (1), 1–22. doi:10.1007/s00603-010-0100-y
JGS (2008). Method for direct shear test on a rock discontinuity. Tokyo: Japanese Geotechnical Society.
Jorda-Bordehore, L., and Herrera, R. (2018). Rapid field test for shear strength characterization of dacite at cerro rico de Potosi (Bolivia): tilt test with a schmidt hammer and compass-clinometer. Bull. Eng. Geol. Environ. 77 (2), 867–875. doi:10.1007/s10064-018-1232-7
Khan, M. Y., Shafique, M., Turab, S. A., and Ahmad, N. (2021). Characterization of an unstable slope using geophysical, UAV, and geological techniques: karakoram himalaya, northern Pakistan. Front. Earth Sci. (Lausanne). 9, 668011. doi:10.3389/feart.2021.668011
Klimeš, J., Novotný, J., Rapre, A. C., Balek, J., Zahradníček, P., Strozzi, T., et al. (2021). Paraglacial rock slope stability under changing environmental conditions, safuna lakes, cordillera blanca Peru. Front. Earth Sci. (Lausanne). 9, 607277. doi:10.3389/feart.2021.607277
Kulatilake, P. H. S. W., Du, S. G., Ankah, M. L. Y., Yong, R., Sunkpal, D. T., Zhao, X. K., et al. (2021). Non-stationarity, heterogeneity, scale effects, and anisotropy investigations on natural rock joint roughness using the variogram method. Bull. Eng. Geol. Environ. 80, 6121–6143. doi:10.1007/s10064-021-02321-3
Kusumoto, S., and Gudmundsson, A. (2014). Displacement and stress fields around rock fractures opened by irregular overpressure variations. Front. Earth Sci. (Lausanne). 2, 7. doi:10.3389/feart.2014.00007
Lee, Y.-K., Kim, J., and Song, J.-J. (2022). Estimation of rock joint diameter distribution using numerically generated joint center volume. Bull. Eng. Geol. Environ. 81 (7), 291. doi:10.1007/s10064-022-02764-2
Magner, K., Maerz, N., Guardiola, I., and Aqeel, A. (2017). Determining optimum number of geotechnical testing samples using Monte Carlo simulations. Arab. J. Geosci. 10, 406. doi:10.1007/s12517-017-3174-y
Mehrishal, S., Sharifzadeh, M., Shahriar, K., and Song, J.-J. (2016). An experimental study on normal stress and shear rate dependency of basic friction coefficient in dry and wet limestone joints. Rock Mech. Rock Eng. 49 (12), 4607–4629. doi:10.1007/s00603-016-1073-2
Muralha, J., Grasselli, G., Tatone, B., Blümel, M., Chryssanthakis, P., and Jiang, Y. (2014). ISRM suggested method for laboratory determination of the shear strength of rock joints: revised version. Rock Mech. Rock Eng. 47 (1), 291–302. doi:10.1007/s00603-013-0519-z
Niktabar, S. M. M., Rao, K. S., and Shrivastava, A. K. (2017). Effect of rock joint roughness on its cyclic shear behavior. J. Rock Mech. Geotechnical Eng. 9 (6), 1071–1084. doi:10.1016/j.jrmge.2017.09.001
Paixão, A., Muralha, J., Resende, R., and Fortunato, E. (2022). Close-range photogrammetry for 3D rock joint roughness evaluation. Rock Mech. Rock Eng. 55, 3213–3233. doi:10.1007/s00603-022-02789-9
Prassetyo, S. H., Gutierrez, M., and Barton, N. (2017). Nonlinear shear behavior of rock joints using a linearized implementation of the Barton–Bandis model. J. Rock Mech. Geotechnical Eng. 9 (4), 671–682. doi:10.1016/j.jrmge.2017.01.006
Renaud, S., Saichi, T., Bouaanani, N., Miquel, B., Quirion, M., and Rivard, P. (2019). Roughness effects on the shear strength of concrete and rock joints in dams based on experimental data. Rock Mech. Rock Eng. 52 (10), 3867–3888. doi:10.1007/s00603-019-01803-x
Rullière, A., Rivard, P., Peyras, L., and Breul, P. (2020). Influence of roughness on the apparent cohesion of rock joints at low normal stresses. J. Geotech. Geoenviron. Eng. 146 (3), 04020003. doi:10.1061/(asce)gt.1943-5606.0002200
Saadat, M., and Taheri, A. (2020). A numerical study to investigate the influence of surface roughness and boundary condition on the shear behaviour of rock joints. Bull. Eng. Geol. Environ. 79, 2483–2498. doi:10.1007/s10064-019-01710-z
Tang, H., Yong, R., and Ez Eldin, M. A. M. (2016). Stability analysis of stratified rock slopes with spatially variable strength parameters: the case of qianjiangping landslide. Bull. Eng. Geol. Environ. 76 (3), 839–853. doi:10.1007/s10064-016-0876-4
Tatone, B. S. A., and Grasselli, G. (2014). Characterization of the effect of normal load on the discontinuity morphology in direct shear specimens using X-ray micro-CT. Acta Geotech. 10 (1), 31–54. doi:10.1007/s11440-014-0320-5
Thirukumaran, S., and Indraratna, B. (2016). A review of shear strength models for rock joints subjected to constant normal stiffness. J. Rock Mech. Geotechnical Eng. 8 (3), 405–414. doi:10.1016/j.jrmge.2015.10.006
Wang, C. S., Wang, L. Q., and Karakus, M. (2019). A new spectral analysis method for determining the joint roughness coefficient of rock joints. Int. J. Rock Mech. Min. Sci. 113, 72–82. doi:10.1016/j.ijrmms.2018.11.009
Wu, Q., Jiang, Y. F., Tang, H. M., Luo, H. M., Wang, X. H., Kang, J. T., et al. (2020). Experimental and numerical studies on the evolution of shear behaviour and damage of natural discontinuities at the interface between different rock types. Rock Mech. Rock Eng. 53 (8), 3721–3744. doi:10.1007/s00603-020-02129-9
Xia, C. C., Tang, Z. C., Xiao, W. M., and Song, Y. L. (2014). New peak shear strength criterion of rock joints based on quantified surface description. Rock Mech. Rock Eng. 47 (2), 387–400. doi:10.1007/s00603-013-0395-6
Keywords: rock joint, shear strength, roughness, heterogeneity, representative specimen
Citation: Wang C, Yong R, Du S, Luo Z, Huang C and Ye J (2022) Representative sampling method for laboratory testing on shear strength of rock joints. Front. Earth Sci. 10:974455. doi: 10.3389/feart.2022.974455
Received: 21 June 2022; Accepted: 02 August 2022;
Published: 30 August 2022.
Edited by:
David Johnny Peres, University of Catania, ItalyCopyright © 2022 Wang, Yong, Du, Luo, Huang and Ye. This is an open-access article distributed under the terms of the Creative Commons Attribution License (CC BY). The use, distribution or reproduction in other forums is permitted, provided the original author(s) and the copyright owner(s) are credited and that the original publication in this journal is cited, in accordance with accepted academic practice. No use, distribution or reproduction is permitted which does not comply with these terms.
*Correspondence: Rui Yong, eW9uZ3J1aUBuYnUuZWR1LmNu
Disclaimer: All claims expressed in this article are solely those of the authors and do not necessarily represent those of their affiliated organizations, or those of the publisher, the editors and the reviewers. Any product that may be evaluated in this article or claim that may be made by its manufacturer is not guaranteed or endorsed by the publisher.
Research integrity at Frontiers
Learn more about the work of our research integrity team to safeguard the quality of each article we publish.