 Rossana Serandrei-Barbero1,2
 Sandra Donnici
- 1Formerly ISMAR—Institute of Marine Sciences, CNR—National Research Council of Italy, Venice, Italy
- 2Formerly Comitato Glaciologico Italiano, Torino, Italy
- 3IGG—Institute of Geosciences and Earth Resources, CNR—National Research Council of Italy, Padova, Italy
- 4ISP—Institute of Polar Sciences, CNR—National Research Council of Italy, Padova, Italy
- 5Department of Electrical Engineering, Persian Gulf University, Bushehr, Iran
The behavior of the valley glaciers of the Italian Alps as a result of the climate changes expected for the 21st century has been investigated. From 1980 to 2017 the average length reduction of these glaciers has been 13% and their average areal reduction was around 22%. The mean climate sensitivity of the considered glaciers is 410 mK−1 and their mean observed shortening was about 500 m for a temperature increase of 1.4°C. To quantify the valley glacier life expectancy, a model estimating their length variations from the air temperature variations of the EuroCordex climatological projections of six different models under the RCP4.5 and RCP8.5 scenarios has been used. The ensemble mean temperatures in the Italian Alps region under these scenarios indicate increases in the temperature of ∼2°C and ∼4°C from 2018 to 2100 respectively. The glacier projections are mean values, taking into account the errors due to the model (6–16%) and the different climatological forcings (up to 20–30%). Under the RCP4.5 scenario, the glacier model projections show a constant retreat until the 2080s, with a weakening around 2090s and the 87% of glaciers surviving. Under the RCP8.5 scenario, only three glaciers could reach the end of the century, while 80% of them will probably disappear between the 2060s and the 2080s.
1 Introduction
The fluctuations of glacier fronts are mainly due to their response to year-to-year variability of the air temperature and precipitation. This variability alone can explain kilometric variations in length on a secular scale also in constant climatic conditions (Roe, 2011). The retreat rate of the last decades leaves no doubt about the incidence of the current climate anomaly and focuses interest on the behavior of glaciers and the incidence of different morphometric factors on their shrinkage (e.g., Charalampidis et al., 2018). The highly variable response of glaciers to climate changes involves changes in length, area and flow velocity that complicate the assessment of future glacier behavior (Carturan et al., 2013). The acceleration shown by the glacial retreat in recent decades also raises new questions about the glacier life expectancy also regarding the influence of their geometry on their response to climate variations.
In recent decades, the response of glaciers to the rise in temperature since the 1980s has been analyzed using models that use the concept of climatic sensitivity (i.e., the relation between glacier length decrease and temperature increase) and attribute to temperature the role of the main forcing (Oerlemans, 2005; Oerlemans, 2012). Models frequently use mass balance (Brown et al., 2010; Braithwaite et al., 2013; Christian et al., 2018), but a generalization of the glacier behavior, and more specifically how the glaciers respond to the climatological variations, seems also obtainable through models dealing with the glacier length variations, given the large amount of data that are collected annually at their terminus, at present available at the World Glacier Monitoring Service (2017 and earlier reports). For this reason, several studies on the Alps have analyzed the effects of climate changes on glacier snout fluctuations (Calmanti et al., 2007; Bonanno et al., 2014; Nigrelli et al., 2015; Peano et al., 2016).
According to Oerlemans (2011) a first order linear differential equation linking the glacier snout to air temperature fluctuations is the simplest approach to reproduce climatic changes such as those observed in the Alps. Similar versions of this model have been proposed by Jóhannesson et al. (1989) and by Roe and O’Neal (2009): the both describe the glacier’s tendency toward a new equilibrium following a climate perturbation throughout the same differential equation.
The application of the model proposed by Oerlemans (2005) to the Tauern Alps glaciers (Eastern Italian Alps), obtained after a recalibration of the climate sensitivity and response time, verified its ability to reproduce the retreat of the glacier fronts even for the glaciers for which length fluctuations data are not available (Zecchetto et al., 2017). In the Tauern Alps in the last 35 years, the frontal retreat of valley glaciers has been less than that of mountain glaciers and this lower climatic sensitivity is also reflected in the projections provided by the model, which are less dramatic for the valley glaciers with respect to mountain glaciers (Serandrei-Barbero et al., 2019). The present work extends these analyses to all the valley glaciers located on the Italian side of the Alps from 2023 to 2100. It is aimed to study their future behavior in terms of their length reduction under the increase of air temperature according to mid-range and high-end scenarios, i.e., the Representative Concentration Pathways (RCPs) RCP4.5 and RCP8.5 scenarios.
2 The data
The data presented in this section are of two kinds: the observed data, available from 1980 to 2017, which include the glaciers’ snout positions and the air temperatures and precipitation at annual frequency, and the climatological model data derived from the Euro-Cordex projections until 2100.
2.1 The glacier data
Given the subjectivity of the primary glacier classification and the possible transition of some glaciers to a different typology due to their severe recent decline, this study examines only the Italian glaciers classified as valley glaciers, i.e., glaciers flowing down a valley and in consequence having a distinct tongue (Cogley et al., 2011). Although some other Italian glaciers are defined as valley glaciers in literature (see for example Bonanno et al., 2014), those classified as valley glaciers in the Italian Glacier Inventory (Smiraglia and Diolaiuti, 2015) represent 3% of the totality, that is 25 glaciers (96.06 km2) compared to a total of 901 glaciers (369.86 km2), 57% being mountain glaciers and 40% glacierets. Valley glaciers are few, but their length variations are measured for a long time; the presence of the valley tongue, generally easily accessible, and their frequent large dimensions favored their choice for the annual measurements, i.e., the distance year to year between some points of the glacier terminus and the corresponding fixed landmarks on the ground. The 25 glaciers reported as valley glaciers by Smiraglia and Diolaiuti (2015), are mapped in Figure 1, which reports their position along with that of the in situ meteorological stations providing air temperature and precipitation. The area including them is a part of the Alps of about 700 km in longitude and 200 km in latitude. Among them, three glaciers have been discarded from the analysis: the Miage glacier is a debris-covered glacier, the front of which is inaccessible; the Belvedere glacier between 2001 and 2005 was traveled by a surge, a phenomenon believed to be cyclical (Van de Wal and Oerlemans, 1995); the Predarossa glacier is split since 1993 into two sectors at different altitudes and scarcely connected to the sides of a rocky outcrop: an upper-altitude sector seems active as a probable circus glacier, a lower-altitude sector, extended along the slopes on the orographic left, is fed by avalanche and classifiable as slope glacier. The splitting of the Predarossa Glacier is part of the ongoing glacier fragmentation in the Alps. On the Italian Alps, between 1960 and about 2010 the increase of 67 glaciers occurred with a loss of glacierized area equal to 156.96 km2, corresponding to about 30% (Smiraglia and Diolaiuti, 2015).
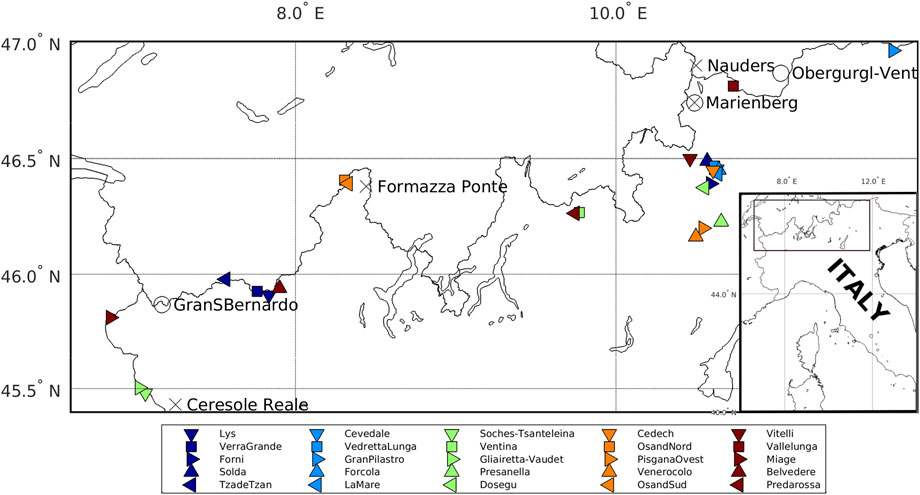
FIGURE 1. The position of the glaciers and in situ climatological stations considered in this work. Circles indicate the stations providing air temperature, crosses the precipitation.
For the considered 22 valley glaciers, the annual ground measurements of snout fluctuations collected by the Italian Glaciological Committee are available since the 70s of the last century, that is, from the beginning of the last positive fluctuation before the current retreat. Through the annual reports of these measurements (Comitato Glaciologico Italiano, 1981–2018), the length and slope of the considered glaciers were updated to 2017. Only at the front of glaciers Osand Sud, Vitelli, and Vallelunga, the measurements are so few that these glaciers have to be considered as unmeasured (Table 1).
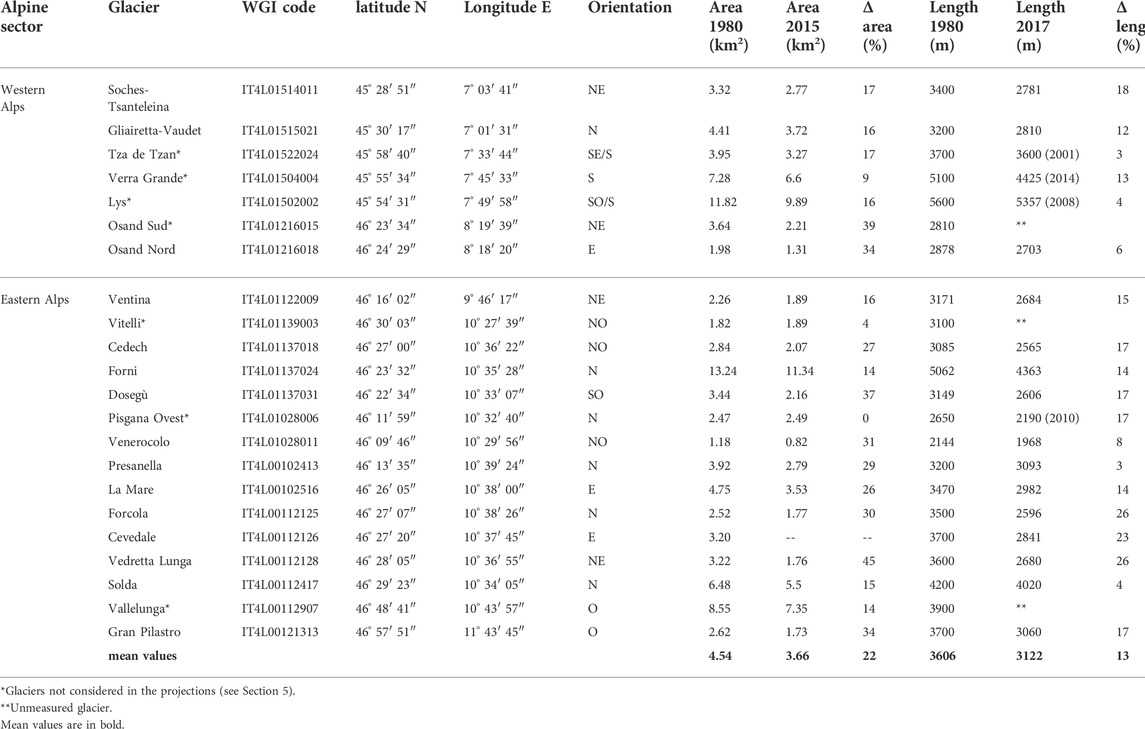
TABLE 1. Main parameters of the 22 valley glaciers considered. The slope is the angle between the glacier surface and the horizon.
Finally, for four glaciers, snout measurements stopped before 2017 due to major morphological changes induced by the predominant processes of down-wasting during the early 21st century: on the Tza de Tzan glacier the measurements at the front stopped in 2001 with the emergence of the rocky escarpment which prevents the feeding of the tongue and converts the valley glacier into a hanging glacier; for the Lys Glacier, snout measurements stopped in 2008 when the valley tongue separated from the feeder basin; on the Pisgana glacier, since 2011 the tongue has been interrupted by a rocky outcrop that limits its feeding; the Verra Grande glacier tongue is not accessible since 2014 for the repositioning of the glacier terminus above a rocky outcrop. These are almost all south-facing glaciers, for which the aspect seems to have favored the predominant down wasting processes during the early 21st century. Table 1 shows the main morphometric parameters of the 22 valley glaciers considered. The glacier length and area data were collected on the ground between the end of the 70s and the early 80s during the campaigns for the compilation of the World Glacier Inventory (WGMS et al., 2017 and earlier reports) and 1980 constitutes the reference year for the length, area and slope values. The data collected for the WGI include the accuracy rating, expressed with a number from 1 to 5, relating to the area, volume and elevation data of each glacier. For the glaciers considered, the accuracy rating values are 1 (excellent), 2 (good) or 3 (fair) and define the reported data as reliable. The lengths in 2017 are from the annual field measurements of Comitato Glaciologico Italiano (1981–2018) starting from 1980 lengths. The accuracy rating is not reported in the systematic field survey at the glacier fronts, whose displacement are rounded to half a meter. The 2015 area values are derived from orthophotos or satellite images taken between 2007 and 2011 (Smiraglia and Diolaiuti, 2015).
2.2 The meteorological data
The air temperature and total precipitation used in this work are both historical and forecast data. The former, obtained from the HISTorical instrumental climatology surface time series of the greater ALPine region (HISTALP, www.zamg.ac.at/histalp/, Auer et al., 2007), are available from 1980 to 2014. The stations selected are positioned between 1300 m and 2470 m of altitude: their location is reported in Figure 1, with circles and crosses.
Figure 2 reports the historical time series of temperature fluctuations (left panel) and annual total precipitation (right panel) derived from the data of the available stations; the latter sorted for their longitudinal location. The temperature fluctuations, i.e., the temperature values with respect to their mean, exhibit a similar trend, an increase of about 1.4°C in the period 1980–2015, while the total precipitation shows no trends but larger values in the western than in the eastern part of the region under study. Total precipitation data have been used to compute Cs and τ (see Section 3, Eqs. 2–3 for all the glaciers.
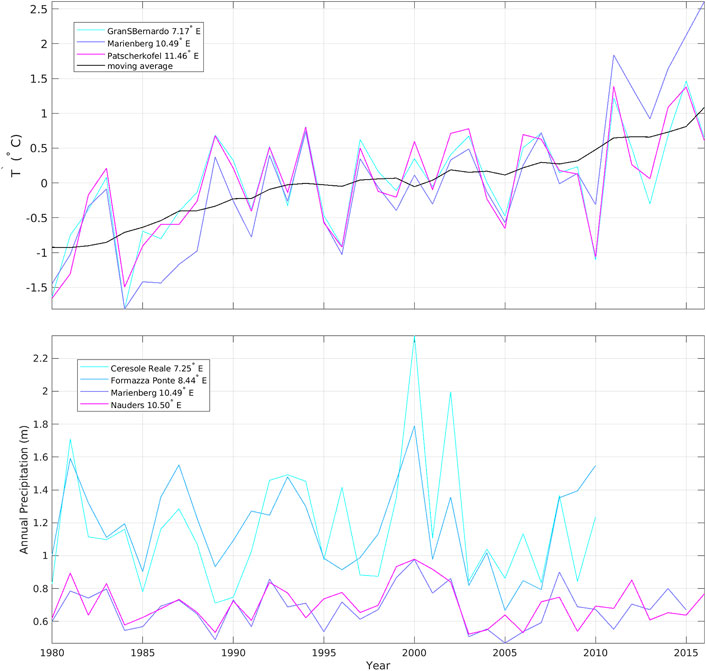
FIGURE 2. Time series of experimental air temperature variations (top panel) and annual total precipitation (bottom panel) from the in situ stations available.
The atmospheric climatological model data used are the Euro-Cordex (Jacob et al., 2014) (https://euro-cordex.net/) temperature and precipitation projections of the climatological Representative Concentration Pathways (RCPs) RCP4.5 and RCP8.5 scenarios. The Euro-Cordex are regional climate model simulations for the European domain with a resolution of 0.11° (EUR-11, ∼12.5 km). The two climatological scenarios are based on greenhouse gas emissions corresponding to the stabilization of radiative forcing after the 21st century at 4.5 W/m2 (RCP4.5), rising radiative forcing crossing 8.5 W/m2 at the end of the 21st century (RCP8.5) (Nakićenović et al., 2000; Van Vuuren et al., 2008; Moss et al., 2010). Six different regional climatological models providing air temperature and total precipitation, i.e., CCLM4-8–17.v1 (Rockel et al., 2008), HIRHAM5.v3 (Christensen et al., 1998), Racmo2.2 (Van Meijgaard et al., 2012), RCA4.v1 (Samuelsson et al., 2011), WRF (Skamarock et al., 2008), and REMO 2009 (Jacob et al., 2012), have been used in order to derive ensemble averages of the glacier future length variations. In the following, we will refer as ensemble averages the mean of the time series from the different climatological models.
3 The glacier model
The glaciers of the Italian Alps studied in this work were regularly observed through measurements of their annual snout position: the main parameters describing their morphological characteristics, i.e., the slope and length, are known but other important parameters such as their ice thickness are unknown. This limited drastically the choice of the glacier model to use for the climatological projections: in fact, the available glacier (slope, length, and snout fluctuations) and meteorological (precipitation and air temperatures) experimental data led us to address the model proposed by Oerlemans (2005), simply relating the glacier length fluctuations L′(t) to the air temperature T′(t) fluctuations. Other more sophisticated glacier models, such as that by Roe and O'Neal (2009), cannot be applied to the valley glaciers of the Italian Alps essentially because the ice thickness is not available. The model adopted in this work writes as
where Cs is the climate sensitivity (m K−1) and τ is the glacier response time (year), L′(t) (m) is the variation in the glacier length with respect to its average value over the period considered. The climate sensitivity Cs is defined as
where
where the constant
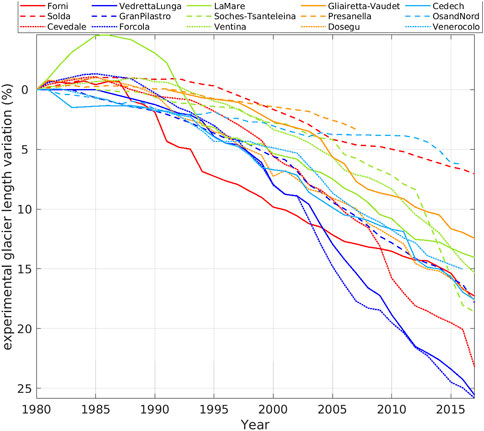
FIGURE 3. Observed length variation between 1980 and 2017 of the glaciers projectable under future scenarios. The colours are sorted from the longest (red) to the shortest (light blue) glacier.
The model can be used (Oerlemans, 2011; Leclercq and Oerlemans, 2012) if
where
Cs and τ are not constant, because they depend, among others, from the variations of Pann, In Oerlemans (2005) model formulation, the only time dependent variables are L’ and T’, and Cs and τ seem constant. In this paper, both seem have been treated as time dependent, as they should be, but in Leclercq and Oerlemans (2012), they have been assumed as constants (p. 1069). To clarify this aspect, we modified the original formulation of Oerlemans (2005) reported in Eq. 1 allowing variations of Cs and τ with time though the variations of the annual mean precipitation Pann (already implicit in the Oerlemans, 2005 model) and of the characteristic glacier length
In the climatological projections spanning long periods, it is unlikely that the values of mean annual precipitation are constant with time; also the representative glacier length
a first order non-linear differential equation of the type
with
where
In the climatological projections, we have used Eq. 5, solved numerically using the well-established Runge-Kutta method (Atkinson, 1989).
4 Glaciers retreat until 2017
Compared to 1980, the length of valley glaciers in 2017 shows an average contraction of 13% (about 500 m). The average area reduction was 22% (0.88 km2) for a total loss of 19.36 km2.
Among the considered glaciers (Table 1), Tza de Tzan, Verra Grande, Lys, and Pisgana Ovest glaciers underwent morphological variations before 2017 (Section 2.1); they cannot be anymore considered valley glaciers and consequently will be not considered in the projections. Figure 3 reports the observed retreat from 1980 to 2017 of the measured glaciers which can be projected under future scenarios: all exhibit a continuous shrinkage since 1990, but with very different rates. Three different behavior are highlighted: Osand Nord, Presanella, and Solda glaciers show a length loss of around 5%; Forcola, Cevedale, and Vedretta Lunga glaciers lose about 25% of their length; the majority of glaciers shrink by about 15% of their 1980 length. Within these three glacier groups, the morphometric characteristics do not show significant differences in the variability range of length, elevation, and slope, as well as the exposure, for all E or NE.
The accentuated differences in the size of the length loss could lie in the way the valley tongue is fed. The Presanella and Solda glaciers seem to benefit from a greater supply: on the Solda glacier the contribution of avalanches is added to the direct precipitations and the valley tongue of the Presanella glacier is fed by two distinct accumulation basins that flow into the tongue. A confirmation of the possible influence of the methods of feeding the tongue is suggested by the particular morphology of the Forcola and Cevedale glaciers, characterized by a small accumulation basin due to the morphology of the slopes.
Table 1 provides an overview of the length and area variations that occurred between 1980 and 2017.
These experimental values have been compared with the modelled results obtained from the calibration of the model. For the measured glaciers, Table 2 provides the Cs values obtained from Eq. 2 after calibration. The climate sensitivity Cs ranges between 94 mK−1 (Osand Nord glacier) and 784 mK−1 (Verra Grande glacier) with a mean value of 410 m K−1. The glacier response time τ obtained from Eq. 3 is ≤ 3 years.
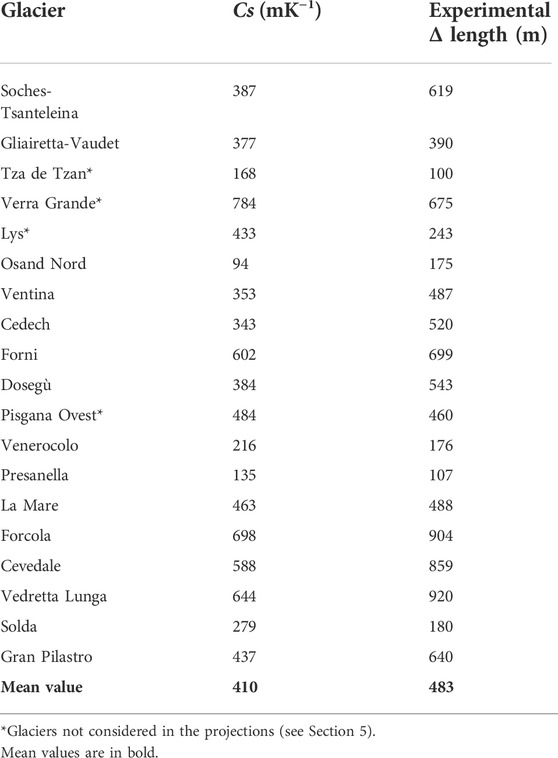
TABLE 2. Climate sensitivity (Cs) and experimental Δ length between 1980 and 2017 of the measured glaciers.
5 Glaciers projections to 2100
The ensemble air temperature anomalies at the glaciers position are reported in Figure 4 for the two scenarios considered. While for the milder RCP4.5 there will be a rise in temperature of about 1.6°C from 2023 to 2086 and then a light decrease to 2100, RCP8.5 indicates an increase of about 4.5°C from 2023 to 2095, followed by a slight decrease of some tenths of a degree. The mean increase of temperature is 0.020 ± 0.014 °Cy-1 and 0.053 ±0.017 °Cy-1 respectively.
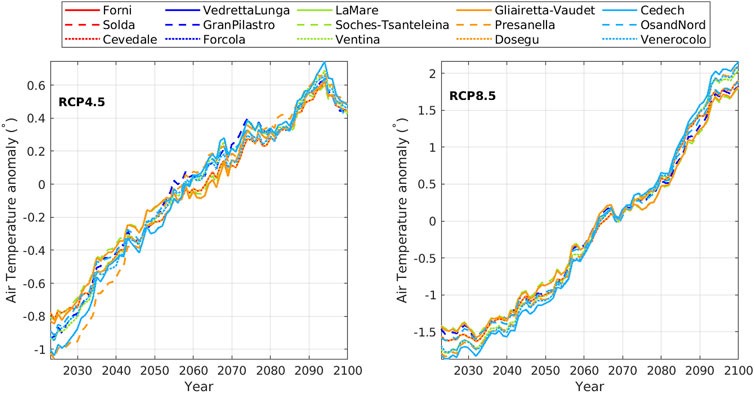
FIGURE 4. The ensemble air temperatures variations over the six regional models at the grid points closest the glaciers position from 2023 to 2100. Left panel: RCP4.5 scenario. Right panel: RCP8.5 scenario. The colours are sorted from the longest (red) to the shortest (light blue) glacier; due to the proximity of some glaciers, some curves overlap.
In some periods, such as from 2023 to 2040 and from 2080 to 2100, the air temperature variations T′ vary significantly (∼ 0.3°C) according to the glacier position.
Climatological glacier lengths have been obtained by forcing the glacier model (Eq. 5) with the annual air temperature variations and the total precipitation derived by each of the six atmospheric climatological models chosen (see Section 2.2) at the grid point closest to the glacier location.
The results are shown as ensemble means, derived by averaging the glacier length variations obtained from each atmospheric climatological model.
The ensemble values of
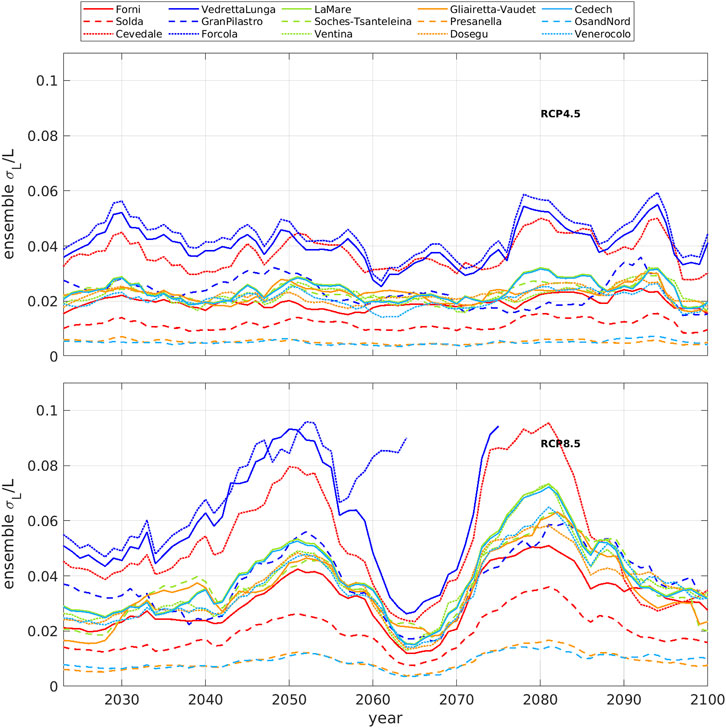
FIGURE 5. Ensemble values of
The percent glacier length variations are mean values, subject to errors due to the model and to the different climatological forcing used in the projections. In Section 3, the RMS difference between experimental and modelled glacier length ranges between 6% and 16%, according to the glacier. The mean percentage error due to the six different climatological forcings has been estimated for each glacier computing the RMS of the projections resulting from the different forcings. The total error, i.e., that due to the model used and that due to the different forcing, has been derived as the root square of the sum of their squared values, considered as independent errors: this is shown in Figure 6. The total percent error results different for each glacier but substantially stable until the 2050s, with similar values (mean value of 8%+-2%) for both scenarios. Afterward, it increases since the 2080s for RCP4.5 and since the 2060s for RCP8.5, reaching values of 20% and 30% at the end of the century for some glaciers. The mean value of the total error in the last 10 years of the century is 11% for RCP4.5 and 16% for RCP8.5. This total error has been used in deriving the percent glacier length variations until 2100. These have been obtained by averaging the projections derived by every single climatological model respecting the constraint of Eq. 4 (see Figure 5), taking only the ensemble glacier length variations that, summed to the total error estimates, are less than 50% of the original glacier length. This limit value is arbitrary: due to the medium size of the considered glaciers (about 3000 m in length), a length loss >50% could probably imply the loss of the tongue with a transformation of their morphology.
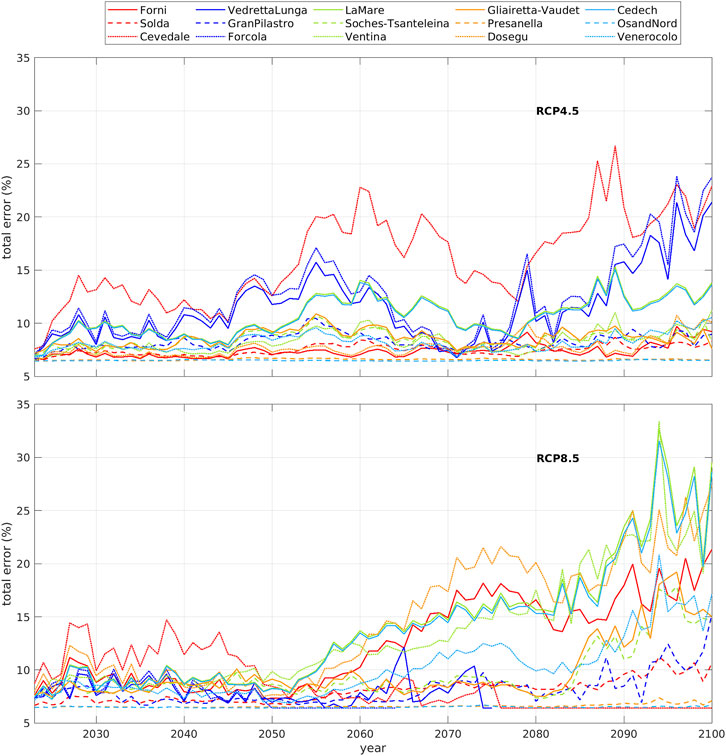
FIGURE 6. Total uncertainty due to the different climatological forcing and to the model error (RMSd) estimated for each glacier.
Figure 7 reports the ensemble glacier length variations in percent from 2023 to 2100 under the RCP4.5 (top panel) and RCP8.5 (bottom panel) scenarios for each glacier whose variations do not exceed 50% of their 2023 length.
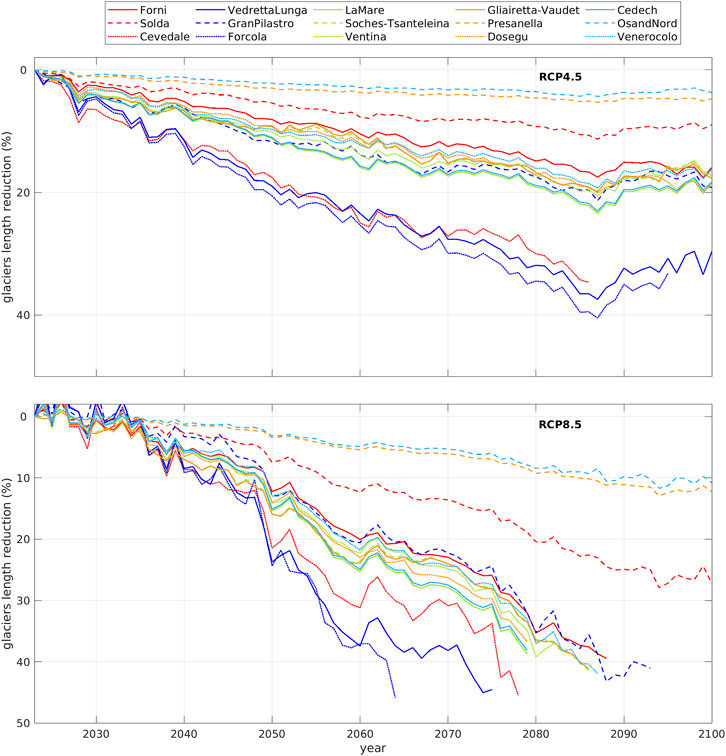
FIGURE 7. The percent glaciers length variations derived from climatological projections from 2023 to 2100. Top panel: RCP4.5 scenario. Bottom panel: RCP8.5 scenario. The colours are sorted from the longest (red) to the shortest (light blue) glacier.
For the RCP4.5 scenario, only one glacier, the Cevedale, cannot be projected until 2100 because since the late 2080s it exceeds 50% of variations.
For the RCP8.5 scenario, instead, the total error discussed above prevents projecting the glacier length until 2100 for 12 glaciers over 15.
Considering the glaciers projectable until 2100, in the RCP4.5 scenario there is a constant retreat until the 80s of this century, weakening towards the end of the century, with a length loss between 5% and 30%. Under the most severe RCP8.5, Forcola, Vedretta Lunga, and Cevedale glaciers are seen to survive, at least as valley glaciers, only until the 2060s and the 2070s respectively. All the others, except Osand Nord, Solda, and Presanella reaching 2100, seem to disappear in the 2080s.
6 Discussion
Studies dealing with alpine glaciers generally group them based on their geographic location (Carturan et al., 2013; Fischer et al., 2015 among others) or their size (DeBeer and Sharp, 2009; Huss and Fischer, 2016) while their primary classification, as valley vs. mountain glaciers, is not considered, which seems to have some influence on the climatic sensitivity.
On the valley glaciers, from 1980 to 2017 the mean length loss is 13%. Their average areal shrinkage of 22% between 1980 and 2015 (Table 1). In the same period on the Italian side of the Alps, the glacierized area loss was 238.66 km2 corresponding to 39% with respect to the 1980 glacierized area (Smiraglia and Diolaiuti, 2015) in agreement with the severe glacier shrinkage observed in the European Alps in the last decades (Paul, 2002; Zemp et al., 2006; Lambrecht and Kuhn, 2007; Knoll and Kerschner, 2009; Nigrelli et al., 2015; Zemp et al., 2015).
In the Eastern Alps, a previous comparison between valley and mountain glaciers belonging to the same size classes highlighted the lower retreat of valley glaciers (Serandrei-Barbero et al., 2019). All the 22 valley glaciers considered in this paper have an area > 1 km2, except one, while 90% of the glaciers in the Italian Alps (812 glaciers) have areas < 1 km2. In general, larger glaciers show regresses inversely proportional to their size (Serandrei-Barbero et al., 1999; Paul et al., 2004; Paul et al., 2011; Diolaiuti et al., 2012; Carturan et al., 2013); this could significantly contribute to their expected minor retreat. However, on the valley glaciers considered here, it does not seem to be any relationship between size and frontal retreat as it can be inferred from Figure 3, which reports past percent retreats sorted according to the glacier size.
The frontal variations, as shown in Section 3, result influenced by the slope, in accordance with Hoelzle et al. (2003) and Huss and Fischer (2016), the latter describing values of Cs and τ generally higher on gently sloping glaciers which slow down the feeding of the valley tongue. On the valley glaciers considered in this study, the short τ values obtained, ≤ 3 years, seem due to the glacier steepness and they agree with the response time of 2–4 years pointed out for valley glaciers like Kesselwandferner Glacier and Palù Glacier on the northern side of the Eastern Alps (Oerlemans 2007; Oerlemans 2012); in this regard, it should be remembered that, although in the last years the Palù glacier has visibly changed shape, with the almost total disappearance of the valley tongue, it was still present in the years considered by Oerlemans to estimate the response time.
The results of the glacier’s shrinkage due to the simulated changes of air temperature and total precipitation as foreseen by six atmospheric models under the RCP4.5 and RCP8.5 climatological scenarios result slightly modulated (2%) by the variations of the climatological total precipitation which enters in the definition of the glacier sensitivity Cs and response time τ.
Under the RCP4.5 scenario, the majority of the glacier simulated projections satisfies the constraint that the glacier variations are much smaller than the glacier length (Eq.4), thus longer preserving the present glacier morphology; the results of the model show length reduction between 5% and 30% (Figure 7), with a mean value of 19%. Under the most severe scenario RCP8.5, only three glaciers reach 2100 with a length loss < 30%, while all the other glaciers cannot be modeled since the 1980s due to shrinkage close to 50% with possible loss of their characteristics of valley glaciers.
The climatological results show a behavior similar to that observed in the period 1980–2017: Osand Nord, Presanella, and Solda glaciers undergo a small shrinkage, <10% under the RCP4.5 scenario and around 20% under the RCP8.5 scenario; Forcola, Cevedale and Vedretta Lunga retreat by 30% under the RCP4.5 scenario, while under the RCP8.5 scenario they cannot be modeled beyond the 60s and 70s; the other nine glaciers decrease by about 20% under the RCP4.5 scenario, while under RCP8.5 they are no longer modelable since the 1980s and their behavior confirms what indicated in the literature for the majority of glaciers in the Alps.
Glaciers behave differently under the same climatological forcing: these differences are possibly due to the values of Cs and τ of each glacier and, in consequence, to their characteristic length and slope, as well as to the annual total precipitation in the glacier site. The results of the model should be considered as first-order estimates, even because it cannot account for the changes introduced by positive feedbacks, such as the decrease in albedo and the thermal emission from increasing rocky outcrops, as well as possible negative feedbacks, such as the contribution of avalanches or the increasing debris cover or shaded area. The results obtained however are consistent with the estimates in the literature.
The observed reduction in length of 13% between 1980 and 2017, corresponds to an area loss of 22%. For the modelled average length loss of 19% obtained under the RCP4.5 scenario, the estimate based on the scaling relationship between glacier area and length derived for the mid-latitudes glacier regions (Machguth and Huss 2014) indicates for 2100 an average area loss of about 27% (0.98 km2).
On the glaciers of the European Alps, the projections for the end of the century indicate volume losses between 75% and 89% under RCP4.5 and between 90% and 98% under RCP8.5 (Marzeion et al., 2012; Radic et al., 2014; Huss and Hock 2015; Zekollary et al., 2019) with the possible disappearance between 69% and 92% of all the glaciers in the Alps (Žebre et al., 2020). Both mountain and valley glaciers are included in this severe estimate, but the behavior of the few valley glaciers is undetectable from that of the great majority of alpine glaciers.
A comparison is instead possible with the projections of some glaciers on the southern side of the Alps: on the Italian Western Alps, on 14 glaciers considered as valley glaciers by Bonanno et al. (2014), the mean length loss projected to 2050 is quantified in 300–400 m compared to the 2010 length with the RCP4.5 scenario, with larger retreats under the RCP8.5 scenario. Even though these glaciers are smaller (mean area 2.79 km2) than the glaciers considered in the present study (mean area 3.66 km2), their projected retreat is consistent with the average retreat of 10% (about 300 m) and 15% (about 450 m), expected for valley glaciers in 2050 under RCP4.5 and RCP8.5 respectively (Figure 7). The smaller decline of the valley glaciers with respect to the totality of Alpine glaciers is also confirmed by the comparison with the projections of Peano et al. (2016): on the studied mountain glaciers in the Italian Western Alps, the expected average length shrinkage in 2100 under the future scenario RCP4.5 is 47% with respect to the 19% loss for valley glaciers here considered. This does not happen under the most severe conditions of the scenario RCP8.5: starting from the 1960s, the rapid decline of valley glaciers heralds the disappearance of almost all glaciers, conforming to what is foreseen in the literature for the generality of glaciers in the Alps.
It has been suggested that, in the coming decades, only the few, largest glaciers will be in a condition to survive (Citterio et al., 2007). But, within the limits of the temperature increase expected under scenario 4.5, glacier size and typology could both play a role in the glacier retreat.
7 Conclusion
Although the literature indicates that the majority of glaciers will disappear in the coming decades, the valley glaciers seem able to better resist the changing climate.
Between 1980 and 2017 the valley glaciers of the Italian Alps lost on average 13% of their length and 22% of the surface, a much lower value than the general retreat of the glaciers of the Alps. By 2100, the model projection under the RCP4.5 climatological scenario indicates for these glaciers a general survival with a shortening between 5% and 30%, lower values than the expected retreat of the majority of glaciers in the Alps, as reported in the literature. Under the RCP 8.5 scenario, the considered glaciers resist at least until 2060. After this date, part of them are no longer projectable because they do not satisfy Eq. 4 or because they exhibit variation exceeding the 50%: for all these glaciers the persistence of their morphology as valley glaciers is uncertain.
The differences in observed length reductions are up to 20% in the last 40 years. In the projections, for the next 40 years, the differences are up to 20% for the RCP4.5 scenario, consistent with those observed, while under the most severe RCP8.5 scenario the difference raises to 35%.
Summarizing our results: a) given the form of the model used, the main forcing is the air temperature variation, while total precipitation changes have a weak impact on the results; b) the impact of different atmospheric climatological models on the error of the simulated results is time-dependent, larger towards the end of the century, reaching values of 20% and 30% for RCP4.5 and RCP8.5 respectively; c) under the RCP4.5 scenario the model mean shortening is 19% from 2023 to 2100, suggesting that the valley glaciers will probably resist the climate change maintaining their characteristics of valley glaciers; d) under the RCP8.5 scenario, only three of the valley glaciers seems to resist the climate change, while the majority will undergo to such a morphological changes preventing to consider them as valley glaciers.
The simulated glacier retreats have been derived by a glacier model that does not account for possible non-linear effects and consequent geometric changes: possible disintegration and down wasting could deliver some of the valley glaciers to the typology of mountain glaciers, threatened by a much more pronounced retreat. Moreover, progressive glacier shrinkage and fragmentation will lead to a general increasing glacier melt, even under the same climatic conditions, with expected heavy implication to future water resource potential.
Although the effect of climate change indicates a severe ice masses decline for the Alps, due to the minor retreat of the valley glaciers in the last 40 years with respect to the generality of the alpine glaciers, the model suggests that the valley glaciers are less sensitive to the air temperature and precipitation. Their slow retreat will be conditioned by the anthropic pressure: only under the RCP4.5 scenario the limited length losses will longer preserve the glacier typology and make the valley glaciers possibly able to resist climate change till 2100. This will not be possible under the RCP8.5 scenario which foresees that almost all valley glaciers will disappear.
Data availability statement
The raw data supporting the conclusions of this article will be made available by the authors, without undue reservation.
Author contributions
RSB and SD collected and analyzed the glacier’s data, interpreted and discussed the results, and contributed to the paper’s final version; SZ collected the observed climatological data, analyzed the climatological data obtained from Euro-Cordex, worked on the glaciers modeling, and contributed to the paper’s final version.
Acknowledgments
The field measurements from 1980 to 2017 were supported by the Comitato Glaciologico Italiano: thanks are due to the voluntary operators for annually monitoring glacier snout fluctuations. The authors are grateful to Giovanni Mortara and Stefano Perona (Comitato Glaciologico Italiano), Michela Munari (Provincia Autonoma Bolzano–Ufficio Idrografico) and Franco Secchieri for providing them with the original data collected on the ground during the campaigns for the compilation of the World Glacier Inventory. Thanks to Marco Zecchetto (Instituto Superior Técnico, Universidade de Lisboa, Portugal) for the suggestions provided to solve the model equation and to Michael Kuhn (University of Innsbruck) for his generous help. Euro-Cordex climatological data have been downloaded from esgf-data.dkrz.de/projects/cordex-dkrz.
Conflict of interest
The authors declare that the research was conducted in the absence of any commercial or financial relationships that could be construed as a potential conflict of interest.
Publisher’s note
All claims expressed in this article are solely those of the authors and do not necessarily represent those of their affiliated organizations, or those of the publisher, the editors and the reviewers. Any product that may be evaluated in this article, or claim that may be made by its manufacturer, is not guaranteed or endorsed by the publisher.
References
Atkinson, K. E. (1989). An introduction to numerical analysis. 2nd ed. New York: John Willey & Sons, 604.
Auer, I., Böhm, R., Jurkovic, A., Lipa, W., Orlik, A., Potzmann, R., et al. (2007). HISTALP—Historical instrumental climatological surface time series of the greater alpine region. Int. J. Climatol. 27, 17–46. doi:10.1002/joc.1377
Bonanno, R., Ronchi, C., Cagnazzi, B., and Provenzale, A. (2014). Glacier response to current climate change and future scenarios in the north-Western Italian Alps. Reg. Environ. Change 14 (2), 633–643. doi:10.1007/s10113-013-0523-6
Braithwaite, R. J., Raper, S. C., and Candela, R. (2013). Recent changes (1991-2010) in glacier mass balance and air temperature in the European Alps. Ann. Glaciol. 54 (63), 139–146. doi:10.3189/2013AoG63A285
Brown, J., Harper, J., and Humphrey, N. (2010). Cirque glacier sensitivity to 21st century warming: Sperry glacier, rocky mountains, USA. Glob. Planet. Change 74 (2), 91–98. doi:10.1016/j.gloplacha.2010.09.001
Calmanti, S., Motta, L., Turco, M., and Provenzale, A. (2007). Impact of climate variability on Alpine glaciers in northwestern Italy. Int. J. Climatol. 27, 2041–2053. doi:10.1002/joc.1500
Carturan, L., Filippi, R., Seppi, R., Gabrielli, P., Notarnicola, C., Bertoldi, L., et al. (2013). Area and volume loss of the glaciers in the ortles-cevedale group (eastern Italian Alps): Controls and imbalance of the remaining glaciers. Cryosphere 7, 1339–1359. doi:10.5194/tc-7-1339-2013
Charalampidis, C., Fischer, A., Kuhn, M., Lambrecht, A., Mayer, C., Thomaidis, K., et al. (2018). Mass-budget anomalies and geometry signals of three Austrian glaciers. Front. Earth Sci. (Lausanne). 6, 218. doi:10.3389/feart.2018.00218
Christensen, O. B., Christensen, J. H., Machenhauer, B., and Botzet, M. (1998). Very high-resolution regional climate simulations over Scandinavia— present climate. J. Clim. 11, 3204–3229. doi:10.1175/1520-0442(1998)011<3204:vhrrcs>2.0.co;2
Christian, J., Koutnik, M., and Roe, G. (2018). Committed retreat: Controls on glacier disequilibrium in a warming climate. J. Glaciol. 64, 675–688. doi:10.1017/jog.2018.57
Citterio, M., Diolaiuti, G., Smiraglia, C., D'Agata, C., Carnielli, T., Stella, G., et al. (2007). The fluctuations of Italian glaciers during the last century: A contribution to knowledge about Alpine glacier changes. Geogr. Ann. Ser. A Phys. Geogr. 89 (3), 167–184. doi:10.1111/j.1468-0459.2007.00316.x
Cogley, J., Hock, R., Rasmussen, L., Arendt, A., Bauder, A., Braithwaite, R. J., et al. (2011). Glossary of glacier mass balance and related terms. Paris: UNESCO-IHP. IHP-VII Technical Documents in Hydrology No. 86, IACS Contribution No. 2.
Comitato Glaciologico Italiano (1981–2018). Relazioni delle campagne glaciologiche 1980-2017. Geogr Fis Din Quat, 4–41.
DeBeer, C. M., and Sharp, M. (2009). Topographic influences on recent changes of very small glaciers in the Monashee Mountains, British Columbia, Canada. J. Glaciol. 55, 691–700. doi:10.3189/002214309789470851
Diolaiuti, G. A., Bocchiola, D., Vagliasindi, M., D’Agata, C., and Smiraglia, C. (2012). The 1975-2005 glacier changes in Aosta Valley (Italy) and the relations with climate evolution. Prog. Phys. Geogr. Earth Environ. 36 (6), 764–785. doi:10.1177/0309133312456413
Fischer, M., Huss, M., and Hölzle, M. (2015). Surface elevation and mass changes of all Swiss glaciers 1980-2010. Cryosphere 9 (2), 525–540. doi:10.5194/tc-9-525-2015
Hoelzle, M., Haeberli, W., Dischl, M., and Peschke, W. (2003). Secular glacier mass balances derived from cumulative glacier length changes. Glob. Planet. Change 36 (4), 295–306. doi:10.1016/s0921-8181(02)00223-0
Huss, M., and Fischer, M. (2016). Sensitivity of very small glaciers in the Swiss Alps to future climate change. Front. Earth Sci. (Lausanne). 4 (34), 1–17. doi:10.3389/feart.2016.00034
Huss, M., and Hock, R. (2015). A new model for global glacier change and sea-level rise. Front. Earth Sci. (Lausanne). 3, 1–22. doi:10.3389/feart.2015.00054
Jacob, D., Elizalde, A., Haensler, A., Hagemann, S., Kumar, P., Podzun, R., et al. (2012). Assessing the transferability of the regional climate model REMO to different coordinated regional climate downscaling experiment (CORDEX) regions. Atmos. (Basel). 3, 181–199. doi:10.3390/atmos3010181
Jacob, D., Petersen, J., Eggert, B., Alias, A., Bössing Christensen, O., Bouwer, L. M., et al. (2014). EURO-CORDEX: new high-resolution climate change projections for European impact research. Reg. Environ. Change 14, 563–578. doi:10.1007/s10113-013-0499-2
Jóhannesson, T., Raymond, C., and Waddington, E. D. (1989). Time—scale for adjustment of glaciers to changes in mass balance. Journal of Glaciology. Reg. Environ. Change 35 (121), 355–369
Knoll, C., and Kerschner, H. (2009). A glacier inventory for South Tyrol, Italy, based on airborne laser-scanner data. Ann. Glaciol. 50 (53), 46–52. doi:10.3189/172756410790595903
Lambrecht, A., and Kuhn, M. (2007). Glacier changes in the Austrian Alps during the last three decades, derived from the new Austrian glacier inventory. Ann. Glaciol. 46, 177–184. doi:10.3189/172756407782871341
Leclercq, P. W., and Oerlemans, J. (2012). Global and hemispheric temperature reconstruction from glacier length fluctuations. Clim. Dyn. 38 (5-6), 1065–1079. doi:10.1007/s00382-011-1145-7
Machguth, H., and Huss, M. (2014). The length of the world’s glaciers–a new approach for the global calculation of center lines. Cryosphere 8 (5), 1741–1755. doi:10.5194/tc-8-1741-2014
Marzeion, B., Jarosch, A. H., and Hofer, M. (2012). Past and future sealevel change from the surface mass balance of glaciers. Cryosphere 6, 1295–1322. doi:10.5194/tc-6-1295-2012
Moss, R. H., Edmonds, J. A., Hibbard, K., Manning, M., Rose, S. K., Van Vuuren, D. P., et al. (2010). The next generation of scenarios for climate change research and assessment. Nature 463, 747–756. doi:10.1038/nature08823
Nakićenović, N., Alcamo, J., Davis, G., de Vries, B., Fennhann, J., Gaffin, S., et al. (2000). Emissions Scenarios. A special report of working group III of the inter-governamental panel on climate change. IPCC Technical report, Cambridge: Cambridge University Press.
Nigrelli, G., Lucchesi, S., Bertotto, S., Fioraso, G., and Chiarle, M. (2015). Climate variability and alpine glaciers evolution in northwestern Italy from the little ice age to the 2010s. Theor. Appl. Climatol. 122 (3-4), 595–608. doi:10.1007/s00704-014-1313-x
Oerlemans, J. (2007). Estimating response times of Vadret da Morteratsch, Vadret da Palü, Briksdalsbreen and Nigardsbreen from their length records. J. Glaciol. 53, 357–362. doi:10.3189/002214307783258387
Oerlemans, J. (2005). Extracting a climate signal from 169 glacier records. Science 308 (675)–677. doi:10.1126/science.1107046
Oerlemans, J. (2012). Linear modelling of glacier length fluctuations. Geogr. Ann. Ser. A Phys. Geogr. 94 (2), 183–194. doi:10.1111/j.1468-0459.2012.00469.x
Paul, F. (2002). Changes in glacier area in tyrol, Austria, between 1969 and 1992 derived from landsat 5 thematic mapper and Austrian Glacier Inventory data. Int. J. Remote Sens. 23 (4), 787–799. doi:10.1080/01431160110070708
Paul, F., Frey, H., and Le Bris, R. (2011). A new Glacier Inventory for the European Alps from landsat TM scenes of 2003: Challenges and results. Ann. Glaciol. 52, 144–152. doi:10.3189/172756411799096295
Paul, F., Kääb, A., Maisch, M., Kellenberger, T., and Haeberli, W. (2004). Rapid disintegration of Alpine glaciers observed with satellite data. Geophys. Res. Lett. 31 (21), L21402–L21404. doi:10.1029/2004GL020816
Peano, D., Chiarle, M., and von Hardenberg, J. (2016). A minimal model approach for glacier length modeling in the Western Italian Alps. Geogr. Fis. Din. Quat. 39 (1), 69–82. doi:10.4461/GFDQ.2016.39.7
Radic, V., Bliss, A., Beedlow, A. C., Hock, R., Miles, E., and Cogley, J. G. (2014). Regional and global projections of twenty-first century glacier mass changes in response to climate scenarios from global climate models. Clim. Dyn. 42, 37–58. doi:10.1007/s00382-013-1719-7
Rockel, B., Will, A., and Hense, A. (2008). The regional climate model COSMO-CLM (CCLM). metz. 17, 347–348. doi:10.1127/0941-2948/2008/0309
Roe, G. H., and O'Neal, M. A. (2009). The response of glaciers to intrinsic climate variability: Observations and models of late-holocene variations in the pacific northwest. J. Glaciol. 55 (193), 839–854. doi:10.3189/002214309790152438
Roe, G. H. (2011). What do glaciers tell us about climate variability and climate change? J. Glaciol. 57 (203), 567–578. doi:10.3189/002214311796905640
Samuelsson, P., Jones, C., Willén, U., Ullerstig, A., Gollvik, S., Hansson, U., et al. (2011). The rossby centre regional climate model RCA3: Model description and performance. Tellus A 63, 4–23. doi:10.3402/tellusa.v63i1.15770
Serandrei-Barbero, R., Donnici, S., and Zecchetto, S. (2019). Projected effects of temperature changes on the Italian western tauri glaciers (eastern Alps). J. Glaciol. 65, 299–308. doi:10.1017/jog.2019.7
Serandrei-Barbero, R., Rabagliati, R., Binaghi, E., and Rampini, A. (1999). Glacial retreat in the 1980s in the breonie, aurine and pusteresi groups (eastern Alps, Italy) in landsat TM images. Hydrological Sci. J. 44, 279–296. doi:10.1080/02626669909492222
Skamarock, W. C., Klemp, J. B., Dudhia, J., Gill, D., Barker, D. M., Duda, M. G., et al. (2008). A description of the advanced research WRF version 3, Technical Report NCAR/TN-475+STR. Boulder, Colorado, USA: National Center for Atmospheric Research.
Smiraglia, C., and Diolaiuti, G. (2015). The new Italian glacier inventory. Bergamo: Ev-K2-CNR, Bergamo Pubbl.
Van de Wal, R. S. W., and Oerlemans, J. (1995). Response of valley glaciers to climate change and kinematic waves: A study with a numerical ice-flow model. J. Glaciol. 41 (137), 142–152. doi:10.3189/S0022143000017834
Van Meijgaard, E., van Ulft, L. H., Lenderink, G., de Roode, S. R., Wipfler, L., Boers, R., et al. (2012). Refinement and application of a regional atmospheric model for climate scenario calculations of Western Europe. KKVR report KVR 054/12. Nieuwegein, Netherlands: Programme Office Climate changes Spatial Planning. ISBN/EAN 978-90-8815-046-3.
Van Vuuren, D. P., Meinshausen, M., Plattner, G. K., Joos, F., Strassmann, K. M., Smith, S. J., et al. (2008). Temperature increase of 21st century mitigation scenarios. Proc. Natl. Acad. Sci. U. S. A. 105, 15258–15262. doi:10.1073/pnas.0711129105
Žebre, M., Colucci, R., Giorgi, F., Glasser, N. F., Racoviteanu, A. E., and Del Gobbo, C. (2020). 200 years of equilibrium-line altitude variability across the European Alps (1901-2100) Clim. Dynam., 1–19. doi:10.1007/s00382-020-05525-7
Zecchetto, S., Serandrei-Barbero, R., and Donnici, S. (2017). Temperature reconstruction from the length fluctuations of small glaciers in the eastern Alps (northeastern Italy). Clim. Dyn. 49 (1-2), 363–374. doi:10.1007/s00382-016-3347-5
Zekollari, H., Huss, M., and Farinotti, D. (2019). Modelling the future evolution of glaciers in the European Alps under the EURO-CORDEX RCM ensemble. The Cryosphere 13 (4), 1125–1146. doi:10.5194/tc-13-1125-2019
Zemp, M., Frey, H., Gärtner-Roer, I., Nussbaumer, S. U., Hoelzle, M., Paul, F., et al. (2015). Historically unprecedented global glacier decline in the early 21st century. J. Glaciol. 61 (228), 745–762. doi:10.3189/2015jog15j017
Zemp, M., Haeberli, W., Hoelzle, M., and Paul, F. (2006). Alpine glaciers to disappear within decades? Geophys. Res. Lett. 33 (13), L13504. doi:10.1029/2006GL026319
WGMS (2017). “Global glacier change bulletin No. 2 (2014-2015),” in ICSU(WDS)/IUGG(IACS)/UNEP/UNESCO/WMO. Editors M. Zemp, S. U. Nussbaumer, I. Gärtner-Roer, J. Huber, H. Machguth, F. Paulet al. (Zurich, Switzerland: World Glacier Monitoring Service), 244. Based on database version. doi:10.5904/wgms-fog-2017-10
Keywords: valley glaciers, snout fluctuations, air temperatures, climate sensitivity, Italian Alps
Citation: Serandrei-Barbero R, Donnici S and Zecchetto S (2022) Past and future behavior of the valley glaciers in the Italian Alps. Front. Earth Sci. 10:972601. doi: 10.3389/feart.2022.972601
Received: 18 June 2022; Accepted: 30 September 2022;
Published: 14 October 2022.
Edited by:
Davide Tiranti, Agenzia Regionale per la Protezione Ambientale del Piemonte (Arpa Piemonte), ItalyReviewed by:
Ramanathan Alagappan, Jawaharlal Nehru University, IndiaRijan Bhakta Kayastha, Kathmandu University, Nepal
Copyright © 2022 Serandrei-Barbero, Donnici and Zecchetto. This is an open-access article distributed under the terms of the Creative Commons Attribution License (CC BY). The use, distribution or reproduction in other forums is permitted, provided the original author(s) and the copyright owner(s) are credited and that the original publication in this journal is cited, in accordance with accepted academic practice. No use, distribution or reproduction is permitted which does not comply with these terms.
*Correspondence: Sandra Donnici, c2FuZHJhLmRvbm5pY2lAY25yLml0