 Yi Zhao1
 Dongming Zhang
- 1Research Institute of Exploration and Development, Petrochina Southwest Oil & Gas Field Company, Chengdu, China
- 2School of Resources and Safety Engineering, Chongqing University, Chongqing, China
Jialingjiang Formation is a typical low permeability carbonate reservoir in Sichuan Basin, which is characterized by strong heterogeneity, low matrix permeability and high-water saturation. Based on seven influencing factors, such as permeability, reservoir thickness and reservoir porosity, this paper evaluates and predicts the oil recovery of Jialingjiang Formation gas reservoir by using two neural network models of multilayer perceptor and radial basis function and nonlinear surface fitting method. The results show that: 1) In the neural network prediction model, the correlation coefficient between the prediction result curve of multilayer perceptron and the original recovery curve reaches 0.88, which is higher than the radial basis function (0.81), indicating that the use of multilayer perceptron can better predict the recovery of gas reservoirs. 2) In the nonlinear curved surface fitting prediction model, the two influencing factors with the greatest linear correlation with the recovery factor, reservoir thickness and gas recovery rate, are selected to fit the prediction model, and the prediction model is obtained. According to the prediction model, the recovery factor is positively correlated with the reservoir thickness and gas recovery rate on the whole. The model can be used to estimate gas recovery from two factors: reservoir thickness and gas recovery rate.
1 Introduction
The recovery factor prediction of gas reservoir is an important part of gas field development and production, and one of the cores works of evaluation of gas field development effect. It plays an important guiding role in the realization of gas field development index and production index. In view of the gas reservoir recovery degree is low, field development efficiency is not high, according to the factors affecting the recovery of gas reservoirs, using neural network and nonlinear surface fitting analysis methods, the establishment of scientific index evaluation system has very important theoretical significance and practical value for the prediction and evaluation of the recovery of gas reservoirs, the development benefit and productivity of gas fields.
Domestic and foreign scholars have done a lot of research on the evaluation methods and prediction models of gas reservoir recovery, and many evaluation or prediction methods of gas reservoir recovery have been born. Commonly used in the early phase gas reservoir evaluation or development experience formula of recovery, it involves multiple static parameters, the precision of the calculation results by the recovery efficiency of static parameter selection is larger, the reliability is poorer (Mu et al., 2018), by similarity has been developed with the gas reservoir to be developed gas reservoir, and with developed reservoir recovery ratio range, combining the actual geological conditions of undeveloped reservoir, An analogy for estimating the recovery of an undeveloped gas reservoir is used in the early stages of the development of the gas reservoir. The result is the final recovery, which is relatively higher than the actual recovery (Xiao, 2011); The material balance method is often used to calculate the recovery of the entire gas reservoir and to study the volume balance between fluids. In the development of low permeability gas reservoirs, the production range and pressure of each producing well are different, and there are often many unproduced areas in the reservoir. Therefore, there is a large error in the unified calculation of the whole gas reservoir (Chen 2000) (Li, 2008); The material balance method is often used to calculate the recovery of the entire gas reservoir and to study the volume balance between fluids. The decline per production well method was originally used to analyze the decline pattern of Barnett shale gas Wells during the development of low permeability gas reservoirs. Production decline after 2010, due to a large number of production Wells in line with the law of SEPD, this model was used to parameters in well group to individual tight gas production Wells for the controllable output prediction and the density of oil and gas production forecast, production decline method using conditions are strict (production well bottom hole flowing pressure is constant), so the law of diminishing unstable (Chen 1991); Rodgerstie function is also known as self-inhibitory equation, and the differential equation of the model is: dx/dt=rx (1-x), in which R is the rate parameter. The main difference between the equation and the exponential model is that the (1-x) correction factor is added to the right side of the equation, which makes the model contain self-inhibition. This method is derived from demography, environmental science and other disciplines, but its principle in gas reservoir development is not clear enough (Li 2008) (Lu et al., 2009); Tung’s engraving method is TongXianZhang through a lot of waterflooding oil field actual data statistics, at present this approach has become the waterflood development of recoverable reserves in the second half of the oil and gas field development to develop one of the main methods, this method geological reserves of oil and gas fields to influenza a water drive curve is directly proportional to the inverse of the straight slope, ratio of about 7.5 (Cao et al., 2020); Wang et al. (1997) summarized a variety of recovery prediction methods for low permeability waterflooding reservoirs by analyzing factors affecting recovery in low permeability oil fields, including indoor water flooding method, multidistance statistical regression method, attenuation curve method, water flooding characteristic curve method, etc. Wang shuhua pointed out that different oil recovery prediction methods are applicable to different stages of reservoir development, and the prediction results of oil recovery are also different.
At present, numerical simulation and linear regression are mostly used to predict oil recovery in gas (oil) reservoirs, which have disadvantages of time-consuming and low precision respectively. The neural network prediction method has better adaptability and can better reflect the internal relationship between various factors and recovery factor. Li et al. (2021) established a recovery prediction model for Marine sandstone reservoirs in the eastern Part of the South China Sea by using the neural network regression method on the basis of feature extraction of the factors affecting recovery by principal component analysis. The comparison with the prediction results of the recovery factor prediction model established by support vector machine regression and linear regression shows that the prediction results of the neural network regression model have higher prediction accuracy and can quickly evaluate the development potential of this type of reservoir; Liu (2020) based on shale gas reservoir numerical simulation software to generate a large amount of data, the use of CNN and LSTM for shale gas productivity prediction model building, points out the productivity prediction method on the characteristics of the data obtained by normal inadequate, and the depth of the neural network can fully learn the characteristics of the data, makes the prediction of production capacity have higher credibility; Lu (2019) with statistical method, the main factors affecting gas well production capacity is studied, and the tight gas reservoir in west sichuan province as the research object, based on the analysis of the influencing factors of production in gas well, based on the data analysis method, established the flexible considering various factors affecting gas well production forecasting model, using the model to carry out the production forecast, achieved good prediction effect; Shan et al. (2015) used BP neural network method with preferred input vector to identify complex lithology in Sulige gas field, with high recognition accuracy and an average coincidence rate of nearly 90%. Therefore, the identification of lithology by using this method also provides valuable first-hand data for subsequent basic research; Wang et al. (2021) through the analysis of natural gas compressibility factor possesses the characteristics of nonlinear curved surface fitting method of the low pressure chart and high pressure chart 6 988 groups of data fitting, got a new type of natural gas compressibility factor empirical formula, the verification results show that using the method of calculation results and higher accuracy than other methods, It can quickly and accurately predict natural gas compression factors under different conditions in field practice; Based on the material balance method, Liu et al. (2018) proposed a new method to determine the dynamic reserves of gas reservoirs based on flow data by integrating the gas seepage process, vertical pipe flow model, gas well productivity equation and material balance equation, and verified the reliability of the method. It is pointed out that the new method can realize simple and accurate calculation of dynamic reserves of gas reservoir, which is of great significance to evaluate the development effect of gas reservoir, predict the development performance of gas reservoir accurately and make a good development plan of gas reservoir. Yan et al. (2021) used three machine learning methods such as deep neural network, support vector regression and limit gradient climb to establish a prediction model from reservoir and construction parameters to recovery, analyzed the advantages and disadvantages of various models, and established a reasonable predictive recovery model, which has engineering application prospects. Aiming at the problem of low water and fertilizer utilization rate in the corn production process in northern Xinjiang, Cui et al. (2022) proposed a corn yield prediction method based on sparrow search algorithm and generalized regression neural network model, which has advantages in learning speed, prediction accuracy and robustness compared with traditional models, and can effectively predict the yield of spring-sown maize in northern Xinjiang.
Although the above scholars have done a lot of research on the evaluation and prediction of gas reservoir recovery, the research on the prediction of gas reservoir recovery based on neural network and nonlinear surface fitting is less. In order to provide theoretical reference for the prediction and evaluation of the development benefit and productivity of the gas field, this paper adopts two kinds of neural network models of multilayer perceptor, radial basis function and nonlinear surface fitting to regression, fitting and evaluation of gas recovery.
2 Theoretical model of neural network prediction
2.1 Multilayer perceptron
There are many varieties of neural network, such as error back propagation neural network, probabilistic neural network, convolution neural network, temporal recursive neural network, etc. But the most basic and common neural network is the multilayer perceptron. Multilayer perceptron is a feedforward artificial neural network model which maps multiple input data sets to a single output data set. The advantages of multilayer perceptron are as follows: highly parallel processing, good fault tolerance, with associative memory function and so on. The schematic diagram is shown in Figure 1.
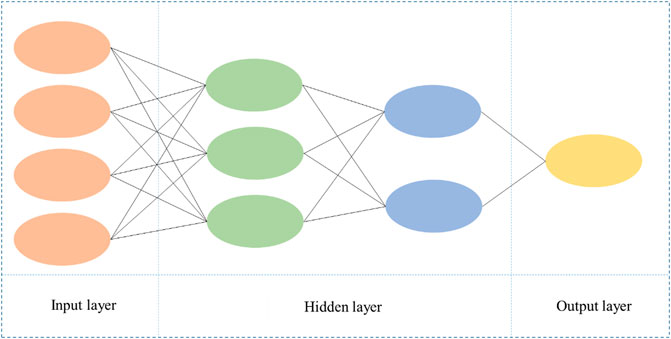
FIGURE 1. Multilayer perceptron.
In Figure 1, in the prediction model of gas recovery, the input layer is the factor affecting the recovery, and the output layer is the expected recovery. The hidden layer does not directly receive signals from the outside world (influence factors), nor does it directly send signals to the outside world (recovery factor). Its role in the neural network is to calculate, train and verify the influence factors of the input, so as to obtain the prediction results of recovery factor.
2.2 Radial basis function
The radial basis function is a scalar function with radial symmetry, usually defined as a monotone function of the radial distance between the sample and the data center, namely:
Any one meet Φ (x) = Φ (| | x | |) function Φ called radial basis function, the characteristic of standard general using Euclidean distance. In the neural network structure, it can be used as the main function of the full connection layer and ReLU layer. The advantages of radial basis functions are: simple structure, concise training, and fast learning convergence. It can approximate any nonlinear function and overcome the local minimum problem.
Radial basis functions are a class of functions, and the common radial basis functions include:
1) Gaussian function:
2) Polyharmonic spline:
Radial basis function (RBF) is mainly used to solve the multi-variable difference problem. It can approximate a given number through the sum of multiple RBF functions, and this approximation process can be regarded as a simple neural network.
Structure of the neural network basic method to assume a certain process belongs to a certain function space function, then connected into a neural grid, minimal potential tend to run for a period of time the network to achieve a dynamic balance, which can find out the function, and select the radial basis function space is a relatively simple easy to use the method of neural network to realize.
3 Neural network prediction model of gas reservoir recovery
Based on the experience of predecessors and the specific conditions of Jialingjiang Formation gas reservoirs, seven factors affecting the recovery factor -- permeability, reservoir thickness, reservoir porosity, limit abandonment pressure, gas recovery rate, original formation pressure and current formation pressure are comprehensively selected, as shown in Table 1. At the same time, SPSS software was used to analyze the correlation between them, and the neural network prediction model of gas recovery of Jialingjiang Formation was established by using multilayer perceptron and radial basis function respectively, as shown in Figure 2. In Figure 2, the synaptic weights are indicated in the upper right corner. The blue line indicates that the synapse weight is greater than 0, and the orange line indicates that the synapse weight is less than 0.
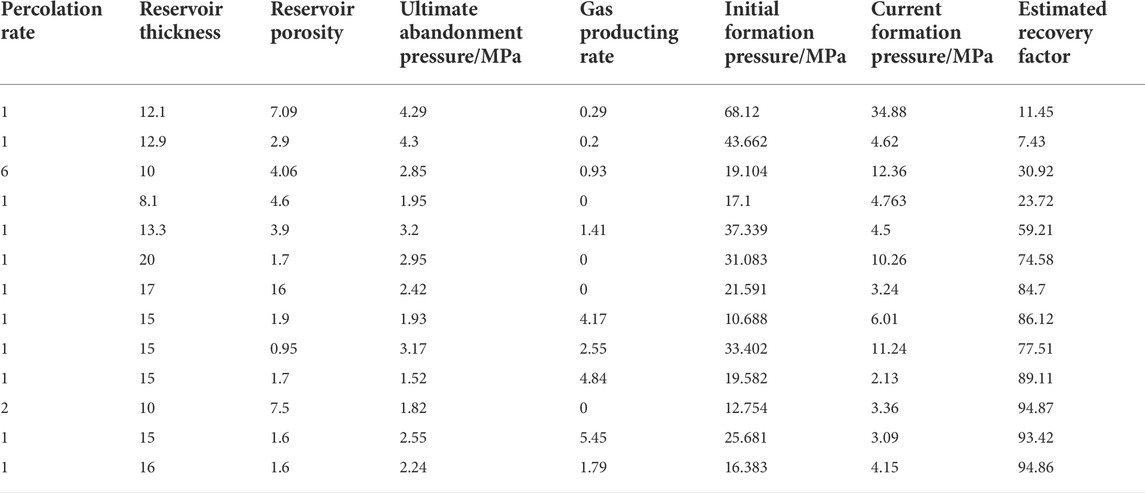
TABLE 1. Influencing factors of Gas reservoirs in Jialingjiang Formation.
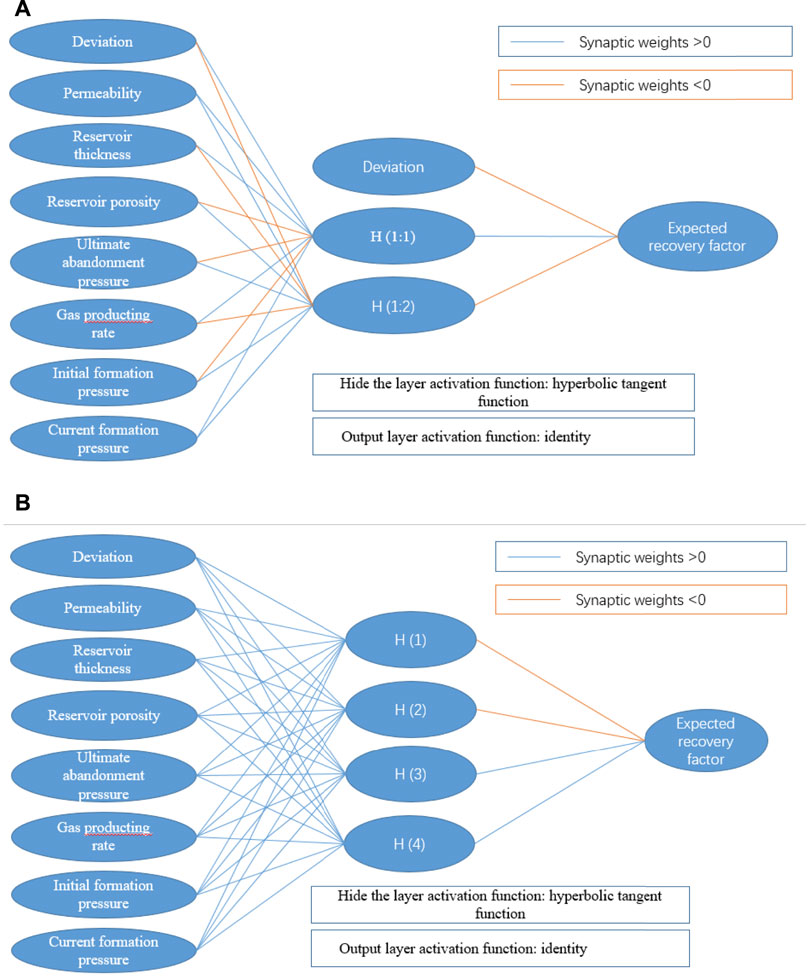
FIGURE 2. Prediction neural network model of gas reservoir recovery. (A) Multilayer perceptron. (B) Radial basis function.
A comparison of the recovery results obtained from the neural network model in Figure 2 with the original recovery results is shown in Figure 3. In Figure 3, the horizontal axis represents the different gas pools, represented in ‘sequence’.
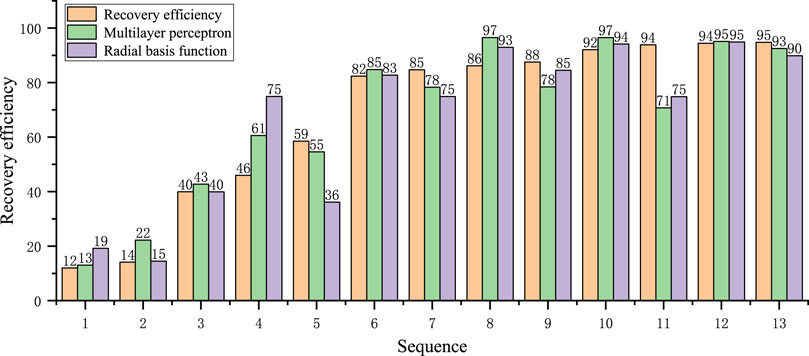
FIGURE 3. Prediction results of gas reservoir recovery prediction neural network model.
It can be seen from Figure 3 that the recovery results obtained by the two neural network models of multilayer perceptron and radial basis function have a high similarity with the original recovery results. In order to analyze the fitting degree of the two models in detail, the residual and correlation coefficients of the two prediction results should be calculated. The residual error can be calculated as follows:
Where, δ i is the residual, Yi is the predicted value of the recovery neural network, Yi is the original recovery value, δi*is the standardized residual,
Then, the correlation coefficient R2 between the predicted recovery curve and the original curve can be calculated as follows:
According to Eqs 4, 5, 6, the residual, standardized residual and correlation coefficients of the prediction curve are calculated, as shown in Table 2.
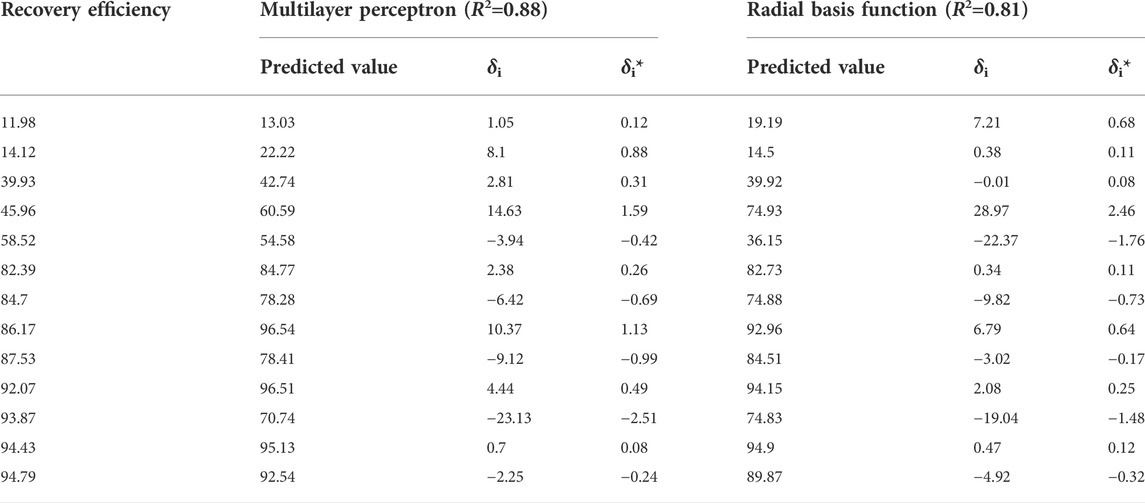
TABLE 2. Neural network prediction pair ratio.
It can be seen from Table 2 that the prediction result of multi-layer perceptron is superior to the radial basis function. To further analyze the fitting effect of the two, the residual scatter diagram of the prediction result is drawn, as shown in Figure 4. According to the analysis of the prediction effects of the two neural network models in Figure 4, it can be seen that the prediction results of the radial basis function have a large deviation in the gas reservoir sequence (4, 5), resulting in the overall prediction effect of the radial basis function is not as good as that of the multilayer perceptron. However, in the other gas reservoir sequences, the prediction effect of the radial basis function is fair, which is close to that of the multilayer perceptron on the whole. By analyzing the standardized residuals of the two, it can be seen that the residuals of the multilayer perceptron are evenly distributed, while the residuals of the radial basis function are mainly concentrated in the sequence (4, 5, 11).
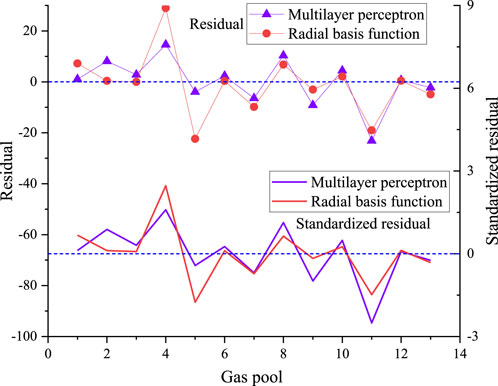
FIGURE 4. Residual analysis.
As can be seen from Table 2 and Figure 4, the correlation coefficient between the prediction result curve of multi-layer perceptron and the original recovery curve reaches 0.88, which is higher than the radial basis function, indicating that the multi-layer perceptron can better predict the recovery of gas reservoirs.
Figure 5 shows the importance of the influence factors under the two neural network models of multi-layer perceptron and radial basis function. In both models, the final influence factor is 1 based on the influence weight. Figure 5 shows that in the multi-layer sensor model, the order of importance of influencing factors is as follows: original formation pressure > reservoir thickness > ultimate abandonment pressure > gas recovery rate > permeability > reservoir porosity >current formation pressure. In the radial basis function model, the order of importance of influencing factors is as follows: ultimate abandonment pressure > permeability > original formation pressure > gas production rate > reservoir porosity > reservoir thickness >current formation pressure.
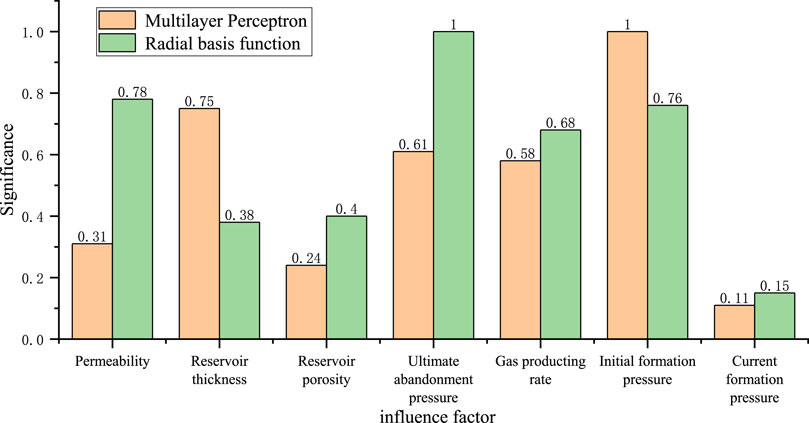
FIGURE 5. Importance analysis of influencing factors.
4 Nonlinear surface prediction model of gas reservoir recovery
In this section, the nonlinear surface fitting method is used to analyze the variation of gas recovery with various influencing factors. First, SPSS software was used to analyze the linear correlation between recovery factor and various influencing factors, as shown in Table 3.
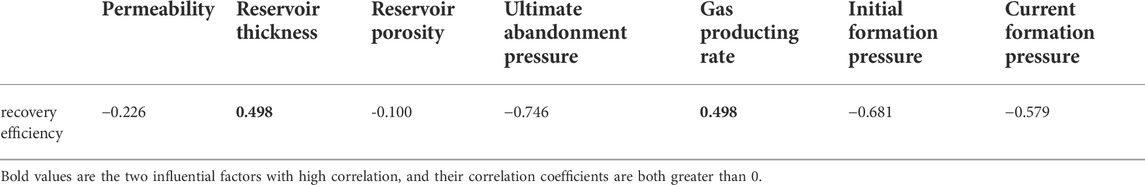
TABLE 3. Correlation matrix between gas recovery and influencing factors.
It can be seen from Table 3 that, different from the importance of factors in the neural network model, reservoir thickness and gas recovery rate are the two factors that have the greatest linear correlation with recovery factor. Therefore, the above two most important factors are analyzed.
4.1 Filtering fitting of key influencing factors
The variation trend of reservoir thickness with the sequence was plotted, as shown in Figure 6A. It can be seen from Figure 6A that the curves are disordered and have many inflection points. To facilitate curve fitting, the sequence is regarded as a time axis and Fourier transform is performed on the reservoir thickness-sequence curve to obtain the frequency domain image of the reservoir thickness. Then, the band pass filter is used to retain images in the range of 0.125–0.25 Hz. The time-domain curve of reservoir thickness is obtained by inverse Fourier transform, as shown in Figure 6B. By observing the filtered curve in Figure 6B, it is obvious that the curve tends to be smooth. Sine function
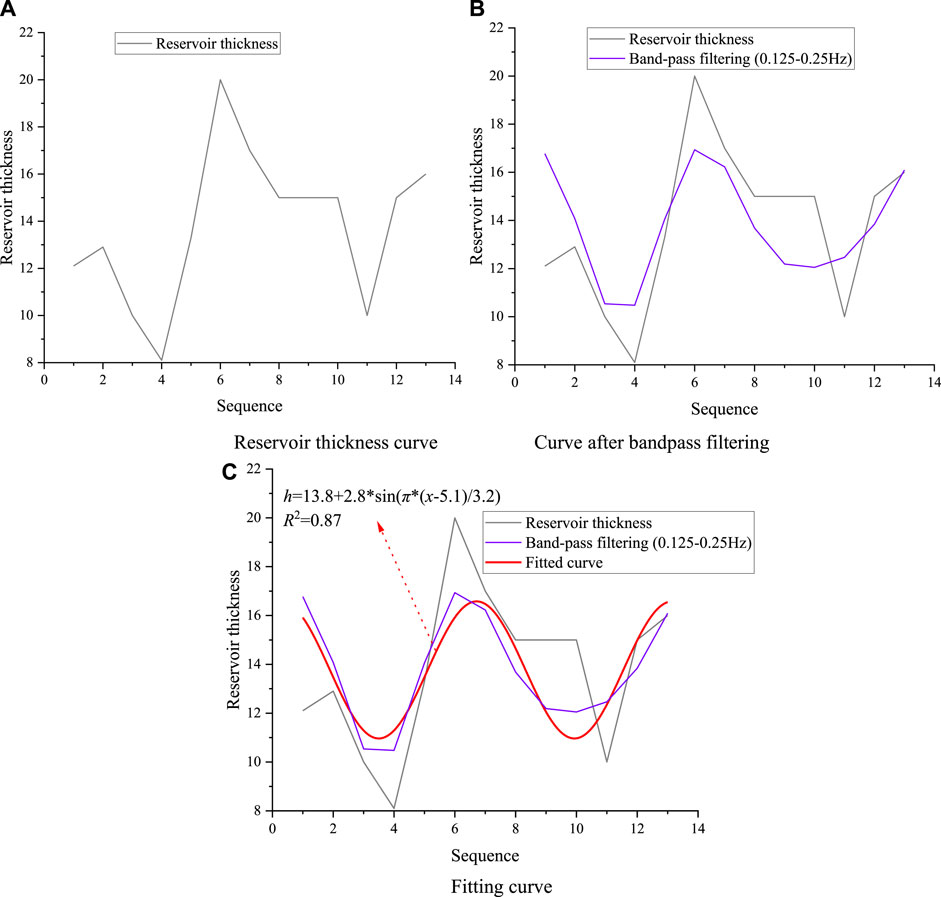
FIGURE 6. Reservoir thickness curve processing. (A) Reservoir thickness curve (B) Curve after bandpass filtering. (C) Fitting curve.
Figure 6C shows that the fitting curve of reservoir thickness is:
In Formula (7), the correlation coefficient R2 of the fitting curve is 0.87, indicating that the fitting curve has a high correlation.
Figure 7A shows the variation trend of gas production rate with the sequence. The same processing method as reservoir thickth-sequence curve is adopted to observe the frequency domain image of gas recovery rate, retain the image in the range below 0.3 Hz with a low-pass filter, and obtain the time-domain curve of reservoir thickness by inverse Fourier transform, as shown in Figure 7B. Then, sine function was used to fit the filtered curve, as shown in Figure 7C.
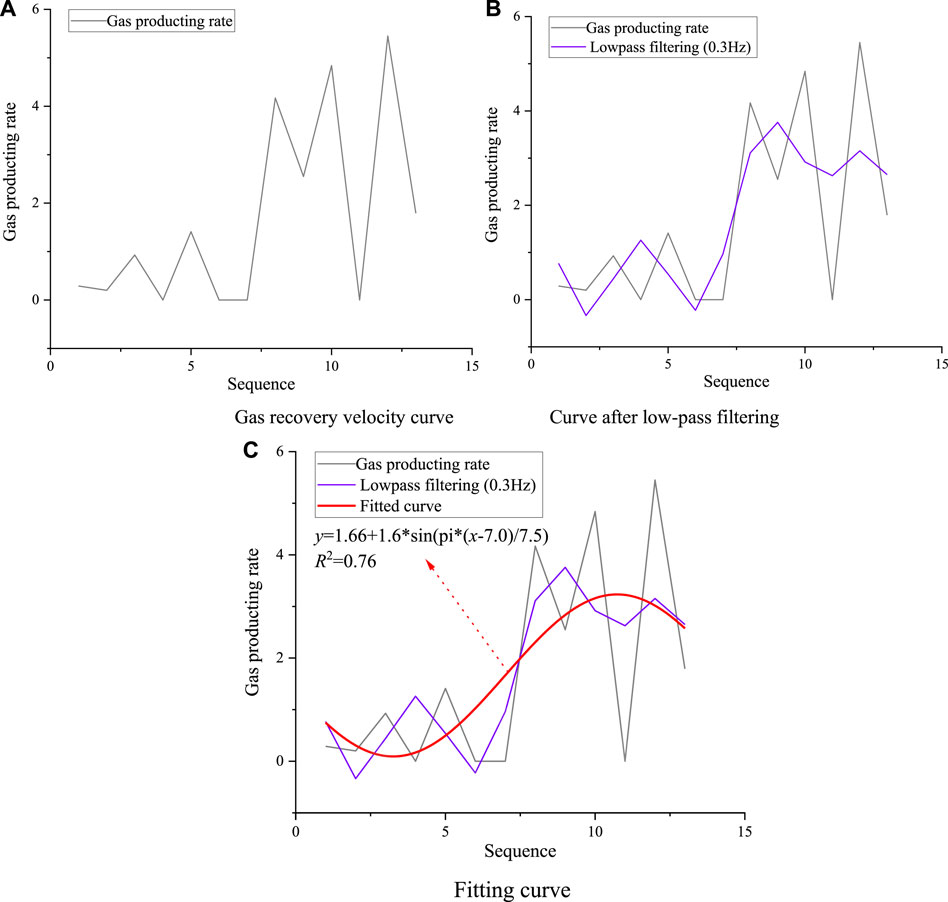
FIGURE 7. Processing of gas production velocity curve. (A) Gas recovery velocity curve (B) Curve after low-pass filtering. (C) Fitting curve.
Figure 7C shows that the fitting curve of gas recovery rate is:
In Formula (8), the correlation coefficient R2 of the fitting curve is 0.76, indicating that the correlation of the fitting curve is slightly lower than that of the reservoir thickness.
4.2 Establishment of nonlinear surface prediction model
Plot the recovery curve, as shown in Figure 8. It can be seen from Figure 8 that the recovery rate gradually increases with the sequence, but the increase rate gradually decreases. The formula
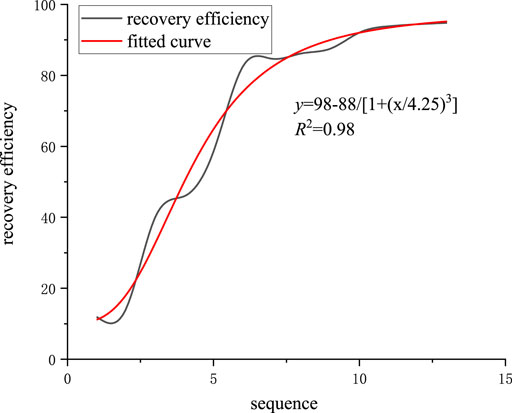
FIGURE 8. Oil recovery curve fitting of gas reservoir. By separating the expressions from Equations 7 and 8, we can get.
Substituting Eqs 10, 11 into Eq. 9, it can be obtained:
Take mean values of Eqs 12, 13:
Namely:
The prediction model is obtained from Eq. 15, as shown in Figure 9. It shows that the recovery factor is positively correlated with reservoir thickness and gas recovery rate on the whole. This model can be used to estimate the recovery factor of gas reservoir from the two influencing factors of reservoir thickness and gas recovery rate.
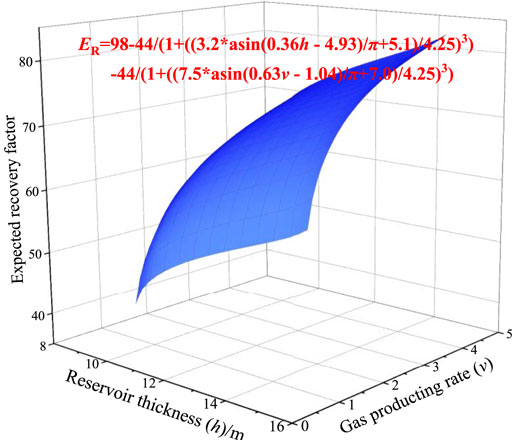
FIGURE 9. Prediction model of nonlinear curved surface fitting for gas reservoir recovery.
5 Conclusion
Based on seven influencing factors such as permeability, reservoir thickness and reservoir porosity, this paper evaluated and predicted the oil recovery of jialingjiang Formation gas reservoir by using two neural network models of multilayer perceptor and radial basis function and nonlinear surface fitting method. The conclusions are as follows:
1) In the neural network prediction model, the correlation coefficient between the prediction result curve of multilayer perceptron and the original recovery curve is 0.88, which is higher than the radial basis function (0.81), indicating that the use of multilayer perceptron can better predict the recovery of gas reservoirs.
2) In the nonlinear curved surface fitting prediction model, the two factors that have the greatest linear correlation with the recovery factor, reservoir thickness and gas recovery rate, are selected for fitting, and the prediction model is obtained. According to the prediction model, the recovery factor is positively correlated with reservoir thickness and gas recovery rate on the whole. The model can be used to estimate gas recovery from two factors: reservoir thickness and gas recovery rate.
Data availability statement
The raw data supporting the conclusions of this article will be made available by the authors, without undue reservation.
Author contributions
DZ supervised the research and proposed the research direction. YZ and QM was responsible for report analysis and paper writing. XY, KZ, XZ and YY helped in writing the paper.
Funding
Supported by Scientific Research Foundation of State Key Lab of Coal Mine Disaster Dynamics and Control. (Project Approval Number: 2011DA105287-zd201804).
Conflict of interest
The authors declare that the research was conducted in the absence of any commercial or financial relationships that could be construed as a potential conflict of interest.
Publisher’s note
All claims expressed in this article are solely those of the authors and do not necessarily represent those of their affiliated organizations, or those of the publisher, the editors and the reviewers. Any product that may be evaluated in this article, or claim that may be made by its manufacturer, is not guaranteed or endorsed by the publisher.
References
Cao, T., Duan, Y., Li, N., and Li, H. (2020). Optimization of gas production rate in narrow channel tight sandstone gas reservoir: A case study of shaximiao Formation gas reservoir in zj gas field [J]. Fault-block oil gas field 27 (01), 90–94.
Chen, Y. (1991). A method for determining recoverable reserves of gas reservoirs [J]. China Offshore Oil Gas 5 (2), 15–24 +64.
Chen, Y. (2000). Calculation method of recoverable reserves [J]. Xinjiang Pet. Geol. 21 (2), 130–136.
Cui, X., Jin, S., and Yao, Z. (2022). Prediction of maize yield based on sparrow search algorithm and generalized regression neural network [J]. Pract. Underst. Math., 1–9.
Li, Wei, Tang, Fang, Hou, Boheng, Yin, Qian, Cui, Chuanzhi, Lu, Shuiqingshan, et al. (2021). Oil recovery prediction method of sandstone reservoir in eastern South China Sea based on neural network [J]. Oil Gas Reserv. Eval. Dev. 11 (05), 730–735+743.
Liu, X., Li, J., Hu, S., Yang, P., and Fu, D. (2018). Dynamic reserve calculation of gas reservoirs based on flow data [J]. Fault-block oil gas field 25 (06), 732–735.
Liu, Y. (2020). Construction of data-driven shale gas productivity prediction model based on deep neural Network [D]. Beijing): China University of Petroleum.
Lu, T., Lan, Y., and He, L. (2009). A binomial productivity equation method for calculating abandoned pressure of gas reservoirs [J]. Nat. Gas Explor. Dev. 32 (/), 18–20.
Lu, Z. (2019). Research on production prediction method of tight gas well based on big data analysis [D]. Chengdu: Southwest petroleum university. doi:10.27420/dcnki.Gxsyc.2019.000830
Mu, Z., Dai, J., and Zhao, Z. (2018). Prediction of recovery efficiency of low permeability gas reservoirs [J]. Petroleum Geol. Eng., 1673–8217.
Qian, L., Guo, P., and Huang, Q. (2008). Research on dynamic reservoir modeling of gas well [J]. J. Chongqing Univ. Sci. Technol. Nat. Sci. Ed. 10 (6), 34–36.
Shan, J., Chen, X., and Zhao, Z. (2015). Identification of complex lithology in tight sandstone gas reservoirs using BP neural network method [J]. Prog. Geophys. 30 (03), 1257–1263.
Wang, S., Gao, Z., and Wang, J. (1997). Calculation method of recoverable reserves in low permeability oilfield [J]. Petroleum Geol. oilfield Dev. daqing 16 (2), 24–28.
Wang, Y-C., Ji-gen, Y. E., and Wu, S-H. (2021). New natural gas compression factor calculation correlation based on pair hook function[J]. Chem. Industry Oil Gas 50 (05), 38–43.
Xiao, J. (2011). Research on recovery prediction method of low permeability reservoir [D]. Qingdao: China University of Petroleum.
Keywords: gas reservoir recovery, multilayer perceptron, radial basis function, nonlinear surface fitting, jialingjiang formation
Citation: Zhao Y, Mei Q, Yin X, Zhang K, Zhao X, Yan Y and Zhang D (2022) Analysis of factors influencing recovery of low permeability and strong heterogeneous gas reservoirs and establishment of prediction model. Front. Earth Sci. 10:972353. doi: 10.3389/feart.2022.972353
Received: 18 June 2022; Accepted: 07 July 2022;
Published: 04 August 2022.
Edited by:
Xiaofei Jing, Chongqing University of Science and Technology, ChinaReviewed by:
Bai Xin, University of South China, ChinaBinbin Zheng, Shandong Institute of Business and Technology, China
Copyright © 2022 Zhao, Mei, Yin, Zhang, Zhao, Yan and Zhang. This is an open-access article distributed under the terms of the Creative Commons Attribution License (CC BY). The use, distribution or reproduction in other forums is permitted, provided the original author(s) and the copyright owner(s) are credited and that the original publication in this journal is cited, in accordance with accepted academic practice. No use, distribution or reproduction is permitted which does not comply with these terms.
*Correspondence: Dongming Zhang, emhhbmdkbUBjcXUuZWR1LmNu