 Mingchuan Wang
 Fan Yang
 Jianyun Feng
 Jun Luo
- SINOPEC Petroleum Exploration and Production Research Institute, Beijing, China
It is crucial for financial providers, investment groups, resource developers, and exploration companies to rate new geothermal projects in terms of resources and reserves. In general, the existing volumetric method is constrained by limited information when projects are at the early stage of development. The main objective of this study is to estimate the probabilistic potential thermal energy of the M research area in the Maichen Sag, a geothermal prospect in South China, through stochastic methodologies. The probabilistic assessment methodology provides a way to embody the uncertainty and risk in geothermal projects and to quantify the power potential in a probable range. In this study, proxy numerical models were built by combining the Experimental Design (ED) and Response Surface Methodology (RSM) with the Monte Carlo Simulation technique. An improved workflow for combined ED-RSM that uses two-level Full Factorial and Box–Behnken designs was proposed. For comparative analysis, the typical volumetric technique was also implemented in this study. The ED-RSM results show that the M area has P10, P50, and P90 reserves of 5.7 × 10¹⁴ J, 5.3 × 10¹⁴ J, and 5 × 10¹⁴ J, respectively, and these numbers from the typical volumetric method are 1.5 × 10¹⁵ J, 9 × 10¹⁴ J, and 5.1 × 10¹⁴ J, respectively. In this study, the operability, applicability, and accessibility of ED-RSM in the assessment of geothermal potential and its ability to provide a reliable output are demonstrated.
1 Introduction
Global energy demand has soared tremendously because of rapid industrial advancement and human activities, at the same time, it has been found that the available geothermal resources are adequate to meet this energy demand. At present, 80 countries have geothermal resources that are being harnessed for direct use applications; however, currently, only 24 countries are using geothermal resources for generating electricity (Bertani, 2012; Bertani, 2016; Lund and Boyd, 2016). Resource evaluation, which is the first step toward improvement of the commercial development of geothermal resources, is the practice of characterizing a geothermal system and estimating its potential power or thermal energy capacity (Ciriaco et al., 2018; Ciriaco A. E. et al., 2020). The estimated capacity of the resource is usually calculated by using volumetric heat storage method or numerical models. Of these two methods, numerical modeling has been widely used in various industries and can provide more reliable estimates (Ciriaco A. E. et al., 2020). It can be used to simulate the fluid flow and heat transfer of actual complex geothermal systems, and its performance is better than that of the heat storage method (Quinao and Zarrouk, 2018). However, numerical modeling of geothermal systems still cannot provide error-free results and cannot make subjective predictions on its modeling parameters. Therefore, quantification of the mismatches and errors in numerical modeling predictions is not only necessary, but also challenging because these models produce deterministic results (Santner et al., 2003; Ciriaco et al., 2018). The quantification of uncertainty in numerical model predictions requires a series of simulation experiments. These steps include the construction of multiple versions of the calibrated reservoir model through reverse modeling. However, under normal circumstances, simulation experiments require intense labor and time (Doherty et al., 2017). The method involving combination of Experimental design (ED) and Response surface methodology (RSM), together denoted as ED-RSM method has been employed to build polynomial models rather than numerical models and several authors have verified the techniques (Pasikki et al., 2016; Quinao and Zarrouk, 2018). The ED-RSM method allows for the consideration of uncertainty in numerical model predictions in a more practical manner (Ciriaco A. E. et al., 2020).
In experimental research, ED and RSM are two separate statistical techniques that are used to describe the relationship between input variables and specific output variables (Ciriaco A. E. et al., 2020). The output variable is the parameter of interest, which is the goal or product of the experiment. On the other hand, the input variables are variables that affect output. ED uses the least number of simulations to understand the impact of input variables on output variables, while RSM optimizes output variables by conducting sequential experiments (Ciriaco et al., 2018). Notably, ED was first introduced in the 1920s mainly to provide a method for systematic planning and research (Box, 1979; Box et al., 1978; Myers and Montgomery, 2002). Nowadays, the ED-RSM framework has been applied in many fields such as metallurgy, transportation, medicine, industrial machinery, and oil and gas. However, in the geothermal industry, only a few published studies on this technology are available. For example, Acuna et al., 2002 and Hoang et al. (2005) described the relationship between factors that affected power capacity, by considering one factor at a time and created a simple equation as a function of important reservoir parameters, including rock permeability, boundary conditions of aquifers, productivity (Ciriaco A. E. et al., 2020), upwelling velocity, and deep reservoir temperature. Pasikki et al., 2016 evaluated green fields by developing a polynomial model for calculating the average decline rate of MWe using ED. Quinao and Zarrouk (2018) succeeded in estimating oil reserves by adopting a stochastic method to construct a surrogate model used in the oil industry for estimating oil reserves and revealed that Plackett–Burman and Full Factorial designs were sufficient to evaluate Ngatamariki Reservoir of New Zealand. Recently, the use of Full Factorial design and Box–Behnken design was investigated to screen and construct a second-order polynomial model and the ED-RSM method was applied to the Rotorua geothermal model (Ciriaco et al., 2018). The screening phase not only reduced the number of required simulation runs by removing insignificant variables, but also provided insights into the next experimental setup (Ciriaco et al., 2018). The results also confirmed that the second-order polynomial model is the most suitable for simulating experimental data. The results of the two studies mentioned above show that Full Factorial, Plackett–Burman, and Box–Behnken designs work well for creating geothermal reservoir models. The polynomial surrogate model from the ED-RSM method also provides a way to evaluate probabilistic resources by applying the Monte Carlo method, thus each parameter in the polynomial model can be described by using a probability distribution (Ciriaco A. E. et al., 2020).
The main objective of this study was to optimize the ED-RSM workflow to quantify uncertainty screening parameters before constructing a proxy model. The experiment involved a case study of a potential hydrothermal field in the Beibuwan Basin in China. The reservoir models of this field were established according to the natural conditions. Six reservoir parameters were selected to build the experimental design reservoir model. These parameters were horizontal (kx and ky) and vertical (kz) permeability, porosity, volumetric specific heat, and volume of a single rock type. For each reservoir model, two-level Full Factorial design and Box–Behnken design were implemented. The Box–Behnken design requires three levels; therefore, the final regression model was combined with the Monte Carlo method to generate the heat storage probability distribution, and the result was compared with the result obtained from the traditional volumetric heat storage method (Ciriaco A. E. et al., 2020). These six parameters were selected based on expert knowledge and experimental requirement. These specific rock parameters (kx, ky, kz, porosity, volumetric specific heat) and different lithology rock volumes exhibit a significant impact on amount of stored geothermal energy (q). Although other model parameters could also be included in the survey (such as upstream location parameters and reservoir model boundaries), based on experience, it was concluded herein that these six selected parameters were the most suitable for this study. It is strongly believed that this new type of numerical simulation-Monte Carlo method for probabilistic resource assessment is a useful and convenient method. Therefore, it is very important to use the ED-RSM framework to establish a powerful working framework to construct polynomial models for numerical modeling.
2 Methodology
A predictive model is a statistical model constructed from a collection of data for a system of interest, which is then used to predict the future behavior of the system (Ciriaco A. E. et al., 2020). In this study, a prediction model was created to predict the geothermal capacity of potential geothermal fields by using detailed geological models and numerical temperature fields. Three important components were identified to improve the geothermal ED-RSM workflow to predict geothermal capacity: 1) experimental design, 2) model parameters and parameter values, and 3) modeling acceptance criteria. In this experimental design process, two ED methods were fully utilized, and the key influencing parameters were identified by the two-level Full Factorial method, and then several types of parameters exhibiting the greatest impact on the results were selected as the basis of numerical simulation for geothermal energy. Based on obtaining the simulation calculation results, the second-order Fractional Factor experimental design method, i.e., Box–Behnken method was used to establish the proxy model. After the proxy model was established, it was judged whether it was reasonable through a set model acceptance standard. In case, it was unreasonable, the simulation sets for proxy model were optimized again until they reached the standard, and the probability distribution of geothermal energy was calculated by using the proxy model and via the Monte Carlo method. Use of this approach not only solves the problem of too many experimental parameters and cumbersome calculations, but also retains the characteristics of each parameter to the greatest extent. Moreover, the process of numerical calculation using a computer system can be omitted (Figure 1).
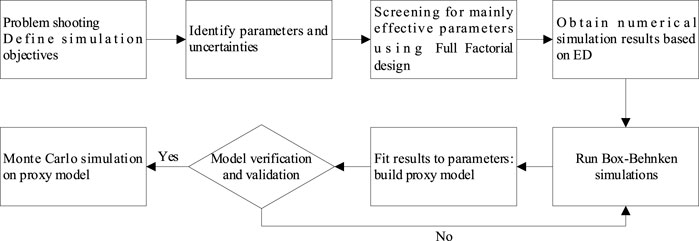
FIGURE 1. The ED-RSM workflow used in this study for probabilistic resource assessment by using numerical models.
2.1 Experimental design
In the ED-RSM workflow, the parameters in the reservoir model are changed simultaneously according to the experimental design (Amudo et al., 2009). In this study, two experimental designs, namely, Full Factor and Fractional Factor were considered to simultaneously evaluate the response of a given output parameter to changes in input variables. The main advantage of Full Factorial design is that it allows for the evaluation of all possible parameter combinations and the collection of every possible data point, thus providing a simple method for selecting the best conditions. When using the Fractional Factorial design, part of the factorial design can simultaneously change and evaluate various factors (Walpole et al., 2012). The two most commonly used Fractional factorial designs are the Plackett–Burman design and the Box–Behnken design. The Plackett–Burman design is the most widely used in geothermal applications (Hoang et al., 2005; Quinao and Zarrouk, 2014, 2018). However, in this study, it was decided to perform a two-level Full Factorial design instead of a Plackett–Burman design to obtain more detailed factor information. Box–Behnken design is a high-order design that can be used to estimate interaction and quadratic effects. It is an independent quadratic design, with each factor requiring three levels, and it can be achieved with fewer model runs. Previous studies have shown that the fitting of modeling results requires a second-order polynomial model (Simpson et al., 1998), and this model has been successfully applied in the model of the Rotorua geothermal field (Ciriaco et al., 2018).
2.2 Simulation parameters and parameter values
The next step after selecting the most appropriate experimental design is the determination of the parameters or factors, their values, and their levels. The level of the factor refers to the setting of the parameter value. Each parameter is assigned a minimum (low) setting and a maximum (high) setting, and in a factorial design, these settings are assigned codes of −1 and +1, respectively. This range of values illustrates the possible uncertainty of parameters. Table 1 summarizes all the parameters and their values used in this study. The low range and high range are initially based on expert knowledge, and the range of consideration is very wide. The number of factors and their levels affects the number of simulation runs required to execute a particular design. Box–Behnken design requires a three-level factorial design (Friedmann et al., 2003; Hoang et al., 2005; Ciriaco et al., 2018; Fukuda et al., 2018). To evaluate the performance of the Full Factorial design, two-level setting was carried out.
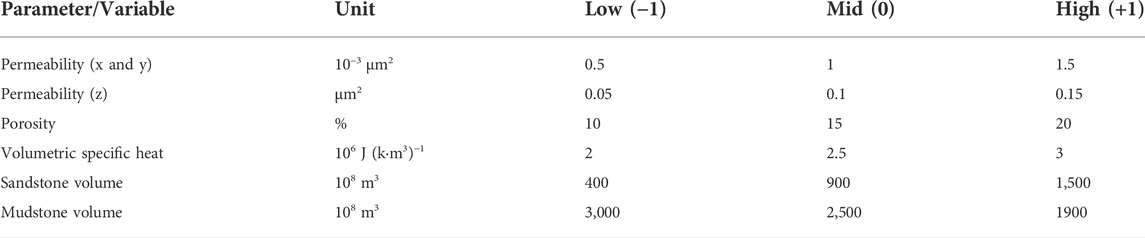
TABLE 1. Input parameters applied in the experimental design model.
2.3 Acceptance criteria
A residual graph was used to verify the effectiveness of the regression model (Quinao and Zarrouk, 2014). The polynomial model was evaluated based on the goodness of fit. The two measures of goodness of fit are R-squared (R2) and adjusted R2. For a given set of predictors, a higher R2 value usually indicates that the polynomial model is better able to explain the change in response surface. However, even if the added predictor variable is not significant, R2 increases naturally with the number of predictor variables. The adjusted R2 performs better than R2 because it adds independent variables that do not contribute to the explanatory power of the model. Monte Carlo simulation was performed on the final regression model. A simple triangular distribution based on the most probable minimum and maximum value was assigned to each important variable. A simple triangular distribution is usually sufficient to describe the uncertainty level of key reservoir parameters (Parini and Riedel, 2000). Thus, 8,000 random samples were created to generate the probability distribution of thermal energy q.
2.4 Thermal energy calculation
The thermal energy q stored in a reservoir can be calculated by dividing the reservoir into n different regions of volume Vi and temperature
where:
This study considers the influence of porosity on the above-mentioned equation. Therefore, the thermal energy in the rock (qr) and in the fluid (qf) was calculated separately by introducing porosity φ.
According to the geological model of a geothermal reservoir and the results of three-dimensional (3D) temperature field finite element model, the energy calculation of the finite element grid can be carried out by the above-mentioned method, and the energy of partition, layering, and rock-splitting type can be obtained. Further, the relationship among different geological parameters can be established by the ED method introduced herein, and an estimate of the geothermal reservoir’s energy can be obtained quickly, and other favorable targets can be evaluated more quickly and easily.
3 Case studies
In order to improve the existing methods of constructing polynomial models, the ED-RSM workflow was applied to the geothermal potential field in the Beibuwan Basin in South China. The geothermal systems are in the South China Volcanic Zone, and their hot geothermal fluids are used for residential and commercial energy purposes.
3.1 Research area background
The research area, which is in the easternmost part of the Maichen depression of the Beibuwan Basin, is an oil and gas exploration block. The area, which spans 6,256 km2, is located in the Leizhou Peninsula, Guangdong Province, China. The structural location belongs to the eastern part of the Beibuwan Basin on the continental shelf of the South China Sea (Figure 2). In the Cenozoic, the Beibuwan Basin underwent extensional faulting to form the basin; there is a double-layer structure of a vertical superimposed Paleogene faulted (or rifted) basin and a Neogene depression basin. In the Paleogene, extensional structures with twisted structures mainly developed, while in the Neogene-Quaternary period, extensional structures mainly developed. Huge, thick Paleogene sands and mudstone strata (Changliu Formation, Liushagang Formation, and Weizhou Formation) have been deposited in the various depressions in the Beibuwan Basin (Figure 3). Among them, the Liushagang Formation is a set of shallow and middle-deep lacustrine mudstone deposits. The reservoirs are mainly sandstones of the Liushagang and Weizhou Formations, and the regional caprock is a large set of dark mudstone and shale of the Liushagang Formation (Figure 4). The Maichen depression can be divided into five structural units: the southern steep slope zone, the deep depression zone, the inner gentle slope zone, the outer gentle slope zone, and the western depression. Faults (mainly normal faults) are developed in the area. The depression-controlling faults mainly have NE strike. The boundary faults at both ends of the depression (X fault and M2 fault) have NW strikes. The secondary faults have mostly NE strikes in the deep part and NE strikes in the shallow part. In general, in the Paleogene, the Beibuwan Basin experienced the initial fault-sag period of the Paleocene, the strong fault-sag period of the Eocene, and the stable subsidence period of the Oligocene. The tectonic activity indicates a weak–strong–weak change. More importantly, the Maichen depression experienced a strong tectonic inversion in the late period of the first stage, and the strata suffered strong denudation.
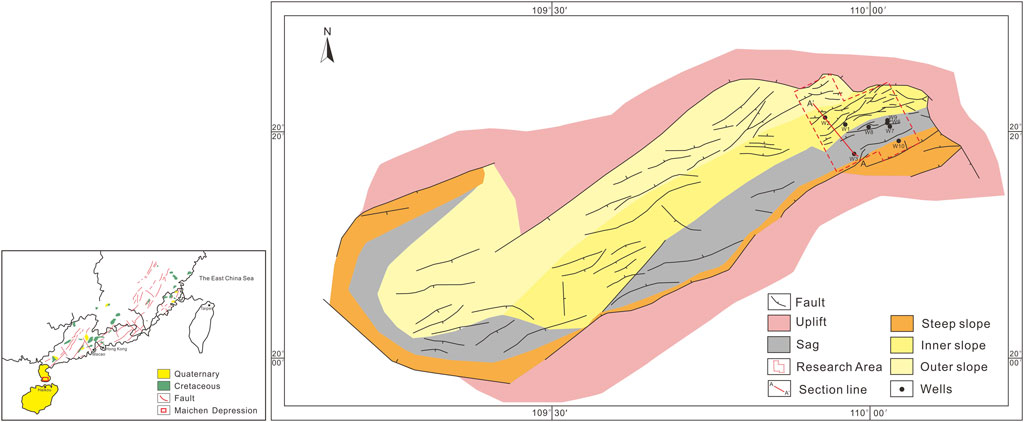
FIGURE 2. Location of the research area.
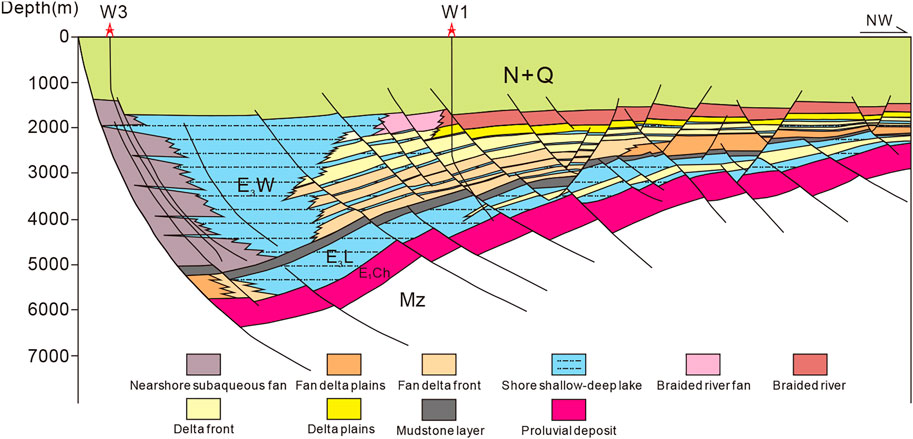
FIGURE 3. Section view and stratigraphy of the research area.
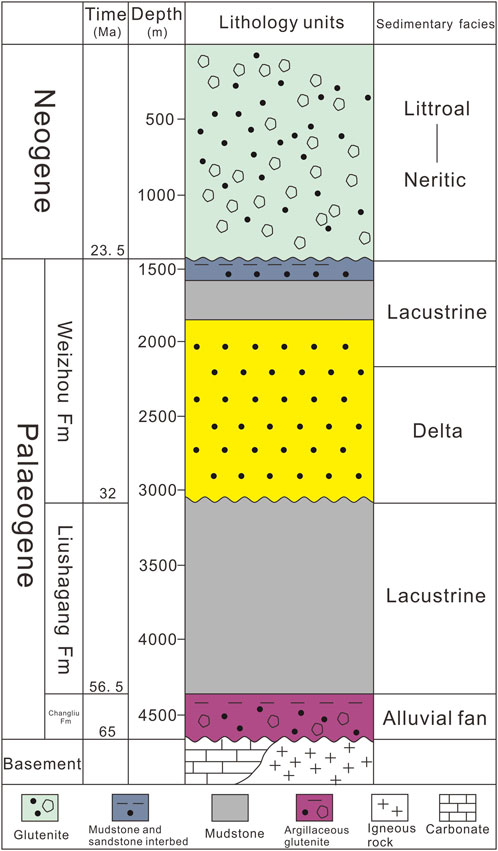
FIGURE 4. Sedimentary column of the research area.
According to the previous studies, the land heat flow value of the South China Sea coast varies between 60 and 80 mW m−2 (Zhao et al., 2019), and the heat flow value increases in the direction of the ocean basin. The surface heat flow value of each basin is different. The scale of the Beibuwan Basin is relatively small. The panoramic view of the basin is near the east to the Hainan and Leizhou areas, which are separated by the Hainan uplift and Qiongdongnan depression. The average surface heat flow value of the Beibuwan Basin is 61.2 mW m−2 (Chen et al., 2014). The geothermal energy in the area mainly comes from mantle-source heat and crustal reflective elements. According to a previous study, the temperature of the Moho in the Beibuwan Basin varies in the range of 700–800°C, the heat flow composition of the Beibuwan Basin is stable, and the heat flow of the crust surface varies between 38% and 42%. This previous study used the Mckenzie model and the Hutchison heat balance formula to comprehensively study the heat flow history of the Beibuwan Basin since the Cenozoic, based on measured ground temperature data. The corresponding time of the Himalayan movement leading to the thermal event is the period of intense volcanic activity since the Neogene. Previous studies have shown that the Beibuwan Basin has a relatively high current geothermal gradient, with an average value of 3.72°C/100 m, and there is a relatively low geothermal gradient in the Maichen Sag. In this study, the ground temperature was obtained and calculated from well temperature logging data in the study area. Then, a profile diagram of the relationship between underground temperature and depth was drawn (Figure 5); the temperature values were obtained from both well temperature logging data and actual measured underground temperature data. The measured data are generally higher than the well temperature data, and the measured data more truly reflect the underground temperature; however, the well temperature logging data exhibit better continuity and can better reflect the change of temperature with depth. In the temperature logging curve of Well W1, there are abnormal temperature areas that are distributed in the middle of the Liushagang Formation, and the characteristics of the measured well temperature data are not obvious. The temperature logging curve of Well W6 exhibits an increasing inflection point at the depth of 2,800 m, which may be related to the presence of the top layer containing the oil and gas reservoir. Herein, the current ground temperature gradient was calculated by plotting the measured ground temperature and depth profile. According to statistics, the annual average temperature of the surface in the Maichen depression is 22–26°C, and the average temperature is 24°C. The average temperature gradient is 3.19°C/100 m, which is calculated based on the reference surface.
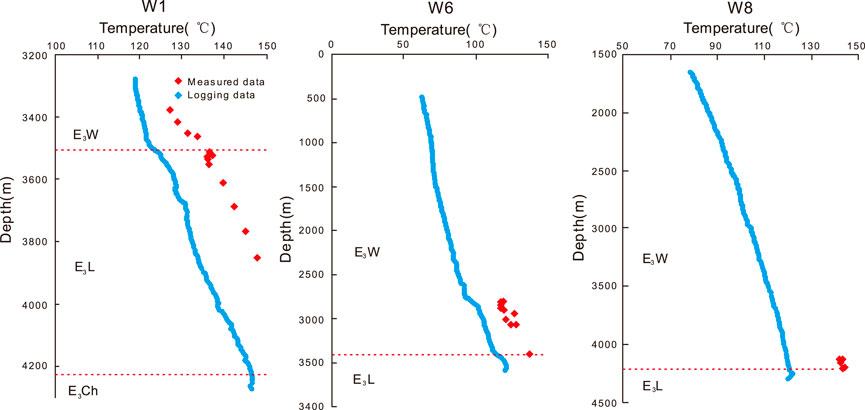
FIGURE 5. Temperature gradient from the measured and logging data.
3.2 Geological model
The 3D information of the configuration of the underground structure was compiled, visualized, and interpolated (Ebong et al., 2019). The model is 18 km wide from east to west and 20 km wide from north to south (Figure 6). The model has seven formation layers, two sedimentary facies, and two lithological characteristics, thus the vertical grid spacing of the 3D model incorporates the number of layers and their respective thickness changes. The bottom of the model extends down to the Lithosphere–Asthenosphere Boundary (LAB) at a depth of nearly 30 km. In the horizontal direction, the 3D structure of each geological layer is defined with 170,392 grid nodes, corresponding to a grid spacing of 50 m.
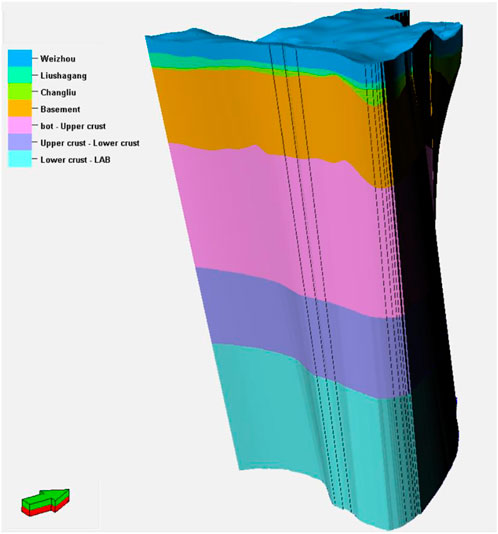
FIGURE 6. Geological model of the research area.
The lithological model of the research area was also created by combining geostatistical and geological information (Figure 7) (Ebong et al., 2020; Ebong et al., 2021). In the 3D geological model, there are two sets of sandstone reservoirs in the target layers Weizhou and Liushagang; in the southern part of the research area, sandstone is mainly distributed locally in the ascending plate of the fault, and the deep depression of the settlement center at the descending plate contains some turbidite sandstone. In the gentle slope to the north, there are mainly deposits of river sand bodies, with obvious belt distribution characteristics, and the other locations mainly contain delta front mud and shallow lacustrine mudstone. The sand body is unevenly distributed and has great variability in lithology, porosity, and permeability. Therefore, the thermal storage correlation coefficients related to lithology and horizontal rock spatial structure also exhibit great variability. In this study, the thermal conductivity (TC), thermal diffusivity (TD), and specific heat capacity of a single well were calculated by using logging calculation methods and acoustic wave, neutron, density, natural gamma, and resistivity curves (Fuchs et al., 2015). Therefore, geostatistical method was used herein to build the geological model based on information of rocks from various single wells. The thermal correlation coefficient can be used to form a 3D thermal correlation coefficient attribute model, which is of great significance for temperature calculation. The model reveals that the TC of sandstone is higher, with an average value of 3.01 W (m⋅K)−1, and the average TC of the mudstone is 2.1 W (m⋅K)−1, with a large spatial variation. The general rule is that the TC of sandstone is greater; however, it is affected by different lithofacies of sandstone, thus the TC of the sandstone also varies in space. The general rule is that the TC of river sand bodies is better than that of turbidite sand bodies, and the TC of lacustrine mudstone is larger than that of delta mudstone (Chen, 1988; Qiu et al., 2004; Guo et al., 2020).
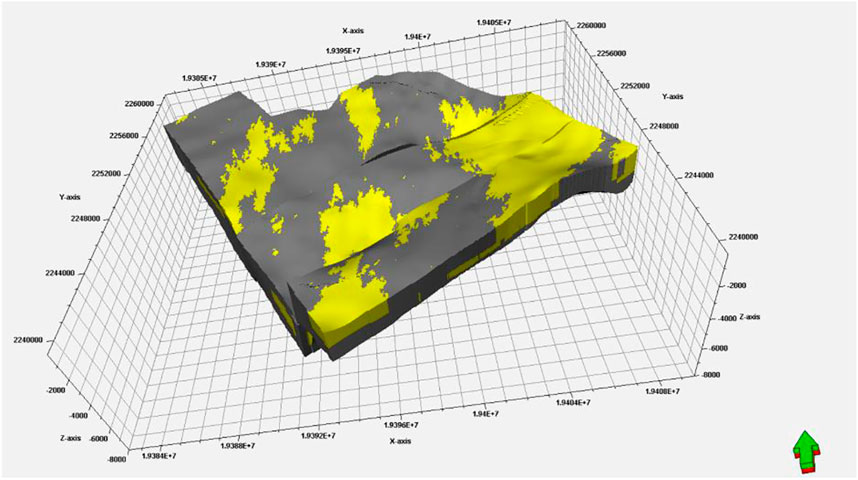
FIGURE 7. Lithological model of Weizhou and Liushagang layers of the research area (the yellow area is sand and the dark gray area is mudstone).
3.3 Thermal modeling approaches
To predict the temperature distribution at depth, the steady-state conduction heat field was calculated at the scale of the entire lithosphere.
For purely conductive temperature calculations, it was assumed that heat is mainly transmitted through conduction throughout the Earth’s lithosphere. The formula of the related equation is as follows (Sippel et al., 2013):
Under the assumption of thermal equilibrium, the first term on the left side of Eq. 2 can be ignored (i.e.,
Eq. 3 indicates that the calculated temperature is only sensitive to the radiogenic heat generation (S), the bulk thermal conductivity (
To calculate the 3D heat conduction field, each unit of the 3D geological model is provided with radiant heat generation values and bulk (solid and fluid) thermal conductivity. The lateral boundary conditions of the model are considered to be closed, and a constant temperature of 24°C at the topographic surface of the Earth is defined as the upper boundary condition. The lower boundary condition for the purely conductive thermal modeling corresponds to a temperature of 1,300°C at the LAB.
3.4 Results and discussion
3.4.1 Temperature simulation result
Figure 8A,B shows the temperature field distribution result calculated by using numerical simulation under the Mid value of the six main influencing factors (permeability (x and y), permeability (z), porosity, volumetric specific heat, sandstone volume, mudstone volume) selected according to ED. The temperature distribution results indicate that the Weizhou and Liushagang target layers have similar overall temperature distributions. The highest temperatures are concentrated in the subsidence center of the descending disk of the fault and the temperatures increase unevenly to the north. However, the overall temperature of the ascending disk is relatively low. Specifically, for the Weizhou group, the highest temperature reaches 168°C and the lowest temperature is 96°C; nonetheless, the highest temperatures exhibit a very small distribution range, and it is difficult to use the areas with these high temperatures as an effective thermal reservoir. The geothermal energy in the area where the temperature is above 130°C can be used as a geothermal resource for power generation, but overall, there are fewer geothermal resources. However, the overall temperature of the Liushagang group is higher, reaching a maximum of 219°C, which is distributed in the fault descending disk and the range of high temperature is small. The temperature of the nearby area is above 130°C, and the range of the temperature is wide. If Liushagang group is used as a geothermal reservoir for power generation, significant amount of energy can be obtained. Therefore, the Liushagang group can be considered as the main layer for geothermal reservoir power generation development, and the shallower Weizhou formation can be used to provide energy for refrigeration, heating, and other purposes. Furthermore, 3D multi-layer well pattern development should be implemented to obtain the maximum recovery rate.
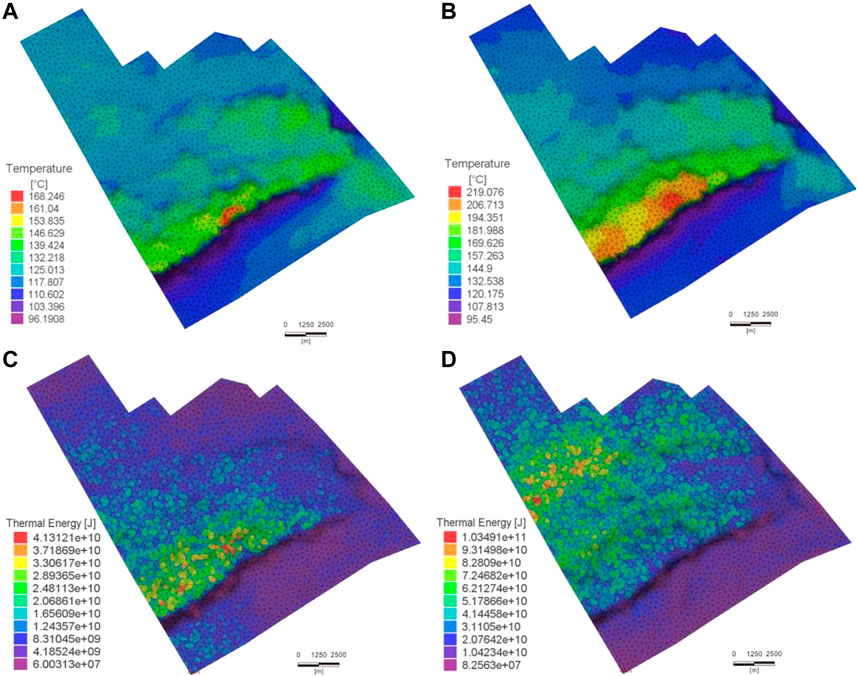
FIGURE 8. (A) The temperature distribution of the bottom of Weizhou Formation, (B) The temperature distribution of the bottom of Liushagang Formation, (C) The thermal energy of the bottom of Weizhou Formation and (D) The thermal energy of the bottom of Liushagang Formation.
3.4.2 Thermal energy
Thermal energy is a vital factor in the evaluation process. Various evaluation methods are available for exploration of geothermal resources. So far, the main calculation methods can be divided into two categories, namely, volumetric method and numerical simulation method. For geothermal projects that have not yet been developed or are in the early stages of development, the volumetric method is the recommended method. In contrast, numerical simulation is more suitable for predicting sustainable production capacity after exploration drilling. Obviously, this study is related to long-term geothermal resource estimation for untapped geothermal projects, thus the volumetric method is used in thermal energy calculations. The thermal energy q generated in the rock can be calculated by dividing the model into n different elements of volume
Similar to the above-mentioned temperature field calculation, the Mid values of several main parameters were considered and the thermal energy was calculated according to the volumetric method (Figure 8C,D). Compared with the traditional simplified calculation method, by using the calculated finite element model, all elements were assigned with heterogeneous volumetric specific heat capacity and temperature, which is more convincing than the results obtained by assuming that the volumetric specific heat capacity and temperature of each layer are homogeneous. The calculated result shows that the total thermal energy of the sand geothermal reservoirs is 5.6 × 10¹⁴ J. According to the conversion standard that 1 ton of standard coal can generate energy of 2.9 × 10¹⁰ J, the amount of geothermal resources is equivalent to 1.9 × 10⁴ tons of standard coal. Taking the depth of the reservoir into consideration, herein it was initially believed that the reservoir has a certain economic value.
The above-mentioned results are only the numerical simulation calculation results when each parameter takes the Mid value. When the ED-RSM method was employed, it was required to design experiments according to the numerical values of different experimental designs and corresponding simulation result was calculated. Then, the parameters and results were analyzed by the response surface method, which is direct correspondence analysis and forms surrogated numerical models.
3.4.3 Two-level full factorial
Out of 64 runs, a total of five possible outliers were identified and extracted from Regression analysis, which is indicated in normal Q–Q plot and Box plot, and a skewed histogram plot of q was generated from all successful runs (Figure 9). A review of the outlier input parameters shows that the horizontal and vertical permeability values for all failed runs were set at 10–16 m2, which is the lowest meaningful value. Moreover, in all failed cases, the lithology volume was set to a low value, while the volumetric specific heat was set to a Mid value (Table 1). These early indications suggest that permeability, lithology volume, and volumetric specific heat could have a significant impact on the resource potential of the M field (Table 2). Plots without outliers are shown in Figure 10 (a). Regression analysis was performed after removing the outliers from the result to construct: 1) The first-order main effect, and 2) the first-order with interaction. A higher R2 and adjusted R2 values were obtained from the latter, as presented in Table 2. Figure 10 (a) shows the curvature that indicates the need to build a second-order polynomial model (Simpson, 1998). According to the results of R2 and adjusted R2, and compared with the subsequent second-order Box–Behnken calculation results, a second-order simulation better fits the data based on the residual plots (Figure 11).

FIGURE 9. Diagnostic plots for all 64 successful two-level Full Factorial design simulation runs.

TABLE 2. The p-value of parameters applied in a first-order regression model with interactions.
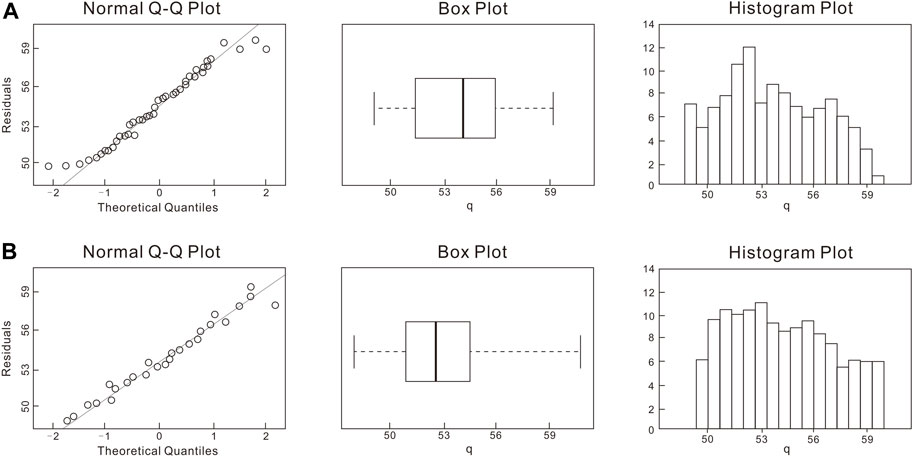
FIGURE 10. Diagnostic plots for the (A) two-level Full Factorial simulation without outliers and (B) Box–Behnken simulation runs.
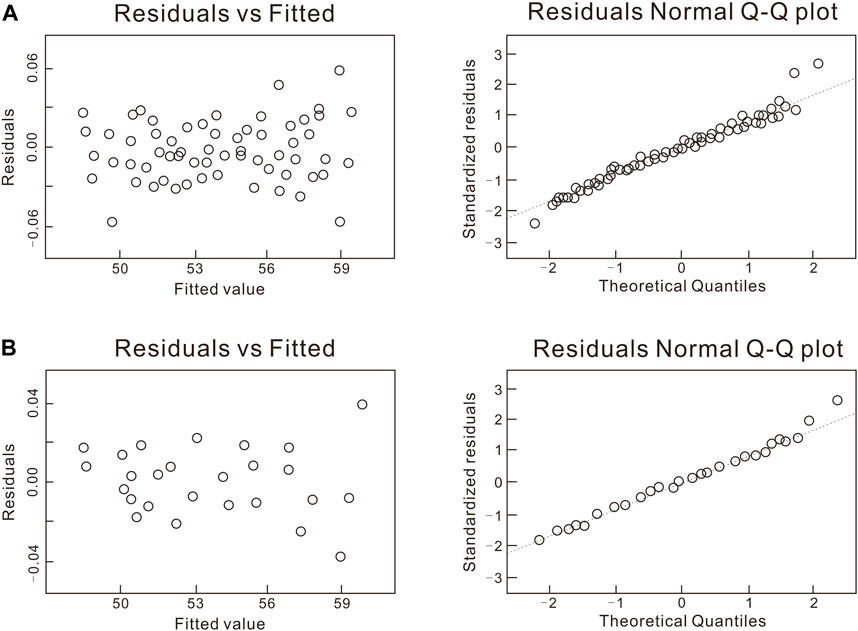
FIGURE 11. Residual plots of the (A) first-order regression model with interactions and (B) Box–Behnken second-order regression model with interactions among significant parameters plus kz.
3.4.4 Box–Behnken
Based on the result of the two-level Full Factorial, further, three significant parameters and kz were adopted for the subsequent second-order model with interaction regression analysis (Figure 11). The multi-factor relationship of Box–Behnken design second-order model with interaction is presented in Table 3, and the R2 and adjusted R2 shows a better fit than that of the two-level Full Factorial design. The experiment exhibited a total of 29 runs and three of the results were outliers [Figure 10 (b)]. Table 2 summarizes that the lithology volume was a significant predictor and the R2 and the adjusted R2 were 0.9875 and 0.9867, respectively. The results (Table 3) from the second-order polynomial models provided a higher R2 and adjusted R2 values and indicated that a second-order model better fitted the data based on the residual plots [Figure 11B]. A p-value of less than 0.05 indicates that the parameter is a significant predictor of the response variable, so the first and second order of kx, ky, kz, porosity, volumetric specific heat, lithology volume, and their interactions turned out to be significant predictors of q. The residuals are not distributed normally as shown in Figure 11 (b), so a polynomial equation can also be included in the design and a probabilistic distribution of q was formed by using the Monte Carlo method. A simple triangular distribution was assigned to each parameter. The result of the ED-RSM method improved by two-level Factorial and Box–Behnken designs is presented in Figure 12. Clearly, the M geothermal field consists of a thermal energy resource of 5 × 10¹⁴ J (90th percentile), 5.3 × 10¹⁴ J (50th percentile), and 5.7 × 10¹⁴ J (10th percentile). The potential energy is also calculated by the volumetric stored heat method (Muffler P and Caraldi R, 1978), and the resultsare 5.1 × 10¹⁴ J (90th percentile), 9 × 10¹⁴ J (50th percentile), and 1.5 × 10¹⁵ J (10th percentile). By comparing the results obtained by the two methods, the ED-RSM results have a significantly narrower distribution than that of the volumetric method, which can be attributed to the constrained reservoir model.
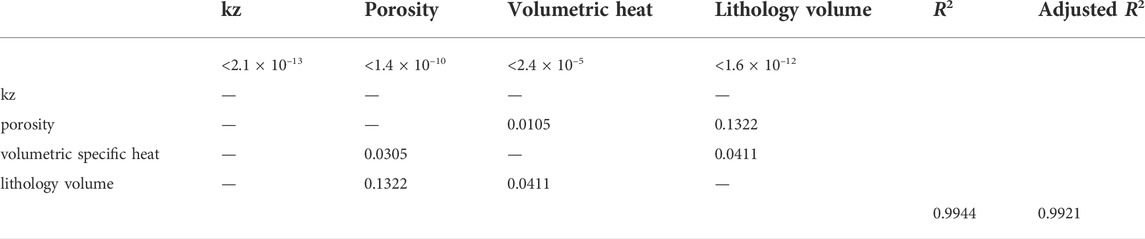
TABLE 3. The p-value of parameters applied in building a Box–Behnken design second-order model with interactions.
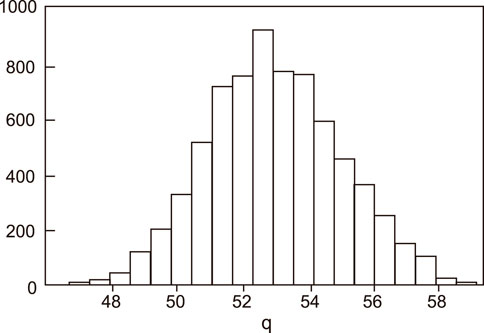
FIGURE 12. Geothermal probabilistic resource assessment.
4 Conclusion
The current evaluation process of a favorable target requires long-term geological research and model establishment and calculation. In many cases, project evaluation is faced with many uncertain parameters and incomplete geological understanding. The commonly used Monte-Carlo method for uncertainty evaluation often offers a wide range result, which makes it difficult to obtain appropriate decisions. In this study, two-level Full Factorial and Box–Behnken designs were combined to simplify the three-level experimental design and strengthen the two-level experimental design, then integrated with RSM, a proxy model was built to carry out evaluation. The results are reliable and have a narrow interval, and can provide better guidance than that of the simple Monte–Carlo method.
The proxy polynomial model of the ED-RSM workflow was derived from the calibrated numerical temperature field and the geological model, a 3D geological model of M geothermal field was established, and the 3D uneven temperature field is built horizontally and vertically in the model. The geological model can accurately predict the petrophysical and thermal properties of sandstone reservoirs. The 3D temperature field model is extremely important for characterizing geothermal reservoirs because temperature is the primary resource of geothermal reservoirs; the higher the temperature, the better the evaluation result. The establishment of the comprehensive model provides a scientific basis for ED-RSM.
Three-level Full Factorial design is not applicable for multi-factor implementation in geothermal projects, because the numerical simulation is very time-consuming. Therefore, we are looking to combine two-level Full Factorial design and three-level Fractional Factorial design methods. Through first-order regression analysis, effective parameters are optimized and the number of insignificant parameters are reduced, then the maximum information can be obtained by the simulation of three-level Fractional Factorial design with least work. Finally, the improved ED-RSM method with two-stage design, which combined two-level Full Factorial design and Box–Behnken design, is proposed. The proposed method more quickly and accurately provides a narrower interval of probabilistic geothermal resource than that provided by the volumetric method, thus it provides more valuable information. In addition, the permeability does not much affect the thermal energy, partially because only a conductive thermal model was used to calculate the temperature.
Data availability statement
The original contributions presented in the study are included in the article/supplementary material, further inquiries can be directed to the corresponding author.
Author contributions
WM contributed the conception of the paper, the establishment of geothermal model, the calculation of geothermal resources and the review of the paper; YF designed the experiment and wrote the draft of the paper; ZY, ZD and FJ provided the research results and understanding of geothermal geology in Maichen Depression; LJ and ZY were responsible for the clear drawing of maps.
Funding
This study was financially supported by National Key Research and Development Projects (No. 2019YFC0604903, No. 2021YFA0716004) and Joint Fund of the National Natural Science Foundation of China (Grant No. U20B6001).
Conflict of interest
The authors declare that the research was conducted in the absence of any commercial or financial relationships that could be construed as a potential conflict of interest.
Publisher’s note
All claims expressed in this article are solely those of the authors and do not necessarily represent those of their affiliated organizations, or those of the publisher, the editors and the reviewers. Any product that may be evaluated in this article, or claim that may be made by its manufacturer, is not guaranteed or endorsed by the publisher.
References
Acuna, J. A., Parini, M. A., and Urmeneta, N. A. (2002). Using A large reservoir model in the probabilistic assessment of field management studies. 27th workshop on geothermal reservoir engineering. Stanford, CA: Stanford University.
Amudo, C., Graf, T., and Dandekar, R. R. (2009). The pains and gains of experimental design and response surface applications in reservoir simulation studies. The Woodlands, Texas: SPE Reservoir Simulation Symposium.
Bertani, R. (2012). Geothermal power generation in the world 2005–2010 update report. Geothermics 41, 1–29. doi:10.1016/j.geothermics.2011.10.001
Bertani, R. (2016). Geothermal power generation in the world 2010–2014 update report. Geothermics 60, 31–43. doi:10.1016/j.geothermics.2015.11.003
Box, G. E. P., Hunter, W. G., and Hunter, J. S. (1978). Statistics for experimenters, an introduction to design, data analysis, and model building. New York, NY: John Wiley & Sons.
Box, G. E. P. (1979). “Robustness in the strategy of scientific model building,” in Robustness in statistics, 201–236.
Chen, S. B., Gan, H. J., and Xia, C. Y. (2014). History simulation of thermal evolution and hydrocarbon generation of source rocks in Bailian Sub-Sag, Fushan Sag, Beibuwan Basin. Xinjiang Pet. Geol. 35 (6), 672–677. (In Chinese with English abstract).
Ciriaco, A. E., Zarrouk, S. J., Zakeri, G., and Mannington, W. I. (2020b). Refined experimental design and response surface methodology workflow using proxy numerical models for probabilistic geothermal resource assessment. Geothermics 88, 101911–101934. doi:10.1016/j.geothermics.2020.101911
Ciriaco, A. E., Zarrouk, S. J., and Zakeri, G. (2020a). Geothermal resource and reserve assessment methodology: Overview, analysis and future directions. Renew. Sustain. Energy Rev. 119, 109515. doi:10.1016/j.rser.2019.109515
Ciriaco, A. E., Zarrouk, S. J., and Zakeri, G. (2018). Probabilistic resource assessment using experimental design and second order proxy model: Rotorua geothermal system, New Zealand. 40th New Zealand geothermal workshop.
Doherty, J., Yeh, A., and Colina, R. (2017). Experiments with inverse modelling and uncertainty quantification with a geothermal model. 39th New Zealand Geothermal Workshop.
Ebong, E. D., Akpan, A. E., Ekwok, S. E., Esu, E. O., and Ebong, L. A. (2021). 3-D reservoir characterization and hydrocarbon volumetric estimation of parts of Niger delta basin-Nigeria. J. Afr. Earth Sci. 180, 104207. doi:10.1016/j.jafrearsci.2021.104207
Ebong, E. D., Akpan, A. E., and Ekwok, S. E. (2020). Stochastic modelling of spatial variability of petrophysical properties in parts of the Niger delta basin, southern Nigeria. J. Pet. Explor. Prod. Technol. 10, 569–585. doi:10.1007/s13202-019-00787-2
Ebong, E. D., Akpan, A. E., and Urang, J. G. (2019). 3D structural modelling and fluid identification in parts of Niger delta basin, southern Nigeria. J. Afr. Earth Sci. 158, 103565. doi:10.1016/j.jafrearsci.2019.103565
Friedmann, F., Chawathe, A., and Larue, D. K. (2003). Assessing uncertainty in channelized reservoirs using experimental designs. SPE Reserv. Eval. Eng. 6 (4), 264–274. doi:10.2118/85117-pa
Fuchs, S., Balling, N., and Forster, A. (2015). Calculation of thermal conductivity, thermal diffusivity and specific heat capacity of sedimentary rocks using petrophysical well logs. Geophys. J. Int. 203 (3), 1977–2000. doi:10.1093/gji/ggv403
Fukuda, I. M., Pinto, C. F. F., Moreira, C. D. S., Saviano, A. M., and Lourenco, F. R. (2018). Design of experiments (DoE) applied to pharmaceutical and analytical quality by design (QbD). Braz. J. Pharm. Sci. 54, 1–16. doi:10.1590/s2175-97902018000001006
Guo, P. Y., Bu, M. H., Li, Q. B., and He, M. C. (2020). Research progress of accurate measurement and characterization model of effective thermal conductivity of rock. Chin. J. Rock Mech. Eng. 39 (10), 1983–2013.
Hoang, V., Alamsyah, O., and Roberts, J. (2005). Darajat geothermal field expansion performance - a probabilistic forecast. Antalya, Turkey: World Geothermal Congress.
Lund, J. W., and Boyd, T. L. (2016). Direct utilization of geothermal energy 2015 worldwide review. Geothermics 60, 66–93. doi:10.1016/j.geothermics.2015.11.004
Muffler, P., and Cataldi, R. (1978). Methods for regional assessment of geothermal resources. Geothermics 7 (2-4), 53–89. doi:10.1016/0375-6505(78)90002-0
Parini, M., and Riedel, K. (2000). “Combining probabilistic volumetric and numerical simulation approaches to improve estimates of geothermal resource capacity,” in Proceedings: World geothermal congress (Japan: Kyushu-Tohoku).
Pasikki, R. G., Cita, F., and Hernawan, A., (2016). “Application of experimental design.” in Geothermal greenfield size assessment. Indonesia international geothermal convention and exhibition.
Qiu, L. S., Hu, S. B., and He, L. J. (2004). Theory and application of geothermal regime research in sedimentary basin. Beijing: China Petroleum Industry Press.
Quinao, J. J. D., and Zarrouk, S. J. (2018). Geothermal resource assessment using experimental design and response surface methods: The Ngatamariki geothermal field, New Zealand. Renew. Energy 116, 324–334. doi:10.1016/j.renene.2017.09.084
Quinao, J. J., and Zarrouk, S. J. (2014). “Applications of experimental design and response surface method in probabilistic geothermal resource assessment – preliminary results,” in Proceedings: Thirty-Ninth workshop on geothermal reservoir engineering (Stanford).
Santner, T. J., Williams, B. J., and Notz, W. (2003). The design and analysis of computer experiments. 2nd ed. New York: Springer-Verlag.
Simpson, T. W., Mauery, T. M., and Korte, J. J. (1998). “Comparison of response surface and kriging models in the multidisciplinary design optimization,” in 7th AIAA/USAF/NASA/ISSMO symposium on multidisciplinary analysis and optimization.
Sippel, J., Fuchs, S., Cacace, M., Braatz, A., Kastner, O., Huenges, E., et al. (2013). Deep 3D thermal modelling for the city of Berlin (Germany). Environ. Earth Sci. 70 (8), 3545–3566. doi:10.1007/s12665-013-2679-2
Walpole, R. E., Myers, R. H., and Myers, S. L. (2012). “Probability and statistics for engineers and scientists,” in Pearson. 9th ed. (Zealand: Prentice-Hall).
Keywords: south China, maichen sag, probabilistic geothermal energy assessment, experimental design, response surface methodology, temperature field, geothermal geological model
Citation: Wang M, Yang F, Zhang Y, Zhang D, Feng J, Luo J and Zeng Y (2022) Probabilistic geothermal resource assessment in Maichen Sag, south China. Front. Earth Sci. 10:972125. doi: 10.3389/feart.2022.972125
Received: 17 June 2022; Accepted: 05 September 2022;
Published: 28 September 2022.
Edited by:
Amin Beiranvand Pour, INOS University Malaysia Terengganu, MalaysiaReviewed by:
Bo Liu, Northeast Petroleum University, ChinaEbong D. Ebong, University of Calabar, Nigeria
Copyright © 2022 Wang, Yang, Zhang, Zhang, Feng, Luo and Zeng. This is an open-access article distributed under the terms of the Creative Commons Attribution License (CC BY). The use, distribution or reproduction in other forums is permitted, provided the original author(s) and the copyright owner(s) are credited and that the original publication in this journal is cited, in accordance with accepted academic practice. No use, distribution or reproduction is permitted which does not comply with these terms.
*Correspondence: Mingchuan Wang, d2FuZ21jLnN5a3lAc2lub3BlYy5jb20=