
94% of researchers rate our articles as excellent or good
Learn more about the work of our research integrity team to safeguard the quality of each article we publish.
Find out more
ORIGINAL RESEARCH article
Front. Earth Sci., 28 October 2022
Sec. Volcanology
Volume 10 - 2022 | https://doi.org/10.3389/feart.2022.972071
This article is part of the Research TopicRemote Sensing of Volcanic Gas Emissions from the Ground, Air, and SpaceView all 18 articles
 Dario Delle Donne1,2*
 Eleonora Lo Coco1
 Marcello Bitetto1
 Francesco Paolo La Monica1
 Giorgio Lacanna3
 Joao Lages1
 Maurizio Ripepe3
 Giancarlo Tamburello4
 Alessandro Aiuppa1
Improving volcanic gas monitoring techniques is central to better understanding open-vent, persistently degassing volcanoes. SO2 cameras are increasingly used in volcanic gas studies, but observations are commonly limited to one single camera alone viewing the volcanic plume from a specific viewing direction. Here, we report on high frequency (0.5 Hz) systematic measurements of the SO2 flux at Stromboli, covering a 1-year long observation period (June 2017-June 2018), obtained from two permanent SO2 cameras using the same automated algorithm, but imaging the plume from two different viewing directions. Our aim is to experimentally validate the robustness of automatic SO2 camera for volcano monitoring and to demonstrate the advantage of using two co-exposed SO2 camera stations to better capturing degassing dynamics at open-vent volcanoes. The SO2 flux time-series derived from the two SO2 camera stations exhibit good match, demonstrating the robustness of the automatic SO2 camera method. Our high-temporal resolution SO2 records resolve individual Strombolian explosions as transient, repetitive gas bursts produced by the sudden release of over pressurized gas pockets and scoriae. Calculations show that explosive degassing activity accounts for ∼10% of the total SO2 emission budget (dominated by passive degassing) during mild regular open-vent activity. We show that the temporal variations of the explosive SO2 flux go in tandem with changes in total SO2 flux and VLP seismicity, implicating some commonality in the source processes controlling passive degassing and explosive activity. We exploited the spatial resolution of SO2 camera to discriminate degassing at two distinct regions of the crater area, and to minimize biases due by the station position respect to the target plume. We find that the SO2 fluxes from southwest-central (SWCC) and northeast (NEC) crater areas oscillate coherently but those from the NEC are more sensitive to the changes in the volcanic intensity. We interpret this as due to preferential gas/magma channeling into the structurally weaker north-eastern portion of the crater terrace in response to increasing supply rate of buoyant, bubble-rich magma in the shallow plumbing system.
Magmatic gases are the drivers for explosive volcanic eruptions, making their sensing and quantification of prime importance for characterizing volcano behavior (Oppenheimer et al., 2014; Vergniolle and Métrich, 2022). The advent of the SO2 camera technique (see reviews in Kern et al., 2010a, Burton et al., 2015; McGonigle et al., 2017) has paved the way to monitoring SO2 flux emissions at Stromboli (and elsewhere) with finer temporal and spatial resolution (Tamburello et al., 2012; Delle Donne et al., 2017; Aiuppa et al., 2021) than before (Allard et al., 2008). More broadly at open-vent volcanoes, SO2 cameras have led to enormous progresses in understanding the link between SO2 degassing, seismicity (McGonigle et al., 2009; Kazahaya et al., 2011; Tamburello et al., 2012; Waite et al., 2013; Nadeau et al., 2015), infrasound (Dalton et al., 2010; Delle Donne et al., 2016; Delle Donne et al., 2017), and deformation (Watson et al., 2000; Saballos et al., 2014). These studies have exploited the advantage of SO2 cameras of enabling high temporal resolution measurements of the total SO2 flux (Mori and Burton, 2006; Bluth et al., 2007), and their ability to resolve (and contribute to characterize) the variety of volcanic degassing forms and modes (Mori and Burton, 2009; Tamburello et al., 2012; Delle Donne et al., 2017).
SO2 Camera observations are normally operated by using one single SO2 camera station observing the plume from a specific viewing direction. However, the SO2 camera method, as other spectroscopic techniques used in volcanology (Oppenheimer et al., 2011), is strongly dependent on geometrical constraints (position of the observation point relative to the volcanic plume) that determine—among others—the conditions of sunlight illumination of the volcanic plume, and the presence of clear sky conditions (required to identify a correct background light intensity) (Kern et al., 2010b). The uncertainties related to these effects are difficult to quantify with one SO2 camera system alone. In addition, using one single SO2 camera station often prevents from resolving SO2 emissions from different degassing vents in the volcanic crater area—a condition commonly encountered at worldwide active volcanoes.
Here, we report on SO2 flux observations obtained at Stromboli volcano (in the period June 2017–June 2018) by using two independent, fully autonomous SO2 camera stations (Figure 1) imaging the volcanic plume from two different viewing directions. One aim of the work is to empirically test the extent to which SO2 camera measurements depend on specific observation site conditions, in the attempt to validate the robustness of automatic SO2 camera for volcano monitoring and surveillance. We also use such two differently positioned, simultaneously acquiring SO2 camera stations to spatially resolve and characterize the SO2 flux emissions from the two persistent Stromboli’s gas sources that we have recognized from data: the northern (NEC) and central-southwestern (SWCC) areas of the summit crater terrace (Figure 1, 2). We additionally exploit the high temporal resolution of the cameras to derive independent records of explosive (during Strombolian explosions) and passive (in between the explosions) SO2 emissions, integrating SO2 observations with other independent geophysical parameters such as the volcanic tremor and the Very Long Period (VLP) seismicity. The integration of these independent datasets helps us better interpreting the shallow conduit gas-magma dynamics that feed the Stromboli’s persistent Strombolian activity. Our results are also relevant for understanding use conditions and limitations of the automatic SO2 camera method in detecting changes in intensity of mild persistent open-vent volcanic activity.
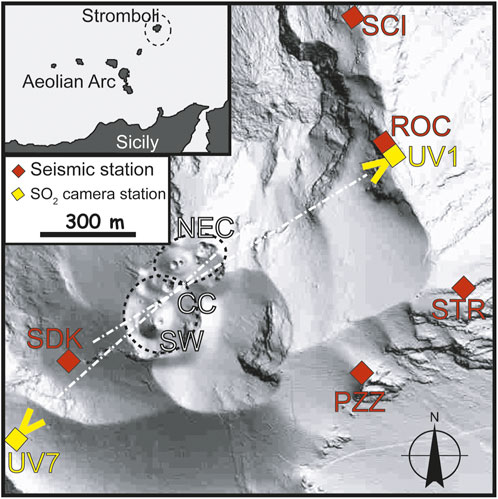
FIGURE 1. Map of the Stromboli’s summit crater area, showing the position of the two SO2 camera stations (UV1 and UV7), the locations of the LGS-UNIFI seismo-acoustic and thermal stations (ROC, SCI, STR, PZZ, SDK) used for the daily evaluation of volcanic activity index, for the detection of seismic VLP events and evaluation volcanic tremor amplitude. The positions of the three summit craters (NEC, north-eastern crater; SW, southwest, and CC, central craters) are also shown. White dashed lines represent the limit separating the two degassing sources (SWCC and NEC) within the two station’s field of views, as also indicated in Figures 5A,B.
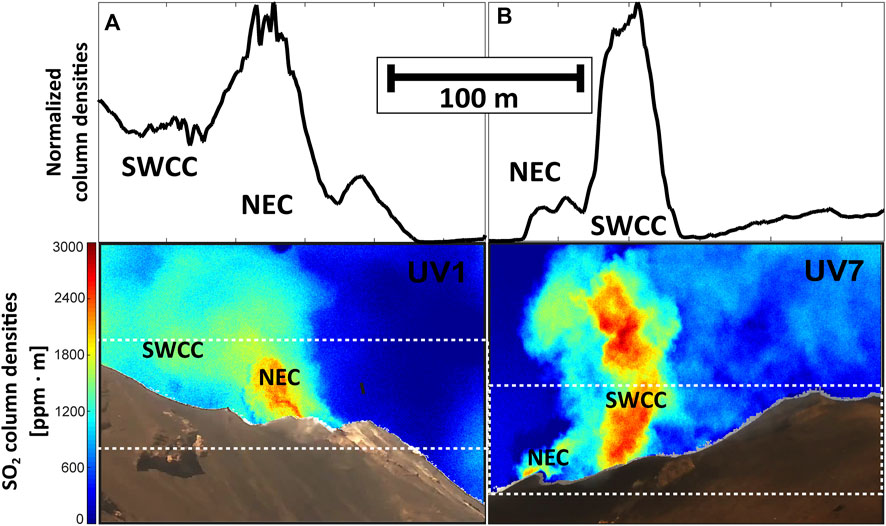
FIGURE 2. SO2 column density images derived from processing of UV1 (A) and UV7 (B) SO2 camera stations. The top panels represent the normalized SO2 column amount profiles obtained along transects (one per camera) intersecting the crater terrace (see dashed white areas in the pseudo-color images). These profiles allow spatially locating the NEC and SWCC emission sources, and separately resolving their SO2 contributions.
Stromboli is a worldwide known open-vent volcano characterized by persistent mild explosive activity that consists of about 8–17 mild, discrete explosions per hour (Ripepe et al., 2008). Such mild explosive activity is sustained by continuous magma overturning in the shallow conduits (Allard et al., 1994; Laiolo et al., 2022) and is thought to result from outbursting of large over-pressurized gas slugs at the top of the magma column (Harris and Ripepe, 2007b). Stromboli’s volcanic activity takes place within a NE–SW elongated crater terrace composed of three main vent areas, named northeast (NEC), southwest (SW) and central craters (CC) (Figure 1). The terrace is located at an elevation of ∼750 m a.s.l. on the upper margin of the Sciara del Fuoco, a deep horse-shoe depression resulting from several lateral collapses (Rosi et al., 2013). Stromboli’s gas emissions are sustained by distinct forms of degassing that are related to distinct volcanic processes: passive degassing, puffing and explosions (Harris and Ripepe, 2007b). Tamburello et al. (2012) studied a dataset of 130 explosions and 50 gas puffs acquired during brief campaign-style surveys, from which they discriminated the relative contributions of passive (∼77%), puffing (∼16%) and explosive (∼7%) degassing to the total gas output. However, such estimates are made based upon a limited dataset taken over short temporal intervals, leaving the question open of if, and to what extent, these proportions fluctuate in time and with changing volcanic activity. Our longer term observations here, covering 12 months, are aimed also at specifically answer this question.
Another aspect that has received scarce attention is if (and to what extent) degassing activity varies spatially over Stromboli’s crater terrace (Figure 1), and what the spatial distribution of degassing activity can tell us on the geometry of the shallow plumbing system, and on the modes/rates of gas and magma ascent in the feeding conduit(s). It is well known that degassing occurs simultaneously from several vents hosted in the crater terrace (North-East crater, NEC; South-West crater, SW; Central crater, CC; Figure 1), but the relative gas contributions from these sources have only occasionally been characterized (Pering et al., 2020). The three craters are characterized by distinct degassing and explosive regimes (Ripepe and Braun, 1994; Harris and Ripepe, 2007b; Ripepe et al., 2008), and are therefore likely to contribute differently to the degassing budget (Pering et al., 2020). Moreover, recent effusive eruptions on Stromboli have systematically been preceded by clustering of puffing and explosive activity on the gravitationally unstable NEC (Calvari et al., 2005; Neri and Lanzafame, 2009; Ripepe et al., 2009; Calvari et al., 2010; Calvari et al., 2011; Valade et al., 2016). This shift can be tracked by automatic infrasonic locations (Ripepe and Marchetti, 2002), anticipated by weeks the 2007 flank eruption (Ripepe et al., 2009) and by hours most of the small lava overflows occurring from the summit craters (Valade et al., 2016). Therefore, it is vital to demonstrate the ability of Stromboli’s SO2 cameras to capture this activity shift toward the NEC in the SO2 flux record.
We use two stand-alone, permanent SO2 camera stations, located at respectively Roccette (38°47′53″ N, 15°13′0.1″ E; NE upper flank of Stromboli, at 750 m a.s.l.; UV1 in Figure 1) and Valle della Luna (38°47′ 28″ N, 15°12′ 26″ E; SW upper flank of Stromboli, at 750 m above sea level; UV7 in Figure 1). The two SO2 camera stations are both located ∼500 m away from the center of the summit crater (range: 400–600 m) allowing us to image the crater plume(s) from two different viewing directions (Figure 1).
The SO2 camera stations are designed to output high-rate (0.5 Hz) long-term SO2 flux observations in continuous mode for 6 h per day. Both stations are equipped with two JAI CM-140GE-UV cameras sensitive to UV-radiation fitting two distinct band-pass optical filters (both of 10 nm Full Width at Half Maximum) with central wavelengths of 310 (SO2 absorption) and 330 nm (no SO2 absorption) (Kern et al., 2010a; Kantzas et al., 2010; Burton et al., 2015). Data from a collocated UV spectrometer (Ocean-Optic USB 2000+), along with periodic field calibration campaigns using gas cells of known SO2 concentration, allow calibration the SO2 camera images (Delle Donne et al., 2017). Measurement principles of the SO2 camera station are detailed in Mori and Burton (2006), Kantzas et al. (2010) and Kern et al. (2010b), whilst hardware, software and acquisition/processing routines used in this work are described in Delle Donne et al. (2017) and Delle Donne et al. (2019). SO2 column densities are measured on a restricted image portion, capturing a sub-region located just above the crater rim where the SO2 absorption signal is maximized and atmospheric effects, such as air entertainment in the plume and complexities in the local wind field, are minimized. Plume speed is calculated by applying the Lucas and Kanade (1981) optical flow algorithm included in the OpenCV open source library (Bradski and Kaehler, 2008) (https://opencv.org/) to sets of consecutive images. This involves an automatic selection of plume fronts (i.e., high SO2 column density) showing high spatial coherence and being characterized by consistent velocity vectors. The SO2 flux is then obtained from combination of plume speed and SO2 column density profiles along an ideal section encompassing the entire crater area (Figure 2). The use of an optimal viewing condition algorithm that determines, for each acquired image, the presence of clear sky and the degree of reliability in the SO2 signal within the image, allows us to discard image sequences with a low signal to noise ratio (Delle Donne et al., 2017; Delle Donne et al., 2019). SO2 flux measurements that fulfil the quality requirements are then averaged on a daily basis in order to obtain a long-term trend of degassing. This is obtained by averaging the 6 h long (acquisition time is fixed for both SO2 camera stations from 6.30 to 12.30 UTC) daily image datasets.
The advent of passive spectroscopic techniques to measure gas emissions from volcanoes, such as the SO2 camera method, has made a step forward in volcano monitoring, allowing us to quantify volcanic gas plume emissions from remote and safe locations, thus increasing significantly the robustness and continuity of observations. Besides, passive spectroscopic gas measurements are characterized by intrinsic uncertainties that are often difficult to constrain in real time and which may lead to significant biases in the results (Platt and Stuts, 2008; Kern et al., 2010a; Klein et al., 2017). In general, a main source of bias in spectroscopic techniques for volcanic plume SO2 detection is the presence of ash and aerosol in the plume and in the atmosphere, which can mask the SO2 signal of a certain quantity. Moreover, the evaluation of volcanic plume velocity vectors from UV images is not straightforward, as UV images allow to detect only the velocity component that is parallel to the focal plane of the image. An additional source of error resides in the assumption that every pixels in the image correspond to the same plume-SO2 camera distance, that is not valid if the plume is moving toward, or away from, the SO2 camera. Among all the sources of uncertainty, light dilution can also affect the SO2 camera measurements, determining a significant bias in interpretation of the results (Kern et al., 2010b; Campion et al., 2015; Varnam et al., 2021). Light dilution is mainly controlled by the distance of the observation point from the target plume: Campion et al. (2015) estimated for Stromboli a degree of underestimation due to light dilution of 25% for a target plume at a distance of 2.2 km. Therefore, given our much shorter distances of the SO2 camera sites to the target plume (∼500 m), light dilution would play a minor role in our measurements. However, to better constrain uncertainty related to light dilution effects, we used the formula of Campion et al. (2015) to correct for light dilution pixel intensities measured from each camera:
where IC is pixel intensity corrected for light dilution, I is the uncorrected pixel intensity, and IA is the pixel intensity produced by light dilution.
The positions of the two SO2 camera stations relative to the multiple gas emissions sources allow us to spatially distinguish two main degassing areas which are displaced in a rough SW-NE striking direction (Figure 1). The northernmost degassing source is associated with the NEC crater, while the southernmost source corresponds to degassing from both SW and Central craters (SWCC), being the latter in the same line of sight of the two SO2 camera stations (Figure 1). Figure 2 shows examples of two pseudo-color images of plume SO2 column densities derived from processing of UV images taken (in the same measurement day) from respectively UV1 (Figure 2A) and UV7 (Figure 2B). Visual inspection of the images shows that, for geometrical reasons related to the configuration of the network and to the topography of the summit crater area, images taken from UV1 capture well gas emissions arising from the NEC, while they may underestimate emissions from the SWCC, these being (at least partially) hidden by the NEC ridge (see also Delle Donne et al., 2017). On the other hand, gas emissions seen by UV7 fully enclose the gas plume(s) issuing from the SWCC region, while gas emissions from NEC emissions could be underestimated due to the same geometrical reasons. Then, in order to obtain a more robust estimate of the total SO2 flux, and of the distinct gas emission sources, we combined the flux measurements retrieved from the two SO2 camera stations (see Figures 1, 2), as described below.
Images taken from the SO2 cameras open the possibility to spatially resolving the SO2 flux associated with degassing at distinct crater sources (Figure 2). To this aim, we adopt a procedure to evaluate the spatial distribution of degassing from UV absorbance images (Delle Donne et al., 2017). The individual vent contributions to the bulk plume can be resolved by tracing an ideal profile on sets of absorbance images of the near-vent plume (Figure 2). Then, the profile’s segment with highest absorbance corresponds to the source crater area where gas exits from the vents. Long-term analysis conducted on the same image profiles allows evaluating the fluctuations through time of the two main (NEC and SWCC) degassing sources, and to separate spatially their distinct contributions to the total flux. Since the proximity of the SO2 camera stations respect to the emission sources, we are confident the complex wind patterns produce little biases in the location of degassing source within the image, particularly for the long term period of analysis.
High-rate SO2 flux time-series at Stromboli typically exhibit sudden and short-lived gas flux pulses over-imposed on a rather constant background signal (Figure 3A) (McGonigle et al., 2009; Tamburello et al., 2012; Pering et al., 2016). These pulses correspond to the rapid ascent, within the camera field of view, of over-pressured gas jets released by Strombolian explosions (Mori and Burton, 2006; Tamburello et al., 2012). Stromboli’s SO2 total flux can thus be interpreted as the summation of two independent degassing processes: a nearly constant gas emission originating from persistent degassing, which comprises of puffing and passive degassing, and a sequence of short-lived gas transients related to gas outburst during Strombolian explosions (Figure 3A). To fully characterize these distinct degassing behaviors, we use an automatic peak-finder algorithm (developed upon the built-in Matlab findpeaks function; https://it.mathworks.com/help/signal/ref/findpeaks.html) to detect (and count) the transient SO2 pulses in the SO2 flux time-series, and to quantify duration and amplitude of every single pulse. Typically, these active SO2 emissions are characterized by an abrupt onset with a relatively fast increase in flux, followed by a slower decreasing phase down to the average flux (Figure 3A, see also Pering et al., 2016). The SO2 mass associated with each pulse is derived by integrating the SO2 flux over the pulse duration (Delle Donne et al., 2017). Very long period (VLP) seismicity records (Figure 3B) are also used to detect independently the explosive activity at craters (Ripepe et al., 2021), and to validate the explosion-related nature of SO2 pulses detected by automatic peak-find algorithm (McGonigle et al., 2009; Tamburello et al., 2012; Delle Donne et al., 2017).
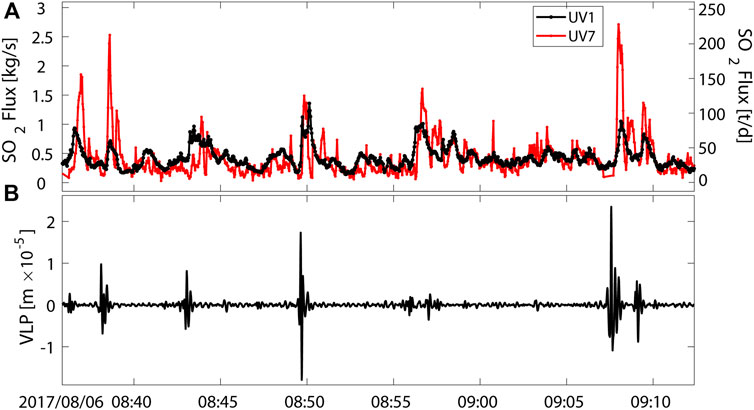
FIGURE 3. (A) Example of a simultaneous high-frequency SO2 flux records derived from the two SO2 camera stations (using the same automatic algorithm). The temporal plot highlights the transient gas pulses produced by the mild Strombolian explosive activity. These are superimposed over a continuous background SO2 emission sustained by passive degassing. (B) VLP seismic displacement (bandpass filter: 0.05–0.2 Hz), derived from the EW component of ground motion recorded a STR station (Figure 1), highlighting the temporal match between VLP seismic events and gas pulses detected by the two SO2 camera stations.
During the time interval covered by our observations (June 2017–June 2018), volcanic activity remained within the “ordinary” Strombolian activity levels (Ripepe et al., 2008; Laiolo et al., 2022) that had persisted since the August-November 2014 effusive crisis (Rizzo et al., 2015; Zakšek et al., 2015; Valade et al., 2016; Delle Donne et al., 2017; Di Traglia et al., 2018). More specifically, the 2017–2018 period marked a phase of progressive Strombolian activity rejuvenation that interrupted a two-year long phase of very low activity following the 2014 effusive eruption. In our analyzed temporal interval, this activity rejuvenation manifests in regular mild (Strombolian) explosive activity being interrupted by eight major explosions, and by a short-lived lava summit overflows that took place on 15 December 2017 from the northern rim of the NEC crater (Giudicepietro et al., 2019).
To better interpret the degassing trends seen by the SO2 cameras, we complement the gas results with other independent geophysical observations taken by the Laboratorio di Geofisica Sperimentale (LGS) of the University of Firenze (LGS, 2022 available at http://lgs.geo.unifi.it/index.php/monitoring/volcanoes/stromboli2). In particular, we here compare the observed gas results with volcanic tremor, Very Long Period (VLP) seismic rate, and the Volcanic Activity Index (Ripepe et al., 2009) reported by LGS. In particular the Volcano Activity Index is performed by weighting information from infrasonic amplitude of explosions/puffing activity (Ripepe et al., 2007), and thermal radiance detected either from fixed thermal cameras and from satellite images (Valade et al., 2016). This index can vary from low to very high depending on fluctuations of regular Strombolian activity, is calibrated over the last 20 years of continuous observations covering the three last main eruptive phases of 2007, 2014, and 2019, and thus constitutes a reliable proxy for volcanic intensity on Stromboli. During the period of investigation, the Volcanic Activity Index ranged from low to medium levels for ∼80% of the period, with short-lived phases of “high” (≤20%).
The apparent total SO2 fluxes (daily averages along with their associated weekly-long moving averages), independently evaluated from the two UV1 and UV7 SO2 camera stations, are illustrated in Figure 4A, and show similar trends (Pearson correlation coefficient R=0.5). The SO2 flux time-averaged means and standard deviations (for the period June 2017-June 2018) are 61 ± 32 t/d (range: 12–180 t/d) and 68 ± 45 t/d (range: 10–202 t/d) for UV1 and UV7, respectively, and fall at the lower bound of estimates obtained at Stromboli during regular persistent Strombolian activity (Allard et al., 2008; Burton et al., 2009; Delle Donne et al., 2017; Laiolo et al., 2022; LGS, 2022). The SO2 temporal records obtained from the two camera stations generally agree well in their long-term weekly averaged trends, differing between each other by 28 ± 20%, up to a maximum of 79%. Larger discrepancies are observed in distinct daily measurements, which show a variability around their weekly mean of 44 ± 34% and a maximum difference of 143%. Besides such uncertainties, the long-term weekly averaged degassing trends inferred from the two camera stations show coherent fluctuations through time. We identify two main phases of relatively more sustained degassing activity (higher degassing phases, HDP) in June-August 2017 and October 2017-mid January 2018, when both SO2 cameras exhibit higher-than-average SO2 fluxes, and peak emissions of up to ∼200 t/d. These two more energetic phases are separated by periods of lower degassing (lower degassing phases, LDP), during which the SO2 fluxes average at ∼50 t/d (Figure 4A). These SO2 flux temporal variations are coherent with fluctuations detected by independent geophysical parameters, such as volcanic tremor amplitude (Figure 4B) and Volcanic Activity Index, as reported by LGS daily bulletins (Figure 4C).
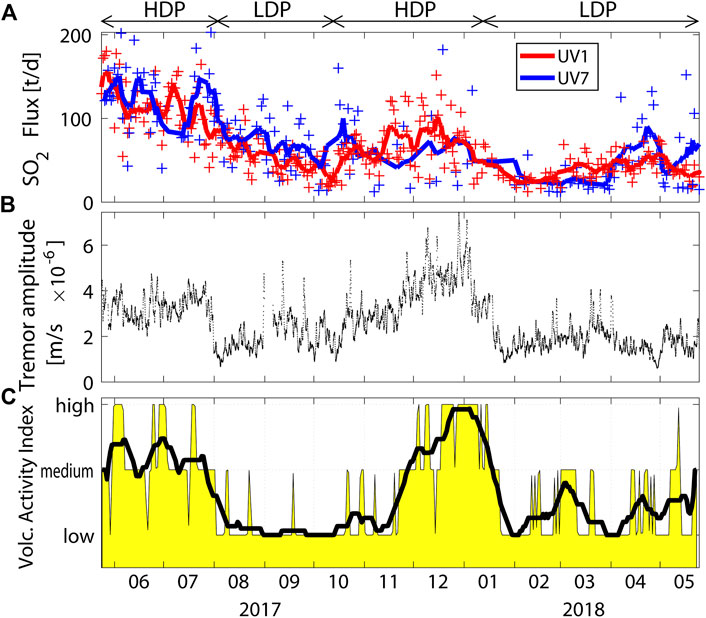
FIGURE 4. (A) Daily averaged SO2 fluxes derived from the two SO2 camera stations (crosses) with their 7-day long moving averages (solid lines), identifying the alternation of high (HDP) and low (LDP) degassing phases. The SO2 temporal records obtained from the two SO2 camera stations generally agree well in their long-term weekly averaged trends (that differ one each other by 28 ± 20%). Larger discrepancies are observed in individual measurement days, that spread around their weekly means by 44 ± 34%. (B) Volcanic tremor amplitude, and the (C) Volcanic Activity Index delivered daily by LGS-UNIFI (black line represents the associated 7-day moving average).
Moreover, the close proximity of the SO2 camera stations to the emission sources, together with their high spatial resolution (pixel size is less than 1 m), allows us to capture the gas at the vent exit before it spreads in the atmosphere. Figures 5A,B are temporal records of the normalized (daily averaged) spatial distribution of SO2 column densities along the crater terrace, as separately imaged by the UV1 and UV7 SO2 camera stations. In these temporal plots, the blue to red color tones are proportional to SO2 column amounts. SO2 column density peaks, marked by red areas, therefore convey information on the position(s) along the crater terrace where degassing activity concentrates (at any given time). These dominant gas-venting sources correspond to positions, within the crater terrace, of either one of the two main active vent sectors that can be resolved in the SO2 cameras’ field of view: the SWCC and the NEC. The limit (see white dashed lines in Figures 5A,B) between these two emission sources has been set at a fixed position along the transect based on visual inspection of the images, and corresponds to the area where the long-term averaged SO2 density is the lowest. The figures demonstrate coherent (for the two SO2 camera stations) temporal changes in the spatial distribution of SO2 degassing: the SO2 column density peaks (red tones) switch from one vent area to another multiple times during 2017–2018, implying large temporal fluctuations in the NEC vs. SWCC relative gas contributions.
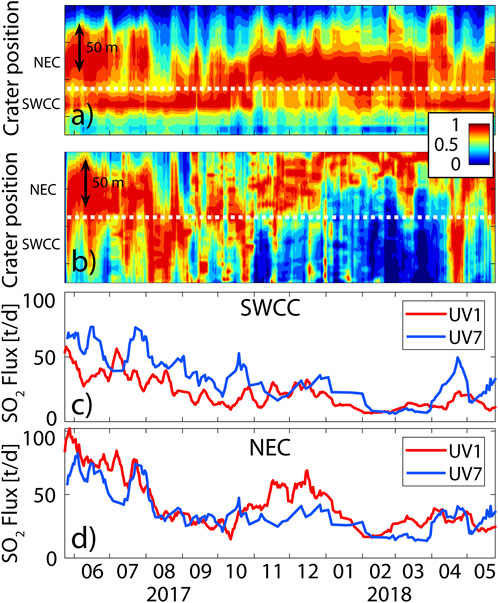
FIGURE 5. Temporal records of time-averaged normalized column densities along the a transect through the crater terrace (y-axis), as derived for UV1 (A) and UV7 (B) (from Figure 2). These plots highlight the presence of two main degassing sources in the crater terrace. White dashed lines in (A,B) represent the limit between SWCC and NEC areas, as identified from visual inspection of images (see also Figure 1). These plots are used to time resolving the flux contributions from the two identified sources in (C) and (D).
By processing images from the two SO2 camera stations, we derive two independent records of the vent-resolved contributions from NEC and SWCC, as illustrated in Figures 5C,D. This operation is accomplished by calculating the relative contribution of degassing between the two sources, and therefore by integrating, over the two segment portions of the profile associated with NEC and SWCC respectively, the normalized column densities (of Figures 5A,B). The two so-derived quantities are used to partition the total daily averaged SO2 flux. Then, we obtain two different estimates for the same degassing source from the two independent SO2 cameras (Figures 5C,D). The vent-resolved SO2 fluxes obtained from the two cameras exhibit coherent temporal oscillations. However, as expected from the geometry of the network (the position of the two cameras relative to the SWCC and NEC; Figure 1, 2), a generally higher NEC SO2 flux is derived from UV1 than from UV7 (Figure 5D); likewise, the SWCC SO2 flux is generally largest as measured from UV7 (Figure 5C). In order to minimize these biases induced by the different positions of the SO2 cameras, we therefore extract, for each measurement day, the maximum of the two independently estimated (one from UV1 and one from UV7) NEC and SWCC time-series, and take them as representative of the NEC and SWCC fluxes. The use of the maxima is justified by the fact that all source of uncertainties (cfr. 2.1), especially the incomplete plume coverage due to its frequent partial hiding behind the summit volcano’s slopes (Figure 2), lead to SO2 flux under-estimation. These maxima-based NEC and SWCC fluxes are graphically shown in Figure 6. Based on these results, we estimate time-averaged SO2 fluxes and associated standard deviations for the entire period of investigations of 43 ± 22 t/d (range 9–116 t/d) for NEC and of 35 ± 22 t/d (range 4–99 t/d) for SWCC (Figure 6A).
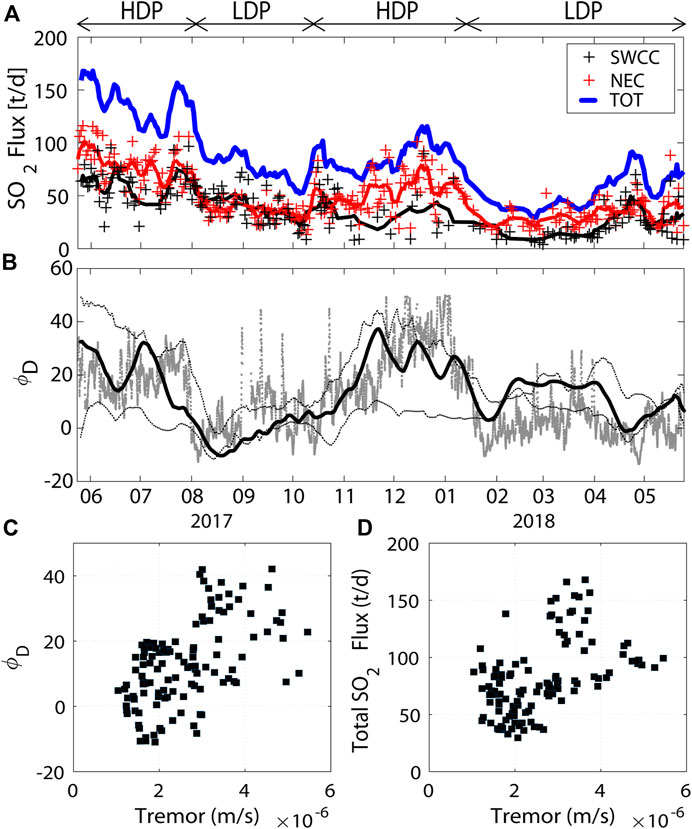
FIGURE 6. (A) SWCC (black) and NEC (red) SO2 daily averaged fluxes (crosses) and their associated 7-day long moving averages (lines) are shown together with the total SO2 fluxes (blue line, derived by summation of the two components). (B) The differential flux trend (ΦD), calculated as the net difference between the two emission sources (the black bold line represents ΦD calculated combining data from the two camera stations, while the two thin black lines represent ΦD calculated using separately the data from UV1 and UV7 camera stations respectively), agrees well with the volcanic tremor temporal amplitude (gray). This suggests that escalating volcanic activity, as traced by HDPs, are accompanied by escalating SO2 degassing clustering at the NEC. (C) and (D) represent the scatter plots relating tremor amplitude with ΦD and total SO2 fluxes respectively, which highlight how the increase in volcanic activity is always accompanied with an increase in bulk degassing with the NEC source contribution becoming dominant.
Then, we calculate the total SO2 flux (shown in Figure 6A) as the algebraic summation of the NEC and SWCC fluxes of Figure 6A. These total fluxes, integrating together results of the two SO2 camera stations, are higher than the SO2 flux records obtained by any single SO2 camera (data in Figure 4A) for the reasons explained above. We infer a mean total (NEC+SWCC) SO2 flux of 81 ± 40 t/d. During the LDPs, the daily total SO2 flux averages at 54 ± 24 t/d (range, 17–123 t/d), the NEC SO2 flux ranges between 13 and 55 t/d (mean, 31 t/d), and the SWCC SO2 flux ranges between 4 and 72 t/d (mean, 23 t/d) (Figure 6A). During the HDPs, SO2 degassing increases at both craters, with the NEC fluxes ranging between 15 and 116 t/d (mean, 57 t/d) and the SWCC fluxes between 8 and 97 t/d (mean 40 t/d); the total (NEC+SWCC) flux therefore averages at 97 ± 40 t/d (Figure 6A). Interestingly, during HDPs, the NEC SO2 flux is roughly 43% as much as higher as the SWCC flux, while we observe a more similar SO2 flux contributions from NEC and SWCC during LDPs, with NEC 30% higher than SWCC (Figure 6A).
We illustrate the relative contributions of NEC and SWCC to the SO2 budget using the differential flux ΦD (Figure 6B):
where ΦNEC is the daily averaged SO2 flux from NEC, and ΦSWCC is daily averaged SO2 flux from SWCC. Eq. 2 implies that ΦD approaches ∼0 when the two vent areas contribute same amounts of gas, ΦD is >0 if NEC emits more SO2 than SWCC, and <0 when/if SWCC is the dominant gas source. We find that ΦD averages at 13 t/d, indicating that degassing is generally more intense at NEC than at SWCC, and shows significant fluctuations between -13 t/d and 44 t/d, up to three times respect than the long-term average. We also find that the fluctuations observed volcanic tremor amplitude mimic those observed in ΦD (Figure 6B) and in the total SO2 flux, with a correlation of R∼0.53 and R∼0.48 (Pearson coefficient) respectively (Figures 6B,C). Specifically, we find ΦD to be much greater than its average (e.g., NEC dominates the total SO2 budget) during phases of heightened activity (HDPs), when tremor amplitude (and volcanic activity, Figure 4C) is also high. In contrast, the low degassing regime (LDPs), during which tremor amplitude is consistently low, is associated with more similar contributions from the two crater regions, with ΦD oscillating near its long-term average. In summary, our data show that degassing fluctuations nicely follow the fluctuations in the tremor amplitude (Figure 6D), and that the higher is the tremor amplitude and the more the degassing concentrates at the NEC (Figure 6C).
The high sampling rate of SO2 cameras can be exploited to resolve the transient sin-explosive SO2 pulses (that, as demonstrated by synchronous VLP seismic signals, are related to Strombolian explosions; Ripepe et al., 2021; Figure 3) from the passive (not associated with a VLP seismic signal) gas emissions (Mori and Burton, 2006; Tamburello et al., 2012; Delle Donne et al., 2017). Our aim here is to test if explosive degassing scales with passive degassing and with volcanic activity level. We caution that, due to the relatively slow acquisition rate used (0.5 Hz), our SO2 camera stations cannot resolve the repetitive (every 1–2 s) but short-lived (∼0.5 s) degassing pulses produced by puffing (Harris and Ripepe, 2007a). In other words, the puffing contribution to degassing (accounting for ∼16% of the total flux, according to Tamburello et al., 2012) is seen by the SO2 cameras as a (unresolved) component of the background degassing signal. While in this study (for simplicity) we refer to the term “passive” to account for such non-explosive gas release, we are aware puffing involves, by definition, the release of over-pressured gas pockets (and, therefore, is ultimately an active degassing mode). We analyze the derived SO2 flux time series with a peak finder routine (Delle Donne et al., 2017) to derive degassing exclusively associated with the explosions; this is possible thanks to their typical transient short-lived waveform that render them easily extractable from the gas flux time series (Figure 3A). In total, we identify ∼7,000 explosive pulses throughout the study period (∼1 year) associated with mild Strombolian explosions at the NEC and SWCC craters.
The SO2-derived explosion rate varies widely during June 2017-June 2018, between 1 and 20 events/hour (Figure 7B). These variations parallel those of the passive SO2 flux (Figure 7A) and of the seismic VLP rate (Figure 7B). The HDPs/LDPs are associated with parallel increase/decrease in the SO2-derived explosion rate, from 5–20 events/hour during HDPs to 1-5 events/hour during LDPs. However, Figure 7B shows that the SO2-derived explosive rate is always lower than VLP rate, confirming that SO2 camera is not able to resolve the totality of the explosive events occurring at the summit craters. This is particularly true for the ash-rich explosions, which are typically difficult to detect spectroscopically (Kern et al., 2010a).
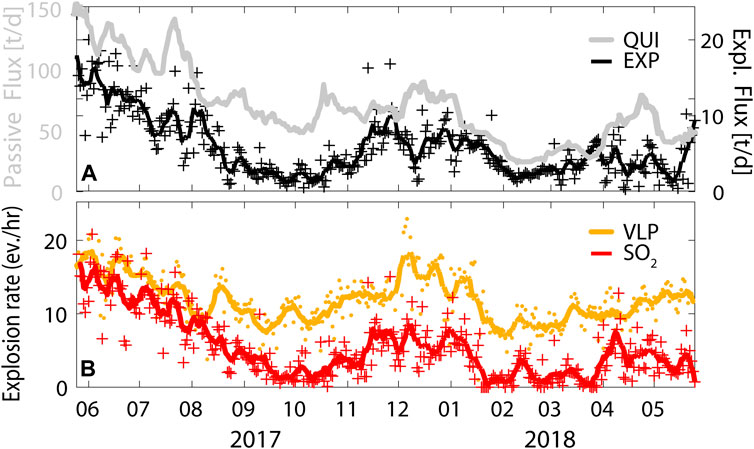
FIGURE 7. (A) Daily averaged (red crosses) SO2 explosive fluxes and associated 7-day long moving averages (black line) range 1–20 t/d. These are plotted together with the passive fluxes (gray line), derived by removing the explosive flux component from the total fluxes of Figure 6A. Explosive and passive trends match well, as seen by the explosive flux increasing when the passive flux increases. (B) Explosion rates evaluated at a daily basis from SO2 flux and VLP records show good similarities and the same fluctuations.
The automatic detection of explosive transients also allows quantifying the total SO2 mass produced by each Strombolian explosion. This is obtained by time integration of a SO2 flux time series after subtracting the stationary trend associated with passive degassing (Delle Donne et al., 2017). Then, we derive explosive SO2 average masses and associated standard deviations of 30 ± 22 kg (range, 1–385 kg); these are released during temporal intervals of 24 ± 12 s on average, and up to 140 s (Figures 8A,B). Considering a typical 4 wt.% SO2 concentration in Stromboli’s explosive gas outbursts (Burton et al., 2007), the so-derived sin-explosive SO2 masses convert into total explosion gas masses of 750 ± 550 kg, in agreement with previous observations (Mori and Burton, 2006; Tamburello et al., 2012; Delle Donne et al., 2016; Delle Donne et al., 2017). If we consider a temperature of ∼625 K (Harris and Ripepe, 2007a) for a typical gas mixture, we can infer a ∼0.35 kg/m3gas density at ambient pressure, from which we estimate the total gas volume released by an explosion of 2,100 ± 1,600 m3. This is consistent with previous estimates made with SO2 cameras (1,500–4,100 m3, Mori and Burton, 2006) and thermal records (300–3,000 m3, Delle Donne and Ripepe, 2012). The summation of all explosive masses for each measurement day allows quantifying a record of the SO2 flux (in tons/day) solely contributed by explosive activity (Figure 7B; see also Delle Donne et al., 2017). The passive SO2 flux (Figure 7A; 8A) is then derived by subtracting the explosive flux from the total flux. Within the investigated period of analysis (June 2017-June 2018), the explosive SO2 flux averages at 6 t/d (range, 0.3–20 t/d), on average contributing ∼10% of the total SO2 budget, confirming that explosive activity plays a minor role in the total magma degassing at Stromboli (see also Tamburello et al., 2012; Delle Donne et al., 2017). Notably, we find that the explosive and passive fluxes are well correlated (R=0.5; Figures 8C,D), showing coherent fluctuations during the analyzed temporal interval (Figure 7).
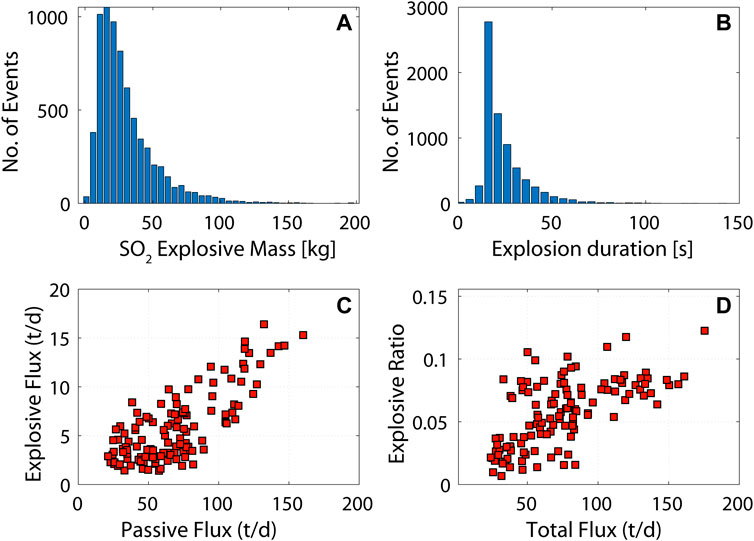
FIGURE 8. Histograms showing the frequency distributions of SO2 masses (A) and SO2 pulse durations (B) associated with the mild Strombolian explosions, obtained from a database of ∼7,000 events. We estimate an average SO2 mass released by individual Strombolian explosions of 30 ± 22 kg during temporal intervals of 24 ± 12 s and which can reach a maximum of 140 s; (C) Passive and explosive SO2 fluxes show a positive correlation with R=0.5 that suggests a commonality in their source processes; (D) SO2 total flux and the explosive to total degassing ratio are also positively correlated (i.e., the higher is the total gas flux, the more gas is released explosively).
The automatic SO2 flux retrievals using the UV camera method, although technically challenging, promise a step-change in our ability to capture the spatio-temporal evolution of volcanic degassing at open-vent volcanoes, with implications for volcano surveillance. However, the multiple sources of uncertainty related to this un-supervised method make it very difficult to apply it in real-time and in different volcanic environments worldwide.
SO2 camera fluxes at volcanoes are typically quantified using a single camera pointing at the volcanic plume from one single viewing direction. This operation can be complicated by optical/geometrical constraints (complexities in the summit crater topography, and position of the Sun relative to the SO2 camera station, among others), and can hamper a proper resolution of distinct gas emissions from multiple vents/craters (where they exist). Our SO2 flux records here, based on applying the same automated algorithm to two independently acquired image datasets, demonstrate the advantage of using two SO2 camera stations simultaneously, gathering plume images from two different viewing directions. Using two SO2 camera stations, degassing from distinct sources can be more reliably quantified (Figure 5) and, by summation, a more robust estimate of the total SO2 flux can be derived (Figures 4, 6, 7).
One important aspect is that, despite the use of a single SO2 camera station can introduce greater uncertainties, we show (at least for Stromboli) that the two individual SO2 camera records from UV1 and UV7 stations (Figure 4A) exhibit coherent temporal SO2 fluctuations, and well record the alternation of high/low degassing regimes as well as the changes in degassing partitioning between the two individuated degassing sources (Figure 5). This demonstrates that the numerous uncertainties associated with the automatic method effectively play a minor role in producing biases which may affect significantly the reliability of the gas measurement. This observation corroborates the effectiveness of the single UV camera approach to continuously monitor volcanic degassing in time, as already empirically demonstrated in occasion of the Stromboli’s 2014 (Delle Donne et al., 2017) and 2019 (Aiuppa et al., 2021; Laiolo et al., 2022) crises. Notably, as the two cameras image the plume from two very distinct viewing directions (Figure 1), their generally coherent records (Figure 4A) suggest that uncertainties in UV camera-based gas quantification, arising from the different position of the SO2 camera station relative to the plume, are relatively modest. We give an estimation of these uncertainties from the SO2 flux difference between the two camera records in Figure 4A. This difference is 28 ± 20% (maximum difference of 79%) if calculated from the weekly averaged SO2 fluxes measured at the two instruments, while it rises to 44 ± 34% (maximum difference of 143%) if daily average values are considered instead. We conclude our automatic SO2 camera method can resolve well degassing intensity variations occurring over timescales of weeks to months, while accurately resolving faster (daily) variations is more complicated by instrumental and environmental noise due to intrinsic uncertainties of the method.
At the numerous volcanoes worldwide that comprise more than one simultaneously active crater/vent, degassing/eruptive activity is not uniformly distributed, but rather typically concentrated at one particular vent at any given time (Fee and Matoza, 2013; D’Aleo et al., 2016; D’Aleo et al., 2019). At Stromboli, for example, temporal shifts in infrasonic source location are frequently observed during periods of regular, mild Strombolian activity (Ripepe et al., 2007; Landi et al., 2011). These are interpreted as due to shifts in magmatic gas bubble flow into, and surface bursting from, the shallow conduits that feed the different active vents/craters (Ripepe et al., 2007, 2009). Our fully automatic SO2 camera stations allow to systematically (and continuously) resolve the distinct emission sources over the crater terrace (Figures 1, 2). These results reveal, over temporal timescales of months, that the two degassing sources are active at the same time, although multiple swings in degassing partitioning along the crater terrace (red tones in Figures 5C,D), from one crater to another, are observed. While NEC and SWCC contribute ∼60% and ∼40% of the total SO2 emissions on a yearly average (June 2017-June 2018), there exist large temporal fluctuations in their relative SO2 contributions, as indicated by our ΦD parameter ranging from −13 to +44 t/d, and averaging at 13 t/d (ΦAVG). Notably, we find that such temporal changes are well consistent with oscillations in the intensity of regular Strombolian activity, as indicated by the geophysical proxies (Figures 4, 6, 7). We show, in particular, that periods of heightened degassing (HDP) and seismicity are systematically marked by degassing accelerating at the NEC over the SWCC (ΦD > ΦAVG); while periods of relatively reduced degassing (LDP) and milder Strombolian activity are systematically characterized by roughly similar SO2 contributions (ΦD ∼ΦAVG) from the two sources (or even by the SWCC dominating over the NEC; ΦD <0). These observations suggest that any increase in shallow magma transport (as indicated by increasing total SO2 flux and seismicity; Allard et al., 2008; Ripepe et al., 2008) leads to preferential magma channeling toward the NEC (Figure 6B). This clustering of SO2 degassing at NEC with heightened Strombolian activity is fully consistent with observed shifts in infrasound location before Stromboli’s effusive eruptions (Ripepe et al., 2009; Valade et al., 2016).
The northeastern portion of Stromboli’s crater terrace corresponds to a prime structural weakness zone of the volcano, as testified by geological information (Francalanci et al., 2013), geo-structural constraints (i.e., Tibaldi, 2001; Acocella et al., 2006; Corazzato et al., 2008), slope failure, ground deformation data (Tarchi et al., 2008; Tommasi et al., 2008), and geophysical evidence (Chouet et al., 2003; Ripepe et al., 2005; Marchetti et al., 2008). Magma accumulation (Ripepe et al., 2015; Ripepe et al., 2017) and cone growth in the gravitationally unstable NEC sector is known to trigger flank instability (Valade et al., 2016), opening of lateral vents, and onset of tsunamigenic lava effusion in the Sciara del Fuoco (Bonaccorso et al., 2003; Rosi et al., 2013; Di Traglia et al., 2014). As such, the ability of our SO2 camera stations to spatially (vent-to-vent) resolve any magma input rate increase (Figure 6B) adds to existing geophysical knowledge (Ripepe et al., 2008; Ripepe et al., 2009; Ripepe et al., 2015) that helps forecasting transition from ordinary to effusive activity, with obvious implications for volcanic risk mitigation.
One major advantage of UV cameras is that, because of their high temporal resolution, they allow identifying the rapid, transient SO2 bursts produced by Strombolian explosions (Figure 3). We estimate an average SO2 mass released by individual Strombolian explosions of 30 ± 22 kg. Our results, that use of a dataset of more than 7,000 explosions, strengthen previous conclusions (Mori and Burton, 2009; Tamburello et al., 2012; Delle Donne et al., 2017) of a minor (∼10% on average) contribution of explosive degassing to the total (explosive + passive) SO2 budget, at least during regular activity on Stromboli (Figures 7B, 8A).
Results indicate that gas is released during explosions in temporal intervals of 24 ± 12 s (up to 140 s), in the same order of magnitude as previously observed (Pering et al., 2016). The explosion-related SO2 burst therefore last longer than thermal gas thrusts (5–15s; Ripepe et al., 2008), implicating a post-explosion degassing mechanism (Pering et al., 2016) in which daughter bubbles are delivered post-explosion from the de-compressing upper portion of the magma column (Ripepe et al., 2021).
One important novel aspect we bring here to light is the statistically significant (R ∼0.5, Figure 8C) correlation between passive and explosive SO2 fluxes during the observational period. This correlation suggests that passive and explosive degassing are commonly modulated, and are therefore likely to be driven by a common source process. One additional key (and novel) observation is that the explosive/total SO2 flux ratio scales with the total SO2 flux (Figure 8D), suggesting that more gas is released explosively as the total SO2 flux (and volcanic activity) increases.
The total (explosive + passive) SO2 flux on Stromboli (Allard et al., 1994; Allard et al., 2008), as well as at other open-vent volcanoes (Shinohara, 2008), is thought to be controlled by the rate of convective magma transport in the shallow (<3 km) plumbing system (Harris and Stevenson, 1997; Bonaccorso et al., 2008). This degassing-driven shallow magma convection process is operated by fresh (gas-rich) magma ascent continuously replacing viscous and degassed magma sinking back into the conduit (Shinohara, 2008). This mechanism helps to explain the observed excess SO2 degassing (Allard et al., 2008), the longevity of Strombolian activity (Rosi et al., 2013), and the overall homogeneity of magma chemistry (Bertagnini et al., 2008). In a constant geometry (conduit radius) scenario (likely in the “stable” Stromboli 2017 conditions), any change in magma input (convection) rate would mainly be controlled by changing magma rheology, and especially by the density difference between non-degassed (ascending) and degassed (sinking) magmas (Stevenson and Blake, 1998; Shinohara, 2008). The latter in turn mostly depends on magma vesicularity (gas bubble volumetric fraction) of the ascending magma. Notably, ascent of a more “bubbly” magma in the conduits leads to both faster convection and escalating explosivity (Gonnermann and Manga, 2013), offering a simple explanation for the relationship between passive and explosive fluxes, observed here (Figure 8A). In this interpretation, Stromboli swings in between high and low degassing regime periods would depend on the bubble-rich vs. bubble-poor nature of the ascending magma (Ripepe et al., 2002). Following the methodology of Allard et al. (1994), Allard et al. (2008) we can convert the measured SO2 fluxes into a magma input rate, and assuming an initial sulfur content of 0.18 wt%, a magma density of 2,700 kg/m3, and a crystallinity of 30%. In line with previous estimations, we find a magma input rate ∼0.15 m3/s as threshold between HDP and LDP phases. Therefore, we propose that, as the magma supply rate in the conduit approaches or reaches this threshold, regular Strombolian activity intensifies, heighted tremor and VLP seismicity are observed, and degassing activity escalates to concentrate at the NEC (Figure 4-7). In the most extreme cases, this acceleration can lead to an effusive eruption (Ripepe et al., 2009).
Our results are also relevant to testing the role played by the viscous cap on-top of the conduit in driving the mild persistent and paroxysmal Strombolian explosive activity (Gurioli et al., 2014; Del Bello et al., 2015; Caracciolo et al., 2021; Mattia et al., 2021; Viccaro et al., 2021). There is a growing evidence supporting the presence of a crystal mush as a stable feature of the Stromboli’s shallow conduit (Suckale et al., 2016; Barth et al., 2019; Ripepe et al., 2021), acting as a viscous cap.
The presence of a viscous cap would represent a permeability barrier for volcanic gases, thus promoting gas accumulation and the pressure buildup to trigger the explosive activity (Barth et al., 2019; Woitischek et al., 2020). An open question is if (and to what extent) Strombolian explosive activity can change with time in response to rheological (and geometrical) changes of the viscous cap. A permeability change in the viscous cap is, at least in principle, expected to modulate the partitioning between passive (bubbles) and explosive (slugs) degassing, ultimately determining a condition of enhanced explosivity at surface due by a permeability decrease (more bubbles accumulate deep instead to degas at surface, and forming more gas slugs) (Gurioli et al., 2014; Del Bello et al., 2015). This should be reflected in a drop of passive degassing in response to increased explosivity (Thivet et al., 2021). However, the observation evidence we bring to light in this study is that persistent vs. explosive gas emissions are instead commonly modulated (Figure 7, 8), indicating that fluctuations in explosive activity are also accompanied by coherent fluctuations of the passive (and total) degassing. These observations suggest a marginal (if any) role played by a potential rheologic stiffening of the viscous cap in controlling the observed week to monthly long trends in volcanic activity. The model we propose instead is one in which faster magma circulation of bubbly magma (Laiolo et al., 2022) leads to both more sustained passive degassing and larger sin-explosive gas release (Ripepe et al., 2002; Ripepe et al., 2009) (Figure 8D). Our results therefore suggest that viscous cap, although a stable element of the Stromboli’s feeding conduit, plays no (or marginal) role in controlling degassing and activity regimes, at least over the first-order degassing fluctuations at a timescale of weeks-months.
Our coherent fluctuations between explosive and passive degassing (Figures 7, 8) suggest a common and unique degassing source, whose fluctuations through time are explained in term of changes in the rate of magma ascent (that, in turn, control the rate of bubble nucleation, expansion, and separate rise in the silicate melt). To reconcile this unique source of degassing with the widely accepted paradigm that passive and explosive gases at Stromboli are compositionally different (Burton et al., 2007; Aiuppa et al., 2010; Pering et al., 2020; Woitischek et al., 2020), we invoke a role played by different re-equilibrium kinetics of small and large bubbles (slugs) in the conduit. Bubble ascent velocities are dependent on bubble size, so that large bubbles (that evolve into slugs by coalescence and expansion in the conduit, or at the base of the viscous plug) rise faster through silicate melts (Gonnermann and Manga, 2013). Because of their faster ascent, large bubbles, as the slugs feeding Strombolian explosions (Burton et al., 2007), are therefore more prone to preserve molar ratios (e.g., high CO2/SO2 and SO2/HCl) characteristic of gas-melt equilibrium at deeper magmastatic depths than smaller bubbles. We caution that during gas bubble ascent, the temperature drop due to adiabatic expansion has been shown to promote bubble compositional change (Oppenheimer et al., 2018). However, such re-equilibration upon bubble adiabatic expansion and cooling, while affecting to some extent ratios between redox couples (e.g., SO2/H2S and CO2/CO ratios), is unlikely to alter bulk gas chemistry (Oppenheimer et al., 2018). Ultimately, the high C, low-Cl signature of deeply sourced bubbles will be preserved if slugs rise fast. In contrast, the smaller bubbles sustaining passive degassing would travel slower within the conduit, therefore chemically re-equilibrating with the surrounding melt upon ascent in the shallow conduit, and ultimately acquiring their low CO2/SO2 and SO2/HCl signature (Burton et al., 2007; Woitischek et al., 2020).
Our automatic SO2 flux measurements at Stromboli, derived from two simultaneously operating cameras observing the plume from two different viewing directions, support the robustness of SO2 camera monitoring at volcanoes. Using two co-exposed SO2 camera stations provides insights into temporal swings in degassing activity between the NEC and SWCC that can only partially be detected using one single SO2 camera station (Delle Donne et al., 2017). When interpreted in tandem with seismic parameters (volcanic tremor and VLP seismicity), our vent-resolved SO2 flux data contribute to better understanding degassing mechanisms operating in the shallow plumbing system during Stromboli’s regular activity.
Our results indicate that regular degassing activity fluctuates significantly in terms of intensity and spatial distribution along the crater terrace, and concentrates at the NEC during the phases of escalating Strombolian activity. During phases of heightened regular Strombolian activity, as indicated by increasing volcanic tremor and VLP seismic rate, the total (passive + explosive) and explosive SO2 fluxes increase in parallel. We propose these fluctuations reflect temporal changes in the gas bubble cargo of the feeding magma in the shallow conduits. Temporal records of SO2 fluxes, captured at high spatial and temporal resolution by automated UV cameras, allows to “live” monitoring degassing activity, thus contributing to understanding (and potentially forecasting) changes in volcanic activity style.
The raw data supporting the conclusion of this article will be made available by the authors, upon reasonable request.
DD conceived the manuscript and drafted the figures. DD and AA, and wrote the manuscript; EC analyzed and validated the results of the automatic processing; DD, MB, FM, JL, and GT designed, install, and maintained the permanent SO2 camera stations; GL and MR analyzed the seismic VLP and tremor data. AA and MR supervised the work. All the authors have contributed to the realization of the final version of the manuscript.
The research leading to these results has received funding from the European Research Council under the European Union’s Seventh Framework Programme (FP7/2007/2013)/ERC grant agreement no. 305377 (Principal Investigator: AA). The authors also acknowledge funding from the Italian Civil Protection (DPC) through sub-contract with Università of Firenze (n. 2089/2019), from the Italian Ministero Istruzione Università e Ricerca (Miur, Grant No. 2017LMNLAW), and from Istituto Nazionale Geofisica e Vulcanologia (INGV, Grant Number 9999.815 VOLC-GAS).
We acknowledge RK and TP for their constructive comments, which improved the manuscript.
The authors declare that the research was conducted in the absence of any commercial or financial relationships that could be construed as a potential conflict of interest.
The handling editor SH declared a past co-authorship with the author AA.
All claims expressed in this article are solely those of the authors and do not necessarily represent those of their affiliated organizations, or those of the publisher, the editors and the reviewers. Any product that may be evaluated in this article, or claim that may be made by its manufacturer, is not guaranteed or endorsed by the publisher.
Acocella, V., Neri, M., and Scarlato, P. (2006). Understanding shallow magma emplacement at volcanoes: Orthogonal feeder dikes during the 2002–2003 Stromboli (Italy) eruption. Geophys. Res. Lett. 33, L17310. doi:10.1029/2006GL026862
Aiuppa, A., Bertagnini, A., Métrich, N., Moretti, R., Di Muro, A., Liuzzo, M., et al. (2010). A model of degassing for Stromboli volcano. Earth Planet. Sci. Lett. 295, 195–204. doi:10.1016/j.epsl.2010.03.040
Aiuppa, A., Bitetto, M., Delle Donne, D., La Monica, F. P., Tamburello, G., Coppola, D., et al. (2021). Volcanic CO2 tracks the incubation period of basaltic paroxysms. Sci. Adv. 7 (38), eabh0191. doi:10.1126/sciadv.abh0191
Allard, P. A., Carbonelle, J., Métrich, N., Loyer, H., and Zettwoog, P. (1994). Sulphur output and magma degassing budget of Stromboli volcano. Nature 368, 326–330. doi:10.1038/368326a0
Allard, P., Aiuppa, A., Burton, M., Caltabiano, T., Federico, C., Salerno, G., et al. (2008). “Crater gas emissions and the magma feeding system of Stromboli volcano,” in The Stromboli volcano: An integrated study of the 2002–2003 eruption. Editors S. Calvari, S. Inguaggiato, G. Puglisi, M. Ripepe, and M. Rosi (Washington, DC: AGU), 182, 65–80. Geophys. Monogr. Ser.
Barth, A., Edmonds, M., and Woods, A. (2019). Valve-like dynamics of gas flow through a packed crystal mush and cyclic strombolian explosions. Sci. Rep. 9, 821. doi:10.1038/s41598-018-37013-8
Bertagnini, A., Métrich, N., Francalanci, L., Landi, P., Tommasini, S., and Conticelli, S. (2008). “Volcanology and magma geochemistry of the present-day activity: Constraints on the feeding system,” in Learning from Stromboli. Editors S. Calvari, S. Inguaggiato, G. Puglisi, M. Ripepe, and M. Rosi (Washington, DC: Am Geophys Union), 182, 19–38. Geophys. Mon.
Bluth, G. S. J., Shannon, J. M., Watson, I. M., Prata, A. J., and Realmuto, V. J. (2007). Development of an ultra-violet digital camera for volcanic SO2 imaging. J. Volcanol. Geotherm. Res. 161, 47–56. doi:10.1016/j.jvolgeores.2006.11.004
Bonaccorso, A., Calvari, S., Garfì, G., Lodato, L., and Patanè, D. (2003). Dynamics of the December 2002 flank failure and tsunami at Stromboli volcano inferred by volcanological and geophysical observations. Geophys. Res. Lett. 30 (18), 1941. doi:10.1029/2003GL017702
Bonaccorso, A., Gambino, S., Guglielmino, F., Mattia, M., Puglisi, G., and Boschi, E. (2008). Stromboli 2007 eruption: Deflation modeling to infer shallow-intermediate plumbing system. Geophys. Res. Lett. 35, L06311. doi:10.1029/2007gl032921
Bradski, G., and Kaehler, A. (2008). Learning OpenCV: Computer vision with the OpenCV library. Newton, MA, USA: O’Reilly Media.
Burton, M. R., Allard, P., Murè, F., and La Spina, A. (2007). Magmatic gas composition reveals the source depth of slug-driven Strombolian explosive activity. Science 317, 227–230. doi:10.1126/science.1141900
Burton, M. R., Caltabiano, T., Murè, F., Salerno, G., and Randazzo, D. (2009). SO2 flux from Stromboli during the 2007 eruption: Results from the FLAME network and traverse measurements. J. Volcanol. Geotherm. Res. 182 (3), 214–220. doi:10.1016/j.jvolgeores.2008.11.025
Burton, M. R., Prata, F., and Platt, U. (2015). Volcanological applications of SO2 cameras. J. Volcanol. Geotherm. Res. 300, 2–6. doi:10.1016/j.jvolgeores.2014.09.008
Calvari, S., Lodato, L., Steffke, A., Cristaldi, A., L Harris, A. J., Spampinato, L., et al. (2010). The 2007 Stromboli eruption: Event chronology and effusion rates using thermal infrared data. J. Geophys. Res. 115 (B04201), B04201. doi:10.1029/2009JB006478
Calvari, S., Spampinato, L., Bonaccorso, A., Oppenheimer, C., Rivalta, E., and Boschi, E. (2011). Lava effusion—A slow fuse for paroxysms at Stromboli volcano? Earth Planet. Sci. Lett. 301 (1–2), 317–323. doi:10.1016/j.epsl.2010.11.015
Calvari, S., Spampinato, L., Lodato, L., Harris, A. J. L., Patrick, M. R., Dehn, J., et al. (2005). Chronology and complex volcanic processes during the 2002–2003 flank eruption at Stromboli Volcano (Italy) reconstructed from direct observations and surveys with a hand-held thermal camera. J. Geophys. Res. 110, B02201. doi:10.1029/2004JB003129
Campion, R., Delgado-Granados, H., and Mori, T. (2015). Image-based correction of the light dilution effect for SO2 camera measurements. J. Volcanol. Geotherm. Res. 300, 48–57. doi:10.1016/j.jvolgeores.2015.01.004
Caracciolo, A., Gurioli, L., Marianelli, P., Bernard, J., and Harris, A. (2021). Textural and chemical features of a “soft” plug emitted during strombolian explosions: A case study from Stromboli volcano. Earth Planet. Sci. Lett. 559, 116761. doi:10.1016/j.epsl.2021.116761
Chouet, B., Dawson, P., Ohminato, T., Martini, M., Saccorotti, G., Giudicepietro, F., et al. (2003). Source mechanisms of explosions at Stromboli volcano, Italy, determined from moment-tensor inversions of very-long-period data. J. Geophys. Res. 108 (B1), ESE 7-1–ESE 7-25. doi:10.1029/2002JB001919
Corazzato, C., Francalanci, L., Menna, M., Petrone, C. M., Renzulli, A., Tibaldi, A., et al. (2008). What controls sheet intrusion in volcanoes? Structure and petrology of the Stromboli sheet complex, Italy. J. Volcanol. Geotherm. Res. 173, 26–54. doi:10.1016/j.jvolgeores.2008.01.006
D'Aleo, R., Bitetto, M., Delle Donne, D., Coltelli, M., Coppola, D., McCormick Kilbride, B., et al. (2019). Understanding the SO2 degassing budget of Mt etna's paroxysms: First clues from the december 2015 sequence. Front. Earth Sci. 6, 239. doi:10.3389/feart.2018.00239
D’Aleo, R., Bitetto, M., Delle Donne, D., Tamburello, G., Battaglia, A., Coltelli, M., et al. (2016). Spatially resolved SO2 flux emissions from Mt Etna. Geophys. Res. Lett. 43, 7511–7519. doi:10.1002/2016GL069938
Dalton, M. P., Waite, G. P., Watson, I. M., and Nadeau, P. A. (2010). Multiparameter quantification of gas release during weak strombolian eruptions at Pacaya volcano, Guatemala. Geophys. Res. Lett. 37, L09303. doi:10.1029/2010GL042617
Del Bello, E., Lane, S. J., R James, M., Llewellin, E. W., Taddeucci, J., Scarlato, P., et al. (2015). Viscous plugging can enhance and modulate explosivity of strombolian eruptions. Earth Planet. Sci. Lett. 423, 210–218. doi:10.1016/j.epsl.2015.04.034
Delle Donne, D., and Ripepe, M. (2012). High‐frame rate thermal imagery of Strombolian explosions: Implications for explosive and infrasonic source dynamics. J. Geophys. Res. Solid Earth 117 (B9), 9206. doi:10.1029/2011JB008987
Delle Donne, D., Aiuppa, A., Bitetto, M., D’Aleo, R., Coltelli, M., Coppola, D., et al. (2019). Changes in SO2 flux regime at Mt. Etna captured by automatically processed ultraviolet camera data. Remote Sens. (Basel). 11, 1201. doi:10.3390/rs11101201
Delle Donne, D., Ripepe, M., Lacanna, G., Tamburello, G., Bitetto, M., and Aiuppa, A. (2016). Gas mass derived by infrasound and UV cameras: Implications for mass flow rate. J. Volcanol. Geotherm. Res. 325, 169–178. doi:10.1016/j.jvolgeores.2016.06.015
Delle Donne, D., Tamburello, G., Aiuppa, A., Bitetto, M., Lacanna, G., D’Aleo, R., et al. (2017). Exploring the explosive-effusive transition using permanent ultraviolet cameras. J. Geophys. Res. Solid Earth 122, 4377–4394. doi:10.1002/2017jb014027
Di Traglia, F., Calvari, S., D'Auria, L., Nolesini, T., Bonaccorso, A., Fornaciai, A., et al. (2018). The 2014 effusive eruption at Stromboli: New insights from in situ and remote-sensing measurements. Remote Sens. (Basel). 10, 2035. doi:10.3390/rs10122035
Di Traglia, F., Nolesini, T., Intrieri, E., Mugnai, F., Leva, D., Rosi, M., et al. (2014). The ground-based InSAR monitoring system at Stromboli volcano: Linking changes in displacement rate and intensity of persistent volcanic activity. Bull. Volcanol. 139, 786–335. doi:10.1007/s00445-013-0786-2
Fee, D., and Matoza, R. S. (2013). An overview of volcano infrasound: From Hawaiian to plinian, local to global. J. Volcanol. Geotherm. Res. 249, 123–139. doi:10.1016/j.jvolgeores.2012.09.002
Francalanci, L., Lucchi, F., Keller, J., De Astis, G., and Tranne, C. A. (2013). “The aeolian islands volcanoes,” in Geol. Soc. Lond. Mem. Editors F. Lucchi, A. Peccerillo, J. Keller, C. A. Tranne, and P. L. Rossi (London: Geological Society), 3737, p397–p471. Memoirs. doi:10.1144/M37.13
Giudicepietro, F., Calvari, S., Alparone, S., Bianco, F., Bonaccorso, A., Bruno, V., et al. (2019). Integration of ground-based remote-sensing and in situ multidisciplinary monitoring data to analyze the eruptive activity of Stromboli volcano in 2017–2018. Remote Sens. (Basel). 11, 1813. doi:10.3390/rs11151813
Gonnermann, H. M., and Manga, M. (2013). “Dynamics of magma ascent in the volcanic conduit,” in Modeling volcanic processes: The physics and mathematics of volcanism (Cambridge: Cambridge University Press), 55.
Gurioli, L., Colo', L., Bollasina, A. J., Harris, A. J., Whittington, A., and Ripepe, M. (2014). Dynamics of strombolian explosions: Inferences from field and laboratory studies of erupted bombs from Stromboli volcano. J. Geophys. Res. Solid Earth 119 (1), 319–345. doi:10.1002/2013jb010355
Harris, A. J. L., and Stevenson, D. S. (1997). Thermal observations of degassing open conduits and fumaroles at Stromboli and Vulcano using remotely sensed data. J. Volcanol. Geotherm. Res. 76, 175–198. doi:10.1016/s0377-0273(96)00097-2
Harris, A., and Ripepe, M. (2007b). Synergy of multiple geophysical approaches to unravel explosive eruption conduit and source dynamics—a case study from Stromboli. Geochemistry 67 (1), 1–35. doi:10.1016/j.chemer.2007.01.003
Harris, A., and Ripepe, M. (2007a). Temperature and dynamics of degassing at Stromboli. J. Geophys. Res. 112, B03205. doi:10.1029/2006JB004393
Kantzas, E. P., McGonigle, A. J., Tamburello, G., Aiuppa, A., and Bryant, R. G. (2010). Protocols for UV camera volcanic SO2 measurements. J. Volcanol. Geotherm. Res. 194 (1-3), 55–60. doi:10.1016/j.jvolgeores.2010.05.003
Kazahaya, R., Mori, T., Takeo, M., Ohminato, T., Urabe, T., and Maeda, Y. (2011). Relation between single very long period pulses and volcanic gas emissions at Mt. Asama, Japan. Geophys. Res. Lett. 38, L11307. doi:10.1029/2011GL047555
Kern, C., Deutschmann, T., Vogel, L., Wöhrbach, M., Wagner, T., and Platt, U. (2010a). Radiative transfer corrections for accurate spectroscopic measurements of volcanic gas emissions. Bull. Volcanol. 72 (2), 233–247. doi:10.1007/s00445-009-0313-7
Kern, C., Kick, F., Lübcke, P., Vogel, L., Wöhrbach, M., and Platt, U. (2010b). Theoretical description of functionality, applications, and limitations of SO&lt;sub&gt;2&lt;/sub&gt; cameras for the remote sensing of volcanic plumes. Atmos. Meas. Tech. 3 (3), 733–749. doi:10.5194/amt-3-733-2010
Klein, A., Lübcke, P., Bobrowski, N., Kuhn, J., and Platt, U. (2017). Plume propagation direction determination with SO2 cameras. Atmos. Meas. Tech. 10 (3), 979–987. doi:10.5194/amt-10-979-2017
Laiolo, M., Delle Donne, D., Coppola, D., Bitetto, M., Cigolini, C., Della Schiava, M., et al. (2022). Shallow magma dynamics at open-vent volcanoes tracked by coupled thermal and SO2 observations. Earth Planet. Sci. Lett. 594, 117726. doi:10.1016/j.epsl.2022.117726
Landi, P., Marchetti, E., La Felice, S., Ripepe, M., and Rosi, M. (2011). Integrated petrochemical and geophysical data reveals thermal distribution of the feeding conduits at Stromboli volcano, Italy. Geophys. Res. Lett. 38 (8). doi:10.1029/2010gl046296
LGS (2022). LGS bulletins. Available at: http://lgs.geo.unifi.it/index.php/reports/stromboli-daily (Accessed 11 October, 2022).
Lucas, B. D., and Kanade, T. (1981). An iterative image registration technique with an application to stereo vision. IJCAI 81, 674–679.
Marchetti, E., Ripepe, M., Ulivieri, G., Burton, M. R., Caltabiano, T., and Salerno, G. (2008). “Gas flux rate and migration of the magma column,” in The Stromboli volcano: An integrated study of the 2002–2003 eruption. Editors S. Calvari, S. Inguaggiato, G. Puglisi, M. Ripepe, and M. Rosi (Washington, DC: AGU), 182, 259–267. Geophys. Monogr. Ser. doi:10.1029/182GM21
Mattia, M., Di Lieto, B., Ganci, G., Bruno, V., Romano, P., Ciancitto, F., et al. (2021). The 2019 eruptive activity at Stromboli volcano: A multidisciplinary approach to reveal hidden features of the “unexpected” 3 july paroxysm. Remote Sens. 13 (20), 4064. doi:10.3390/rs13204064
McGonigle, A. J. S., Aiuppa, A., Ripepe, M., Kantzas, E. P., and Tamburello, G. (2009). Spectroscopic capture of 1 Hz volcanic SO2 fluxes and integration with volcano geophysical data. Geophys. Res. Lett. 36 (21), L21309. doi:10.1029/2009gl040494
McGonigle, A. J. S., Pering, T. D., Wilkes, T. C., Tamburello, G., D’Aleo, R., Bitetto, M., et al. (2017). Ultraviolet imaging of volcanic plumes: A new paradigm in volcanology. Geosciences 7, 68. doi:10.3390/geosciences7030068
Mori, T., and Burton, M. (2009). Quantification of the gas mass emitted during single explosions on Stromboli with the SO2 imaging camera. J. Volcanol. Geotherm. Res. 188 (4), 395–400. doi:10.1016/j.jvolgeores.2009.10.005
Mori, T., and Burton, M. (2006). The SO2 camera: A simple, fast and cheap method for ground-based imaging of SO2 in volcanic plumes. Geophys. Res. Lett. 33, L24804. doi:10.1029/2006GL027916
Nadeau, P. A., Werner, C. A., Waite, G. P., Carn, S. A., Brewer, I. D., Elias, T., et al. (2015). Using SO2 camera imagery and seismicity to examine degassing and gas accumulation at Kilauea volcano, May 2010. J. Volcanol. Geotherm. Res. 300, 70–80. doi:10.1016/j.jvolgeores.2014.12.005
Neri, M., and Lanzafame, G. (2009). Structural features of the 2007 Stromboli eruption. J. Volcanol. Geotherm. Res. 182, 137–144. doi:10.1016/j.jvolgeores.2008.07.021
Oppenheimer, C., Fischer, T. P., and Scaillet, B. (2014). “Volcanic degassing: Process and impact,” in Treatise on geochemistry. Second Edition (Elsevier), 4, 111–179.
Oppenheimer, C., Scaillet, B., and Martin, R. S. (2011). Sulfur degassing from volcanoes: Source conditions, surveillance, plume chemistry and Earth system impacts. Rev. Mineralogy Geochem. 73 (1), 363–421. doi:10.2138/rmg.2011.73.13
Oppenheimer, C., Scaillet, B., Woods, A., Sutton, A. J., Elias, T., and Moussallam, Y. (2018). Influence of eruptive style on volcanic gas emission chemistry and temperature. Nat. Geosci. 11 (9), 678–681. doi:10.1038/s41561-018-0194-5
Penndorf (1957). Tables of the refractive index for standard air and the Rayleigh scattering coefficient for the spectral region between 02 and 200 μ and their application to atmospheric optics. J. Opt. Soc. Am. 47, 176–182. doi:10.1364/josa.47.000176
Pering, T. D., Liu, E. J., Wood, K., Wilkes, T. C., Aiuppa, A., Tamburello, G., et al. (2020). Combined ground and aerial measurements resolve vent-specific gas fluxes from a multi-vent volcano. Nat. Commun. 11 (1), 3039. doi:10.1038/s41467-020-16862-w
Pering, T. D., McGonigle, A. J. S., James, M. R., Tamburello, G., Aiuppa, A., Delle Donne, D., et al. (2016). Conduit dynamics and post explosion degassing on Stromboli: A combined UV camera and numerical modeling treatment. Geophys. Res. Lett. 43 (10), 5009–5016. doi:10.1002/2016gl069001
Platt, U., and Stutz, J. (2008). “Differential absorption spectroscopy,” in Differential optical absorption spectroscopy (Berlin, Heidelberg: Springer), 135–174.
Ripepe, M., and Braun, T. (1994). Air-wave phases in strombolian explosion-quakes seismograms: A possible indicator for the magma level? Acta vulcanol. 5, 201–206.
Ripepe, M., Delle Donne, D., Genco, R., Maggio, G., Pistolesi, M., Marchetti, E., et al. (2015). Volcano seismicity and ground deformation unveil the gravity-driven magma discharge dynamics of a volcanic eruption. Nat. Commun. 6, 6998. doi:10.1038/ncomms7998
Ripepe, M., Delle Donne, D., Harris, A. J. L., Marchetti, E., and Ulivieri, G. (2008). “Dynamics of strombolian activity,” in The Stromboli volcano: An integrated study of the 2002–2003 eruption. Editors S. Calvari, S. Inguaggiato, G. Puglisi, M. Ripepe, and M. Rosi (Washington, DC: AGU publication), 182, 39–48. doi:10.1029/182GM05
Ripepe, M., Delle Donne, D., Lacanna, G., Marchetti, E., and Ulivieri, G. (2009). The onset of the 2007 Stromboli effusive eruption recorded by an integrated geophysical network. J. Volcanol. Geotherm. Res. 182, 131–136. doi:10.1016/j.jvolgeores.2009.02.011
Ripepe, M., Delle Donne, D., Legrand, D., Valade, S., and Lacanna, G. (2021). Magma pressure discharge induces very long period seismicity. Sci. Rep. 11 (1), 20065. doi:10.1038/s41598-021-99513-4
Ripepe, M., Harris, A. J., and Carniel, R. (2002). Thermal, seismic and infrasonic evidences of variable degassing rates at Stromboli volcano. J. Volcanol. Geotherm. Res. 118 (3-4), 285–297. doi:10.1016/s0377-0273(02)00298-6
Ripepe, M., and Marchetti, E. (2002). Array tracking of infrasonic sources at Stromboli volcano. Geophys. Res. Lett. 29 (22), 33-1–33–4. doi:10.1029/2002GL015452
Ripepe, M., Marchetti, E., Ulivieri, G., Harris, A., Dehn, J., Burton, M. R., et al. (2005). Effusive to explosive transition during the 2003 eruption of Stromboli Volcano. Geol. 33 (5), 341–344. doi:10.1130/G21173.1
Ripepe, M., Marchetti, E., and Ulivieri, G. (2007). Infrasonic monitoring at Stromboli volcano during the 2003 effusive eruption: Insights on the explosive and degassing process of an open conduit system. J. Geophys. Res. 112, B09207. doi:10.1029/2006JB004613
Ripepe, M., Pistolesi, M., Coppola, D., Delle Donne, D., Genco, R., Lacanna, G., et al. (2017). Forecasting effusive dynamics and decompression rates by magmastatic model at open-vent volcanoes. Sci. Rep. 7, 3885. doi:10.1038/s41598-017-03833-3
Rizzo, A. L., Federico, C., Inguaggiato, S., Sollami, A., Tantillo, M., Vita, F., et al. (2015). The 2014 effusive eruption at Stromboli volcano (Italy): Inferences from soil CO2 flux and 3He/4He ratio in thermal waters. Geophys. Res. Lett. 42, 2235–2243. doi:10.1002/2014gl062955
Rosi, M., Pistolesi, M., Bertagnini, A., Landi, P., Pompilio, M., and Di Roberto, A. (2013). “Stromboli volcano, aeolian islands (Italy): Present eruptive activity and hazards,” in The aeolian islands volcanoes. Editors F. Lucchi, PeccerilloA, J. Keller, C. A. Tranne, and P. L. Rossi (Lyell Collection), 37, 473–490. doi:10.1144/M37.14
Saballos, J. A., Conde, V., Malservisi, R., Connor, C. B., Alvarez, J., and Munoz, A. (2014). Relatively short-term correlation among deformation, degassing, and seismicity: A case study from concepción volcano, Nicaragua. Bull. Volcanol. 76, 843. doi:10.1007/s00445-014-0843-5
Shinohara, H. (2008). Excess degassing from volcanoes and its role on eruptive and intrusive activity. Rev. Geophys. 46, RG4005. doi:10.1029/2007RG000244
Stevenson, D. S., and Blake, S. (1998). Modelling the dynamics and thermodynamics of volcanic degassing. Bull. Volcanol. 60, 307–317. doi:10.1007/s004450050234
Suckale, J., Keller, T., Cashman, K., and Persson, P. O. (2016). Flow to fracture transition in a volcanic mush plug may govern normal eruptions at Stromboli. Geophys. Res. Lett. 43. doi:10.1002/2016gl071501
Tamburello, G., Aiuppa, A., Kantzas, E. P., McGonigle, A. J. S., and Ripepe, M. (2012). Passive vs. active degassing modes at an open-vent volcano (Stromboli, Italy). Earth Planet. Sci. Lett. 359–360, 106–116. doi:10.1016/j.epsl.2012.09.050
Tarchi, D., Casagli, N., Fortuny-Guasch, J., Guerri, L., Antonello, G., and Leva, D. (2008). Ground deformation from ground-based SAR interferometry. The Stromboli Volcano, an integrated study of the 2002–2003 eruption. AGU Geophys. Monogr. 182, 359–372.
Thivet, S., Harris, A. J., Gurioli, L., Bani, P., Barnie, T., Bombrun, M., et al. (2021). Multi-parametric field experiment links explosive activity and persistent degassing at Stromboli. Front. Earth Sci. (Lausanne). 9, 431. doi:10.3389/feart.2021.669661
Tibaldi, A. (2001). Multiple sector collapses at Stromboli volcano, Italy: How they work. Bull. Volcanol. 63, 112–125. doi:10.1007/s004450100129
Tommasi, P., Baldi, P., Chiocci, F. L., Coltelli, M., Marsella, M., and Romagnoli, C. (2008). “Slope failures induced by the December 2002 eruption at Stromboli volcano,” in The Stromboli volcano: An integrated study of the 2002–2003 eruption. Editors S. Calvari, S. Inguaggiato, G. Puglisi, M. Ripepe, and M. Rosi (Washington, DC: AGU), 182, 129–145. Geophys. Monogr. Ser.
Valade, S., Lacanna, G., Coppola, D., Laiolo, M., Pistolesi, M., Delle Donne, D., et al. (2016). Tracking dynamics of magma migration in open-conduit systems. Bull. Volcanol. 78 (11), 78. doi:10.1007/s00445-016-1072-x
Varnam, M., Burton, M., Esse, B., Salerno, G., Kazahaya, R., and Ibarra, M. (2021). Two independent light dilution corrections for the SO2 camera retrieve comparable emission rates at masaya volcano, Nicaragua. Remote Sens. 13 (5), 935. doi:10.3390/rs13050935
Vergniolle, S., and Métrich, N. (2022). An interpretative view of open-vent volcanoes. Bull. Volcanol. 84 (9), 83–45. doi:10.1007/s00445-022-01581-5
Viccaro, M., Cannata, A., Cannavò, F., De Rosa, R., Giuffrida, M., Nicotra, E., et al. (2021). Shallow conduit dynamics fuel the unexpected paroxysms of Stromboli volcano during the summer 2019. Sci. Rep. 11 (1), 266. doi:10.1038/s41598-020-79558-7
Waite, G. P., Nadeau, P. A., and Lyons, J. J. (2013). Variability in eruption style and associated very long period events at Fuego volcano, Guatemala. JGR. Solid Earth 118, 1526–1533. doi:10.1002/jgrb.50075
Watson, I. M., Oppenheimer, C., Voight, B., Francis, P. W., Clarke, A., Stix, J., et al. (2000). The relationship between degassing and ground deformation at Soufriere Hills Volcano, Montserrat. J. Volcanol. Geotherm. Res. 98117, 117–126. doi:10.1016/S0377-0273(99)00187-0
Woitischek, J., Woods, A. W., Edmonds, M., Oppenheimer, C., Aiuppa, A., Pering, T. D., et al. (2020). Strombolian eruptions and dynamics of magma degassing at Yasur Volcano (Vanuatu). J. Volcanol. Geotherm. Res. 398, 106869. doi:10.1016/j.jvolgeores.2020.106869
Keywords: volcanic degassing, Stromboli (Italy), Strombolian activity, UV camera, SO2 flux, volcano monitoring
Citation: Delle Donne D, Lo Coco E, Bitetto M, La Monica FP, Lacanna G, Lages J, Ripepe M, Tamburello G and Aiuppa A (2022) Spatio-temporal changes in degassing behavior at Stromboli volcano derived from two co-exposed SO2 camera stations. Front. Earth Sci. 10:972071. doi: 10.3389/feart.2022.972071
Received: 17 June 2022; Accepted: 05 October 2022;
Published: 28 October 2022.
Edited by:
Silvana Hidalgo, Instituto Geofísico-Escuela Politécnice Nacional, EcuadorReviewed by:
Tom D. Pering, The University of Sheffield, United KingdomCopyright © 2022 Delle Donne, Lo Coco, Bitetto, La Monica, Lacanna, Lages, Ripepe, Tamburello and Aiuppa. This is an open-access article distributed under the terms of the Creative Commons Attribution License (CC BY). The use, distribution or reproduction in other forums is permitted, provided the original author(s) and the copyright owner(s) are credited and that the original publication in this journal is cited, in accordance with accepted academic practice. No use, distribution or reproduction is permitted which does not comply with these terms.
*Correspondence: Dario Delle Donne, ZGFyaW8uZGVsbGVkb25uZUBpbmd2Lml0
Disclaimer: All claims expressed in this article are solely those of the authors and do not necessarily represent those of their affiliated organizations, or those of the publisher, the editors and the reviewers. Any product that may be evaluated in this article or claim that may be made by its manufacturer is not guaranteed or endorsed by the publisher.
Research integrity at Frontiers
Learn more about the work of our research integrity team to safeguard the quality of each article we publish.