 Alain Rodrigue Nzeuga1*
 Franck Eitel Ghomsi2,3*
 Luan Thanh Pham4*
 Ahmed M. Eldosouky5*
 Zakari Aretouyap6
 Janvier Domra Kana7
 Zambou Tsopgni Yasmine3Alpha Baster Kenfack Fokem8Robert Nouayou3
 Kamal Abdelrahman9Mohammed S. Fnais9Peter Andráš10
- 1Department of Petroleum, Gas and Exploration, School of Geology and Mining Engineering, University of Ngaoundéré, Meiganga, Cameroon
- 2Geodesy Laboratory, National Institute of Cartography, Yaoundé, Cameroon
- 3Department of Physics, University of Yaoundé 1, Yaoundé, Cameroon
- 4Department of Geophysics, Faculty of Physics, University of Science, Vietnam National University, Hanoi, Vietnam
- 5Geology Department, Faculty of Science, Suez University, Suez, Egypt
- 6Department of Architecture and Engineering Art, Institute of Fine Arts, University of Dschang, Foumban, Cameroon
- 7Department of Mines, Petroleum and Water Resource Exploration, Faculty of Mines and Petroleum Industries, University of Maroua, Maroua, Cameroon
- 8Department of Mining Geology, School of Geology and Mining Engineering, University of Ngaoundéré, Meiganga, Cameroon
- 9Department of Geology and Geophysics, College of Science, King Saud University, Riyadh, Saudi Arabia
- 10Faculty of Natural Sciences, Matej Bel University in Banska Bystrica, Banska Bystrica, Slovakia
The southwest part of Cameroon is composed of a range of geological structures and sedimentary basins, whose geological history dates from the Cretaceous, and their establishment would have originated from the opening of the South Atlantic. Among these structures, the most important is the Cameroon Volcanic Line, generally denoted CVL, followed by the southern part of the Central African Shear Zone (CASZ) called the Foumban Shear Zone (FSZ), the Ntem Complex, the Benue Trough, the northern margin of the Congo Craton, and many others. The major structures identified in this part are formed as a result of geodynamic activity between the Oligocene and the recent period, to which we can add the volcanism that exists along with the continental limit. The XGM201e_2159 model is used to highlight the geological structures of Southwestern Cameroon. First, we separated the regional and residual anomalies from Bouguer gravity data. Then, we used a combination of filters to enhance the signature of the residual anomalies in Southwest Cameroon. These filters identified various geological structures in the area. Finally, we applied the enhanced horizontal gradient amplitude (EHGA) and multi-scale horizontal derivative of the vertical derivative (MSHDVD) methods to reveal the geological contacts, allowing us to establish the corresponding structural map of the region. In addition, the results obtained in this study are the first to precisely define the circumferential demarcation of the continental and oceanic expansions of Mount Cameroon, while clearly illustrating the Bao, Bomana, Tiko, and Ekona faults that extend to the Bakassi Peninsula and the Douala outlet. Furthermore, they highlight the strike–slip faults in the summit vicinity. The structural map shows that most of the geological boundaries identified in the area are trending in the NE–SW, NNE–SSW, ENE–WSW, N–S, and NW–SE directions.
1 Introduction
Located in the south-west of Cameroon, the study area spanned between longitudes 8˚00′ E and 11˚25′ E and latitudes 3˚00′ N and 7˚25′ N (Figure 1). It encompasses various geological structures and sedimentary basins whose origins remain subjects of reflection within the scientific community. Among these structures, the most important would be the succession of mountain ranges that form the Cameroon Volcanic Line (CVL). The CVL owes its origin to a large subvolcanic and volcanic sequence to which it belongs, which in turn would originate from its presence within several hot spots (Ngounouno et al., 2000; Ngounouno et al., 2003). This great lineament, which extends till the West African coast, is composed of both an oceanic and a continental part. It separates the sedimentary Rio Del Rey Basin from that of Douala–Kribi Campo. The mountain range that forms it is generally alkaline and formed between the Tertiary and the recent period (Fitton, 1987). This mountain range is subject to volcanism, which extends from the Atlantic islands of Pagulu to the interior of the African continent (Lee et al., 1994). The islands of Bioko and Sao Tomé et Principe constitute the marine component, while the Manengouba, Bamboutos, Oku, and Mandara mountains constitute the continental portion (Figure 1). This continental part has an average crustal density of 400 kg/m3, with an average Moho depth of about 32.5 km (Ghomsi et al., 2020; Ghomsi et al., 2022b). In addition to the CVL, we can see other structures in this area, including the Ntem Complex and the Mamfe Sedimentary Basin, which is a part of the Central Cameroonian Shear Zone.
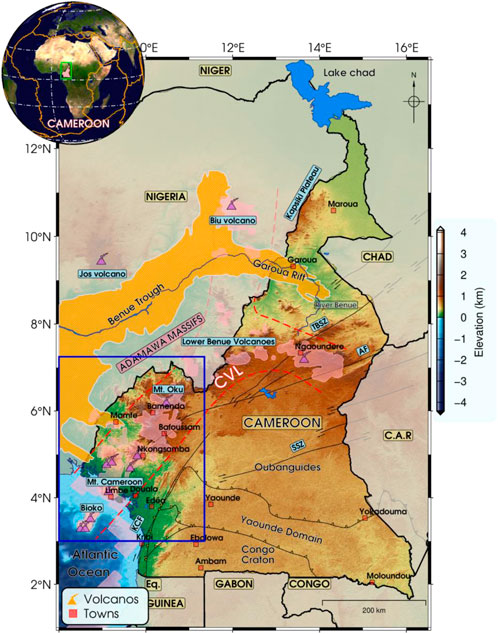
FIGURE 1. Map location of the study area with the representation of the Cameroon Volcanic Line.
According to Ubangoh et al. (2005), the positive anomalies seen along the CVL point are due to the presence of multiple active volcanic craters and cones as well as a strong geothermal gradient. Also, an analysis of the samples collected along the CVL highlights the existence of a predominant magnetization spectrum within it. The main lineaments of the region are highlighted in the past research by Nzeuga et al. (2019) and Ghomsi et al. (2022a) based on the interpretation of aeromagnetic data. Noutchogwé et al. (2011) and Ndikum et al., 2014; Ndikum et al., 2017 highlighted the geological contacts of this part of Cameroon from the interpretation of gravity data using the MSHDVD method. Koumetio et al. (2012) applied multi-scale elevation of the maxima of the horizontal derivative on the vertical gradient of the Bouguer anomaly, followed by 3D modeling to highlight geological structures in the region, visible on the signal as negative gravity anomalies. The basement of this region is intruded by bodies of variable shapes and sizes located at a depth varying between 1 and 10 km and a density range from 2.57 to 2.87 g/cm3. These intrusions observed in the crust of this region could be potential reservoirs of rare minerals (Fosso-Téguia et al., 2020), and the crust thickness is between 35 and 39 km (Tokam et al., 2010; Ghomsi et al., 2020; Ghomsi et al., 2022b).
Considering the results of previous work in the study area (Ghomsi et al., 2020; Ghomsi et al., 2021; Tchoukeu et al., 2021; Ghomsi et al., 2022b), the use of the recent XGM 2019e2159 Gravity Field Model presented by Zingerle et al. (2020) and the regional/residual separation of the Bouguer anomaly map by using the method of Zeng et al. (2007) could increase the signature gravity anomalies. Additionally, determining gravity source parameters is crucial for finding new mineral deposits and helps maximize exploratory drilling operations (Pham et al., 2019; Pham et al., 2020a; Duong et al., 2021; Long et al., 2021).
Gravity and magnetic data can provide vital information on the subsurface structures (Dung and Minh, 2017; Hang et al., 2019; Eldosouky et al., 2021a; Eldosouky et al., 2021b; Oksum 2021). The determination of geological boundaries from the interpretation of gravity data has been the subject of several studies, and many different techniques have been introduced (Melouah et al., 2021; Eldosouky et al., 2022a; Pham et al., 2022a; Eldosouky et al., 2022b; Pham et al., 2022b; Eldosouky et al., 2022c; Ghomsi et al., 2022c; Eldosouky et al., 2022d; Ghomsi et al., 2022d), such as, for example, the peak detection methods (Blakely and Simpson, 1986; Hang et al., 2017; Pham et al., 2018; Pham et al., 2021), vertical derivatives, the filters of horizontal gradient (Cordell, 1979; Cordell and Grauch, 1985), the analytical signal (Nabighian, 1972; Nabighian, 1984; Roest et al., 1992), tilt angle (Miller and Singh, 1994), the horizontal gradient amplitude of tilt angle (Verduzco et al., 2004), enhanced horizontal gradient amplitude (Pham et al., 2020a), improved logistic function (Pham et al., 2020b), and balanced horizontal gradient amplitude filters (Prasad et al., 2022a; Prasad et al., 2022b).
From the Bouguer anomaly data, we shall extract anomalies of importance in this study. Then, in order to emphasize the various contacts, we will use the first-order derivation, the horizontal gradient (HG), the analytical signal (AS), the tilt angle (TDR), the horizontal gradient of the tilt angle (HG_TDR), and the enhanced horizontal gradient amplitude (EHGA) filters. Finally, we will compare the geological contacts obtained on the TDR, HG_TDR, and EHGA maps with those obtained by using the MSHDVD method to reveal a new tectono-structural map of the region.
2 Geological setting
The geology of the southwestern part of Cameroon illustrated in Figure 2 is very large and complex. The CVL consists of a succession of mountains ranging in age from the Tertiary to the recent period (Fitton and Dunlop, 1985). Among the elements that constitute it, we can cite the Adamaoua–Yade Plateau and the Western Cameroon Highlands, generally called the Cameroon Highlands. The highlands of Cameroon form the androgenic plutonic complexes of the CVL and encompass a succession of volcanoes oriented at 30˚E with peaks ranging from 900 to 1,800 m for the smallest to 3,010 m for Mount Oku and 4,020–4,100 m for Mount Cameroon, located near the coastal plain (Deruelle et al., 2007; Beckline et al., 2018; Wembenyui et al., 2020). The CVL consists of eight monogenetic volcanic fields with an estimated total area of 17,000 km2, with individual fields ranging in size from 700–4,000 km2 (Schmidt et al., 2022). Because the CVL is located in a unique tectonic environment at the transition from the oceanic to continental crust, it serves as a natural laboratory for the study of the geochemical evolution of alkaline magmas with varying degrees of crustal contamination and mixing. Mount Cameroon is the only active mountain in the mountain range that constitutes the CVL, and its last seven eruptions date from 1909, 1922, 1954, 1959, 1982, 1999, and 2000 (Geze, 1943; Fitton et al., 1983; Suh et al., 2003). The basanitic and alkaline basaltic nature of its flows, adding small quantities of pyroclastic materials and volcanic cinder cones, make it a composite volcano (Suh et al., 2003; Yokoyama et al., 2007; Suh et al., 2008). The CVL has a crystalline basement embedded in the mobile orogenic Ubangid belt, bounded by the Pan-African range and located between the Saharan Metacraton, the Congo Craton, and the West African cratons (Meyers et al., 1998; Ghomsi et al., 2020; Ghomsi et al., 2021; Ghomsi et al., 2022b). Ghomsi et al. (2022a) applied the intensity of the enhanced horizontal gradient amplitude (EHGA) on the aeromagnetic data to highlight the major geological structures of the CVL and their effects on the topography and the cross-correlation analysis to highlight the principal directions of magnetization of certain anomalies. The Central African Shear Zone (CASZ), a component of the Pan-African Range, is a major fault belt still active. Its nature is identical to that of its counterpart, known as the Pernambuco lineament, located in Northeast Brazil, which would be an extension of the CVL in South America (Torsvik et al., 2009; Aslanian and Moulin, 2010; Moulin et al., 2010).
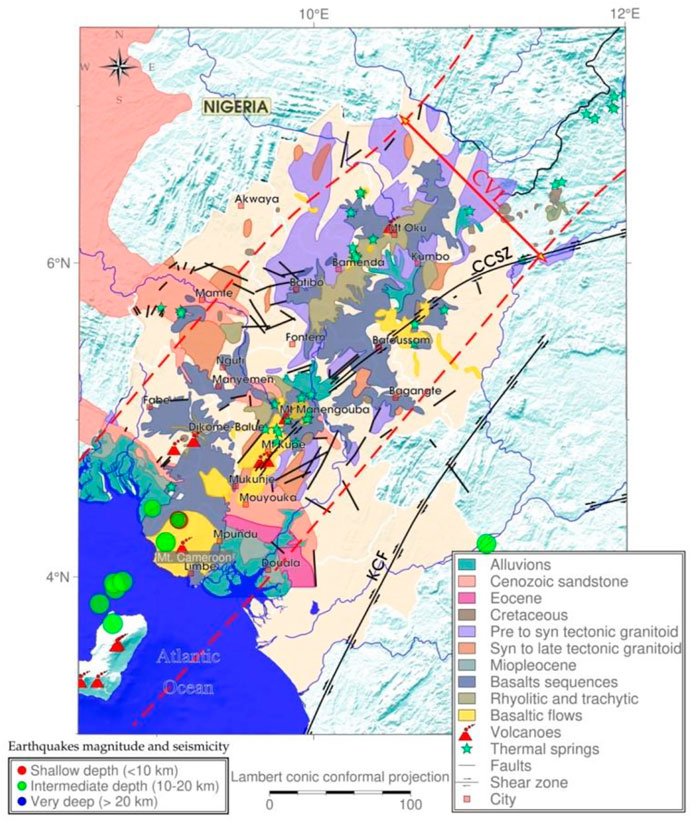
FIGURE 2. Geology map of Southern Cameroon (after Ghomsi et al., 2022a).
The Ntem Complex, part of which is in our study area, represents the northern part of the Congo Craton. It is formed mainly of Archean rocks, intrusive rocks, leptynites, and gneisses (Tchameni et al., 2001). The intrusions encountered in the Ntem Complex are mainly granites, tonalites, and syenites. The Nyong unit is the part of the Ntem Complex which appears in our study area. This unit consists mainly of gneisses and greenstones in the form of a belt and represents the NW section of the Ntem Complex (Maurizot et al., 1986; Minyem and Nedelec, 1990; Tchameni, 1997). Basic and ultrabasic rocks and ferriferous and barren quartzites are the constituent elements of greenstone belts. The blastomylonitic shear zones observed irregularly on the Nyong and Ntem units owe their origin to faulting deformation. Neoproterozoic intrusions of nepheline syenite in a sinistral shear zone in the Nyong unit also owe their origin to the last magmatic episode in this one (Maurizot et al., 1986; Nsifa, 2005).
Another part of our study area is the Benue Trough. It is a large sedimentary basin oriented in the NE–SW direction, distributed over a length of about 1,000 km, which extends from the Niger Delta in Southern Nigeria to the vicinity of Lake Chad. Its origin dates from the Cretaceous with the opening of the South Atlantic (Guiraud and Maurin, 1992; Nouayou, 2005). The Benue Trough includes many faults of various kinds in its upstream part, and the main ones are oriented along the N115˚E structural direction (Regnoult, 1986). It is represented in Cameroon in the North by the Garoua Rift, also called Yola Trough, and in the south-east region by the Mamfe Sedimentary Basin. The volcanic massifs of Cameroon are at the origin of the interruption of the extension of the Cameroonian coastal basins of Douala/Kribi–Campo toward the Benue Trough, and these basins (Mamfé, Rio Del Rey, and Douala/Kribi-Campo) would have the same geological history as this one (Nzeuga et al., 2019).
3 Data
The satellite-derived gravity data for the entire Southwest Cameroon are derived from the XGM 2019e_2159 (eXperimental Gravity field Model 2019) (Zingerle et al., 2020), which is represented through spheroidal harmonics, corresponding to a spatial resolution of 2’ (∼4 km), and has lesser artifacts. It is developed from altimetry, satellite-only model GOCO06s (Kvas et al., 2021), topography (Amante and Eakins, 2009), and ground data. It is a static global combined gravity field model with degree and order of 5,399. It has the long wave from GRACE+GOCE v5 and the short wave from land gravity averaged at 1/15° and marine and altimetric gravity (DTU15) provided by the National Geospatial-Intelligence Agency (NGA). The topographic heights are calculated from the spherical harmonic model of the topography (ETOPO1) used up to the same maximum degree as the gravity field model.
4 Methodology
To determine the lineaments and propose a geological model of the subsoil, highlighting the intrusions of igneous bodies in the southwestern part of Cameroon, many filtering operations are needed and should be applied to the gravity anomaly data. First, we have performed the regional–residual separation from the Bouguer anomalies using the method of Zeng et al. (2007). Then, the filters such as the horizontal gradient, analytical signal, tilt angle, and enhanced horizontal gradient amplitude have been applied to the residual anomaly data to enhance the geological edges. Finally, we have applied the improved maximum detection method (Pham et al., 2020c) to the multi-scale horizontal derivative of the vertical derivative to detect the geological contacts.
4.1 Regional/residual separation
The observed gravity anomaly is the sum of gravity effects of density differences at various depths (Oksum et al., 2019; Pham et al., 2022c; Ghomsi et al., 2022d). Here, we used the method of Zeng et al. (2007) for separating the regional anomaly resulting from deep sources from the observed gravity. Then, the residual anomaly generated by the shallow sources was calculated by removing the regional anomaly from the observed anomaly. This method calculates a series of cross-correlations between the upward continuations at two successive heights (Zeng et al., 2007). The height associated with the maximum deflection of these cross-correlation values yields the optimum height for regional/residual separation (Zeng et al., 2007).
4.2 Use of derivative filters
We consider ΔT as the value of the total gravimetric field caused by a random distribution of the density sources in the soil. When the gravity fields of several sources interfere, the application of the derived filters is important to dissociate them and to determine the location of the contacts at the origin of each source (Fedi and Florio, 2001). It also has the advantage of operating calculations at different heights via the upward extension stable operator (Jacobsen, 1987).
The first-order horizontal and vertical derivatives can be written as follows:
where Δx is the sampling distance along the longitudes; Δy is the sampling distance along the latitudes; i and j represent the data collection points of ΔT in x and y, respectively; F and F−1 represent the Fourier transform and inverse Fourier transform, respectively; and |k| is the radial wave number.
We can combine these elements to calculate the horizontal gradient (HG) (Cordell, 1979; Cordell and Grauch, 1985) and the analytical signal (AS) (Nabighian, 1972; Nabighian, 1984; Roest et al., 1992) as follows:
The maximum value of the HG and AS is used to detect the source edges (Grauch and Cordell, 1987; Phillips, 2000).
4.3 Tilt angle
The tilt angle (TDR) is also known as a phase filter. The tilt angle and its total horizontal gradient are recommended for the mapping of geological structures buried in the ground at medium depths and for the determination of ore deposits (Miller and Singh, 1994). This filter is applied on potential data, and it is defined as the ratio of the vertical derivative in the z-direction to the amplitude of the horizontal gradient as follows:
The horizontal gradient of the tilt angle (HG_TDR) was developed by Verduzco et al. (2004) to optimize the geological information given by the tilt angle. It is given by
4.4 Enhanced horizontal gradient amplitude
Pham et al. (2020a) proposed to use the enhanced horizontal gradient amplitude (EHGA) filter to highlight both the shallow and deep geological contacts responsible for the gravity anomalies observed at the surface. It can be given as follows:
where
4.5 Multi-scale horizontal derivative of the vertical derivative
As explained previously, the upward continuation on the data field is indicated to enhance the geological information in the ground at greater depths. For determination of geological contacts, the greater the extension height, the more information is enhanced on the deep contacts. Suppose the contact is located vertically from the source, then the maxima of the horizontal gradient of the extended map will make it possible to determine it, and the direction of shift of the maxima in question defines the dip direction of said contact (Fedi and Florio, 2001).
The following is a summary of the steps used for the MSHDVD method:
• Computing the first-order vertical gradient of the gravity data extended upward at different experimental altitudes, called multi-scale vertical derivative (MSVD).
• Determining the maxima of the horizontal gradient of the maps resulting from the MSVD method.
• Superposing the results determined for different continuation heights.
5 Results
5.1 Bouguer anomaly map
In this section, we outlined the Bouguer anomalies resulting from the combination of the XGM 2019e_2159 and the ETOPO1 models to plot the Bouguer anomaly map. A 5 min × 5 min gridded spatial distribution of the Bouguer gravity anomaly was obtained. The total gravity intensity (TGI) clearly showed the differences in the locations of high and low gravimetric intensities (Figure 3). Due to the effects of region on the distribution of gravity anomalies observed on this map, the interpretation may contain errors, and we must first eliminate these effects to interpret it. This will be the subject of the next section.
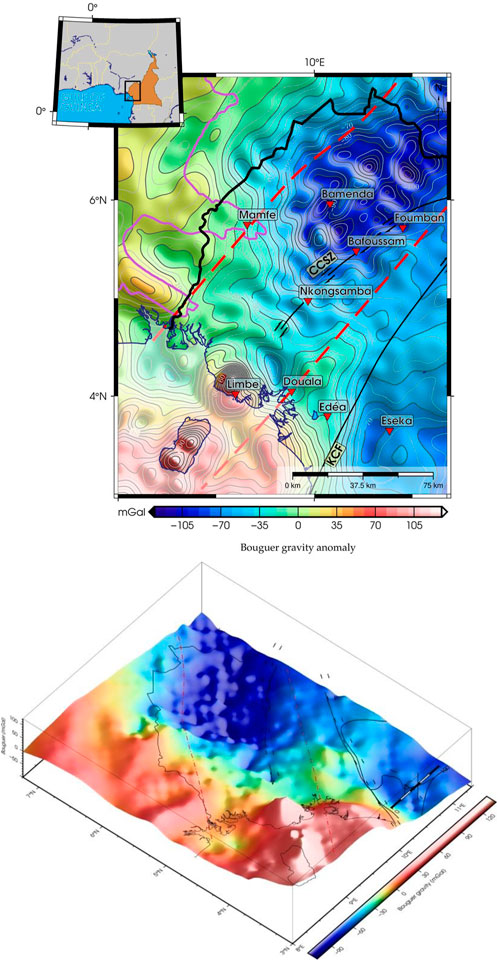
FIGURE 3. Bouguer anomaly map of the study area with its perspective representation, estimated on a 0.1° × 0.1° geographical grid (black lines represent national boundaries).
5.2 Regional/residual separation
The Bouguer anomalies map (Figure 3) showed positive long-wavelength anomalies reaching ∼174 mGal at the coast and negative anomalies in the eastern part of the study area, reaching peaks of −130 mGal. These positive anomalies would be the extension of the oceanic crust, which has a high density put in place during the opening of the South Atlantic (Torsvik et al., 2009; Lawrence et al., 2017). The negative anomalies observed to the northeast would be the deposits of ancient Precambrian rocks that would form the region’s bedrock. Furthermore, the 3D Bouguer anomalies map showed a high correlation between the regional distribution of anomalies and the topography, thus indicating the presence of isostatic compensation. In addition, we observed a great correlation between the Bouguer anomalies map and the geological map of the study area.
Figure 4A shows the cross-correlations between continuations to two successive heights versus the height. Figure 4B shows the deflection C versus the height for the Bouguer anomaly of the southwestern part of Cameroon. The curve of the deflection shows a maximum at a height of 20 km (Figure 4B). Thus, this height is regarded as the optimal height (Figure 4B). The upward continuation of the Bouguer anomaly data at a height of 20 km yields the regional anomaly (Figure 5A). The regional anomaly map obtained by extension shows a large positive anomaly at the coast and a large negative anomaly in the northwest region, separated by a medium-density structure. These anomalies would be caused by the effects of surface structures present in the study area. The residual anomaly caused by localized gravity effects was calculated by removing the regional anomaly data in Figure 5A from the observed anomaly. The calculated residual field anomaly map is shown in Figure 5B. The residual anomaly map provides precision on the distribution of gravity anomalies in the region. The positive anomalies observed along the coast and at the east of the region would be the representation of the CVL. The negative anomalies represent ancient Precambrian deposits, and mid-density anomalies represent sedimentary deposits.
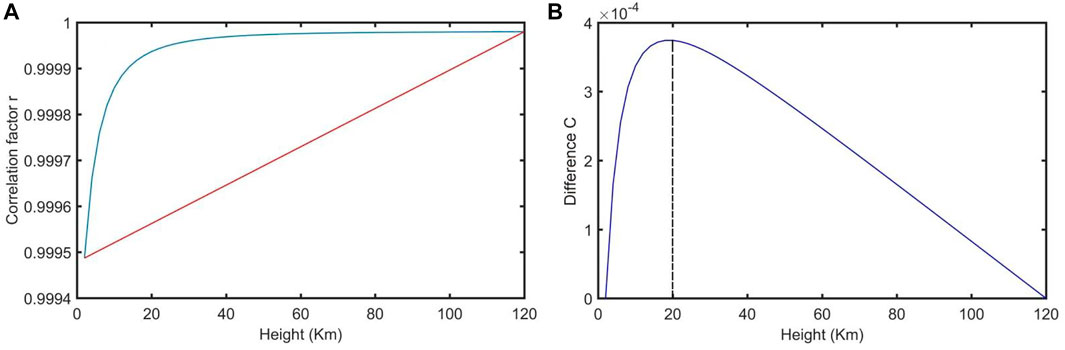
FIGURE 4. (A) Cross-correlations between the upward continuations at two successive heights. (B) Deflection C versus the height.
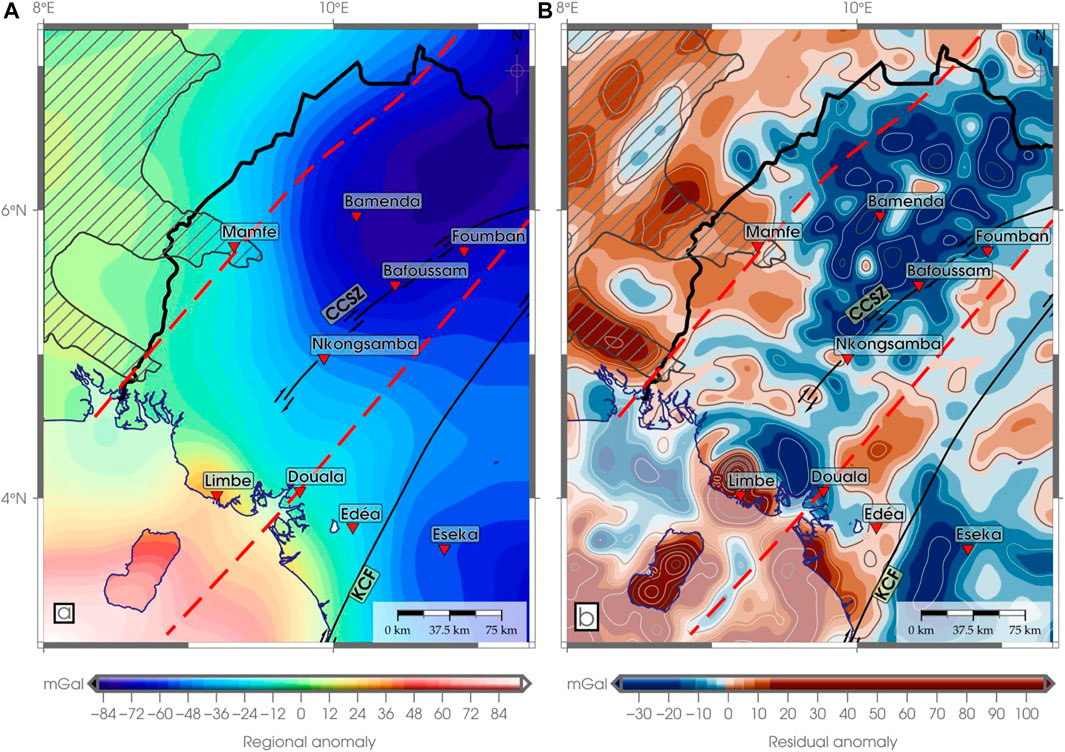
FIGURE 5. (A) Bouguer regional map; and (B) Bouguer residual map (black lines represent national boundaries).
5.3 Derivatives
To highlight the gravimetric signatures of the study area, the first-order derivative filters were applied, as explained in Section 4. Figure 6 shows the X, Y, and Z derivatives of gravimetric data. The X-derivative map shows that the positive anomalies observed are oriented NE–SW and the existence of sedimentary deposits along the coast and in the bordering part between the north-west and the south-west of Cameroon. This information is practically contradictory to that observed on the Y-derivative map. On the other hand, the Z-derivative map is similar to the residual anomaly map with positive anomalies oriented NE–SW, well dissociated compared to those observed in this one. Furthermore, Z-derivative presented anomalies of higher amplitudes, ranging between −4 and 8 mGal/km, than those observed on the X- and Y-derivatives and corroborated the existing information on the geological map.
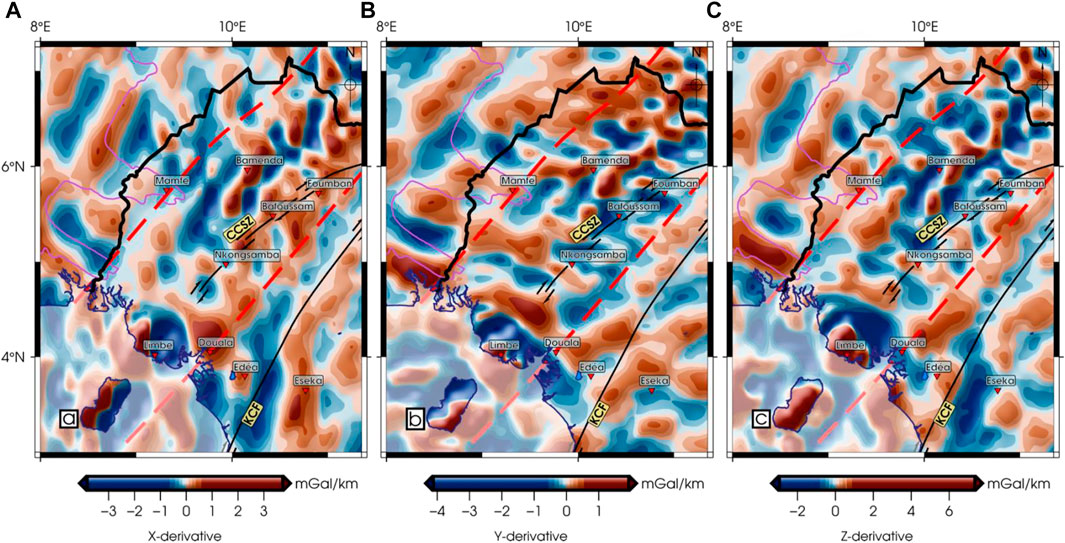
FIGURE 6. First-order derivative of the Bouguer residual anomaly map: (A) in the X-direction; (B) in Y-direction; and (C) in Z-direction (black lines represent national boundaries).
5.4 Gradient filters
The HG and AS were applied to the Bouguer residual map to characterize the isolated sources since, in most cases, the filtered anomaly is generally positive, and its maxima are located over the source edges. The gradient maps represented in Figure 7 show that the anomalies grouped in the Bouguer regional map are isolated, and the gradient filters aim to center the gravity anomalies below their geological sources. We can observe that the HG is more effective than the AS in mapping the source edges from gravity data. Here, Figure 7A also shows more edges than Figure 7B.
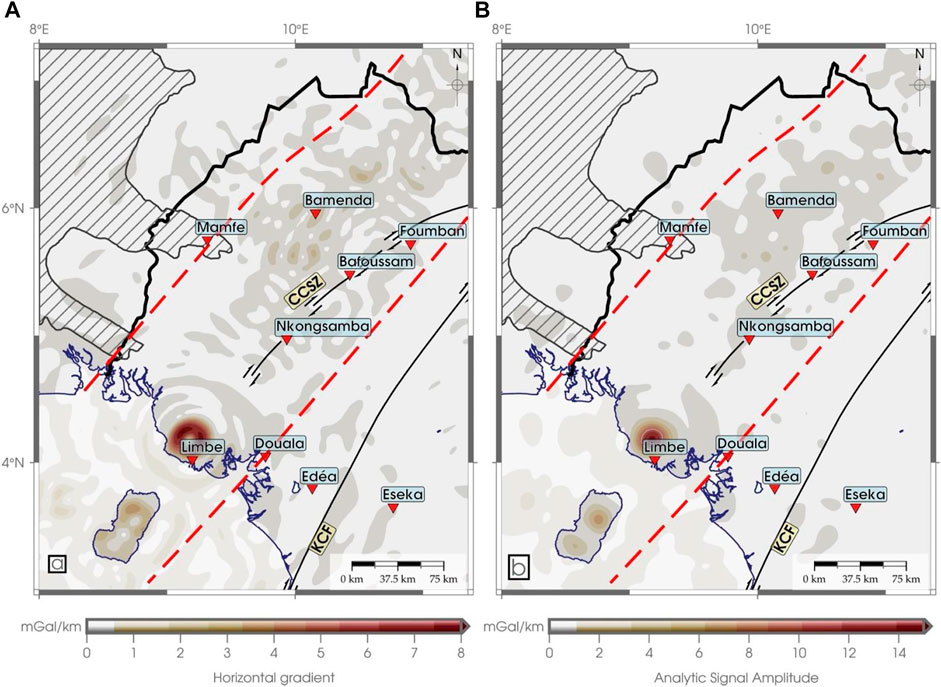
FIGURE 7. (A) Horizontal gradient and (B) analytical signal amplitude of the Bouguer residual map (black lines represent national boundaries).
5.5 Filters based on the ratio of gradients
The TDR and HG_TDR maps of the residual data are shown in Figures 8A, B, respectively. On the TDR map, the observed positive anomalies well-corroborate the information of the geological map distinguished by the Eocene, Miopleocene, and Paleo-Neogene age sand covers that cover the Douala and Rio Del Rey sedimentary basins. Pham (2020) showed that the TDR filter is useful for enhancing information on discordant signals. However, it is not an ideal filter for edge detection because it does not provide sharpened responses at the source edges. The HG_TDR map represents the same anomalies observed on the TDR map but in the form of geological contacts existing below them. The EHGA map (Figure 8C) isolates edges better than TDR and HGTDR since it can extract the edges of both shallow and deep structures.
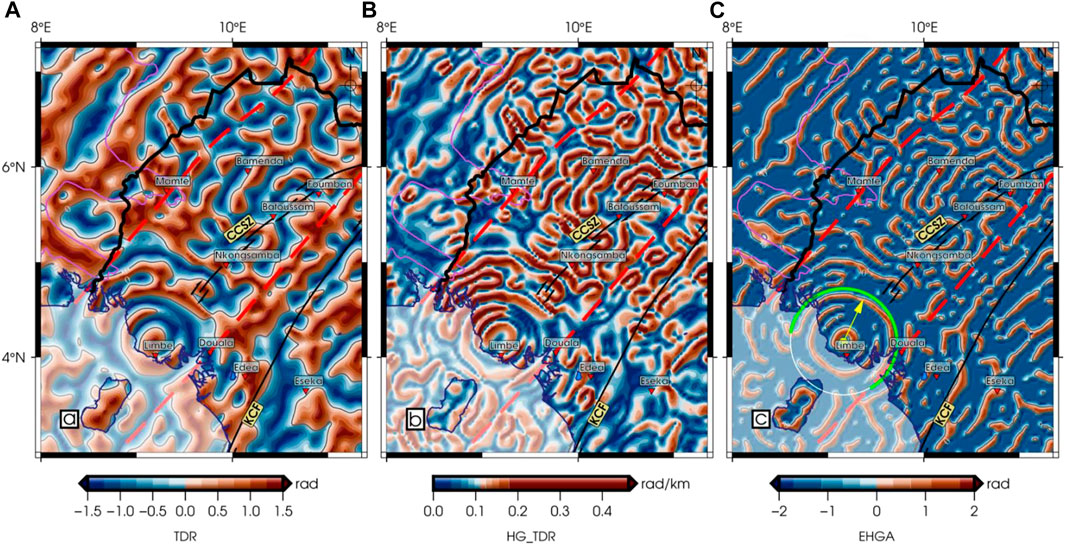
FIGURE 8. (A) Tilt derivative (TDR); (B) the horizontal gradient of the tilt derivative (HG_TDR); and (C) the enhanced horizontal gradient amplitude (EHGA) of the Bouguer residual map (black lines represent national boundaries). In green: the Fako and Tiko faults meet in a ring formation constituting the continental junction, spreading out to the Bakassi Peninsula and the Douala outlet. The yellow arrow denotes the average of the green arc.
5.6 Determination of geological contacts using the multi-scale horizontal derivative of the vertical derivative method
The detailed methodology used to apply this method has been elaborated in Section 4. In order to reveal the geological contacts between the depths of 1–5 km, first, the first-order Z-vertical derivative was calculated on the residual map and extended successively to depths of 1, 2, 3, 4, and 5 km. Second, we calculated the horizontal gradient amplitudes of these vertical derivatives and used the improved maximum detection method (Pham et al., 2020c) to determine the source edges (Figure 9). It is noticed that there is a great similarity between the maps in Figure 9 and those in Figure 8. The rose diagram of EHGA and MSHDVD lineaments represented in Figure 10 shows the distribution and orientations of the main faults identified in Southwestern Cameroon. As can be seen, most of the geological boundaries identified in the area are trending in the NE–SW, NNE–SSW, ENE–WSW, N–S, and NW–SE directions. Based on the information from the geological map, these maps will be analyzed to propose a tectono-structural map of the southwest part of Cameroon as shown in Figure 11. This map (Figure 11) highlights the main structures highlighted by the results of previous studies and corroborates the information provided by the geological map.
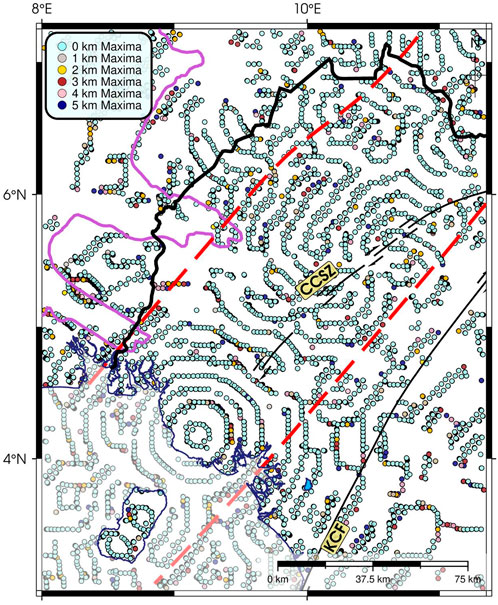
FIGURE 9. Source edges of the study area obtained by using the MSHDVD method.
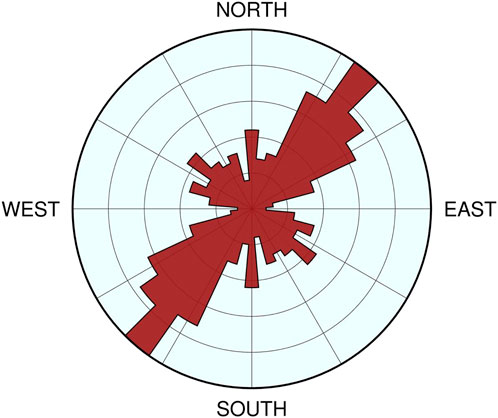
FIGURE 10. Rose diagram that shows the fault orientations within Southern Cameroon.
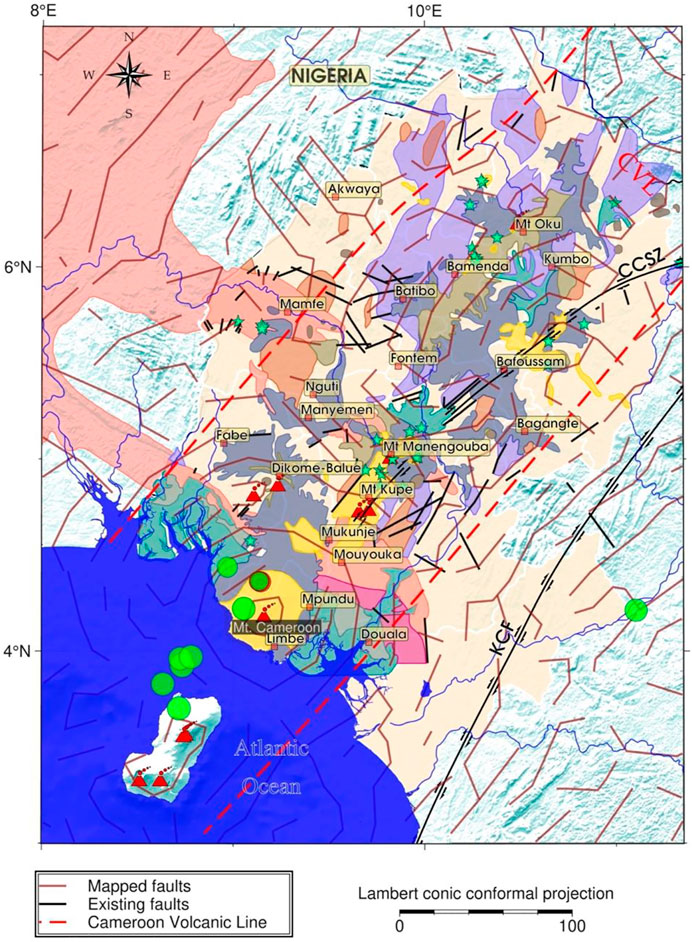
FIGURE 11. Representation of new faults compared to the existing ones. Legend and abbreviations as shown in Figure 2.
6 Discussion
The Bouguer anomaly map (Figure 3) highlights a large positive anomaly at the coast and a large negative anomaly at the northeast region of the study area. This positive anomaly would have originated from the extension of the oceanic crust at the level of the coast set up during the opening of the Atlantic Ocean in the Cretaceous and corroborates the results of Guiraud and Maurin (1992), Torsvik et al. (2009), and Lawrence et al. (2017). The negative anomaly observed indicates the presence of isostatic compensation as presented by Balogun (2019) and would be an accumulation of syn-tectonic granite. Moreover, we can observe an accumulation of low-intensity positive gravity anomalies covering the upper cretaceous sandstone of the Mamfe Basin. Thus, these observations are consistent with the existing geological and tectonic information in the study area.
The regional map (Figure 5A) highlights all the regional effects that interfere with the gravity signal. It is similar to the Bouguer anomaly map but is smoother than this one. Its resemblance rate to the Bouguer anomaly map justifies the chosen separation method and validates the height of 20 km for upward continuation. The residual map (Figure 5B) represents the anomaly map after removing the regional anomaly from the Bouguer anomaly. It presents the distribution of the different anomalies of the region more precisely. The positive anomalies observed are all oriented along the mean structural direction of N75° E, which is the major structural direction of the CVL (Tokam et al., 2010; Nzeuga et al., 2017), and this anomaly would be due to a melting point in the form of a “Y” below the crust (Fitton, 1980). The negative gravimetric anomalies observed in the northeast and southeast of the region would represent old syn-tectonic granitic rocks to which are added felsic gneisses and meta-sediments which constitute the crystalline basement (Toteu et al., 2004; Nzenti et al., 2006; Reusch et al., 2010; Anderson et al., 2014). According to Jacobsen (1987) and Kebede et al. (2020), when the gravity field is upward continued to a height z, it maps the sources located at and below the depth z/2. Since the Bouguer anomalies continuing upward to 20 km represent the regional field and were subtracted from the Bouguer anomaly map to obtain the corresponding residual, our results are related to the sources located at and above 10 km.
The first-order derivative maps (Figure 6) enhance the geological information contained in the residual map. The Z-derivative shows some positive anomalies that were not visible on the residual map east of the region. The HG and AS maps (Figure 7) isolated the different sources that were arranged as a block and placed the gravity anomalies directly above their sources. Since the THG and AS use the derivative amplitude to outline the edges, they cannot balance anomalies from shallow and deep structures. In other words, these methods cannot determine geological boundaries located at different depths at the same time. Both methods are dominated by large-amplitude responses from the shallow structures. In addition, for thin or deep sources, the peaks of the AS are shifted inward from the edges, making the structural bodies seem smaller than they are, as reported by Pham et al. (2020a), Pham et al. (2020b).
The TDR map (Figure 8A) highlights the different gravimetric domains, while the HGTDR map (Figure 8B) highlights the different contacts that delimit these different domains. It should be noted that the contacts obtained from the TDR and HGTDR are connected, complicating the geological interpretation (Eldosouky et al., 2022e). The EHGA filter is effective in highlighting a wide range of density structures in southwestern Cameroon. Since the EHGA is based on the ratio of derivatives of the horizontal gradient, it can balance anomalies from different structures. Thus, the use of this method brings clearer images for all the edges of both the shallow and deep sources. In other words, the EHGA can outline the geological boundaries located at different depths at the same time. In addition, the EHGA map can avoid bringing false information in the edge maps, as reported by Pham et al. (2020a) and Ghomsi et al. (2020). Thus, we believe that the edges in the EHGA map are suitable for highlighting geological contacts as faults.
The source edges determined by the MSHDVD method represented in Figure 9 highlight most of the contacts shown on the EHGA map. The presence of a wide range of structures in the MSHDVD map is also verified by the results of the EHGA. So, we can observe in Figure 9 that these contacts bound the anomalies. Thus, contacts that form closed contours delineate intrusions, while those that are linear determine the presence of structures like faults. The combined analysis of the maps in Figures 8, 9 highlights the geological structures in this region. We also compared the density structures determined in Figures 8, 9 to the geological structures in Figure 2 (Figure 11). The present study is the first of its kind to accurately determine the circular margin of the continental and oceanic extensions of Mount Cameroon, while perfectly illustrating the Bao, Bomana, Tiko, and Ekona faults, as well as highlighting the strike–slip faults at the top as simulated by Mathieu et al. (2011) and Kervyn et al. (2014). We can see that our results not only highlighted some structures that already existed according to the observations of the geological map but also highlighted new faults.
7 Conclusion
In this study, we separated the regional/residual anomalies from the Bouguer anomaly data to obtain the best map of residual anomalies for the southwestern part of Cameroon. Then, we applied filters such as the HG, AS, TDR, HGTDR gradient, and EHGA to the residual anomaly data to highlight the geological source edges. Finally, we used the MSHDVD method to highlight the same contacts. The main results of this work show with precision the region’s major lineaments, which in turn made it possible to highlight the CVL, intrusions of rocks of low densities known as syn to late tectonic granitoid, and faults of various directions. These results are comparable to those of the existing one and corroborate the information that the basement of the studied region would be made up of Precambrian volcanic rocks with a large concentration of basalt and gneiss. The observed geological structures show that the tectonic activity in this region is still ongoing. The current study is the first of its type to precisely define the circular boundary of Mount Cameroon’s continental and oceanic expansions, while also perfectly displaying the Bao, Bomana, Tiko, and Ekona faults and highlighting the strike–slip faults near the peak. However, it would be important to delineate the depths of the structures that form the CVL by quantitative analysis by inversion and/or by 2D or 3D modeling. Also, the use of remote sensing data will make it possible to highlight a structural map of the said region precisely.
Data availability statement
The raw data supporting the conclusion of this article will be made available by the authors, without undue reservation.
Author contributions
ARN contributed to writing, scientific development and early computations of this study. FEKG contributed to writing, result interpretation, scientific development, review, data curation and figure preparation. LTP contributed to writing, result interpretation, scientific development, review and performed the computations. AME contributed to writing, result interpretation, review and scientific development. ZA, JDK, ABKF, and RN contributed to writing and scientific development. KA, MSF, and PA reviewed, provided critical feedback and helped shape the research.
Funding
This research was supported by Researchers Supporting Project number (RSP-2021/249), King Saud University, Riyadh, Saudi Arabia.
Conflict of interest
The authors declare that the research was conducted in the absence of any commercial or financial relationships that could be construed as a potential conflict of interest.
Publisher’s note
All claims expressed in this article are solely those of the authors and do not necessarily represent those of their affiliated organizations, or those of the publisher, the editors, and the reviewers. Any product that may be evaluated in this article, or claim that may be made by its manufacturer, is not guaranteed or endorsed by the publisher.
References
Amante, C., and Eakins, B. W. (2009). ETOPO1 1 arc-minute global relief model: procedures, data sources and analysis. NOAA, Tech. Memo. NESDIS, NGDC 24, 19. doi:10.1594/PANGAEA.769615
Anderson, K. F., Wall, F., Rollinson, G. K., and Moon, C. J. (2014). Quantitative mineralogical and chemical assessment of the Nkout iron ore deposit, Southern Cameroon. Ore Geol. Rev. 62, 25–39. doi:10.1016/j.oregeorev.2014.02.015
Aslanian, D., and Moulin, M. (2010). Comment on ‘A new scheme for the opening of the south Atlantic Ocean and the dissection of an aptian salt basin’ by trond H. Torsvik, sonia rousse, cinthia labails and mark A. Smethurst. Geophys. J. Int. 183, 20–28. doi:10.1111/j.1365-246x.2010.04727.x
Balogun, O. B. (2019). Preliminary interpretation of isostatic residual gravity anomalies within the central portion of the Equatorial Atlantic African region. SN Appl. Sci. 1 (5), 495. doi:10.1007/s42452-019-0440-5
Beckline, M., Yujun, S., Etongo, D., Saeed, S., and Mannan, A. (2018). Assessing the drivers of land use change in the Rumpi hills forest protected area, Cameroon. J. Sustain. For. 37, 592–618. doi:10.1080/10549811.2018.1449121
Blakely, R. J., and Simpson, R. W. (1986). Approximating edges of source bodies from magnetic or gravity anomalies. Geophysics 51, 1494–1498. doi:10.1190/1.1442197
Cordell, L., and Grauch, V. J. S. (1985). “16. mapping basement magnetization zones from aeromagnetic data in the san juan basin, New Mexico,” in The utility of regional gravity and magnetic anomaly maps (Texas: Society of Exploration Geophysicists), 181–197. doi:10.1190/1.0931830346.ch16
Cordell, L. (1979). “Gravimetric expression of graben faulting in santa fe country and the espanola basin: New Mexico geological society guidebook,” in 30th Field Conference, New Mexico, Jan 1 1979, 59–64.
Deruelle, B., Ngounouno, I., and Demaiffe, D. (2007). The Cameroon hot line (CHL): a unique example of active alkaline intraplate structure in both oceanic and continental lithospheres. Comptes Rendus Geosci. 339, 589–600. doi:10.1016/j.crte.2007.07.007
Dung, T. T., and Minh, N, Q. (2017). Eruptive-volcanic-basalt structures in the Truong Sa-Spratly Islands and adjacent areas from interpreting gravity and magnetic data. Vietnam J. Earth Sci. 39 (1), 1–13. doi:10.15625/0866-7187/39/1/9167
Duong, T. N., Phong, L. H., Pham, D. N., Chen, C. H., and Dinh, V. T. (2021). Relationship between seismicity and active faults in Thanh Hoa province detected by local seismic network. Vietnam J. Earth Sci. 43 (2), 199–219. doi:10.15625/0866-7187/15931
Eldosouky, A. M., Pham, L. T., El-Qassas, R. A. Y., Hamimi, Z., and Oksum, E. (2021a). “Lithospheric structure of the arabian–nubian shield using satellite potential field data,” in The geology of the arabian-nubian shield. Regional geology reviews. Editors Z. Hamimi, A. R. Fowler, J. P. Liégeois, A. Collins, M. G. Abdelsalam, and M. Abd EI-Wahed (Cham: Springer). doi:10.1007/978-3-030-72995-0_6
Eldosouky, A. M., El-Qassas, R. A. Y., Pour, A. B., Mohamed, H., and Sekandari, M. (2021b). Integration of ASTER satellite imagery and 3D inversion of aeromagnetic data for deep mineral exploration. Adv. Space Res. 68 (9), 3641–3662. doi:10.1016/j.asr.2021.07.016
Eldosouky, A. M., El-Qassas, R. A. Y., Pham, L. T., Abdelrahman, K., Alhumimidi, M. S., El Bahrawy, A., et al. (2022a). Mapping main structures and related mineralization of the arabian shield (Saudi Arabia) using sharp edge detector of transformed gravity data. Minerals 12, 71. doi:10.3390/min12010071
Eldosouky, A. M., Ekwok, S. E., Akpan, A. E., Achadu, O. I. M., Pham, L. T., Abdelrahman, K., et al. (2022b). Delineation of structural lineaments of Southeast Nigeria using high resolution aeromagnetic data. Open Geosci. 14 (1), 331–340. doi:10.1515/geo-2022-0360
Eldosouky, A. M., Pham, L. T., Abdelrahman, K., Fnais, M. S., and Gomez-Ortiz, D. (2022c). Mapping structural features of the Wadi Umm Dulfah area using aeromagnetic data. J. King Saud Univ. - Sci. 34 (2), 101803–103647. doi:10.1016/j.jksus.2021.101803
Eldosouky, A. M., Pham, L. T., and Henaish, A. (2022d). High precision structural mapping using edge filters of potential field and remote sensing data: A case study from wadi umm ghalqa area, south eastern desert, Egypt. Egypt. J. Remote Sens. Space Sci. 25 (2), 501–513. doi:10.1016/j.ejrs.2022.03.001
Eldosouky, A. M., Pham, L. T., Duong, V. H., Ghomsi, F. E. K., and Henaish, A. (2022e). Structural interpretation of potential field data using the enhancement techniques: a case study. Geocarto Int., 1–26. doi:10.1080/10106049.2022.2120548
Fedi, M., and Florio, G. (2001). Detection of potential fields source boundaries by enhanced horizontal derivative method. Geophys. Prospect. 49, 40–58. doi:10.1046/j.1365-2478.2001.00235.x
Fitton, J. G., and Dunlop, H. M. (1985). The Cameroon line, West Africa, and its bearing on the origin of oceanic and continental alkali basalt. Earth Planet. Sci. Lett. 72, 23–38. doi:10.1016/0012-821X(85)90114-1
Fitton, J. G., Kilburn, C. R. J., Thirlwall, M. F., and Hughes, D. J. (1983). 1982 eruption of mount Cameroon, west Africa. Nature 306, 327–332. doi:10.1038/306327a0
Fitton, J. (1980). The Benue trough and Cameroon line — a migrating rift system in west Africa. Earth Planet. Sci. Lett. 51 (1), 132–138. doi:10.1016/0012-821x(80)90261-7
Fitton, J. G. (1987). “The Cameroon line, west Africa: A comparison between oceanic and continental alkaline volcanism,” in Alkaline igneous rocks, 30. Editors J. G. Fitton, and B. G. J. Upton (London: Geological Society London Special Publications), 273–291. doi:10.1144/GSL.SP.1987
Fosso-Téguia, E. M. E., Nana, V. G., Alain, L. T. S., Olivier, N. B. E., Albert, E. Y., Alain, Z. A., et al. (2020). Exploration of potential ore deposits along the Cameroon volcanic line from gravity and magnetic studies. Open J. Geol. 10, 1009–1026. doi:10.4236/ojg.2020.1010047
Geze, B. (1943). Géographie physique et géologie du Cameroun Occidental, 17. Mem. Mus. Natl. Hist. Nat. Paris, Nouv. Ser., 1–272.
Ghomsi, F. E. K., Sévérin, N., Mandal, A., Nyam, F. E. A., Tenzer, R., Kamga, A. P. T., et al. (2020). Cameroon’s crustal configuration from global gravity and topographic models and seismic data. J. Afr. Earth Sci. 161, 103657. doi:10.1016/j.jafrearsci.2019.103657
Ghomsi, F. E. K., Ribeiro-Filho, N., Baldez, R., Tenzer, R., Martins, C. M., Chisenga, C., et al. (2021). Identification of Cameroon’s geological structures through a gravity separation and using seismic crustal models. J. Afr. Earth Sci. 173, 104027. doi:10.1016/j.jafrearsci.2020.104027
Ghomsi, F. E. K., Domra, K. J., Aretouyap, Z., Ribeiro-Filho, N., Pham, L. T., Baldez, R., et al. (2022a). Main structural lineaments of the southern Cameroon volcanic line derived from aeromagnetic data. J. Afr. Earth Sci. 186, 104418. doi:10.1016/j.jafrearsci.2021.104418
Ghomsi, F. E. K., Tenzer, R., Njinju, E., and Steffen, R. (2022b). The crustal configuration of the West and Central African Rift System from gravity and seismic data analysis. Geophys. J. Int. 230 (2), 995–1012. doi:10.1093/gji/ggac089
Ghomsi, F. E. K., Pham, L. T., Tenzer, R., Esteban, F. D., Van Vu, T., and Kamguia, J. (2022c). Mapping of fracture zones and structural lineaments of the Gulf of Guinea passive margins using marine gravity data from CryoSat-2 and Jason-1 satellites. Geocarto Int., 1–24. doi:10.1080/10106049.2022.2040602
Ghomsi, F. E. K., Pham, L. T., Steffen, R., Ribeiro‐Filho, N., and Tenzer, R. (2022d). Delineating structural features of North Cameroon using the EIGEN6C4 high‐resolution global gravitational model. Geol. J, 1–15. doi:10.1002/gj.4544
Grauch, V. J. S., and Cordell, L. (1987). Limitations of determining density or magnetic boundaries from the horizontal gradient of gravity or pseudogravity data. Geophysics 52, 118–121. doi:10.1190/1.1442236
Guiraud, R., and Maurin, C. J. (1992). Early cretaceous rifts of western and central africa: an overview. Tectonophysics 213, 153–168. doi:10.1016/0040-1951(92)90256-6
Hang, N. T. T., Thanh, D. D., and Minh, L. H. (2017). Application of directional derivative method to determine boundary of magnetic sources by total magnetic anomalies. Vietnam J. Earth Sci. 39 (4), 360–375. doi:10.15625/0866-7187/39/4/10731
Hang, N. T. T., Oksum, E., Minh, L. H., and Thanh, D. D. (2019). An improved space domain algorithm for determining the 3-D structure of the magnetic basement. Vietnam J. Earth Sci. 41 (1), 69–80. doi:10.15625/0866-7187/41/1/13550
Jacobsen, B. H. (1987). A case for upward continuation as a standard separation filter for potential-field maps. Geophysics 52, 1138–1148. doi:10.1190/1.1442378
Kebede, H., Alemu, A., and Fisseha, S. (2020). Upward continuation and polynomial trend analysis as a gravity data decomposition, case study at Ziway-Shala basin, central Main Ethiopian rift. Heliyon 6 (1), e03292. doi:10.1016/j.heliyon.2020.e03292
Kervyn, M., Van Wyk De Vries, B., Walter, T. R., Njome, M. S., Suh, C. E., and Ernst, G. G. J. (2014). Directional flank spreading at Mount Cameroon volcano: Evidence from analogue modeling. J. Geophys. Res. Solid Earth 119 (10), 7542–7563. doi:10.1002/2014JB011330
Koumetio, F., Njomo, D., Tabod, C. T., Noutchogwe, T. C., and Manguelle-Dicoum, E. (2012). Structural interpretation of gravity anomalies from the kribi–edea zone, south Cameroon: a case study. J. Geophys. Eng. 9 (6), 664–673. doi:10.1088/1742-2132/9/6/664
Kvas, A., Brockmann, J. M., Krauss, S., Schubert, T., Gruber, T., Meyer, U., et al. (2021). GOCO06s–a satellite-only global gravity field model. Earth Syst. Sci. Data 13 (1), 99–118. doi:10.5194/essd-13-99-2021
Lawrence, S. R., Beach, A., Jackson, O., and Jackson, A. (2017). Deformation of oceanic crust in the eastern gulf of Guinea: role in the evolution of the Cameroon volcanic line and influence on the petroleum endowment of the douala-rio muni basin. Geol. Soc. Lond. Spec. Publ. 438 (1), 7–26. doi:10.1144/SP438.7
Lee, D. C., Halliday, A., Fitton, J. G., and Poli, G. (1994). Isotopic variations with distance and time in the volcanic islands of the Cameroon line: evidence for a mantle plume origin. Earth Planet. Sci. Lett. 123 (1–4), 119–138. doi:10.1016/0012-821x(94)90262-3
Long, H. V., Thanh, N. T., Tuan, V. T., Tung, N. T., Anh, N. L., Din, D. B., et al. (2021). Holocene sedimentation offshore Southeast Vietnam based on geophysical interpretation and sediment composition analysis. Vietnam J. Earth Sci. 43 (3), 336–379. doi:10.15625/2615-9783/16268
Mathieu, L., Kervyn, M., and Ernst, G. G. (2011). Field evidence for flank instability, basal spreading and volcano-tectonic interactions at Mt Cameroon, West Africa. Bull. Volcanol. 73 (7), 851–867. doi:10.1007/s00445-011-0458-z
Maurizot, P., Abessolo, A., Feybesse, J. L., Johan, V., and Lecomte, P. (1986). Etude et prospection minière du sudouest Cameroun. Synthèse des travaux de 1978 à 1985. Rapport: BRGM, 274.
Melouah, O., Eldosouky, A. M., and Ebong, W. D. (2021). Crustal architecture, heat transfer modes and geothermal energy potentials of the Algerian Triassic provinces. Geothermics 96, 102211. ISSN 0375-6505. doi:10.1016/j.geothermics.2021.102211
Meyers, J. B., Rosendahl, B. R., Harrison, C. G., and Ding, Z. D. (1998). Deep-imaging seismic and gravity results from the offshore Cameroon volcanic line, and speculation of african hotlines. Tectonophysics 284, 31–63. doi:10.1016/s0040-1951(97)00173-x
Miller, H. G., and Singh, V. (1994). Potential field tilt—a new concept for location of potential field sources. J. Appl. Geophy. 32, 213–217. doi:10.1016/0926-9851(94)90022-1
Minyem, D., and Nedelec, A. (1990). “Origin and evolution of the eseka gneisses (Cameroon). Archean TTG reworked in the panafrican mobile belt,” in Proceeding of the 15th Colloquium of African Geology Nancy, 21–24.
Moulin, M., Aslanian, D., and Unternehr, P. (2010). A new starting point for the south and equatorial atlantic ocean. Earth. Sci. Rev. 98, 1–37. doi:10.1016/j.earscirev.2009.08.001
Nabighian, M. N. (1972). The analytic signal of two-dimensional magnetic bodies with polygonal cross-section: its properties and use for automated anomaly interpretation. Geophysics 37, 507–517. doi:10.1190/1.1440276
Nabighian, M. N. (1984). Toward a three-dimensional automatic interpretation of potential field data via generalized hilbert transforms: fundamental relations. Geophysics 49, 780–786. doi:10.1190/1.1441706
Ndikum, E. N., Tabod, C. T., and Tokam, A. P. K. (2014). Frequency time analysis (FTAN) and moment tensor inversion solutions from short period surface waves in Cameroon (central africa). Open J. Geol. 4, 33–43. doi:10.4236/ojg.2014.42004
Ndikum, E. N., Tabod, C. T., Koumetio, F., Tatchum, N. C., and Victor, K. J. (2017). Evidence of some major structures underlying the Douala sedimentary sub-basin: West african coastal basin. J. Geoscience Environ. Prot. 5, 161–172. doi:10.4236/gep.2017.57013
Ngounouno, I., D´eruelle, B., and Demaiffe, D. (2000). Petrology of the bimodal cenozoic volcanism of the kapsiki plateau (northernmost Cameroon, central Africa). J. Volcanol. Geotherm. Res. 102, 21–44. doi:10.1016/s0377-0273(00)00180-3
Ngounouno, I., D´eruelle, B., Demaiffe, D., and Montigny, R. (2003). Petrology of the cenozoic volcanism in the upper benue valley, northern Cameroon (central Africa). Contrib. Mineral. Pet. 145, 87–106. doi:10.1007/s00410-002-0438-6
Nouayou, R. (2005). “Contribution à l’étude géophysique du bassin sédimentaire de Mamfé par prospections Audio et Hélio Magnétotelluriques,” Thèse de Doctorat d’Etat ès Sciences. (Cameroon: Université de Yaoundé I), 212.
Noutchogwe, T. C., Tabod, C. T., Koumetio, F., and Manguelle-Dicoum, E. (2011). A gravity model study for differentiating vertical and dipping geological contacts with application to a bouguer gravity anomaly over the foumban shear zone, Cameroon. Geophysica 47, 43–55.
Nsifa, E. N. (2005). “Magmatisme et évolution géodynamique de l’Archéen au Protérozoïque de la bordure nord-ouest du craton du Congo (complexe du Ntem) au Sud-Ouest Cameroun,” Thèse Doctorat d’Etat. (Yaounde: Université de Yaoundé I), 248.
Nzenti, J. P., Kapajika, B., Wörner, G., and Lubala, T. R. (2006). Synkinematic emplacement of granitoids in a Pan-African shear zone in Central Cameroon. J. Afr. Earth Sci. 45 (1), 74–86. doi:10.1016/j.jafrearsci.2006.01.005
Nzeuga, A. R., Nouayou, R., Enyegue-à-Nyam, F., and Fairhead, J. D. (2017). The use of aeromagnetic data interpretation to characterize the features in the mamfe sedimentary basin Cameroon and a part of the east of Nigeria. Int. J. Sci. Res. 6, 2319–7064. doi:10.21275/ART20177759
Nzeuga, A. R., Nyam, F. E., Nouayou, R., and Fairhead, J. D. (2019). Impact of the south atlantic opening on the origin and the tectonic of the mamfe, Douala and Rio Del Rey sedimentary basins, geodynamics implication. Open J. Earthq. Res. 8, 299–312. doi:10.4236/ojer.2019.84017
Oksum, E., Dolmaz, M. N., and Pham, L. T. (2019). Inverting gravity anomalies over the Burdur sedimentary basin, SW Turkey. Acta Geod. geophys. 54 (4), 445–460. doi:10.1007/s40328-019-00273-5
Oksum, E. (2021). Grav3CH_inv: a GUI-based MATLAB code for estimating the 3-D basement depth structure of sedimentary basins with vertical and horizontal density variation. Comput. Geosci. 155, 104856. doi:10.1016/j.cageo.2021.104856
Pail, R., Fecher, T., Barnes, D., Factor, J. F., Holmes, S. A., Gruber, T., et al. (2018). Short note: the experimental geopotential model XGM2016. J. Geod. 92 (4), 443–451. doi:10.1007/s00190-017-1070-6
Pham, L. T., Le, M. H., Oksum, E., and Do, T. D. (2018). Determination of maximum tilt angle from analytic signal amplitude of magnetic data by the curvature-based method. Vietnam J. Earth Sci. 40 (4), 354–366. doi:10.15625/0866-7187/40/4/13106
Pham, L. T., Do, T. D., Oksum, E., and Le, S. T. (2019). Estimation of Curie point depths in the Southern Vietnam continental shelf using magnetic data. Vietnam J Earth Sci 41 (3), 216–228. doi:10.15625/0866-7187/41/3/13830
Pham, L. T., Eldosouky, A. M., Oksum, E., and Saada, S. A. (2020a). A new high resolution filter for source edge detection of potential field data. Geocarto Int. 37, 3051–3068. doi:10.1080/10106049.2020.1849414
Pham, L. T., Vu, T. V., Le-Thi, S., and Trinh, P. T. (2020b). Enhancement of potential field source boundaries using an improved logistic filter. Pure Appl. Geophys. 177, 5237–5249. doi:10.1007/s00024-020-02542-9
Pham, L. T., Oksum, E., Vu, M. D., Vo, Q. T., Le-Viet, K. D., and Eldosouky, A. M. (2020c). An improved approach for detecting ridge locations to interpret the potential field data for more accurate structural mapping: A case study from vredefort dome area (South Africa). J. Afr. Earth Sci. 175, 104099. doi:10.1016/j.jafrearsci.2020.104099
Pham, L. T., Kafadar, O., Oksum, E., and Hoang-Minh, T. (2021). A comparative study on the peak detection methods used to interpret potential field data: A case study from vietnam. Geocarto Int. 37, 3679–3696. doi:10.1080/10106049.2021.2007297
Pham, L. T., Oksum, E., Kafadar, O., Trinh, P. T., Nguyen, D. V., Vo, Q. T., et al. (2022a). Determination of subsurface lineaments in the Hoang Sa islands using enhanced methods of gravity total horizontal gradient. Vietnam J. Earth Sci. 44 (3), 395–409. doi:10.15625/2615-9783/17013
Pham, L. T., Oliveira, S. P., Eldosouky, A. M., Abdelrahman, K., Fnais, M. S., Xayavong, V., et al. (2022b). Determination of structural lineaments of northeastern Laos using the LTHG and EHGA methods. J. King Saud Univ. – Sci. 34, 101825. doi:10.1016/j.jksus.2022.101825
Pham, L. T., Oksum, E., Eldosouky, A. M., Gomez-Ortiz, D., Abdelrahman, K., Altinoglu, F. F., et al. (2022c). Determining the Moho interface using a modified algorithm based on the combination of the spatial and frequency domain techniques: a case study from the arabian shield. Geocarto Int., 1–16. doi:10.1080/10106049.2022.2037733
Pham, L. T. (2020). A comparative study on different filters for enhancing potential field source boundaries: synthetic examples and a case study from the song hong trough (vietnam). Arab. J. Geosci. 13, 723. doi:10.1007/s12517-020-05737-5
Phillips, J. D. (2000). Locating magnetic contacts: A comparison of the horizontal gradient, analytic signal, and local wavenumber methods: Presented at the SEG technical program expanded abstracts 2000. Texas: Society of Exploration Geophysicists. doi:10.1190/1.1816078
Prasad, K. N. D., Pham, L. T., and Singh, A. P. (2022a). Structural mapping of potential field sources using BHG filter. Geocarto Int., 1–28. doi:10.1080/10106049.2022.2048903
Prasad, K. N. D., Pham, L. T., and Singh, A. P. (2022b2022). A novel filter “ImpTAHG” for edge detection and a case study from cambay rift basin, India. Pure Appl. Geophys. 179, 2351–2364. doi:10.1007/s00024-022-03059-z
Regnoult, T. M. (1986). Synthèse géologique du Cameroun. Ministère des Mines et de l’Energie. Yaoundé. Direction des Mines et de la Géologie, 119.
Reusch, A. M., Nyblade, A. A., Wiens, D. A., Shore, P. J., Ateba, B., Tabod, C., et al. (2010). Upper mantle structure beneath Cameroon from body wave tomography and the origin of the Cameroon Volcanic Line. Geochem. Geophys. Geosyst. 11, Q10W07. doi:10.1029/2010gc003200
Roest, W. R., Verhoef, J., and Pilkington, M. (1992). Magnetic interpretation using the 3-D analytic signal. Geophysics 57, 116–125. doi:10.1190/1.1443174
Schmidt, C., Laag, C., Whitehead, M., Profe, J., Aka, F. T., Hasegawa, T., et al. (2022). The complexities of assessing volcanic hazards along the Cameroon Volcanic Line using spatial distribution of monogenetic volcanoes. J. Volcanol. Geotherm. Res. 427, 107558. doi:10.1016/j.jvolgeores.2022.107558
Suh, C. E., Sparks, R. S. J., Fitton, J. G., Ayonghe, S. N., Annen, C., Nana, R., et al. (2003). The 1999 and 2000 eruptions of mount Cameroon: Eruption behaviour and petrochemistry of lava. Bull. Volcanol. 65, 267–281. doi:10.1007/s00445-002-0257-7
Suh, C. E., Luhr, J. F., and Njome, M. S. (2008). Olivine-hosted glass inclusions from scoriae erupted in 1954-2000 at mount Cameroon volcano, west Africa. J. Volcanol. Geotherm. Res. 169, 1–33. doi:10.1016/j.jvolgeores.2007.07.004
Tchameni, R., Mezger, K., Nsifa, N. E., and Pouclet, A. (2001). Crustal origin of early proterozoic syenites in the Congo craton (Ntem complex), south Cameroon. Lithos 57, 23–42. doi:10.1016/S0024-4937(00)00072-4
Tchameni, R. (1997). “Géochimie et Géochronologie des formations de l’Archéen et du Paléoprotérozoïque du SudCameroun (groupe du Ntem, craton du Congo),”. Thèse Doctorat Université d’Orléans, Orléans, 356.
Tchoukeu, C. D. N., Sobh, M., Basseka, C. A., Mouzong, M., Djomani, Y. P., and Etame, J. (2021). The mechanical behaviour of the lithosphere beneath the Chad Basin and the Bangui Magnetic Anomaly. Insights from Moho depth and effective elastic thickness estimates. J. Afr. Earth Sci. 182, 104299. doi:10.1016/j.jafrearsci.2021.104299
Tokam, K. A. P., Tabod, C. T., Nyblade, A. A., Julia, J., Wiens, D. A., and Pasyanos, M. (2010). Structure of the crust beneath Cameroon, West Africa, from the joint inversion of Rayleigh wave group velocities and receiver functions. Geophys. J. Int. 183, 1061–1076. doi:10.1111/j.1365-246x.2010.04776.x
Torsvik, T. H., Rousse, S., Labails, C., and Smethurst, M. A. (2009). A new scheme for the opening of the south atlantic ocean and the dissection of an aptian salt basin. Geophys. J. Int. 177, 1315–1333. doi:10.1111/j.1365-246x.2009.04137.x
Toteu, S. F., Penaye, J., and Poudjom-Djomani, Y. (2004). Geodynamic evolution of the panAfrican belt in central Africa with special reference to Cameroon. Can. J. Earth Sci. 41 (1), 73–85. doi:10.1139/e03-079
Ubangoh, R. U., Pacca, I. G., Nyobe, J. L., Hell, J., and Ateba, B. (2005). Petromagnetic characteristics of Cameroon Line volcanic rocks. J. Volcanol. Geotherm. Res. 142 (3–4), 225–241. doi:10.1016/j.jvolgeores.2004.11.006
Verduzco, B., Fairhead, J. D., Green, C. M., and MacKenzie, C. (2004). New insights into magnetic derivatives for structural mapping. Lead. Edge 23, 116–119. doi:10.1190/1.1651454
Wembenyui, E. W., Collerson, K. D., and Xin-Zhao, J. (2020). Evolution of Mount Cameroon volcanism: geochemistry, mineral chemistry and radiogenic isotopes (pb, sr, nd). Geosci. Front. 11, 2157–2168. doi:10.1016/j.gsf.2020.03.015
Yokoyama, T., Aka, F. T., Kusakabe, M., and Nakamura, E. (2007). Plume-Lithosphere interaction beneath Mt. Cameroon volcano, west Africa: Constraints from 238U-230Th-226Ra and Sr-Nd-Pb isotope systematics. Geochimica Cosmochimica Acta 71, 1835–1854. doi:10.1016/j.gca.2007.01.010
Zeng, H., Xu, D., and Tan, H. (2007). A model study for estimating optimum upward-continuation height for gravity separation with application to a Bouguer gravity anomaly over a mineral deposit, Jilin province, northeast China. Geophysics 72 (4), I45–I50. doi:10.1190/1.2719497
Keywords: gravity, potential field data, edge detection, structural mapping, southwestern Cameroon
Citation: Nzeuga AR, Ghomsi FE, Pham LT, Eldosouky AM, Aretouyap Z, Kana JD, Yasmine ZT, Fokem ABK, Nouayou R, Abdelrahman K, Fnais MS and Andráš P (2022) Contribution of advanced edge-detection methods of potential field data in the tectono-structural study of the southwestern part of Cameroon. Front. Earth Sci. 10:970614. doi: 10.3389/feart.2022.970614
Received: 16 June 2022; Accepted: 23 September 2022;
Published: 11 October 2022.
Edited by:
Mourad Bezzeghoud, Universidade de Évora, PortugalReviewed by:
Yves Shandini, University of Douala, CameroonZhaohai Meng, Tianjin Navigation Instrument Research Institute, China
Copyright © 2022 Nzeuga, Ghomsi, Pham, Eldosouky, Aretouyap, Kana, Yasmine, Fokem, Nouayou, Abdelrahman, Fnais and Andráš. This is an open-access article distributed under the terms of the Creative Commons Attribution License (CC BY). The use, distribution or reproduction in other forums is permitted, provided the original author(s) and the copyright owner(s) are credited and that the original publication in this journal is cited, in accordance with accepted academic practice. No use, distribution or reproduction is permitted which does not comply with these terms.
*Correspondence: Franck Eitel Ghomsi, ZnJhbmNrZWl0ZWxAZ21haWwuY29t; Ahmed M. Eldosouky, ZHJfYS5lbGRvc29reUB5YWhvby5jb20=; Alain Rodrigue Nzeuga, YWxhaW56ZXVnYUB5YWhvby5mcg==; Luan Thanh Pham, bHVhbnB0QGh1cy5lZHUudm4=