
95% of researchers rate our articles as excellent or good
Learn more about the work of our research integrity team to safeguard the quality of each article we publish.
Find out more
ORIGINAL RESEARCH article
Front. Earth Sci. , 27 September 2022
Sec. Geohazards and Georisks
Volume 10 - 2022 | https://doi.org/10.3389/feart.2022.970550
This article is part of the Research Topic Rock Avalanche, Landslide and Debris Flow Hazards in Mountainous Areas View all 15 articles
 Xin Qu1*
 Fangfang Diao2
The failure mechanism of hard anti-inclined bedded rock slopes with the possibility of undergoing flexural toppling is very complex so that it is difficult to effectively perform their stability assessment. In this study, an attempt was made to accurately predict the stability factor and the failure surface of such slopes: establishing a new failure zone model and developing a limit equilibrium method based on this model. In this model, the failure zones of such a slope were divided strictly according to the failure mechanisms of the rock layers. In the presented method, the failure surface was considered to be a bilinear-type surface as observed in field investigations and laboratory tests, and the non-dimensional parameter indicating the position of application of the interlayer force was revised by deriving the distribution and the equivalent substitution of interlayer force. Then, a comparative study on Yangtai slope was performed to prove the presented method, and the effect of the non-dimensional parameter on the stability was also investigated. The results reveal that the presented method can accurately determine the failure surface and precisely evaluate the slope stability factor. In addition, the presented method has higher predictive accuracy compared with other analytical methods. With the decrease of the non-dimensional parameter, the stability of the slope is reinforced, but the larger landslide with more serious damage effect will occur if the slope undergoes the overall failure.
Toppling, being as a primary failure mode of anti-inclined bedded rock slopes, widely exists in natural and engineering slopes (Chen et al., 2020; Franziska et al., 2019; Gu and Huang, 2016). This failure can be generally divided into three kinds, i.e., flexural toppling, blocky toppling and block-flexure toppling (Goodman and Bray, 1976). If an anti-inclined bedded rock slope involves a dominant parallel joint set dipping steeply into the slope face, the majority of the rock layers are likely to bend toward open space under self-weight or external force. This phenomenon that usually occurs in the slopes composed of slates, phyllites and schists (Radko, 1995), is called flexural toppling (see Figure 1A). If such a slope contains another set of approximately orthogonal joints, most of the rock layers are considered to rotate about a fixed point at or near the base under self-weight or external forces (see Figure 1B). This phenomenon that occurs mostly in the slopes composed of thick-bedded sandstone or limestone, as well as in columnar jointed volcanic (Radko, 1995), is called blocky toppling. The difference between the above two failure modes judged from geology is different discontinuities developed in rock masses, while the difference judged from mechanism lies in whether the rock column has bending or tensile resistance. In natural anti-inclined bedded rock slopes, some rock layers have a potential of undergoing blocky toppling while the others may undergo flexural toppling (see Figure 1C). This failure is generally called block-flexure toppling. Typical slopes subjected to block-flexure toppling are composed of bedded chert and shale, bedded sandstone and shale, and thin-bedded limestone (Radko, 1995). As the mechanism of blocky toppling failure is relatively simple, scholars have found numerous significant investigations and established the correspondingly theoretical analysis methods (Liu et al., 2008; Alejano et al., 2019; Recep and Ulamiş, 2020; Sarfaraz, 2021). On the contrary, flexural toppling failure is more complicated as the failure surfaces are often diverse and complex (Zhao et al., 2020; Ning et al., 2021). Fortunately, the existing advanced technologies (optical remote sensing, InSAR, LiDAR, etc.) enable people to accurately identify the geological structure of anti-inclined bedded rock slopes (Cai et al., 2022; Liu et al., 2022; Zhou et al., 2022). Combined with some advanced methods (the intelligence algorithm, LEM, UDEC, DDA, etc.), researchers have found many valuable investigations on this failure mechanism (Fan, 2015; Zheng et al., 2020; Zheng et al., 2021a; Zheng et al., 2021b; Liu et al., 2021; Su et al., 2021) as well.
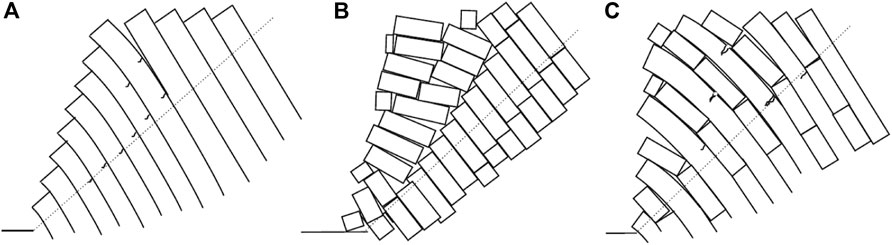
FIGURE 1. Anti-inclined bedded rock slopes: (A) flexural-toppling; (B) blocky-toppling; (C) block-flexure-toppling.
According to field investigations, experimental studies, theoretical analyses and numerical simulations (Aydan and Kawamoto, 1992; Adhikary et al., 1997; Zuo et al., 2005; Adhikary and Dyskin, 2007; Lu et al., 2012; Cai et al., 2014; Zheng et al., 2015; Su et al., 2017; Zheng et al., 2018a; Zheng et al., 2018b; Lian et al., 2018; Qu and Diao, 2020), after the anti-inclined bedded rock slopes underwent flexural toppling failure, their failure surfaces can be classified into two primary types: linear-type plane and bilinear-type surface (see Figure 2). A linear-type failure plane is generally present in soft anti-inclined bedded rock slopes. This kind of failure plane across the toe of a slope was first proposed by Aydan and Kawamoto (Aydan and Kawamoto, 1992) performing base friction tests, and they discovered that this failure plane was perpendicular to the joints. After that, scholars perfected and improved Aydan and Kawamoto’s investigation, which can be summarized as: repositioning the failure planes and establishing other methods. For example, Adhikary et al. (Adhikary et al., 1997) and Adhikary and Dyshin (Adhikary and Dyskin, 2007) found that the failure plane was a linear-type plane with an orientation of 10° above the plane perpendicular to the joints through centrifuge tests. Zheng et al. (Zheng et al., 2015; Zheng et al., 2018a) concluded that the angle between the plane perpendicular to the joints and the potential failure plane was about 13°. The above conclusions are suitable for specific cases, while further verification is required for other cases. The methods for searching the linear-type plane are mainly based on the limit equilibrium principle or discontinuous media theory. Among them, representative methods are the minimum stability factor method (Su et al., 2017), optimal limit equilibrium methods (Zheng et al., 2015; Qu and Diao, 2020), UDEC Trigon approach (Zheng et al., 2018a) and distinct lattice spring model (Lian et al., 2018). According to the relevant literatures (Zheng et al., 2015; Su et al., 2017; Zheng et al., 2018a; Lian et al., 2018; Qu and Diao, 2020), these methods can accurately determine the linear-type failure plane.
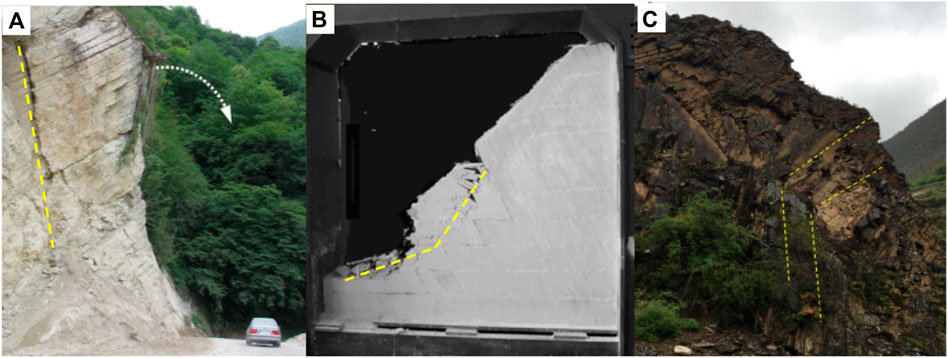
FIGURE 2. Flexural-toppling failures observed in field investigations and laboratory tests: (A) Galandrood mine slope; (B) the model slope; (C) Bank slope of Zhala Hydropower Station.
A bilinear-type failure surface is often present in hard anti-inclined bedded rock slopes. This kind of failure surface was first found by Zuo (Zuo et al., 2005) through several groups of physical model tests. Thereafter, the shape and position of the bilinear-type failure surface were refined by many scholars. For example, Lu et al. (Lu et al., 2012) considered that the bilinear-type surface was a combination of the plane obtained by Adhikary et al. (Adhikary et al., 1997) and the fracture surface induced by self-weight. Cai et al. (Cai et al., 2014) believed that the total failure surface is formed by the fracture depth of each rock layer derived through a “reference surface” theory. Zheng et al. (Zheng et al., 2018b; Zheng et al., 2020; Zheng et al., 2021a) and Liu et al. (Liu et al., 2021) concluded that the failure plane of superimposed rock layers was a plane perpendicular to the joints, and the failure surface of cantilevered rock layers was multi-planar. Su et al. (Su et al., 2021) took cross joints into account and found that the bilinear-type failure surface was composed of three parts: the shear sliding failure surface at an angle above the plane perpendicular to the joints, the flexural toppling failure surface of superimposed rock layers parallel to the plane perpendicular to the joints, and the fracture failure surface of cantilevered rock layers parallel to the plane perpendicular to the joints. The above studies, mainly based on the limit equilibrium theory, further improve the basic theory of bilinear-type surfaces. However, there are still some issues needed to be resolved. When we employ the limit equilibrium method to assess the slope stability, the non-dimensional parameter indicating the position of application of the interlayer force should not be considered as a constant, but should be a variable varying with the distributions of interlayer forces. Furthermore, the bilinear-type failure surfaces obtained with current analytical methods are in disagreement with those observed in field investigations and physical experiments. Last but not the least, the stability factors of such slopes are not accurately evaluated.
To address these problems, the distribution and the equivalent substitution of the interlayer force were derived through the static equilibrium condition. Moreover, a new calculation formula was established to revise the non-dimensional parameter indicating the position of application of the interlayer force. Then, based on a new failure zone model, a limit equilibrium method was established to determine the bilinear-type failure surfaces and evaluate stability factors of hard anti-inclined bedded rock slopes with the possibility of undergoing flexural toppling. Finally, comparisons with other studies were performed to verify the solutions’ validity and accuracy by taking Yangtai slope, and the effect of the non-dimensional parameter was also investigated.
At the initial stage of the deformation evolvement of hard anti-inclined bedded rock slopes, the overlying rock layers undergo the flexural toppling deformation while the underlying rock layers at the toe of the slope are fiercely squeezed due to the little deformation space. Then, the toppling deformation of the overlying rock layers progressively enlarges, and the stress concentration of the underlying rock layers rapidly increases. The rock layers with a small slenderness ratio are more likely to undergo shear sliding failure, although most rock layers have a potential of undergoing flexural toppling failure (Cai et al., 2014; Zheng et al., 2018b; Zheng et al., 2020; Zheng et al., 2021a; Liu et al., 2021; Su et al., 2021). Once the shear stress reaches the shear strength of the rock layers, the shear sliding failure starts at the toe of a slope and the cracks progresses backwards. After the rock layers susceptible to either shear sliding failure or flexural toppling failure separate from their overlying rock layers, secondary toppling failure occurs under self-weight. However, several rock layers on the top of the slope will be stable if their tensile stresses yield to the tensile strength of the rock layer.
From the above analysis, the slope can be classified into four zones: shear sliding zone, flexural toppling zone, secondary toppling zone and stable zone. The shear sliding zone is composed of all rock layers with the possibility of undergoing shear sliding failure. The flexural toppling zone is composed of all rock layers with the possibility of undergoing flexural toppling failure under self-weight and interlayer forces, and these rock layers are considered to be superimposed cantilever beams. The secondary toppling zone is composed of all rock layers with the possibility of undergoing secondary toppling failure under self-weight, and these rock layers are considered to be independent cantilever beams.
The latest results on the failure surface obtained by Ding et al. (Ding et al., 2021) performing the physical model tests and several assumptions adopted in the previous studies (Zheng et al., 2018b; Su et al., 2021) are also valid in presented framework.
(1) In the shear sliding and flexural toppling zones, a linear-type plane at an angle above the plane perpendicular to the joints is considered to be the total failure surface (see Figure 3) (Ding et al., 2021).
(2) In the secondary toppling zone, for each rock layer, a linear-type failure plane parallel to the plane perpendicular to the joints is supposed to be the failure surface, which was supported by Su et al. (Su et al., 2021) and Zheng et al. (Zheng et al., 2018b).
(3) In each rock layer, a cross joint is supposed to develop on the upslope side of the failure surface, which was supported by Su et al. (Su et al., 2021).
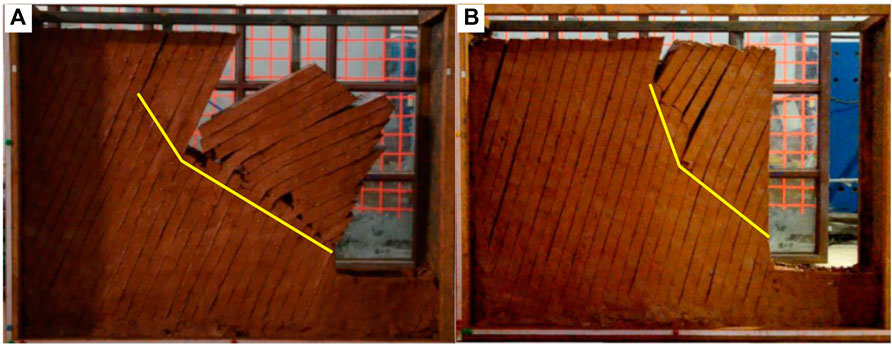
FIGURE 3. Failure surfaces of different models obtained by Ding et al. (Ding et al., 2021): (A) β=85, η=65; (B) β=85, η=75. Note: β is the inclination of the slope face, η is the inclination of the rock layer.
Consequently, a new failure zone model of such slopes was established as shown in Figure 4, where α is the inclination of the plane perpendicular to the joints, β is the inclination of the slope face, β0 is the angle between the plane perpendicular to the joints and the slope face, η is the inclination of the rock layer, θ0 is the natural slope angle, θ is the inclination of the potential failure surface, θj is the angle between the plane perpendicular to the joints and the potential failure surface, bi is the thickness of rock layer i, H is the slope height, hi is the height of the right side of rock layer i, and ‾hi is the equivalent height of rock layer i. hi-1 is the height of the right side of rock layer i-1, which is also equal to the height of the left side of rock layer i. The cross joints are represented by the yellow lines in Figure 4. The rock layers are numbered from the toe to the top. According to geometrical conditions, we can obtain Eq. 1.
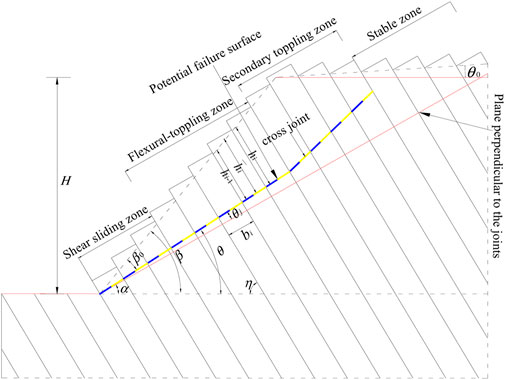
FIGURE 4. Failure zone model of a hard anti-inclined bedded rock slope.
When we employ the limit equilibrium method to assess the stability of anti-inclined bedded rock slopes subjected to flexural toppling, the interlayer forces exerting on the left side and the right side of the rock layers are considered to be acting on two points, χihi and χi-1hi-1, respectively, where χi is the non-dimensional parameter indicating the position of application of the interlayer force. Most researchers considered that χi was a constant and they obtained different values about χi. Aydan and Kawamoto (Aydan and Kawamoto, 1992) suggested that χi was equal to 0.5 as they found that the total side forces were more likely to be acting on the midpoint of the side through their base friction tests. Zheng et al. (Zheng et al., 2018a) verified this conclusion by using a new UDEC Trigon approach. Adhikary et al. (Adhikary et al., 1997) recommended that χi was 0.6 according to the centrifuge collapse data. Zheng at al. (Zheng et al., 2015), Qu and Diao (Qu and Diao, 2020) and Su et al. (Su et al., 2021) testified Adhikary’s investigation from the perspective of theoretical analysis. However, the distributions of the interlayer forces are different. The non-dimensional parameter χi is not a constant, but varies with the distributions of interlayer forces. Based on the principle of static equivalent substitution, the non-dimensional parameter χi can be derived through the following analysis.
Figure 5A shows the mechanical model of an anti-inclined bedded half space infinite slope. The vertical load exerting on the top of rock layer i can be written as follows:
where γ is the unit self-weight, Li, indicating the distance from the top of rock layer i to the top of slope, can be calculated with Eq. 3.
where the first rock layer on the top of the slope is recorded as n_tp.
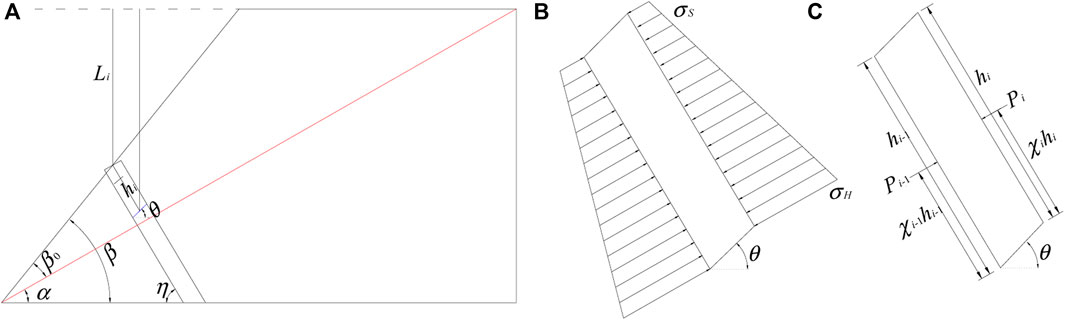
FIGURE 5. Anti-inclined bedded half space infinite slope: (A) mechanical model; (B) distribution of the interlayer force; (C) static equivalent substitution of the interlayer force.
The vertical unloading exerting on slope face can be derived through static equilibrium condition:
The lateral pressure exerting on the top of rock layer i can be calculated with Eq. 5.
where k is the lateral pressure coefficient.
The lateral pressure exerting on the base of rock layer i can be calculated with Eq. 6.
Figures 5B,C respectively display the distribution and the static equivalent substitution of the interlayer force. Then, the non-dimensional parameter χi can be calculated with Eq. 7.
From Eq. 7, it can be found that the value of χi is smaller than 0.5, and is greater than or equal to 1/3. Obviously, the previous studies have overestimated the value of χi.
Given the value of the searching angle θj through Eq. 8, the height of the right side of rock layer i, hi, and its equivalent height, ‾hi, can be respectively calculated with Eqs 10, 11.
where nm and △θr are the total number of searching times, and the size of the searching step, respectively. β1 = η+θ0.
For the last rock layer with the possibility of undergoing flexural toppling failure, as the forces exerting on it are only composed of the resistant force and self-weight, the equivalent height of this rock layer, ‾hi, must be larger than the critical height, h0. The critical height of a single rock layer prior to toppling failure under self-weight (see Figure 6), h0, can be calculated with Eq. 12.
where εi and σt are the continuous ratio and the tensile strength of rock layer i, respectively.
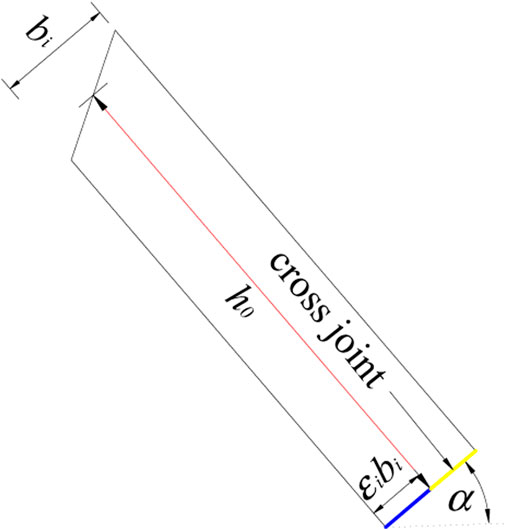
FIGURE 6. Critical height of rock layer i under self-weight.
The first and last rock layers with the possibility of undergoing flexural toppling failure are respectively recorded as n_start and n_end. Thus, rock layers {1, 2, …, n_start-1, n_start}, {1, 2, …, n_start, n_start+1}, …, {1, 2, …, n_end-1, n_end} are the possible groups of the rock layers with a potential of undergoing the overall failure.
In the shear sliding zone, all rock layers have a potential of undergoing shear sliding failure. Accordingly, the stress of each rock layer must meet the Mohr-Coulomb criterion (Su et al., 2021). In this case, the static equilibrium condition of resultant force is rigorously satisfied. Thus, the external force prompting rock layer i to undergo shear sliding failure (see Figure 7), Pi, can be determined with Eq. 13.
where c is the rock layer cohesion, ci is the joint cohesion, φ is the rock layer friction angle, φi is the joint friction angle. If Pi<0, it demonstrates that rock layer i has the possibility of undergoing shear sliding failure without any downslope thrusts.
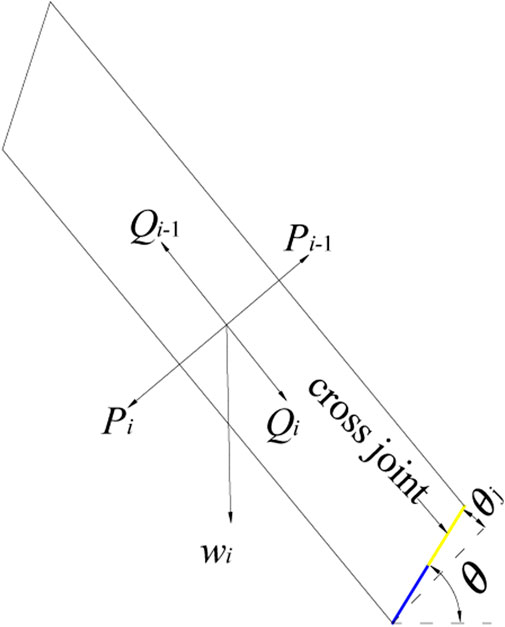
FIGURE 7. Analysis of rock layer i with the possibility of undergoing shear sliding failure.
In the flexural toppling zone, all rock layers have the possibility of undergoing flexural toppling failure. Accordingly, the stress of each rock layer must meet the maximum tensile stress theory (Su et al., 2021). In this case, the static equilibrium condition of resultant moment is rigorously satisfied. Thus, the external force prompting rock layer i to undergo flexural toppling failure (see Figure 8), Ti, can be determined with Eq. 14.
where Ti-1 is the external force prompting rock layer i-1 to undergo flexural toppling failure. If Ti < 0, it indicates that rock layer i has the possibility of undergoing flexural toppling failure without any downslope thrusts.
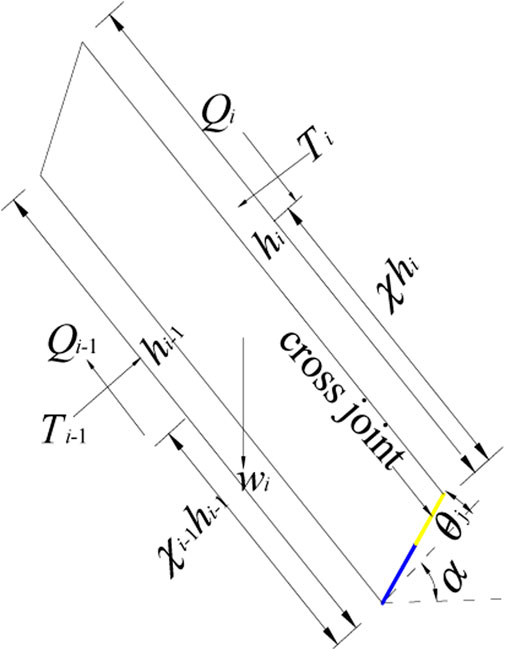
FIGURE 8. Analysis of rock layer i with the possibility of undergoing flexural toppling failure.
In the secondary toppling zone, all rock layers are only subjected to self-weight. Thus, the external force prompting the rock layers in the shear sliding and flexural toppling zones to undergo the overall failure is the final external force prompting the slope to undergo the overall failure. As described in the minimum principle of Pan Jiazheng (Su et al., 2021), once a hard anti-inclined bedded rock slope has the possibility of undergoing the overall failure, the slope will slide or topple along the potential failure surface with the minimum resistant force. In other words, the most dangerous failure surface must be the potential failure surface with the minimum external force prompting the slope to undergo the overall failure.
The external force prompting each group of the rock layers to undergo the overall failure is calculated using a step by step method. Among these external forces, the minimum one is considered to be the external force prompting rock layers 1−nn to undergo the overall failure under the searching angle θj, recorded as fnnj. Then, changing the searching angle constantly, the external forces {fnn1, fnn2, …, fnnnm} are obtained, and the minimum one is considered to be the final external force prompting the slope to undergo the overall failure, recorded as F. The corresponding potential failure surface and the rock layers with a potential of undergoing the overall failure are the most dangerous. Obviously, the above problem can be regarded as an optimal problem with the searching angle, θj, as the variable parameter, which can be expressed as follows:
where min denotes the minimum function. The last rock layer with the possibility of undergoing shear sliding failure is recorded as nst, while the first rock layer with the possibility of undergoing flexural toppling failure under self-weight is recorded as nn.
The shear sliding zone is composed of rock layers 1−nst, which can be determined with inequation (17).
During the calculation process, fnn≤0 shows that rock layer nn has a potential of undergoing flexural toppling failure under self-weight, and thus, the corresponding flexural toppling zone is composed of rock layers nst+1−nn. The corresponding searching angle is recorded as θr.
Once the rock layers located in the shear sliding and flexural toppling zones separate from their overlying rock layers, rock layers nn+1−nt have the possibility of undergoing secondary toppling failure if the equivalent height of each of those rock layers is larger than the critical height h0. The number of fracture stages for rock layer nn+1, n1, can be calculated with Eq. 18.
where ⌊⌋ denotes the function rounded towards zero. The total number of the rock layers with the possibility of undergoing all kinds of failures is recorded as nt.
According to the detailed analysis conducted by Su et al. (Su et al., 2021), the positions of the potential failure surfaces of the underlying rock layers must be lower than those of the overlying rock layers, and thus, the number of fracture stages for rock layer nn+ii, nii, can be calculated with Eq. 19.
where the total number of the rock layers with the possibility of undergoing secondary toppling failure under self-weight is recorded as t. Additionally, inequation (20) must be satisfied.
From the above analysis, we can find that the sign of F can be regarded as an indicator of the stability of a hard anti-inclined bedded rock slope with the possibility of undergoing shear sliding failure and flexural toppling failure: 1) F<0, unstable; 2) F=0, at the limit equilibrium state; 3) F>0, stable. By reducing the strength parameters with the reduction criterion (see Eq. 21) (Su et al., 2021) to make the external force F equal to zero, we can obtain the stability factor of the slope Fs.
Yangtai slope is a large ancient landslide triggered by rainstorm, which is located in Yangtai Village of Xiuning County, Anhui province, China (see Figure 9) (Liu, 2012). As depicted in Figure 10, the leading edge of the slope is located at an elevation of approximately 350 m, and the trailing edge is located at an elevation of around 620 m. The length of the slope along the river is about 360 m, and the longitudinal length is about 690 m. Due to the long-term rain erosion and surface water erosion, four typical deep gullies are formed on the surface of the slope (see Figure 9). The trailing edge of the landslide is bounded by “ring” steep rock cliffs, while the upstream and downstream are bounded by 4# and 1# gullies respectively (see Figure 9). Due to the strong erosion of Yangtai River, the leading edge of the landslide moves constantly. Multistage creep and tension cracks develop significantly at the leading edge of the slope, and the slope undergoes multiple secondary failures along the secondary sliding surfaces. About 4.3 million cubic meters of residual deposits lay on the side of the road (see Figure 11). The main sliding direction is 195°. Landslide deposits are mainly composed of pebbly silty soil and gravel soil. The composition of gravel soil is mainly highly weathered phyllitic slate, while the composition of silty soil is mainly sub-clay. The sliding bed is mainly composed of sandy slates (Pt2b). The beds strike NW30°−35°, and dip into the slope at approximately 63°. The average thickness of the rock layers is about 4 m. Figure 12 and Table 1 respectively present the calculation model diagram and the softened parameters of rock mass (Liu, 2012).
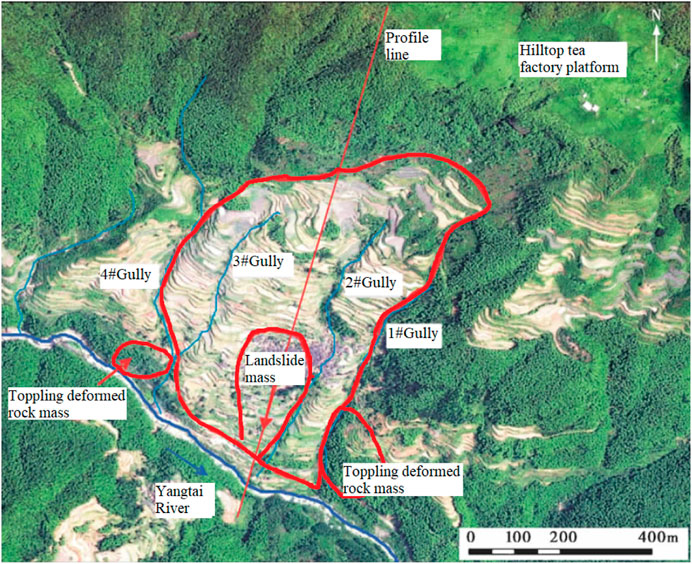
FIGURE 9. Remote sensing image of Yangtai slope.
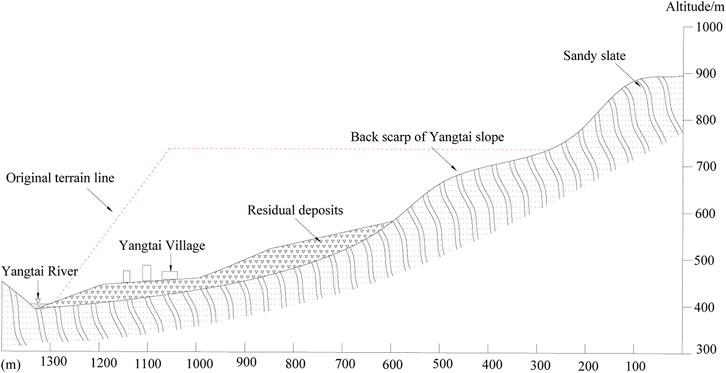
FIGURE 10. Engineering geological profile of Yangtai slope.
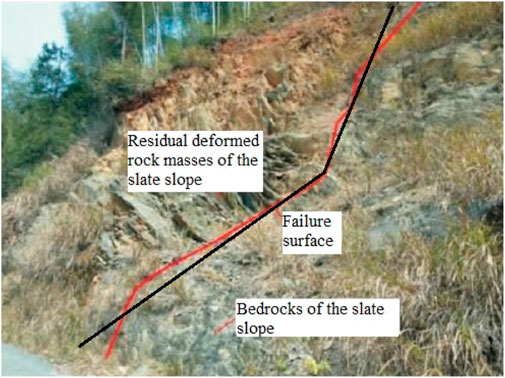
FIGURE 11. Residual deposits of Yangtai slope observed in field investigations.
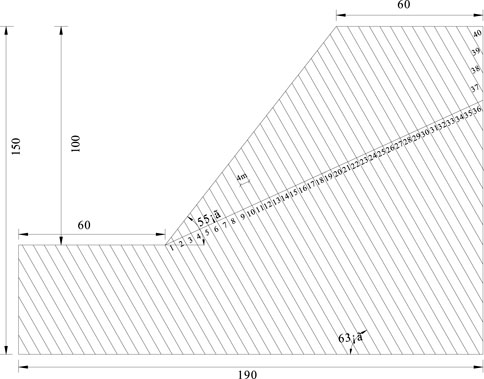
FIGURE 12. Calculation model diagram of Yangtai slope.

TABLE 1. Softened parameters of rock mass of Yangtai slope (Liu, 2012).
The results calculated using the presented method are presented in Table 2, and we can clearly conclude that Yangtai slope is subjected to toppling failure, which is in good agreement with field investigations. Figure 13A shows the non-dimensional parameters χi obtained with the presented method. It presents almost a smooth curve in this figure except for the point (26, 0.35), and the reason is that the distribution of the interlayer force between rock layers 27 and 28 changes greatly compared with that of the other interlayer forces. The value of χi decreases monotonously as the number of the rock layers increases, and the maximum and the minimum values are 0.498 and 0.333, respectively. Figure 13B shows that the failure depths of the rock layers hi obtained with the presented method, increase first and then decrease. The maximum one, 42.16 m, occurs in rock layer 27, while the minimum one, 1.57 m, occurs in rock layer 1. The external forces prompting rock layers 1–28 to undergo shear sliding failure Pi shown in Figure 14A, and the external forces prompting rock layers 3–28 to undergo flexural toppling failure Ti shown in Figure 14B, increase first and then decrease, as well. As depicted in Figure 15, the shear sliding zone marked in red is composed of rock layers 1–6, the flexural toppling zone marked in blue rock layers 7–28, the secondary toppling zone marked in green rock layers 29–31, and the stable zone marked in yellow rock layers 32–40. By using the method put forward by Su et al. (Su et al., 2021), the shear sliding zone is composed of rock layers 1–13, the flexural toppling zone rock layers 14–28, the secondary toppling zone rock layers 29–31, and the stable zone rock layers 32–40. By using the method put forward by Zheng et al. (Zheng et al., 2018b), the shear sliding zone is composed of rock layers 1–2, the flexural toppling zone rock layers 3–20, the secondary toppling zone rock layers 21–29, and the stable zone rock layers 30–40. By using the method put forward by Lu et al. (Lu et al., 2012), the flexural toppling zone is composed of rock layers 1–12, the secondary toppling zone rock layers 13–27, and the stable zone rock layers 28–40. The failure angles obtained with the above four methods are 7.96°, 14.97°, 0° and 10°, respectively. The failure surfaces obtained with these four methods are plotted in Figure 16. The external forces prompting the slope to undergo the overall failure obtained with the presented method and the method put forward by Su et al. (Su et al., 2021) are −2.72 MN and −1.52MN, respectively, while the stability factors of the slope obtained with these two methods, Majdi and Amini’s method (Majdi and Amini, 2011) and Aydan and Kawamoto’s method (Aydan and Kawamoto, 1992) are 0.78, 0.68, 0.54 and 093, respectively. By using Aydan and Kawamoto’s method (Aydan and Kawamoto, 1992), the residual sliding force is 4.68 MN (see Table 3).
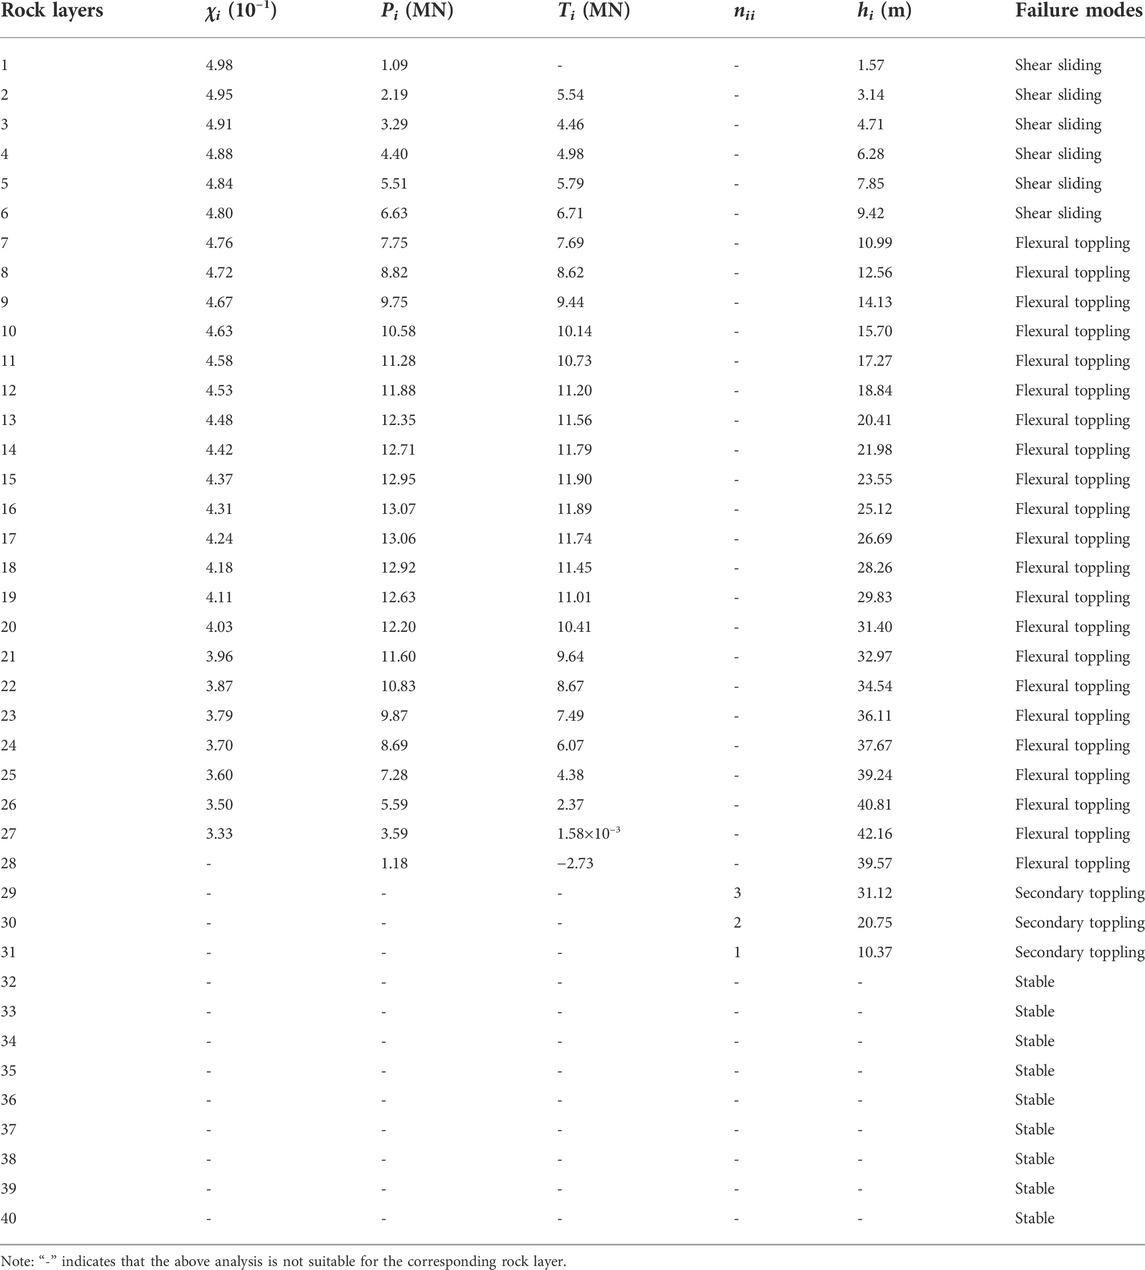
TABLE 2. Results of Yangtai slope calculated using the presented method.
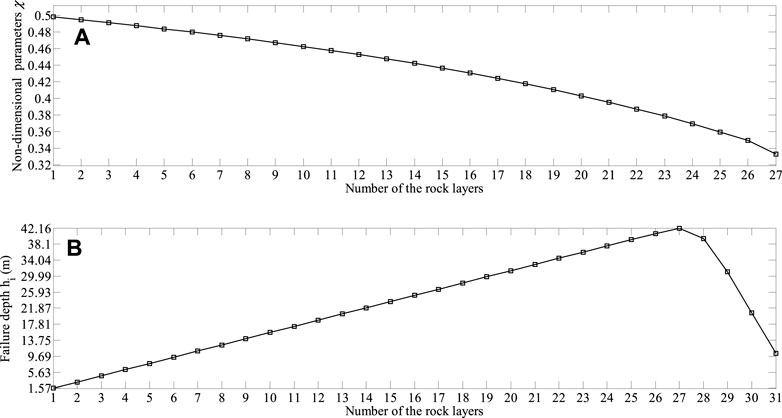
FIGURE 13. Results obtained with the presented method: (A) the non-dimensional parameters χi; (B) the failure depths of rock layers hi.
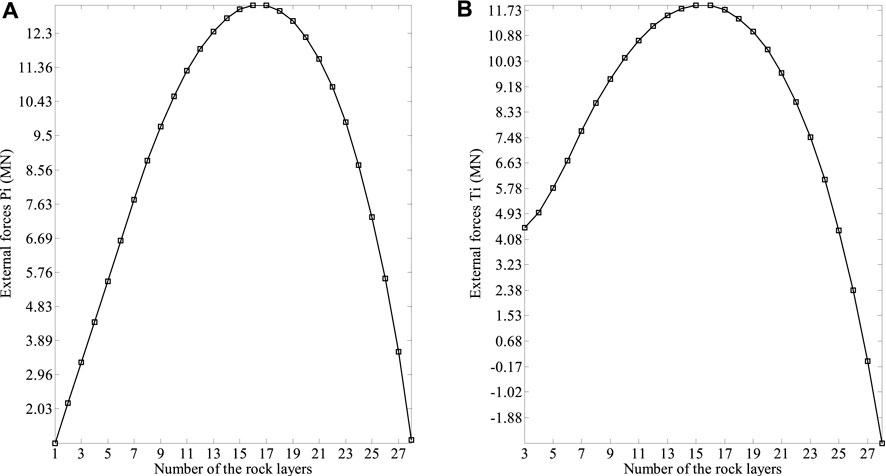
FIGURE 14. Results obtained with the presented method: (A) the external forces prompting rock layers 1–28 to undergo shear sliding failure Pi; (B) the external forces prompting rock layers 3–28 to undergo flexural toppling failure Ti.
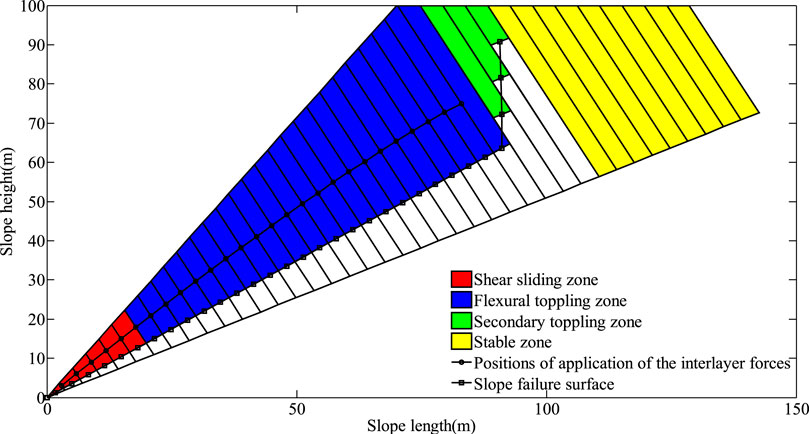
FIGURE 15. Different zones, different positions of application of the interlayer forces and slope failure surface obtained using the presented method.
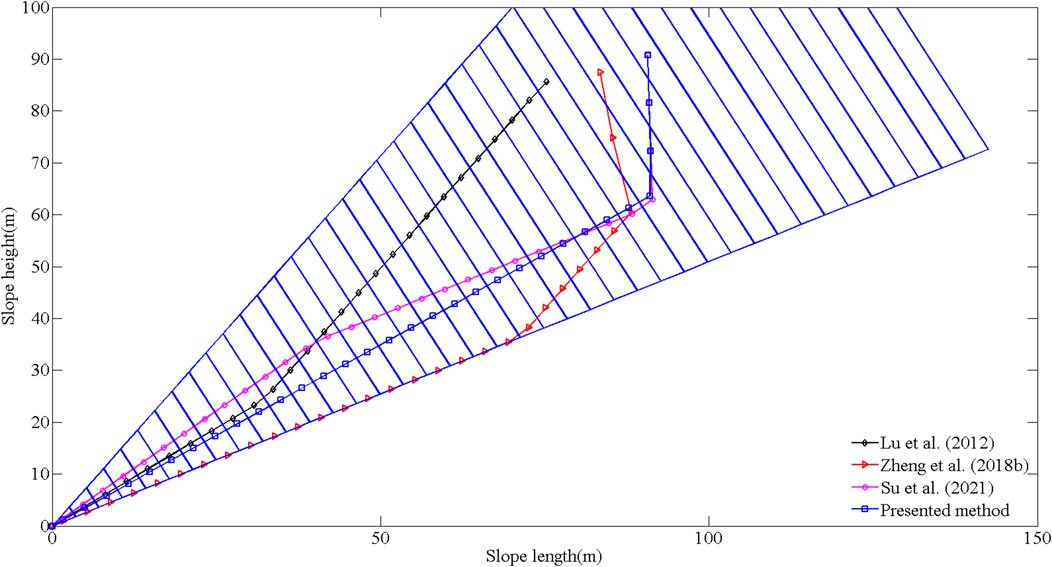
FIGURE 16. The failure surfaces of Yangtai slope obtained using different methods.
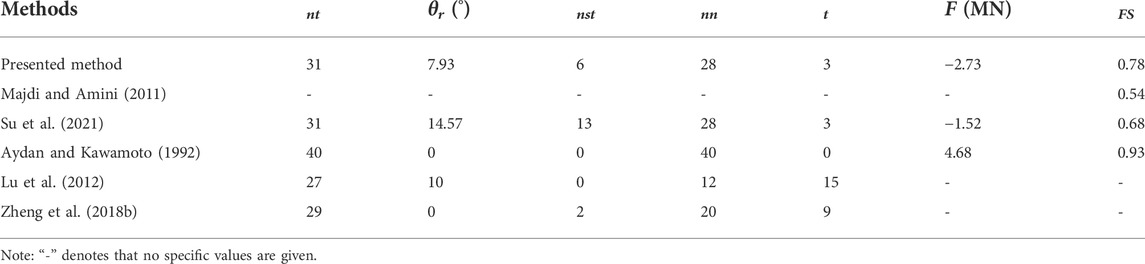
TABLE 3. Results of Yangtai slope calculated using different methods.
The failure surface of Yangtai slope calculated using the presented method (see Figure 17) is similar with that reported by Liu (Liu, 2012) using UDEC (see Figure 18A) and FLAC3D (see Figure 18B), and is consistent with the actual failure surface observed in field investigations (see Figure 11). Obviously, the presented failure surface (see Figure 17) is more accurate than that obtained using the methods proposed by Lu et al. (Lu et al., 2012), Zheng et al. (Zheng et al., 2018b) and Su et al. (Su et al., 2021). Yangtai slope had undergone the overall failure before the damage developed to the plane perpendicular to the joints, and thus, Aydan and Kawamoto’s method (Aydan and Kawamoto, 1992) substantially overestimated the slope stability. Majdi and Amini (Majdi and Amini, 2011) neglected the effects of the mechanical parameters on the stability of hard anti-inclined bedded rock slopes, and thus, their method may yield an inaccurate stability factor of Yangtai slope. The non-dimensional parameter indicating the position of application of the interlayer force was considered to be a constant in the method put forward by Su et al. (Su et al., 2021), and the corresponding value was larger than its reasonable one. So, Su et al. (Su et al., 2021) underestimated the slope stability. Consequently, the presented failure surface of Yangtai slope is rational and the corresponding stability factor is credible.
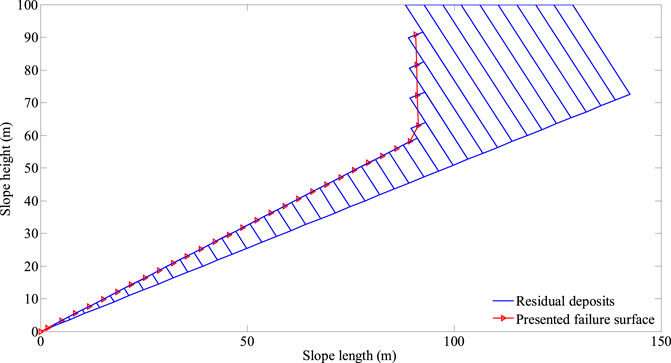
FIGURE 17. Residual deposits and the failure surface of Yangtai slope calculated using the presented method.
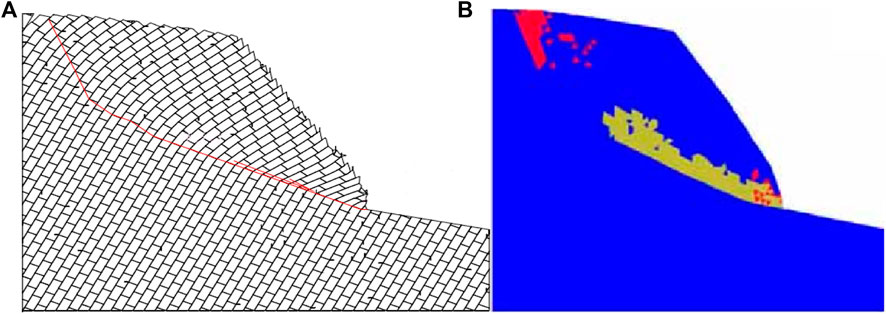
FIGURE 18. Results of Yangtai slope obtained by Liu (Liu, 2012): (A) the failure surface using UDEC; (B) distribution of plastic zone using FLAC3D.
The values of the non-dimensional parameter χ in previous studies were recommended to be 1/3 (Amini et al., 2012), 0.5 (Aydan and Kawamoto, 1992) and 0.6 (Adhikary et al., 1997). To investigate the effect of the non-dimensional parameter χ on the stability of Yangtai slope, χ is set to the above values and χi proposed in presented study, respectively. The presented framework is also valid in this section. The corresponding external forces prompting the rock layers to undergo shear sliding failure and flexural toppling failure, the failure depths and the failure modes of the rock layers are presented in Table 4. The corresponding shear failure angles, the total number of the rock layers with a potential of undergoing shear sliding failure or flexural toppling failure, the total number of the rock layers with a potential of undergoing the overall failure, the external force prompting the slope to undergo the overall failure, and the stability factor are listed in Table 5. The failure depths of rock layers hi, the external forces prompting the rock layers to undergo shear sliding failure Pi, the external forces prompting the rock layers to undergo flexural toppling failure Ti, and the slope failure surfaces, obtained through the presented framework for different values of χ, are plotted in Figures 19, 20A,B, 21, respectively.
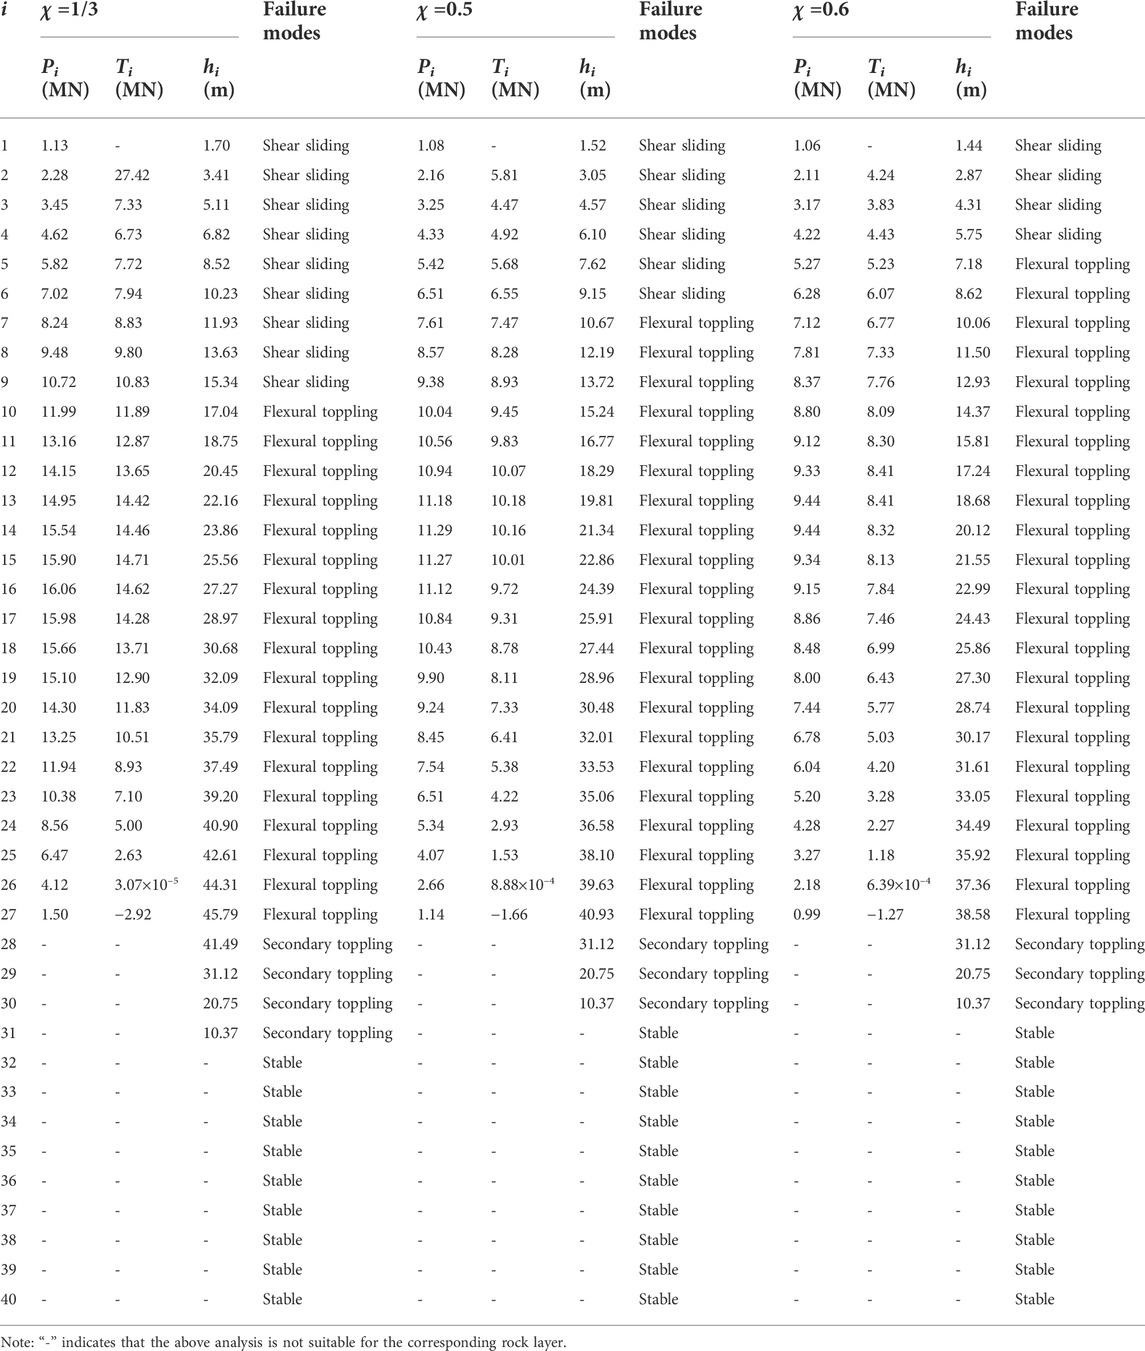
TABLE 4. The external forces prompting the rock layers to undergo shear sliding failure and flexural toppling failure, the failure depths and the failure modes of the rock layers obtained through the presented framework for different values of χ.
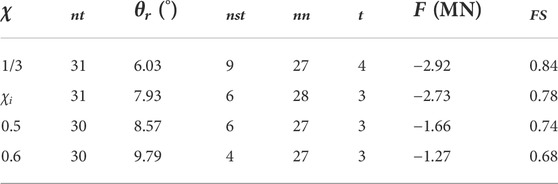
TABLE 5. The results obtained through the presented framework for different values of χ
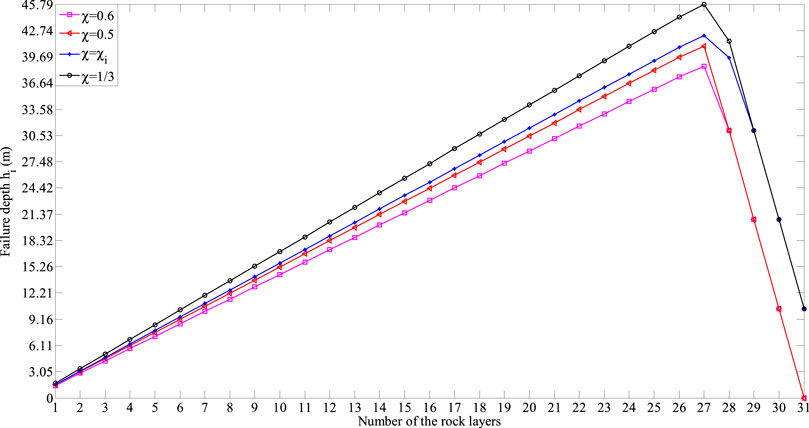
FIGURE 19. Failure depths of the rock layers hi obtained through the presented framework for different values of χ.
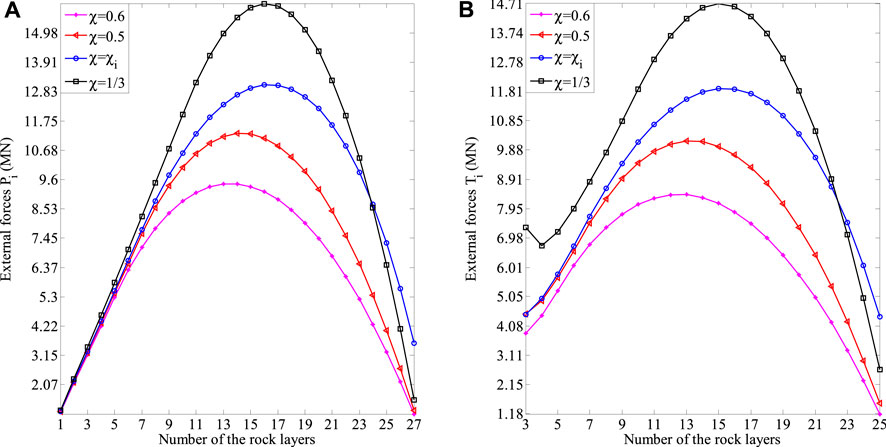
FIGURE 20. Results obtained through the presented framework for different values of χ: (A) the external forces prompting the rock layers to undergo shear sliding failure Pi; (B) the external forces prompting the rock layers to undergo flexural toppling failure Ti.
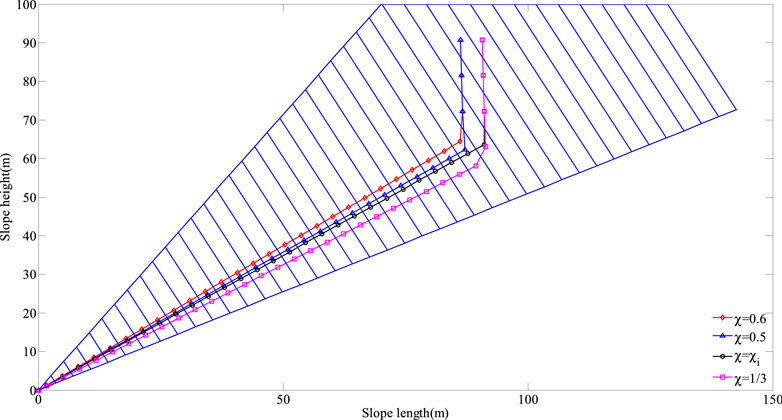
FIGURE 21. Slope failure surfaces obtained through the presented framework for different values of χ.
From Table 4 and Figures 19, 20, we can find that, as the non-dimensional parameter χ increases, the failure depth of each one of rock layers 1–31 hi (see Figure 19) decreases. The same applies to the external force prompting each one of rock layers 1–27 to undergo shear sliding failure Pi (see Figure 20A), and the external force prompting each one of rock layers 2–25 to undergo flexural toppling failure Ti (see Figure 20B). This indicates that the failure is more likely to occur in these rock layers. As the distribution of the interlayer force between rock layers 27 and 28 changes greatly, the above conclusion is no longer suitable for the external force prompting each one of rock layers 26–27 to undergo flexural toppling failure. In addition, even with the different non-dimensional parameters χ, there will always be same changing trends in the failure depths of the rock layers {h1, h2, …, h31}, the external forces prompting the rock layers to undergo shear sliding failure {P1, P2, …, P27}, and the external forces prompting the rock layers to undergo flexural toppling failure {T3, T4, …, T27}, which can be summarized as: 1) the values increase first and then decrease; 2) the maximum failure depth occurs in rock layer 27.
From Table 5 and Figure 21, we can conclude that, as the non-dimensional parameter χ decreases, the total number of the rock layers with a potential of undergoing shear sliding failure, and the stability factor, increase significantly, while the shear failure angle, and the external force prompting the slope to undergo the overall failure, decrease dramatically. The slope failure surfaces gradually develop to the deep (see Figure 21), which indicates that the slope becomes more stable as it will take longer time to trigger the overall failure. The greater support resistance is needed at the toe to keep the slope stable prior to overall failure (see Table 5), which indicates that it will cause more serious impact effect after slope failure. But surprisingly, there is little change in the total number of the rock layers with a potential of undergoing the overall failure, as well as the total number of the rock layers with the possibility of undergoing secondary toppling failure. In short, the stability of the slope is reinforced, but once the failure surface is penetrated, the larger landslide with more serious damage effect will occur.
The above conclusions can be verified from the physical mechanism. The external forces prompting rock layers to undergo shear sliding failure and flexural toppling failure, are produced by rock layers squeezing each other due to toppling deformation. If the non-dimensional parameter χ decreases, the larger external forces are required to trigger the above two failures. In this case, the deformation time of rock layers becomes longer, and the deformation depth increases. As a result, the slope failure surfaces develop to the deep, and the stability of the slope is considered to be reinforced because it will take longer time to trigger the overall failure. However, it will cause more serious damage effect as the larger landslide will occur after the failure surface is penetrated.
This study aims to address the problems that the failure surfaces of many hard anti-inclined bedded rock slopes obtained with current analytical methods are inconsistent with those observed in field investigations and the stability factors of such slopes are not accurately evaluated. According to the failure mechanism of the rock layers in such slopes, the slope was classified into four zones: shear sliding zone, flexural toppling zone, secondary toppling zone and stable zone. The non-dimensional parameter indicating the position of application of the interlayer force was revised by deriving the distribution and the equivalent substitution of interlayer force. Then, based on the new failure zone model, a limit equilibrium method was established to assess the stability of such slopes. Comparative analyses of Yangtai slope obtained with the presented approach, Majdi and Amini’s method (Majdi and Amini, 2011), Aydan and Kawamoto’s method (Aydan and Kawamoto, 1992), UDEC (Liu, 2012), FLAC3D (Liu, 2012), and the methods developed by Su et al. (Su et al., 2021), Lu et al. (Lu et al., 2012), and Zheng et al. (Zheng et al., 2018b) were performed to testify the solutions’ validity and accuracy. Finally, the presented method was extended to investigate the effect of the non-dimensional parameter on the stability of the slope. Several conclusions can be drawn.
(1) The non-dimensional parameter varies with the distribution of interlayer forces. The value of the non-dimensional parameter is smaller than 0.5, and is greater than or equal to 1/3.
(2) The presented method is suitable for evaluating the stability of hard anti-inclined bedded rock slopes. In addition, compared with other analytical methods, the presented method has higher predictive accuracy.
(3) When the non-dimensional parameter decreases, the slope stability is reinforced. However, the larger landslide with more serious damage effect will occur if the slope undergoes the overall failure.
It is important to note that the results presented in this work, which can be employed as the supportive data for the preliminary stability evaluation, is only suitable for the final failure state of hard anti-inclined bedded rock slopes with the possibility of undergoing shear sliding failure and flexural toppling failure.
The original contributions presented in the study are included in the article/Supplementary Material, further inquiries can be directed to the corresponding author.
XQ: conceptualization, investigation, writing—original draft, writing—review and editing. methodology, resources, project administration, funding acquisition. FD: formal analysis, writing—review and editing, supervision.
This study has been financially supported by the Natural Science Foundation of Henan (No. 202300410011) and the National Natural Science Foundation of China (No. 42107195).
The authors declare that the research was conducted in the absence of any commercial or financial relationships that could be construed as a potential conflict of interest.
All claims expressed in this article are solely those of the authors and do not necessarily represent those of their affiliated organizations, or those of the publisher, the editors and the reviewers. Any product that may be evaluated in this article, or claim that may be made by its manufacturer, is not guaranteed or endorsed by the publisher.
Adhikary, D. P., and Dyskin, A. V. (2007). Modelling of progressive and instantaneous failures of foliated rock slopes. Rock Mech. Rock Eng. 40 (4), 349–362. doi:10.1007/s00603-006-0085-8
Adhikary, D. P., Dyskin, A. V., Jewell, R. J., and Stewart, D. P. (1997). A study of the mechanism of flexural toppling failure of rock slopes. Rock Mech. Rock Eng. 30 (2), 75–93. doi:10.1007/bf01020126
Alejano, L. R., Veiga, M., Perez-Rey, I., Castro-Filgueira, U., Arzua, J., and Castro-Caicedo, A. J. (2019). Analysis of a complex slope failure in a granodiorite quarry bench. Bull. Eng. Geol. Environ. 78 (2), 1209–1224. doi:10.1007/s10064-017-1160-y
Amini, M., Majdi, A., and Veshadi, M. A. (2012). Stability analysis of rock slopes against block-flexure toppling failure. Rock Mech. Rock Eng. 45 (4), 519–532. doi:10.1007/s00603-012-0220-7
Aydan, O., and Kawamoto, T. (1992). The stability of slopes and underground openings against flexural toppling and their stabilisation. Rock Mech. Rock Eng. 25 (3), 143–165. doi:10.1007/bf01019709
Cai, J. S., Yan, E. C., Wang, Z. Q., Yang, J. G., and Tang, R. X. (2014). Study of cantilever beam limit equilibrium model of anti-inclined layered rock slopes. Rock Soil Mech. 35, 15–28.
Cai, J. H., Zhang, L., Dong, J., Dong, X. J., Li, M. H., Xu, Q., et al. (2022). Detection and characterization of slow-moving landslides in the 2017 Jiuzhaigou earthquake area by combining satellite SAR observations and airborne Lidar DSM. Eng. Geol. 305, 106730. doi:10.1016/j.enggeo.2022.106730
Chen, M. L., Lv, P. F., Nie, W. Z., Tan, C. M., Bai, Z. H., Liao, Y., et al. (2020). The role of water and lithology on the deformation and failure of an anaclinal rock slope in a hydropower reservoir. Adv. Civ. Eng. 2020, 1–13. doi:10.1155/2020/8852227
Ding, B. D., Zhang, H. Z., Zhang, G. C., Beng, X. T., and Yang, Y. C. (2021). Flexural toppling mechanism and stability analysis of an anti-dip rock slope. Rock Mech. Rock Eng. 54, 3721–3735. doi:10.1007/s00603-021-02435-w
Fan, F. S. (2015). Toppling failure and rock burst analysis using the improved NMM and DDA simulation techniques. Fukuoka: Kyushu University Institutional Repository.
Franziska, G., Simon, L., Andrea, M., and Jordan, A. (2019). From toppling to sliding: Progressive evolution of the moosfluh landslide, Switzerland. J. Geophys. Res. Earth Surf. 124 (12), 2899–2919. doi:10.1029/2019jf005019
Goodman, R. E., and Bray, J. W. (1976). “Toppling of rock slopes,” in Proceedings of the Specialty Conference on Rock Engineering for Foundations and Slopes ASCE./Boulder Geotechnical Engineering Division of ASCE, Colorado, 1976, August 15-18, 201–243.
Gu, D. M., and Huang, D. (2016). A complex rock topple-rock slide failure of an anaclinal rock slope in the Wu Gorge, Yangtze River, China. Eng. Geol. 208 (24), 165–180. doi:10.1016/j.enggeo.2016.04.037
Lian, J. J., Li, Q., Deng, X. F., Zhao, G. F., and Chen, Z. Y. (2018). A numerical study on toppling failure of a jointed rock slope by using the distinct lattice spring model. Rock Mech. Rock Eng. 51 (2), 513–530. doi:10.1007/s00603-017-1323-y
Liu, C. H., Jaksa, M. B., and Meyers, A. G. (2008). Improved analytical solution for toppling stability analysis of rock slopes. Int. J. Rock Mech. Min. Sci. 45 (8), 1361–1372. doi:10.1016/j.ijrmms.2008.01.009
Liu, T. T., Ding, L. Y., Meng, F., Li, X. P., and Zheng, Y. (2021). Stability analysis of anti-dip bedding rock slopes using a limit equilibrium model combined with bi-directional evolutionary structural optimization (BESO) method. Comput. Geotechnics 134, 104116. doi:10.1016/j.compgeo.2021.104116
Liu, Y., Qiu, H. J., Yang, D. D., Liu, Z. J., Y Ma, S., Pei, Y. Q., et al. (2022). Deformation responses of landslides to seasonal rainfall based on InSAR and wavelet analysis. Landslides 19, 199–210. doi:10.1007/s10346-021-01785-4
Liu, H. J. (2012). Research on the toppling deformation mechanism of counter-tilt slate slope in the mountainous zone of southern Anhui. Chengdu: Chengdu University of Technology.
Lu, H. F., Liu, Q. S., and Chen, C. X. (2012). Improvement of cantilever beam limit equilibrium model of counter-tilt rock slopes. Rock Soil Mech. 33 (2), 577–584.
Majdi, A., and Amini, M. (2011). Analysis of geo-structural defects in flexural toppling failure. Int. J. Rock Mech. Min. Sci. 48 (2), 175–186. doi:10.1016/j.ijrmms.2010.11.007
Ning, Y. B., Tang, H. M., Zhang, G. C., Smith, J. V., Zhang, B. C., Shen, P. W., et al. (2021). A complex rockslide developed from a deep-seated toppling failure in the upper Lancang River, Southwest China. Eng. Geol. 293, 106329. doi:10.1016/j.enggeo.2021.106329
Qu, X., and Diao, F. F. (2020). An optimization of the analytical method for determining the flexural toppling failure plane. Adv. Civ. Eng. 2020, 1–12. doi:10.1155/2020/5732596
Recep, K., and Ulamiş, K. (2020). Toppling and sliding in volcanic bimrocks around Bayrakli (Izmir, Turkey). J. Mt. Sci. 17 (2), 492–500. doi:10.1007/s11629-019-5648-8
Sarfaraz, H. (2021). An analytical solution for analysis of block toppling failure using approach of fictitious horizontal acceleration. J. Min. Sci. 57 (2), 202–209. doi:10.1134/s1062739121020046
Su, L. J., Qu, X., and Zhang, C. L. (2017). A new calculation method to flexural toppling failure of anti-inclinedped rock slope”//the workshop on world landslide forum. Cham: Springer, 483–488.
Su, L. J., Qu, X., Zhang, C. L., Iqbal, J., Wang, S. Y., Xu, X. Q., et al. (2021). An optimal method for searching failure surfaces of hard thin-layered anaclinal rock slopes with cross joints. Arab. J. Geosci. 14, 1422. doi:10.1007/s12517-021-07814-9
Zhao, W., Wang, R. Q., and Nian, T. K. (2020). Stability analysis of anti-dip rock slopes with flexural toppling failure based on deformation compatibility. Rock Mech. Rock Eng. 53 (4), 3207–3221. doi:10.1007/s00603-020-02098-z
Zheng, Y., Chen, C. X., Liu, X. M., Liu, T. T., Zhou, Y. C., Xia, K. Z., et al. (2015). Investigation on calculation method of layered counter-tilt slope for flexural toppling failure. Chin. J. Rock Mech. Eng. 34, 4252–4261.
Zheng, Y., Chen, C. X., Liu, T. T., Zhang, H. N., Xia, K. Z., and Liu, F. (2018a). Study on the mechanisms of flexural toppling failure in anti-inclined rock slopes using numerical and limit equilibrium models. Eng. Geol. 237, 116–128. doi:10.1016/j.enggeo.2018.02.006
Zheng, Y., Chen, C. X., Liu, T. T., Xia, K. Z., and Liu, X. M. (2018b). Stability analysis of rock slopes against sliding or flexural-toppling failure. Bull. Eng. Geol. Environ. 77 (4), 1383–1403. doi:10.1007/s10064-017-1062-z
Zheng, Y., Chen, C. X., Meng, F., Liu, T. T., and Xia, K. Z. (2020). Assessing the stability of rock slopes with respect to flexural toppling failure using a limit equilibrium model and genetic algorithm. Comput. Geotechnics 124, 103619. doi:10.1016/j.compgeo.2020.103619
Zheng, Y., Chen, C. X., Liu, T. T., and Ren, Z. H. (2021a). A new method of assessing the stability of anti-dip bedding rock slopes subjected to earthquake. Bull. Eng. Geol. Environ. 80, 3693–3710. doi:10.1007/s10064-021-02188-4
Zheng, Y., Wang, R. Q., Chen, C. X., Sun, C. Y., Ren, Z. H., and Zhang, W. (2021b). Dynamic analysis of anti-dip bedding rock slopes reinforced by pre-stressed cables using discrete element method. Eng. Analysis Bound. Elem. 130 (4), 79–93. doi:10.1016/j.enganabound.2021.05.014
Keywords: anti-inclined bedded rock slope, stability assessment, flexural toppling, limit equilibrium method, position of application of the interlayer force
Citation: Qu X and Diao F (2022) Stability assessment for hard anti-inclined bedded rock slopes using a limit equilibrium method. Front. Earth Sci. 10:970550. doi: 10.3389/feart.2022.970550
Received: 16 June 2022; Accepted: 11 August 2022;
Published: 27 September 2022.
Edited by:
Xiaojun Guo, Institute of Mountain Hazards and Environment (CAS), ChinaReviewed by:
Haijun Qiu, Northwest University, ChinaCopyright © 2022 Qu and Diao. This is an open-access article distributed under the terms of the Creative Commons Attribution License (CC BY). The use, distribution or reproduction in other forums is permitted, provided the original author(s) and the copyright owner(s) are credited and that the original publication in this journal is cited, in accordance with accepted academic practice. No use, distribution or reproduction is permitted which does not comply with these terms.
*Correspondence: Xin Qu, eHF1MTk4N0AxNjMuY29t
Disclaimer: All claims expressed in this article are solely those of the authors and do not necessarily represent those of their affiliated organizations, or those of the publisher, the editors and the reviewers. Any product that may be evaluated in this article or claim that may be made by its manufacturer is not guaranteed or endorsed by the publisher.
Research integrity at Frontiers
Learn more about the work of our research integrity team to safeguard the quality of each article we publish.