 Muhammad Adnan
 Shiyin Liu
 Muhammad Saifullah
 Mudassar Iqbal
 Ayaz Fateh Ali4
94% of researchers rate our articles as excellent or good
Learn more about the work of our research integrity team to safeguard the quality of each article we publish.
Find out more
ORIGINAL RESEARCH article
Front. Earth Sci., 29 August 2022
Sec. Hydrosphere
Volume 10 - 2022 | https://doi.org/10.3389/feart.2022.970349
This article is part of the Research TopicHydrological and Chemical Effects of a Changing Cryosphere on Mountain FreshwatersView all 9 articles
Change in seasonal snowfall and glaciers ablation control year-to-year variations in streamflows of the Upper Indus Basin (UIB) and hence ultimately impacts the water availability in downstream areas of UIB. This situation calls for an urgent response to study the long-term variations in runoff components in response to climate change. The current study investigates the spatiotemporal variations in runoff and runoff components in response to climate change to the streamflows of the Gilgit River from 1981 to 2020 by using the University of British Columbia Watershed Model (UBC WM). Three statistical indices such as the Nash–Sutcliffe efficiency (NSE), the coefficient of determination (R2), and the correlation coefficient (CC) were used to evaluate the performance of UBC WM in simulating the streamflows against observed streamflows. According to statistical indices, the UBC WM performed fairly well during both calibration (1981–2000: R2 = 0.90, NSE = 0.87, and CC = 0.95) and validation periods (2001–2015: R2 = 0.86, NSE = 0.83, and CC = 0.92). Trend analysis revealed a significant increase in all runoff components with large interannual variations in their relative contributions to streamflows from 1981 to 2020. From 1981 to 2020, the average relative contribution of snowmelt, glacier melt, rainfall-runoff, and baseflow was estimated to be 25%, 46%, 5%, and 24%, respectively to the streamflows of the Gilgit River. Seasonal analysis showed that about 86% of total runoff was contributed to the Gilgit River during the summer season (April–September) while only 14% in the winter season (October–March). Further analysis of runoff at a spatial scale revealed that approximately 76% of the total runoff of Gilgit River is generated between elevations from 3680 to 5348 m while 19% of total runoff is generated at an elevation <3680 m and only 5% at an elevation >5348 m. Moreover, it was observed that groundwater contribution from soil lower zone (i.e., 76%) to streamflows was found greater than soil upper zone (i.e., 24%). The outcomes of this study will help the water resource managers and hydrologists to manage the water resources in downstream areas of the UIB for local consumption, industrial use, and agriculture.
One-third of the world’s population directly or indirectly is dependent on the water coming from the rivers originating from High Mountain Asia (HMA) (Li et al., 2021). The Hindu Kush, Karakoram, and Himalaya (HKH) Mountain ranges encompass some of the world’s largest glaciers (Sharma et al., 2019), and half of the ice volume of the HMA exists in the Himalaya–Karakoram (HK) mountain ranges. In South Asia, the HK region is regarded as one of the most vulnerable and glacierized mountainous regions (Azam et al., 2021). The glaciers of the HK mountain ranges control the supply of fresh water to almost 869 million people within the Tarim, Brahmaputra, Indus, and Ganges River basins. However, since the mid-20th century, the rising temperature had temporarily increased the summer meltwater runoff and on the other hand, it had continuously decreased the ice storage volume, particularly in the Himalayas (Nie et al., 2021). Moreover, a substantial increase in glacier melt and permafrost thaw was observed since the mid-1990’s in rivers originating from HMA (Li et al., 2021). The Himalayan glaciers which feed a large number of river systems in the Indian sub-continent are now experiencing adverse effects on their melting rates because of global warming (Boral and Sen, 2020) and it has been projected to increase in glacier melt runoff and total river runoff until the 2050’s in rivers originating from HK region (Azam et al., 2021). Similarly, few other studies such as those (Kääb et al., 2012; Yao et al., 2012; Shean et al., 2020) found the greatest loss of glaciers in the Himalayas and Nyainqêntanglha Mountains in the 21st century. However, the glaciers in the Pamir, western Kunlun, and Karakoram Mountains were found stable or displayed abnormally little change as compared to the rest of the world’s mountain glaciers (Bolch et al., 2012; Kääb et al., 2012; Minora et al., 2013; Kapnick et al., 2014; Bolch et al., 2017; Brun et al., 2017; Shean et al., 2020) and this abnormal conduct of Karakoram glaciers is generally denoted as the Karakoram Anomaly (Hewitt, 2005). The diverse behavior of HK glaciers is not only affecting the hydrological regime of the region but also the intensity and frequency of glacier-related hazards such as glacial retreat and detachments, debris flow, landslides, rock-ice avalanches, and Glacial Lakes Outburst Floods (GLOFs) (Carrivick and Tweed, 2016; Hock et al., 2019; Wang et al., 2019; Li et al., 2022). The ice loss from the HK glaciers has been increasing substantially for several decades (Bolch et al., 2012; Azam et al., 2018; King et al., 2019; Maurer et al., 2019) which has triggered the amount of summer meltwater release that has already reached at its peak in few basins (Huss and Hock, 2018).
The Indus River flows through the HKH mountain ranges and covers an area of 1.12 × 10⁶ km2 whereas the glaciers cover approximately 2.3% of the basin. The major part of the glacier area (i.e., 60%) is located in the Karakoram while the Himalayas comprised less than 30% and the Hindu Kush consists of about 10% part of the glacier cover area (Bolch, 2019). The snow and glacier-fed river catchments of the Karakoram region produce a major part of the flow in the Indus River system which is located in the western Himalayas (Tahir et al., 2011). In general, 90% of agricultural production in Pakistan is dependent on the Indus Basin Irrigation System (IBIS) and it contributes nearly 22% to Pakistan’s Gross Domestic Product (GDP) (Yu et al., 2013) whereas about 30% of the energy demand of the country is fulfilled through hydropower produced from the Indus River at Tarbela Dam (Roca, 2012). About half of the surface water availability of Pakistan is fulfilled through withdrawals from the Upper Indus Basin (UIB) coming from the HKH mountain ranges which are essential for hydropower generation, domestic and industrial use, and agricultural production as well (Hasson et al., 2017). The combined meltwater of snow and ice contributes to nearly 80% of the total runoff in the Indus River (Faruqui, 1997; Immerzeel et al., 2009; Garee et al., 2017) so the water coming from the UIB is highly important for the well-being of the Pakistan (Forsythe et al., 2010). Lutz et al. (2014) observed that the meltwater coming from the glaciers of the UIB contributes nearly 40% to the total runoff of the Indus River and it drains into arid plains (Bolch, 2019). But erratic glacier melt and ambiguous future precipitation regimes made it the most susceptible to variation in water availability (Immerzeel et al., 2015; Bolch et al., 2017; Pritchard, 2019). And, besides climate change; mismanagement of river flows and excessive groundwater pumping has led Pakistan to the list of water-stressed countries (Döll et al., 2009; Wada et al., 2011; Schlosser et al., 2014; Kirby et al., 2017).
Change in seasonal snowfall and glacier ablation control the year-to-year variations in streamflows of the UIB (Forsythe et al., 2017), and hence ultimately impact the water availability in downstream areas of UIB. Moreover, it has been found great variations in the relative contributions of runoff components to river runoff across the HKH mountainous ranges. The glacial melt was found to far outweigh snowmelt in the rivers draining the Karakoram and Zanskar ranges while snowmelt contribution was found dominant in rivers draining the Himalayan ranges (Mukhopadhyay and Khan, 2015a). However, rainfall-runoff contribution to the total streamflows was observed dominant followed by snowmelt and baseflow at downstream stations (i.e., Maqu and Tangnaihai) of the source-region of the Yellow River while glacier melt contribution was found negligible (Zhang et al., 2022). Moreover, few previous studies, i.e., Li et al. (2020) and (2021) revealed a substantial increase in annual runoff and annual sediment fluxes in headwaters regions of HMA since 1990. Similarly, it has been observed a shift in the magnitude and peak of water availability at a seasonal scale due to the earlier onset of snow/glacier melting in 15 headwater basins of HMA which may ultimately impact the food and energy security, biodiversity, and livelihoods of people in downstream areas (Khanal et al., 2021). So this situation encourages us to further investigate the long-term variations in runoff components such as snowmelt, glaciers melt, rainfall-runoff, and baseflow at the spatiotemporal scale in UIB. Till now, there is a poor understanding of the hydrologic processes of the alpine basins in UIB which is the main source of uncertainty in the assessment of regional hydrological impacts of climate change. Under current circumstances, it is indispensable to accurately estimate the long-term variations in runoff components for scientific planning, management, and sustainable use of water resources in downstream areas. However, the quantification of runoff components has always been a problematic issue in hydrological studies and different methods have been used for this purpose such as the stable water isotope modeling approach (Boral and Sen, 2020), statistical and empirical approaches (Mukhopadhyay and Khan, 2014; 2015a) and hydrological modeling (Lutz et al., 2014, 2016; Adnan et al., 2017; Ali et al., 2018; Latif et al., 2020; Khanal et al., 2021; Zhang et al., 2022). However, among these, hydrological modeling has an advantage in runoff segmentation because of its modular approach to hydrological processes (Wu et al., 2021).
The current study was conducted on the Gilgit River basin which is a sub-catchment of the UIB (Figure 1). The Gilgit River basin is located in the north-western Karakorum and it receives combined streamflows of Gilgit and Hunza Rivers at Alam Bridge gauging station just before joining the Indus River. The selected study area is very important for the economic development of both Pakistan and China because part of the trade route that starts from China is passing through this region. This route is also known as the China-Pakistan Economic Corridor (CPEC) and it is an integrated part of the “One Belt One Road” initiative policy (Gao et al., 2021). The study area is highly glaciated and has several potentially dangerous glacial lakes. Several GLOFs events and surges have been observed in the basin, especially, along the CPEC route (Saifullah et al., 2020; Gao et al., 2021). GLOFs mainly occur in the spring and summer seasons and their hazard-causing process is short-lived. However, ice-dammed lakes have the highest frequency of flooding which is closely related to the sudden advancement of surge-type glaciers in the Hunza basin (Gao et al., 2021). Therefore, it is vital to understand the state and fate of these glaciers as well as meltwater runoff originating from these glaciers for long-term progress and planning in this area (Ashraf et al., 2012; Westoby et al., 2015). Though, the previous hydrological modeling studies lack credible information about the relative contributions of meltwater (i.e., snow and glacier melt) runoff to the streamflows of the Gilgit River basin. Most of the previous studies investigated the hydrological characteristics of the Gilgit and Hunza sub-catchments by using hydrological models which lack glacier modules such as the Snowmelt Runoff Model (Tahir et al., 2011; Adnan et al., 2017; Hayat et al., 2019; Latif et al., 2020) and Soil and Water Assessment Tool (SWAT) model (Thakuri and Salerno, 2016; Garee et al., 2017) whereas others used satellite data (Forsythe et al., 2010; Reggiani and Rientjes, 2015; Bolch et al., 2017; Hussain et al., 2019; Gilany et al., 2020) and statistical tools (Farhan et al., 2020) to study the hydrological characteristics of these basins. The previous hydrological modeling studies have also neglected the quantification of baseflow contributions to the streamflows of the Gilgit River which is an important part of winter streamflows. Though, few studies available where a high-resolution cryospheric-hydrology model such as the Spatial Processes in Hydrology model (SPHY) was used to simulate the relative contribution of runoff components to the streamflows of the source-region of Yellow River (Zhang et al., 2022) and 15 upstream rivers of HMA (Khanal et al., 2021). The SPHY model is capable of simulating the separate contribution of snowmelt, glacier melt, rainfall-runoff, and baseflow to the total streamflows.
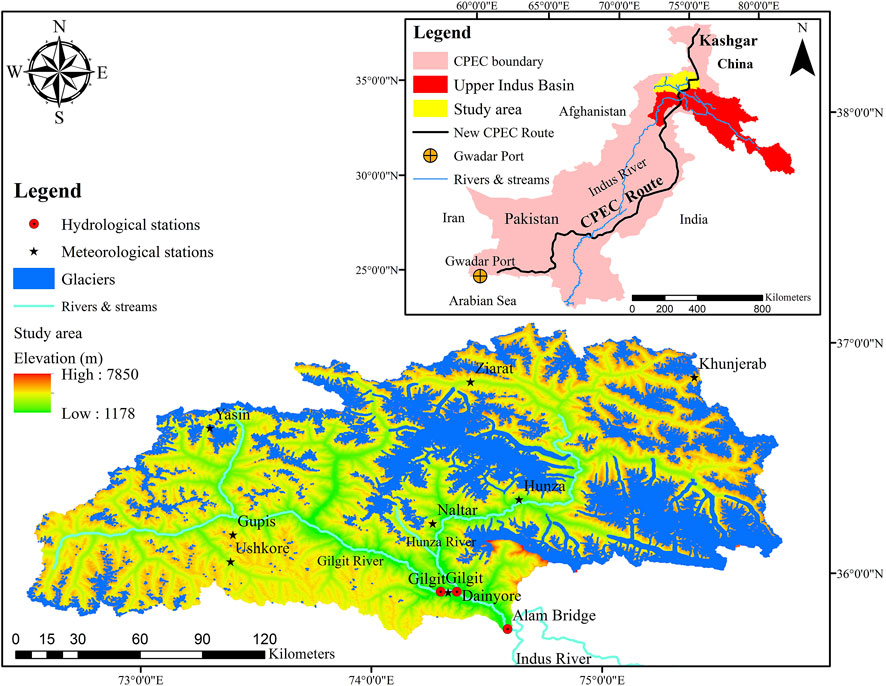
FIGURE 1. The geographical location of the study area.
To fill the gaps in previous studies, the current study will employ the University of British Columbia Watershed Model (UBC WM) to simulate the runoff components of the Gilgit River basin. The UBC WM is capable of simulating the separate contributions of snowmelt, glacier melt, rainfall-runoff, and baseflow to streamflows. The main objectives of this study include: 1) to calibrate and validate the UBC WM and to identify the sensitive parameters to streamflows, 2) to investigate the response of runoff, runoff components, and climatic variables to climate change, and 3) to estimate the spatiotemporal variations in relative contributions of runoff components to the streamflows of the Gilgit River.
The Gilgit River basin is the sub-catchment of the UIB located in the western part of the Karakoram mountain range (Figure 1). The Gilgit River basin is stretched between latitude 35.71°–37.09°N and longitude 72.51°–75.78°E and has a mean elevation of 4230 m (Hussain et al., 2019). The drainage area of the Gilgit River basin is 27,272 km2 whereas the area of glaciers in the Gilgit River basin is about 5456 km2 which covers nearly 20% part of the total area of the basin. There are 8 meteorological stations such as Gilgit, Gupis, Yasin, Ushkore, Hunza, Naltar, Khunjerab, and Ziarat, and 3 stream gauging stations such as Gilgit, Dainyore, and Alam Bridge in the Gilgit River basin (Figure 1).
The area elevation curve displayed that the major part of the basin i.e., nearly 46% exists between elevations 4000–5000 m as shown in Supplementary Figure S1. The Hunza River flows from north to south while the Gilgit River flows from the northwest to southeast before joining together at Alam Bridge just downstream of Gilgit town. The Gilgit River joins the Indus River at Bunji/Partab Bridge in Jaglot town. The basin snow cover area in winter varies from 70% to 80% whereas in summer it decreases to 20%–30%. According to the streamflows data from 1981 to 2015, the Gilgit River mean annual discharge at the Alam Bridge gauging station was about 617 m3/s. The minimum value of discharge observed at Alam Bridge was about 66.1 m³/s while the maximum discharge was observed at 4834 m³/s during the specified period. Moreover, ∼26% of the total runoff volume of the Gilgit River is contributed to the Indus River in July and ∼24% in August (Supplementary Table S1). The study area falls in the cold desert climate system (Adnan et al., 2017). There are two climatic fronts responsible for the precipitation in this region; the monsoon (which originates from the Bay of Bengal in summer) and the westerlies (which originates from the Caspian Sea and Mediterranean region during winters and springs). Most of the annual precipitation falls in winter and spring in the form of snow because of westerly disturbances (Hewitt, 2011; Ul Hussan et al., 2020).
Variations in monthly average precipitation of the Gilgit River basin with respect to altitude are displayed in Figure 2A. Figure 2A shows that low altitude stations such as Gilgit and Gupis receive maximum monthly precipitation in the spring season (March–May) while high altitude stations such as Ziarat and Khunjerab receive the maximum amount of precipitation in July and August. Variations in monthly average temperature with respect to altitude are displayed in Figure 2B. Figure 2B showed that the lowest monthly average temperature was observed in January and the highest in July and August at all meteorological stations of the Gilgit River basin. The highest monthly average temperature from low (Gilgit) to high (Khunjerab) altitude station varies from 26.5 to 5.6°C in July whereas the lowest temperature varies from 3.8 (Gilgit) to −16.7°C (Khunjerab) in January (Figure 2B).
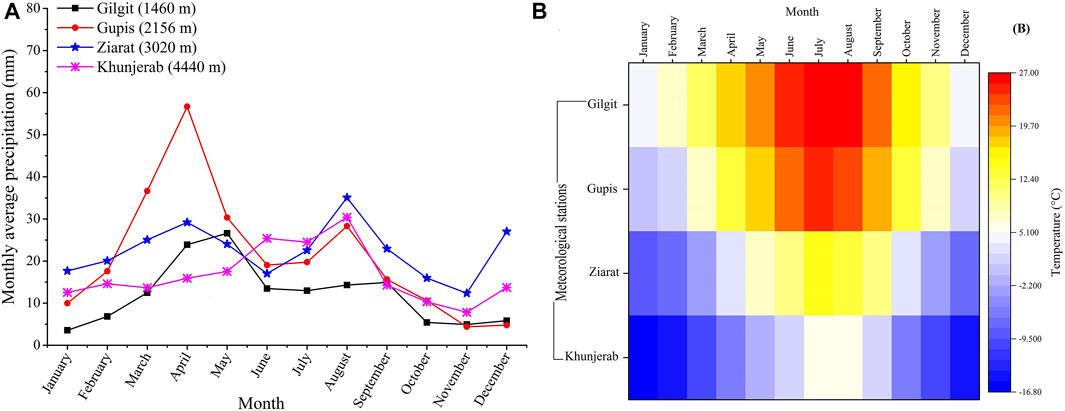
FIGURE 2. Variations in monthly average, (A) precipitation, and (B) Temperature with respect to altitude in the Gilgit River basin.
According to the data record from 1998 to 2012, the maximum relative humidity in the eastern part (Hunza) of the Gilgit River basin varies from 59% (March) to 91% (August) whereas the minimum relative humidity varies from 23% (March) to 52% (December). The basin receives a large number of solar radiation in May (5148 W/m2) and small numbers of solar radiation in December (2563 W/m2) (Adnan et al., 2021). The land-cover classification of the Gilgit River basin is displayed in Supplementary Figure S2. The study area was reclassified into seven major classes. The main land-cover class of the Gilgit basin is bare soil/rock (48.8%) followed by snow/glaciers (31.4%), alpine grasses and shrubs (17.4%), and agricultural land (1.34%). The minor land cover classes include dense & sparse coniferous and mixed forests (0.82%) while water bodies (0.25%) of the basin as given in Supplementary Figure S2.
The data sets used in the current study are displayed in Table 1. Their detailed description is given below:
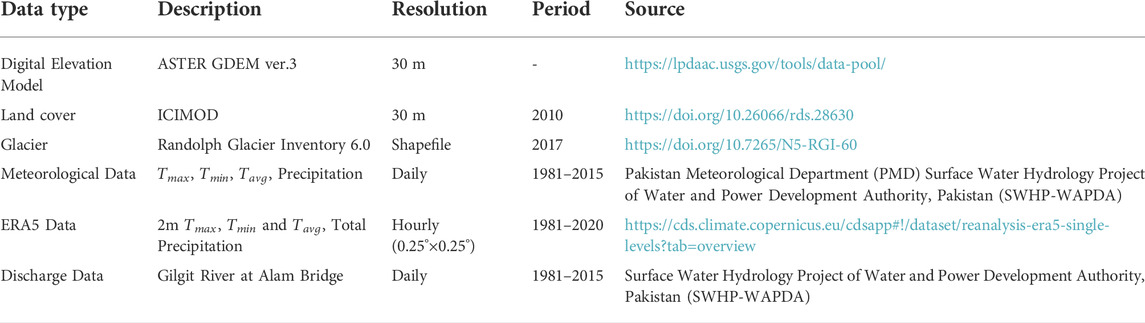
TABLE 1. List of datasets used in the current study.
The Advanced Spaceborne Thermal Emission and Reflection Radiometer (ASTER), Global Digital Elevation Model (GDEM) was used for delineation of the catchment boundary of the Gilgit River basin. The ASTER GDEM version-3 data was acquired from the website: https://lpdaacusgs.gov/tools/data-pool/. The grid resolution of the GDEM was 30 m and tiles were in Geo-TIFF format. The terrain features of the study area are described in Supplementary Table S2. The glaciers data were taken from the Randolph Glacier Inventory 6.0 repository and Pakistan’s land cover data of 30 m grid resolution was acquired from the International Centre for Integrated Mountain Development (ICIMOD) data archive as listed in Supplementary Table S2.
The DEM was divided into 8 elevation zones. The elevation of the study area ranges from 1178 to 7850 m. Overall, 20% of the Gilgit River basin is covered by glaciers. About 45.78% (or 2496 km2) of the total glacier area is located between elevations 4514 and 5328 m whereas nearly 27.4% of the total glacier area is located between elevations 5348 and 6182 m (Supplementary Table S2).
The daily streamflows and meteorological data were acquired from the Surface Water Hydrology Project of Water and Power Development Authority, Pakistan (SWHP-WAPDA) and Pakistan Meteorological Department (PMD) for the period 1981–2015 (Table 2). The daily meteorological data includes minimum and maximum temperature, average temperature, and precipitation. The daily data of 4 meteorological stations located in the Gilgit River basin and streamflow data of the Gilgit River at the Alam Bridge gauging station were used in the current study (Table 2). ERA5 hourly data (0.25° grid resolution) of precipitation and minimum, maximum, and mean temperature was downloaded from the “Copernicus Climate Date Store” from 1981 to 2020 to fill the gaps of missing values in the observed meteorological data. The time series ERA5 precipitation data were bias-corrected by an empirical relation presented by Sperna Weiland et al. (2010) given below:
where
Where
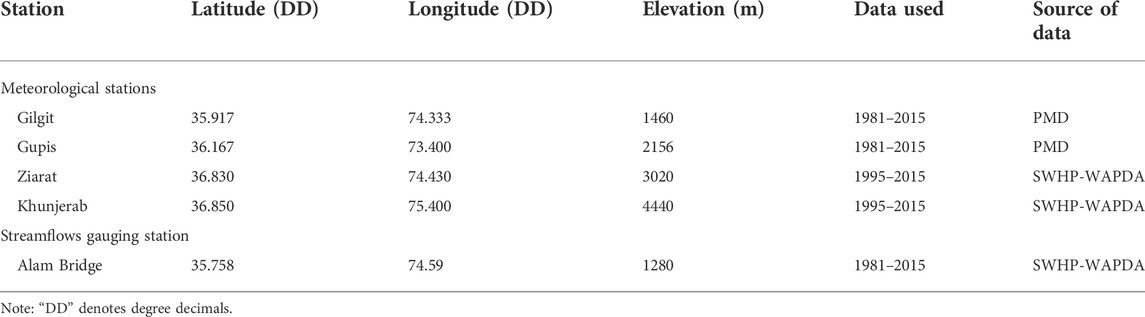
TABLE 2. List of hydro-meteorological stations used in the study.
The current study has employed UBC WM to study the runoff and runoff components feature with reference to climate change in the Gilgit River basin. A detailed description of this model is explained below.
The UBC WM was initially developed by Quick and Pipes (1973) in British Columbia for daily streamflows forecasting of the Fraser River system. The process flow diagram of the UBC WM is displayed in Supplementary Figure S3. The model was originally developed for streamflow forecasting from the mountain catchments therefore the concept of area-elevation bands was introduced in it. The model uses observed hourly or daily minimum and maximum temperature, precipitation, and streamflows data for the estimation of simulated runoff and snowpack accumulation and depletion. The sub-division of runoff such as fast, medium, slow, and very slow is controlled by soil moisture and groundwater characteristics, and various components of runoff are routed to the stream by using storage routing systems and unit hydrographs. Moreover, the watershed model is suitable for the estimation of the total contribution from snow and glacial melt as well as rainfall-runoff and baseflow/groundwater in alpine catchments. The amount of rain and snowmelt input to each watershed band is further sub-divided based on priority. The priority is to satisfy the soil moisture deficit which is continuously depleted due to variation in evaporation demand. The model uses an energy balance approach instead of the degree-day method for the calculation of snowmelt however this approach is suitable when more detailed radiation, albedo, and wind speed data is provided to the model as input. This energy balance approach is simplified when only temperature data is given as input to the model. The model can be applied to catchments of any size ranging from a few square kilometers to several thousand square kilometers (Quick and Pipes, 1973).
In UBC WM, the watershed can be divided up into 12 elevation bands however selection of 4–8 bands is ideal. And the physical features of the catchment such as mean band area, mean band elevation, glacier area, north-south orientation, forested area, forest density, and an impermeable fraction of soil are defined distinctly for each elevation band under the set of variable parameters. The daily data of precipitation, streamflows, and minimum and maximum temperature is used as input in UBC WM. The precipitation distribution and snowmelt rate at different elevations are controlled in the model by the temperature lapse rate. Moreover, the precipitation inputs depend on temperature and elevation systems. In other words, the area-elevation band theory is used by the model to deal with the orographic gradient of precipitation and temperature. The UBC WM extrapolates the point measures of temperature and precipitation data to the mid-elevation of each elevation band of the watershed. Moreover, this model also controls the glacier extent and snow melting cover area. The UBC WM includes three sub-models.
The first model is associated with meteorological data and it extrapolates the point measures of temperature and precipitation data to the mid-elevation of each elevation band of the watershed. Moreover, this model also controls the glacier extent and snow melting cover area.
The second model is associated with the soil moisture and it divides the catchment runoff into four parts such as fast (surface runoff), medium (interflow), slow (upper groundwater), and very slow (deep groundwater).
In the routing model, water allocated to each of the components of runoff, namely fast, medium, slow, and very slow components are subjected to a routing procedure that produces a time distribution runoff. The routing procedure for each component is based on the same underlying concept, namely the linear storage reservoir. In linear storage reservoir theory, the storage of a linear reservoir is linearly related to the output via the storage constant which is also known as the time constant. The basic equation is given below:
In Eq. 3, S represents the storage in the reservoir, k denotes the time constant while q denotes the outflow from the reservoir (dimension = length/time).
This theory is based on certain assumptions where a given precipitation excess can be routed through a series of linear reservoirs where the outflow from the first reservoir is being taken as the inflow to the second, and so on. However, the last reservoir is taken as the overall response of the watershed to the precipitation excess input. This model generates the distribution of runoff components.
The output file of the UBC WM includes simulated total runoff, snowmelt, glacier melt, rainfall-runoff, and baseflow/groundwater. In order to calculate the relative contribution of each runoff component, we have added up all the runoff components to get the total runoff, and then by simple calculation, we have determined the relative contribution of each runoff component (in percentage) to the total runoff. The output file of UBC WM also provides information about the relative contribution of runoff components from different elevation bands. Similarly, we have added up the contribution of runoff components from 8 elevation bands and then by simple calculation, we have calculated the relative contribution of each runoff component (in percentage) from individual elevation bands separately. The contribution of glacier melt runoff to total runoff varies with respect to the percentage of glacier cover area within each elevation band.
In UBC WM, there is a limitation to using 1–5 meteorological station data as input to force the hydrological model. So for the preparation of forcing data, we have selected four meteorological stations of the Gilgit River basin installed at low to high elevations (Gilgit, 1460 m; Gupis, 2156 m; Ziarat, 3020 m; Khunjerab, 4440 m) to represent the meteorological characteristics of the whole basin. The UBC WM was divided into 8 elevation bands and 4 aspect classes as shown in Supplementary Figure S4. The mean elevation, band area, glacier area, forest density, canopy, impermeable area, and north/south orientation of each elevation band were determined. Daily maximum and minimum temperature, precipitation, and streamflow data were prepared according to model format and then input to UBC WM for simulation of streamflows.
The UBC WM was calibrated for the period 1981–2000 and validated for the period 2001–2015. The UBC WM was run to forecast streamflows from 2016 to 2020 in the absence of observed streamflows data for this period. In UBC WM, the parameters were optimized after running three iterations (or 4500 simulations). The UBC model was calibrated over the Gilgit River basin with a set of 26 parameters listed in Supplementary Table S3. In the UBC model, the calibration procedure involves three stages. In stage one calibration, the parameters related to precipitation were calibrated whereas in stage two the parameters related to water were calibrated. Stage three involves the calibration of routing parameters (Supplementary Table S3). The parameters related to precipitation (E0LMID, E0LHI, P0SREP, P0RREP, P0GRADL, P0GRADM), water (P0PERC, P0DZSH, P0AGEN, C0IMPA), and routing (V0FLAS, P0DZTK, P0UGTK) were found more sensitive during calibration. Few other parameters such as indexes for temperature and precipitation lapse rates (IGRADP, LAPSER) and potential evapotranspiration factor (AOEDDF) were also found sensitive during calibration.
The performance of simulated streamflows against observed streamflows for UBC WM was evaluated by using statistical indices such as the Nash–Sutcliffe efficiency (NSE), the coefficient of determination (R2) (Nash and Sutcliffe, 1970), and correlation coefficient (CC). The mathematical representation of these statistical indices is given in Eqs 4–6;
Where,
Climate change has significantly impacted the hydrological regime of UIB, Pakistan. Figure 3 represents the anomalies of annual mean temperature, annual precipitation from 1981 to 2020, and annual maximum, minimum, and mean discharge from 1981 to 2015 in the Gilgit River basin. Figure 3A displayed that the annual mean temperature exhibited an increasing trend since 2000 while an abrupt change was observed from 2006 to onward. Trend analysis displayed that the annual mean temperature in the Gilgit River basin is increasing with a magnitude of 0.24°C/decade. The annual precipitation anomaly has displayed mix trend before 2010 but it had displayed a significantly increasing trend from 2010 to onward as shown in Figure 3B. Trend analysis revealed that annual precipitation in the Gilgit River basin is increasing with a change rate of 8.7 mm/decade. It has been observed more increase in high altitude precipitation as compared to low altitude precipitation in the Gilgit River basin. Figure 3C showed the anomaly of annual maximum discharges in the Gilgit River basin at Alam Bridge gauging station. It has been observed to increase in annual maximum discharge anomaly from 1981 to 1994 but it was found to decline in maximum discharge anomaly from 1995 to 2004 and then observed an increase from 2005 to 2013. Moreover, it has been observed an increase in the annual minimum discharge anomaly since 2008 as represented in Figure 3D.
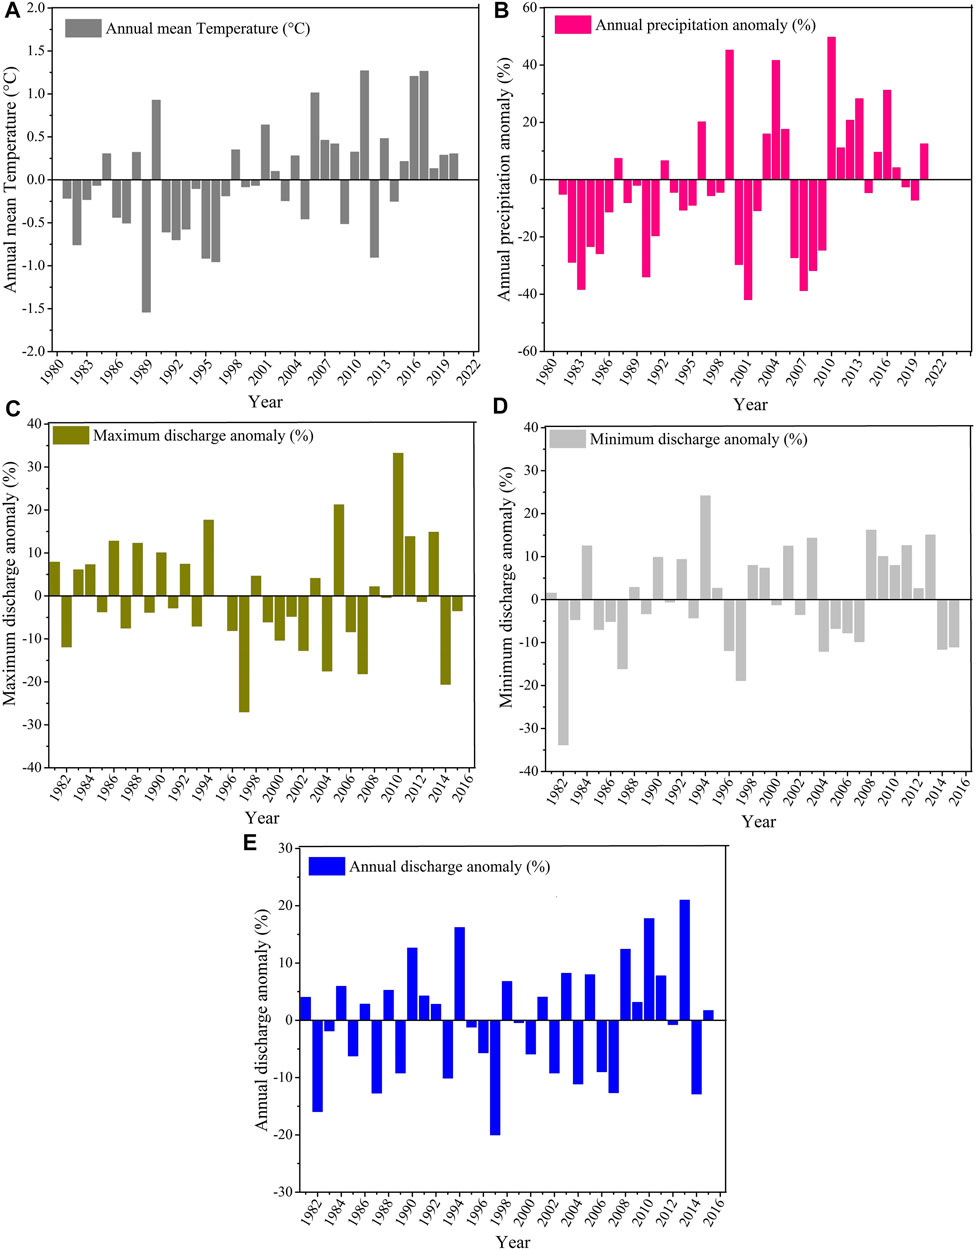
FIGURE 3. Regional anomalies of hydro-meteorological variables of the Gilgit River basin.
The mean annual discharge anomaly of the Gilgit River also displayed an increasing trend with a magnitude of 1.1 m³/s from 1981 to 2015 as shown in Figure 3E. Figure 3E showed that mean annual discharge began to increase from the year 1998 while a substantial increase in discharge was observed from the year 2008 to onward. A study conducted by Li et al. (2021) has also observed an increasing trend in the discharge of HMA’s Rivers from the year 1998 to onward.
The UBC WM was successfully calibrated (1981–2000) and validated (2001–2015) against observed streamflows of Gilgit River at Alam Bridge as shown in Figures 4, 5, respectively. In the absence of observed streamflows data, the UBC WM also successfully forecasted streamflows of the Gilgit River from 2016 to 2020 as shown in Figure 5A. The statistical indices for calibration (R2 = 0.90, NSE = 0.87, and CC = 0.95) and validation (R2 = 0.86, NSE = 0.83, and CC = 0.92) displayed that UBC WM performed satisfactory at Gilgit River basin. During calibration and validation periods, the model successfully simulated low and peak flows very well.
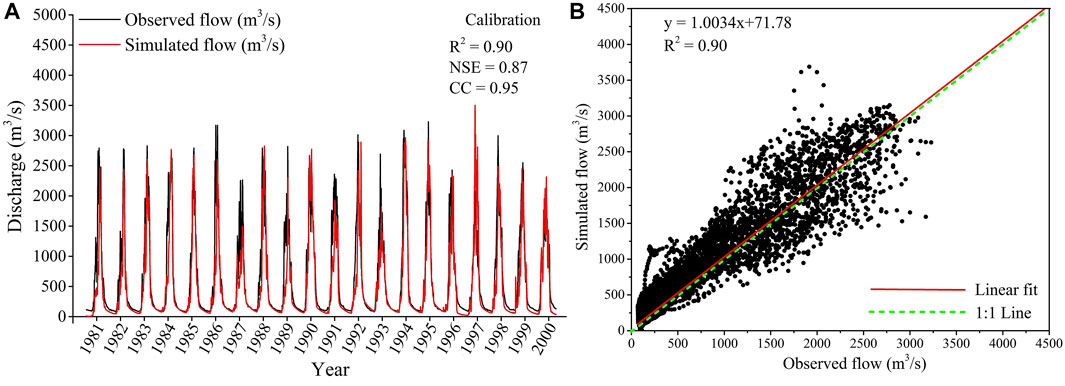
FIGURE 4. (A) Calibration of UBC WM from 1981 to 2000 at Alam Bridge gauging station; (B) Scatter plot between observed and simulated streamflows during the calibration period.
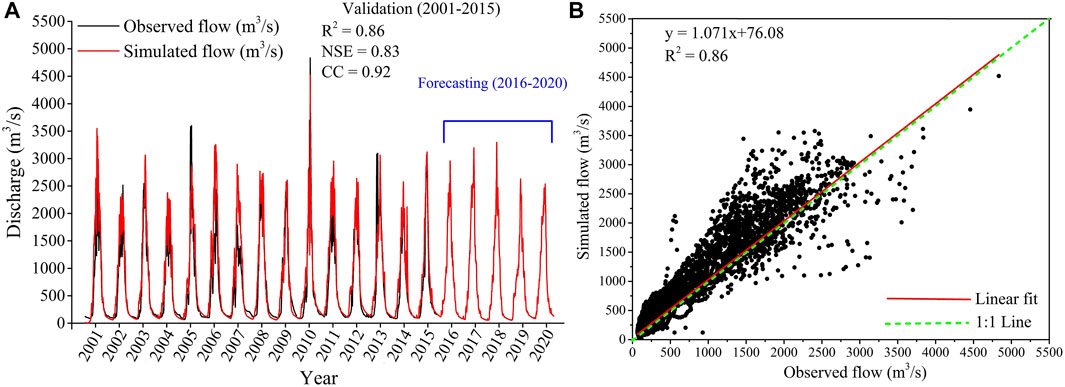
FIGURE 5. (A) Validation of UBC WM from 2001 to 2015 at Alam Bridge gauging station; (B) Scatter plot between observed and simulated streamflows during the validation period.
The scatter plot diagrams (Figures 4B, 5B) also displayed a good correlation between observed and simulated streamflows during both calibration and validation periods.
The performance of UBC WM was also evaluated by comparing the observed and simulated streamflows (i.e., from 1981 to 2015) on a monthly time scale as shown in Figure 6. The model perfectly simulated low and high flows (Figure 6A). The scatter plot also displayed a good correlation (i.e., R2 = 0.98) between observed and simulated streamflows as shown in Figure 6B.
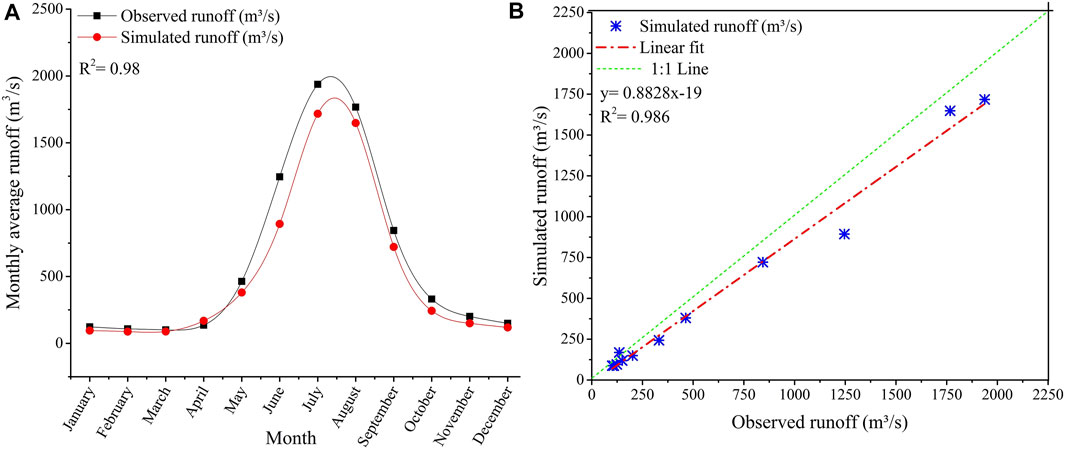
FIGURE 6. (A) Performance evaluation of UBC WM at a monthly time scale; (B) Scatter plot between observed and simulated streamflows at the monthly time scale.
The total runoff obtained from the UBC WM is composed of four components such as glacier melt, snowmelt, baseflow, and rainfall-runoff. Amongst them, the baseflow is mainly generated by the recharge of groundwater from rainfall and glacier meltwater. The four simulated runoff components displayed different responses to climate change and there have been observed interannual variations in each runoff component from 1981 to 2020 as shown in Figure 7. It has been observed an increasing trend in snowmelt runoff with a magnitude of 0.40 m3/s per year from 1981 to 2020. It was found significant increase in snowmelt runoff from 2008 to onward as shown in Figure 7A. However, it has been observed a substantial increase in glacier melt runoff from 1981 to 2020 as shown in Figure 7B. The trend analysis showed an increase of 0.63 m3/s per year in glacier melt runoff. Figure 7B showed that glacier melt runoff had significantly increased from 1981 to 2008 and then observed a slightly decreasing trend from 2009 to 2016 and after that, it was found to be increased. Figure 7C displayed an increasing trend in simulated rainfall-runoff with a magnitude of 0.30 m3/s per year from 1981 to 2020. The rainfall-runoff was found to be significantly increased from 2010 onward. Similarly, it has been observed an increasing trend in baseflow with a magnitude of 1.48 m3/s per year from 1981 to 2020 as shown in Figure 7D. The interannual variations in baseflow were found quite analog to snowmelt runoff and rainfall-runoff. It was observed relatively low baseflow during 1996–2001 while it significantly increased from 2002 to onward.
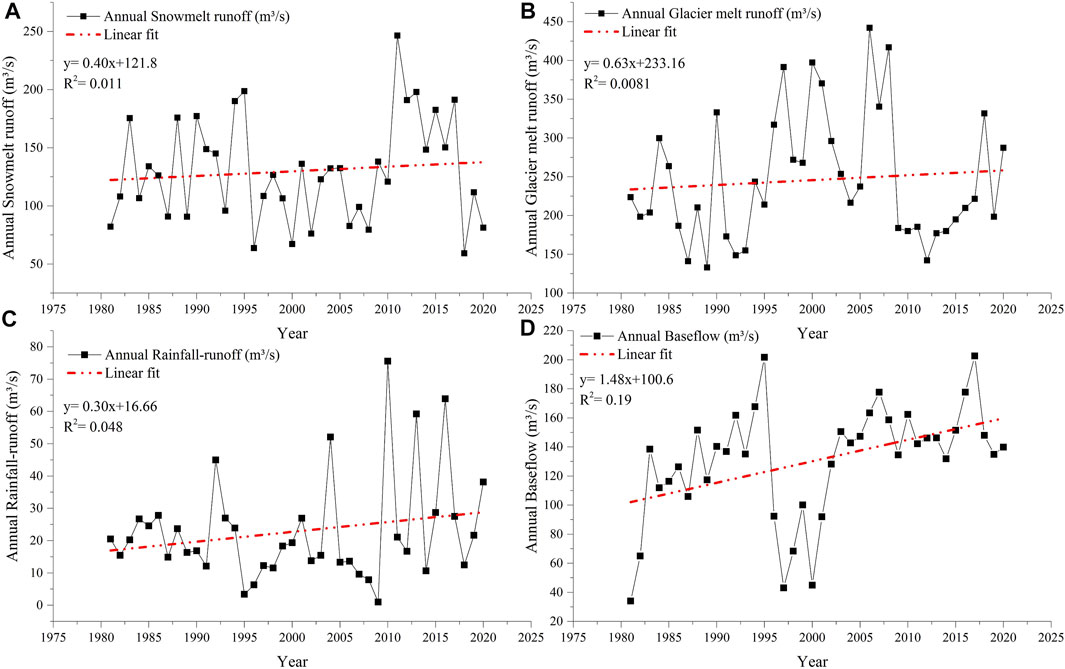
FIGURE 7. Temporal variations in simulated runoff components of Gilgit River from 1981 to 2020.
Variations in simulated runoff components at the monthly time scale are represented in Figure 8A. It showed that glacier melt runoff is dominant in the Gilgit River basin followed by snowmelt, baseflow, and rainfall runoff. In terms of runoff amount; snowmelt runoff is contributed between April and September and reaches its peak in July while glacier melt runoff is contributed between April and October and reaches its peak in August in the Gilgit River basin. Similarly, rainfall-runoff contribution reaches its peak in August whereas baseflow reaches its peak in July and August because it is largely dependent on rainfall-runoff and recharge from glacier melt. Overall, nearly 26%–27% of total runoff is generated in July and approximately 66%–70% of total runoff of Gilgit River is generated between June and August as shown in Figure 8A.
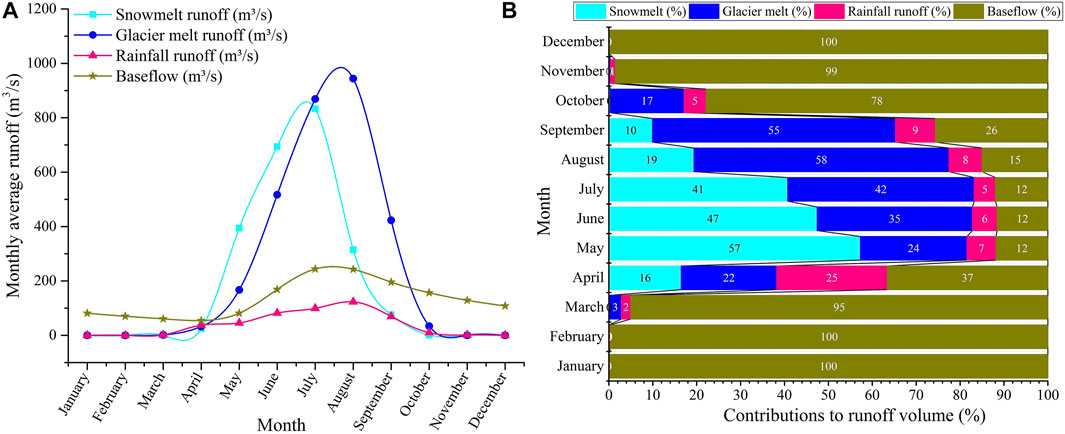
FIGURE 8. (A) Monthly variations in simulated runoff components and, (B) Relative contribution of runoff components to streamflows at the monthly time scale.
Figure 8B shows the relative contribution of runoff components to streamflows of the Gilgit River simulated by UBC WM. It was observed that the relative contribution of baseflow was found dominant over snowmelt, glacier melt, and rainfall-runoff in winter (October–April) whereas it was found low during summer (May–August) because of the rise in snow and glacier melt runoff. From April to June, the relative contribution of snowmelt runoff to the total runoff of the Gilgit River was observed dominant over glacier melt while glacier melt contribution to the total runoff was found dominant over snowmelt from July to October. However, the relative contribution of rainfall-runoff to total runoff of the Gilgit River was found dominant in April because low-altitude areas of the basin receive a large amount of precipitation in the form of rainfall during this month (Figure 8B).
The annual variations in runoff components of the Gilgit River simulated by UBC WM for the calibration period (1981–2000) are displayed in Figure 9. Figure 9A shows the annual variations in simulated runoff components from 1981 to 2000. On average (i.e., from 1981 to 2000), the UBC WM has simulated that the major contributor to the total runoff of the Gilgit River is glacier melt (48%), followed by snowmelt (25%), baseflow (23%), and rainfall-runoff (4%) as shown in Figure 9B. The interannual analysis showed that the relative contribution of snowmelt, glaciers melt, rainfall, and baseflow runoff varied from 13% to 33%, 30% to 75%, 1% to 9%, and 8% to 33%, respectively, from 1981 to 2000. The maximum contribution of snowmelt, glacier melt, rainfall, and baseflow runoff was observed in the years 1983, 2000, 1992, and 1989–1993–1995, respectively (Figure 9B).
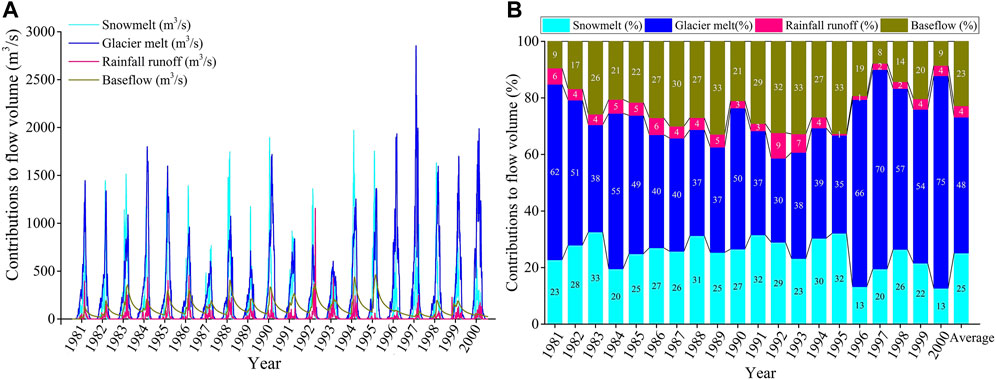
FIGURE 9. (A) Annual variations in simulated runoff components from 1981 to 2000 and, (B) Relative contribution of runoff components to streamflows at the annual time scale.
The annual relative contribution of runoff components to the total runoff of the Gilgit River during the validation period (2001–2020) is presented in Figure 10. Figure 10A shows the annual variations in simulated runoff components from 2001 to 2020. It was observed that on average (i.e., from 2001 to 2020), the relative contribution of glacier melt, snowmelt, baseflow, and rainfall-runoff to the total runoff of the Gilgit River was 45%, 24%, 27%, and 5%, respectively (Figure 10B). The Interannual analysis displayed that the relative contribution of snowmelt, glacier melt, rainfall-runoff, and baseflow to the total runoff of the Gilgit River varied from 11% to 41%, 29% to 63%, 1% to 14%, and 15% to 32%, respectively, during 2001–2020. The maximum contribution of snowmelt, glacier melt, rainfall, and baseflow runoff was observed in the year 2011, 2008, 2010, and 2017, respectively (Figure 10B).
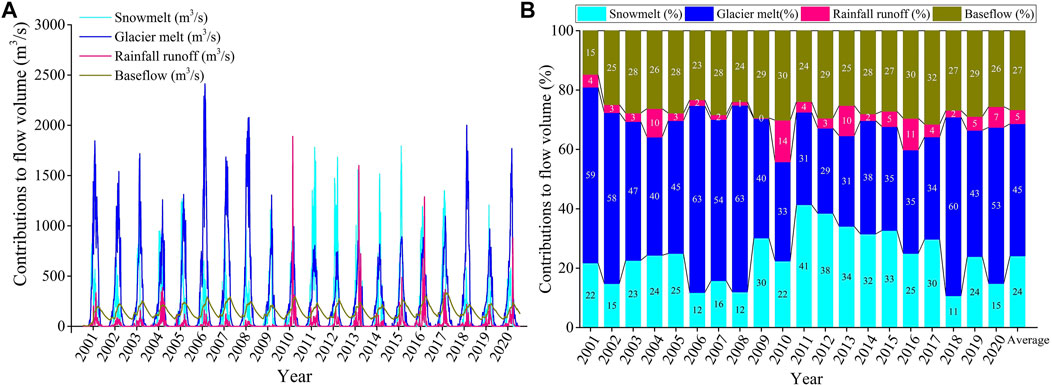
FIGURE 10. (A) Annual variations in simulated runoff components from 2001 to 2020 and, (B) Relative contribution of runoff components to streamflows at the annual time scale.
The relative contribution of runoff components in different seasons simulated by UBC WM is shown in Figure 11. It was observed that relative contributions of snowmelt, glacier melt, rainfall-runoff, and baseflow were 30%, 45%, 7%, and 18%, respectively to the total summer (April–September) runoff and 3%, 1%, 46%, and 50%, respectively to the total winter (October–March) runoff of the Gilgit River as presented in Figure 11A. Overall, it was observed from the analysis that on average, 86% part of the total annual runoff is contributed to the Gilgit River in the summer (April–September) season while only 14% is contributed in winter (October–March).
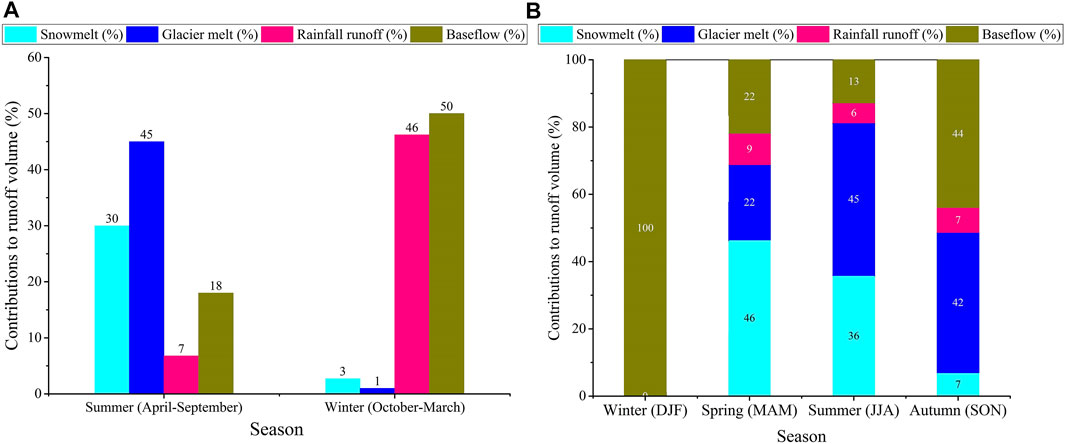
FIGURE 11. Relative contribution of runoff components to streamflows in different seasons.
The relative contribution of runoff components was further investigated in detail at a seasonal scale as shown in Figure 11B. It was observed that in winter (DJF), the baseflow contribution to total winter runoff was found dominant (i.e., nearly 100%) while in spring (MAM) season; the snowmelt runoff contribution to the total runoff was found more dominant than other runoff components as shown in Figure 11B. However, in the summer (JJA) season, the glaciers’ melt runoff contribution to the total runoff was found dominant followed by snowmelt, baseflow, and rainfall-runoff. Moreover, in the autumn (SON) season, the relative contribution of glacier melt and baseflow to the total runoff were found dominant and nearly equal to each other followed by snowmelt and rainfall-runoff as displayed in Figure 11B.
Overall, eight elevation bands of the study area were created in UBC WM settings to estimate the relative contribution of runoff components from individual elevation bands (Figures 12A,B). Figure 12A showed the relative contribution of runoff components from individual elevation bands. It was observed negligible contribution of runoff components from the first elevation band (1178–2012 m) while in the second elevation band (2012–2846 m); the contribution of glacier melt runoff was found significant followed by rainfall-runoff and baseflow. In the third elevation band (2846–3680 m), the major contribution of runoff was due to glacier melt followed by rainfall, baseflow, and snowmelt runoff. In the fourth elevation band (3680–4514 m), the glaciers’ melt runoff contribution to the total runoff was dominant followed by baseflow, snowmelt, and rainfall-runoff. The fifth elevation band (4514–5348 m) was found as a major contributor of runoff to the total runoff of the Gilgit River. All the runoff components contribute the maximum amount of runoff from the fifth elevation band (Figure 12A). The glacier melt contribution above the fifth elevation band is zero while the snowmelt contribution becomes zero above the seventh elevation band (6182–7016 m). The runoff contribution from the eighth elevation band (7016–7850 m) was observed at zero as shown in Figure 12A.
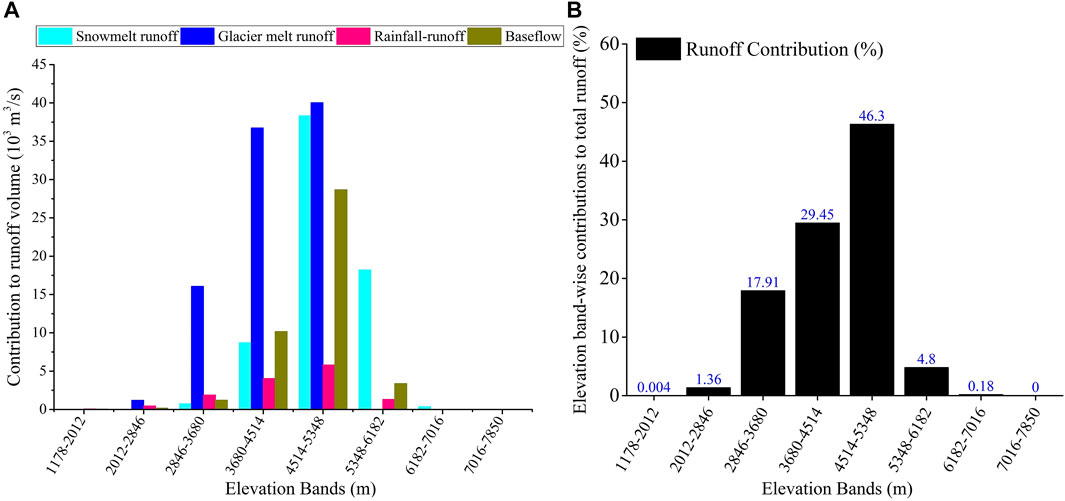
FIGURE 12. Relative contribution of, (A) runoff components and, (B) runoff to streamflows from different altitudes.
Figure 12B showed the relative contribution of total runoff from individual elevation bands of the Gilgit River basin. It can be seen that the relative contribution of runoff from the first elevation band (1178–2012) m was <1% while it was ∼1.4% from the second elevation band (2012–846) m. The major part of the total runoff nearly 46.3% is contributed from the fifth elevation band (4514–5348) m. In total, approximately 76% of the total runoff of the Gilgit River basin is generated between elevation ranges of 3680–5348 m whereas nearly 5% of the total runoff is generated at an elevation >5348 m and 19% < 3680 m as shown in Figure 12B.
Temporal variations in groundwater contribution from soil upper and deep zone to streamflows at monthly and annual time scales are presented in Figures 13A,B. In UBC WM, the groundwater percolates into the soil and is divided into two components by the soil moisture model: 1) slow; which is an upper zone component, and, 2) very slow; which is a lower zone component. Both of these groundwater components are routed using a single linear reservoir which accumulates each day’s inflow and releases a fixed percentage of the total storage each day. Figure 13A showed that groundwater contribution from the soil lower zone was greater than soil upper zone from January to December. It can be seen from Figure 13A that the maximum amount of groundwater was contributed to streamflows from the soil upper zone in July and August because of groundwater recharge from rainfall-runoff and glacier melt. Figure 13B displayed the interannual variations of groundwater contribution from soil upper and lower zone to the streamflows of Gilgit River from 1981 to 2020. It was observed that the groundwater contribution from soil upper zone to streamflows varied from 3% to 42.5% whereas from soil lower zone it varied from 57% to 97% from 1981 to 2020. On average (i.e., from 1981 to 2020), approximately 24% of groundwater is contributed to streamflows from the soil’s upper zone while 76% is contributed from the soil’s lower zone as shown in Figure 13B.
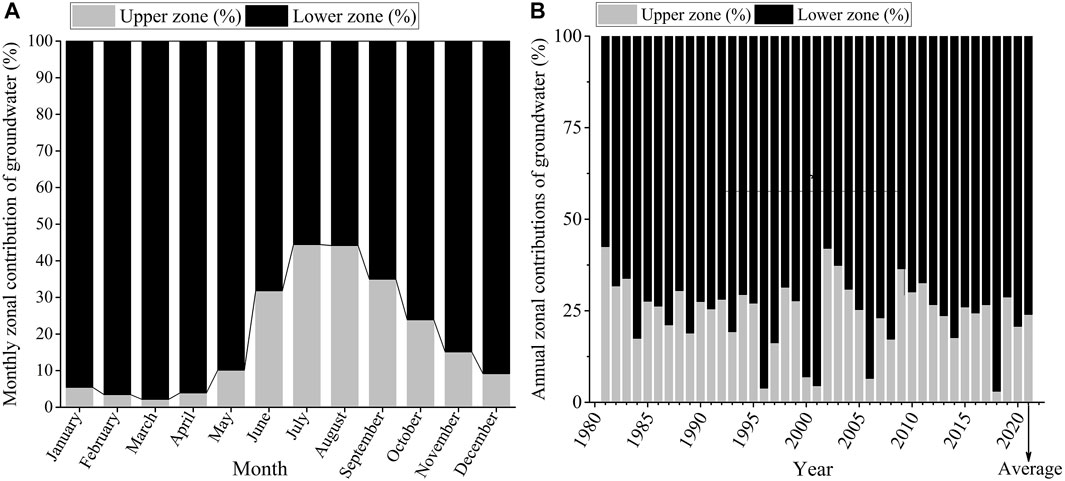
FIGURE 13. Temporal variations in groundwater contribution from soil upper and deep zone to streamflows, (A) at monthly time scale; (B) at the annual time scale.
The current study focuses on investigating the long-term variations in runoff and runoff components of the Gilgit River in response to climate change simulated by UBC WM. This study is unique because it investigates the long-term variations in simulated runoff components at a spatiotemporal scale which were missing in previous studies. A few previous studies (Tahir et al., 2011; Adnan et al., 2017; Hayat et al., 2019; Latif et al., 2020) simulated the streamflows of the Gilgit River basin at Gilgit by using the SRM and other researchers (i.e., Garee et al., 2017; Khan et al., 2020) simulated streamflows of the Hunza River basin at Dainyor by using the SWAT model which lacks glacier module. Moreover, another study conducted by Hussain et al. (2019) studied the cryosphere dynamics and its implications on Gilgit River runoff at Alam Bridge by using MODIS and observed hydro-meteorological data. The previous studies did not investigate the hydrological characteristics of the Gilgit River basin in detail and failed to describe the spatiotemporal variations in runoff components especially, in glacier melt runoff and baseflow.
The current study employed UBC WM for simulating the runoff and runoff components from 1981 to 2020. The model was successfully calibrated (1981–2000) and validated (2001–2015) against observed streamflows of the Gilgit River and both low and peak flows were captured very well by the hydrological model. The UBC WM also performed well at the monthly time scale and there was observed good correction between observed and simulated streamflows with R2 = 0.98. However, a similar study conducted by Ali et al. (2018) simulated streamflows of the Hunza River basin from 1995 to 2010 by the HBV model. There was found poor correlation between observed and simulated streamflows, especially in 1997 and from 2005 to 2010 and the model did not well capture high flows. Another study conducted by Ismail et al. (2020) used the SRM+G model to simulate the streamflows of the Hunza River but the hydrological model underestimated the streamflows in the first half of the year when snowmelt was dominating whereas it overestimated discharges from July to September when the glacier melt runoff was the dominant factor. Another, hydrological model such as the VIC-Glacier used by (Ismail et al., 2020) underestimated the base flows and overestimated the peak flows of the Hunza River in many of the calibration years (Ismail et al., 2020). Another study conducted by Zhang et al. (2022) used the SPHY model to investigate the response of runoff components to climate change in the source region of the Yellow River on the Tibetan plateau. The model is capable of simulating snowmelt, glacier melt, rainfall-runoff, and baseflow. Overall, the model well captured low flows but failed to capture peak/high flows. However, the UBC model used in our current study well captured both low and peak flows. The UBC WM not only successfully simulated the streamflows of the Gilgit River but also perfectly simulated the separate contribution of runoff components to the total runoff of the Gilgit River. The four simulated runoff components displayed different responses to climate change and there have been observed interannual variations in each runoff component. The trend analysis revealed an increase in all runoff components but it was observed a substantial increase in baseflow, followed by glacier melt, snowmelt, and rainfall-runoff. A similar study conducted by Guo et al. (2022) on the Upper Shule River basin on the northeast Tibetan Plateau observed a substantial increase of 2.14 times in groundwater/baseflow contribution to streamflows from 1954 to 2018 because of an increase in glacier melt, temperature, and precipitation. Likewise, another study conducted by Liu et al. (2009) observed a substantial increase in glacier melt runoff in the source region of the Yangtze River since the 1990’s. Furthermore, the studies conducted by Li et al. (2020 and 2021) also confirmed a substantial increase in annual river flows, glacier melt, and sediment fluxes in major rivers of HMA due to climate change since the 1990s. Moreover, it was observed that from 1981 to 1995, glacier melting and rainfall were mainly responsible for the increase in baseflow contribution whereas from 2010 to onward, an increase in rainfall-runoff was responsible for the rise in baseflow contribution. The interannual variations in baseflow were found quite analog to snowmelt and rainfall-runoff.
The current study has also determined the variations in simulated runoff components and their relative contribution to streamflows of the Gilgit River at a monthly time scale. It was observed that glacier melt runoff was dominant in streamflows of the Gilgit River followed by snowmelt, baseflow, and rainfall-runoff. It was revealed that the snowmelt runoff peak is achieved in July while glacier melt runoff reached its peak in August. Nearly, 26% of total runoff is contributed to the Gilgit River in July whereas 66%–70% of total runoff is contributed from June to August. In the case of the relative contribution of runoff components to the total runoff, the baseflow contribution was found dominant in autumn (SON) and winter (DJF) months while rainfall-runoff contribution was observed dominantly in April streamflows of Gilgit River. The snowmelt runoff contribution to the streamflows of the Gilgit River was observed dominantly in May and June while glaciers melt contribution was found dominant from July to September. A study conducted by Mukhopadhyay and Khan (2015a) also observed that glacier melt contribution was dominant in August and September in the Gilgit River basin. Moreover, the current study has a good correlation with the study conducted by Ali et al. (2018) on the Hunza River. They also observed the maximum contribution of snowmelt to streamflows in May and June and glaciers melt to streamflows in July and August. Similarly, another study conducted by Mukhopadhyay and Khan (2014) observed maximum contribution of snow and glacier melt to the streamflows of Gilgit River in July and August whereas baseflow was found dominant in winter (October–March) which is consistent with our study.
The temporal variations of simulated runoff components and their relative contribution to the streamflows of the Gilgit River were also analyzed at an annual time scale from 1981 to 2020. It was found large inter-annual variability in the relative contribution of runoff components. It was observed that on average (i.e., from 1981 to 2020), the relative contribution of snowmelt, glacier melt, rainfall-runoff, and baseflow to the total runoff of the Gilgit River was 25%, 46%, 5%, and 24%, respectively. Moreover, it was unveiled that the interannual contribution of snowmelt, glacier melt, rainfall-runoff, and baseflow to the streamflows of Gilgit River varied from 13% to 41%, 29% to 75%, 1% to 14%, and 8% to 33%, respectively. Our study results were found consistent with a study conducted by Mukhopadhyay and Khan, (2015a). They observed that glacier melt (36%) is a major contributor to streamflows of the Gilgit River at Alam Bridge followed by snowmelt (35%) and baseflow (29%). Another study conducted by Mukhopadhyay et al. (2015b) observed that glacier melt contribution was dominant, i.e., 43% in Hunza River (a tributary of Gilgit River) followed by snowmelt (31%), and baseflow (26%). However, Lutz et al. (2014 and 2016) observed that the relative contribution of glacier melt to the streamflows of Gilgit River at Alam Bridge ranged from 70% to 80%, followed by snowmelt of 10%–20%, and rainfall of 0%–10%. Our study has a good correlation with their studies because we also observed that glacier melt, snowmelt and rainfall runoff contribution to the streamflows of the Gilgit River varied from 29% to 75%, 13% to 41%, and 1% to 14%, respectively. Similarly, Biemans et al. (2019) also observed that snow and glacier melt combined contribution ranged from 80% to 90% to the streamflows of Gilgit River at Alam Bridge. The results of their study were found consistent with our study.
The relative contribution of runoff components in different seasons was also determined in the Gilgit River basin. It was observed that in winter (DJF) nearly 100% of runoff in Gilgit River is generated as a result of baseflow whereas in spring (MAM) season snowmelt runoff (46%) was found dominant followed by glacier melt (22%), baseflow (22%) and rainfall-runoff (9%). However, in the summer (JJA) season, the glacier melt runoff (45%) was found dominant followed by snowmelt (36%), baseflow (13%), and rainfall-runoff (6%) in the streamflows of the Gilgit River. In the autumn (SON) season, the baseflow (44%) was observed as a major contributor to the streamflows of the Gilgit River followed by glaciers melt (42%), rainfall (7%), and snowmelt (7%). Overall, it was observed that on average; 86% part of the total runoff is contributed in the summer (April–September) season while only 14% is contributed in winter (October–March). The results of our study related to seasonal contributions of runoff components were found consistent with the studies of Mukhopadhyay and Khan (2014) and (2015a). They also observed baseflow as a major contributor in winter (DJF) and autumn’s (October–November) streamflows. They also found that snowmelt contribution was dominant from May to July while glaciers melt contribution was observed dominantly in August and September. All their results have a strong correlation with our study’s results.
The Gilgit River basin was divided into eight elevation bands and the relative contribution of runoff components from each elevation band was determined. It was observed nearly zero contribution of runoff components from the first (1178–2012 m) and eighth (7016–7850 m) elevation bands whereas it starts from the second (2012–2846 m) elevation band and reaches its peak in the fifth (4514–5348 m) elevation band. The fifth elevation band contributes (about 46.3% of total runoff) a major part of runoff to the streamflows of the Gilgit River. Similarly, Mukhopadhyay and Khan (2014) observed a major contribution of runoff (i.e., 41%–54%) from the elevation band (i.e., from 3500 to 5300 m) to the main stem of the Indus. Overall, approximately 76% of the total runoff of the Gilgit River basin is generated between elevations 3680 and 5348 m whereas nearly 19% of the total runoff is generated at an elevation <3680 m. However, only 5% runoff is generated at an elevation >5348 m.
The groundwater contribution from the soil’s upper and deep zone to the streamflows of the Gilgit River was also determined on a monthly and annual time scale. It was observed that groundwater contribution from the soil lower zone was greater than the soil upper zone from January to December. The groundwater contribution from the upper zone gradually increases from May (i.e., from 10%) and reached its peak in July (i.e., 44.4%). The groundwater contribution from the soil upper zone was high in the summer months because of high percolation to the aquifer as a result of the rise in rainfall-runoff and glaciers melting. The other studies conducted by Orlova and Branfireun (2014) and Spencer et al. (2021) have also confirmed that the contribution of water from the soil deep zone is dominant in the dry period while the contribution of water from the soil shallow zone is dominant in the wet season. Moreover, it was observed that deep soils with large storage capacities control the baseflow during dry periods (Shanley et al., 2015; Floriancic et al., 2018). The results of their studies were found consistent with our study. Further analysis revealed that groundwater contribution from soil upper and lower zones varied from 3% to 42.5% and 57% to 97%, respectively from 1981 to 2020. Moreover, it was unveiled that on average (i.e., from 1981 to 2020), about 24% of groundwater is contributed to streamflows from the soil’s upper zone while 76% is contributed from the soil’s lower zone.
Mountain glaciers are an important element in the UIB. Nearly 70%–80% of runoff of the Indus River originated from the melting of seasonal snow and glaciers melt. Pakistan’s agriculture, industry, livelihoods, and large population are highly dependent on the water coming from the Indus River basin. Gilgit River basin being the sub-catchment of the UIB had recently gained more importance because of its topography and water reserves. Moreover, there are many hydropower and construction projects in progress in this region with the cooperation of the Chinese government so this region is very important for both China and Pakistan’s development. However, the construction of more reservoirs is very critical in HMA because of the high vulnerability of disasters related to glacial retreat and detachments, landslides, rock–ice avalanches, debris flows, and GLOFs. Such types of disasters bring a large amount of sediment that can fill up reservoirs and may cause dam failure so sustainable sediment management solutions are required to tackle these issues (Li et al., 2022). Moreover, any change in runoff components of this region will directly impact the streamflows and ultimately water availability in downstream areas. Therefore, the accurate estimation of the runoff and runoff components and their relative contribution to the streamflows is indispensable in this region. However, it is a quite challenging problem to assess and quantify the relative contributions of seasonal snows and glaciers separately along with other runoff components. The current study presents a comprehensive analysis of the hydrological regime of the Gilgit River basin at Alam Bridge which was not investigated in detail in previous research. The main outcomes of this study are given below:
1) The UBC WM model was successfully calibrated (1981–2000) and validated (2001–2015) against observed streamflows of the Gilgit River basin. The model perfectly simulated both low and peak flows and there was found strong correlation between observed and simulated streamflows with R2 = 0.98 at a monthly time scale.
2) The annual mean temperature anomaly exhibited an increasing trend since 2000 whereas an abrupt change was observed from 2006 to onward while the annual precipitation anomaly has displayed a significantly increasing trend from 2010 to onward. However, the mean annual discharge anomaly exhibited an increasing trend since 1998 while an abrupt change was observed from the year 2008 to onward. Moreover, trend analysis of simulated runoff components revealed a significant increase in all runoff components specifically, in baseflow followed by glacier melt, snowmelt, and rainfall-runoff.
3) The temporal analysis of runoff components revealed that on average (i.e., from 1981 to 2020), the relative contributions of snowmelt, glacier melt, rainfall-runoff, and baseflow to the total runoff were 25%, 46%, 5%, and 24%, respectively. However, the seasonal analysis disclosed that about 86% of the total runoff of the Gilgit River basin was contributed in summer (April–September) whereas only 14% in winter (October–March). At spatial scale, about 76% of the total runoff is generated between elevations range (i.e., from 3680 to 5348) m of the Gilgit River basin while nearly 19% of the total runoff is generated at an elevation <3680 m. However, only 5% runoff is generated at an elevation >5348 m.
The raw data supporting the conclusions of this article will be made available by the authors, without undue reservation.
MA: did hydrological modeling, data analysis, and initial draft writing; SL: did conceptualization and supervision; MS: helped in manuscript review and editing; MI: helped in calibration and validation of UBC WM; AFA: helped in methodology section; MAM: helped in the introduction section. All authors equally contributed to the finalization of this manuscript.
This study is supported by the Ministry of Science and Technology of China (grant no. 2021YFE0116800), the National Natural Science Foundation of China (grant no. 42171129), the Second Tibetan Plateau Scientific Expedition and Research Program (STEP, grant no. 2019QZKK0208), and the Research Fund for Introducing Talents of Yunnan University (grant no. YJRC3201702). This study is also supported by Pakistan Science Foundation (grant no. PSF/CRP/Consrm-488) and WWF-PAKISTAN (grant no. SGP-WWF-5090103).
We are thankful to the Surface Water Hydrology Project of the Water and Power Development Authority (SWHP-WAPDA) and the Pakistan Meteorological Department (PMD) for providing the required hydro-meteorological data to conduct this study.
The authors declare that the research was conducted in the absence of any commercial or financial relationships that could be construed as a potential conflict of interest.
All claims expressed in this article are solely those of the authors and do not necessarily represent those of their affiliated organizations, or those of the publisher, the editors and the reviewers. Any product that may be evaluated in this article, or claim that may be made by its manufacturer, is not guaranteed or endorsed by the publisher.
The Supplementary Material for this article can be found online at: https://www.frontiersin.org/articles/10.3389/feart.2022.970349/full#supplementary-material
Adnan, M., Adnan, R. M., Liu, S., Saifullah, M., Latif, Y., and Iqbal, M. (2021). Prediction of relative humidity in a high elevated basin of Western Karakoram by using different machine learning models. Weather Forecast. 59, 1–20. doi:10.5772/intechopen.98226
Adnan, M., Nabi, G., Kang, S., Zhang, G., Adnan, R. M., Anjum, M. N., et al. (2017). Snowmelt runoff modelling under projected climate change patterns in the Gilgit River basin of northern Pakistan. Pol. J. Environ. Stud. 26, 525–542. doi:10.15244/pjoes/66719
Ali, A. F., Xiao, C.-d., Zhang, X.-p., Adnan, M., Iqbal, M., and Khan, G. (2018). Projection of future streamflow of the Hunza River basin, Karakoram range (Pakistan) using HBV hydrological model. J. Mt. Sci. 15, 2218–2235. doi:10.1007/s11629-018-4907-4
Ashraf, A., Naz, R., and Roohi, R. (2012). Glacial Lake outburst flood hazards in hindukush, Karakoram and himalayan ranges of Pakistan: Implications and risk analysis. Geomat. Nat. Hazards Risk 3, 113–132. doi:10.1080/19475705.2011.615344
Azam, M. F., Kargel, J. S., Shea, J. M., Nepal, S., Haritashya, U. K., Srivastava, S., et al. (2021). Glaciohydrology of the himalaya-karakoram. Science 373, eabf3668. doi:10.1126/science.abf3668
Azam, M. F., Wagnon, P., Berthier, E., Vincent, C., Fujita, K., and Kargel, J. S. (2018). Review of the status and mass changes of Himalayan-Karakoram glaciers. J. Glaciol. 64, 61–74. doi:10.1017/jog.2017.86
Biemans, H., Siderius, C., Lutz, A. F., Nepal, S., Ahmad, B., Hassan, T., et al. (2019). Importance of snow and glacier meltwater for agriculture on the Indo-Gangetic Plain. Nat. Sustain. 2, 594–601. doi:10.1038/s41893-019-0305-3
Bolch, T., Kulkarni, A., Kääb, A., Huggel, C., Paul, F., Cogley, J. G., et al. (2012). The state and fate of Himalayan glaciers. Science 336, 310–314. doi:10.1126/science.1215828
Bolch, T. (2019). Past and future glacier changes in the Indus River basin. Indus River Basin, 2019, 85–97. doi:10.1016/B978-0-12-812782-7.00004-7
Bolch, T., Pieczonka, T., Mukherjee, K., and Shea, J. (2017). Brief communication: Glaciers in the Hunza catchment (Karakoram) have been nearly in balance since the 1970s. Cryosphere 11, 531–539. doi:10.5194/tc-11-531-2017
Boral, S., and Sen, I. (2020). Tracing ‘Third Pole’ice meltwater contribution to the Himalayan rivers using oxygen and hydrogen isotopes. Geochem. Perspect. Lett. 13, 48–53. doi:10.7185/geochemlet.2013
Brun, F., Berthier, E., Wagnon, P., Kääb, A., and Treichler, D. (2017). A spatially resolved estimate of High Mountain Asia glacier mass balances from 2000 to 2016. Nat. Geosci. 10, 668–673. doi:10.1038/ngeo2999
Carrivick, J. L., and Tweed, F. S. (2016). A global assessment of the societal impacts of glacier outburst floods. Glob. Planet. Change 144, 1–16. doi:10.1016/j.gloplacha.2016.07.001
Cheng, W. Y., and Steenburgh, W. J. (2007). Strengths and weaknesses of MOS, running-mean bias removal, and Kalman filter techniques for improving model forecasts over the Western United States. Weather Forecast. 22, 1304–1318. doi:10.1175/2007WAF2006084.1
Döll, P., Fiedler, K., and Zhang, J. (2009). Global-scale analysis of river flow alterations due to water withdrawals and reservoirs. Hydrol. Earth Syst. Sci. 13, 2413–2432. doi:10.5194/hess-13-2413-2009
Farhan, S. B., Zhang, Y., Aziz, A., Gao, H., Ma, Y., Kazmi, J., et al. (2020). Assessing the impacts of climate change on the high altitude snow-and glacier-fed hydrological regimes of Astore and Hunza, the sub-catchments of Upper Indus Basin. J. Water Clim. Chang. 11, 479–490. doi:10.2166/wcc.2018.107
Faruqui, N. (1997). Final report to CIDA: Snow and ice hydrology (Pakistan). Ottawa, Canada: International Development Research Center. http://hdl.handle.net/10625/27453.
Floriancic, M. G., van Meerveld, I., Smoorenburg, M., Margreth, M., Naef, F., Kirchner, J. W., et al. (2018). Spatio-temporal variability in contributions to low flows in the high Alpine Poschiavino catchment. Hydrol. Process. 32, 3938–3953. doi:10.1002/hyp.13302
Forsythe, N., Fowler, H. J., Li, X.-F., Blenkinsop, S., and Pritchard, D. (2017). Karakoram temperature and glacial melt driven by regional atmospheric circulation variability. Nat. Clim. Change 7, 664–670. doi:10.1038/nclimate3361
Forsythe, N., Kilsby, C. G., Fowler, H. J., and Archer, D. R. (2010). Assessing climate pressures on glacier-melt and snowmelt-derived runoff in the Hindu Kush-Karakoram sector of the Upper Indus Basin. In Role of Hydrology in Managing Consequences of a Changing Global Environment, Proceedings of 3rd BHS International Symposium, Sep. 2010, Newcastle upon Tyne. doi:10.7558/bhs.2010.ic10
Gao, Y., Liu, S., Qi, M., Xie, F., Wu, K., and Zhu, Y. (2021). glacier-related hazards along the international Karakoram highway: Status and future perspectives. Front. Earth Sci. 9, 611501. doi:10.3389/feart.2021.611501
Garee, K., Chen, X., Bao, A., Wang, Y., and Meng, F. (2017). Hydrological modeling of the upper Indus Basin: A case study from a high-altitude glacierized catchment Hunza. Water, 9, 17. doi:10.3390/w9010017
Gilany, N., Iqbal, J., and Ahmed, A. (2020). Simulation of glacial lake outburst flood hazard in Hunza valley of upper Indus Basin. Int. J. Adv. Appl. Sci. 8, 41–49. doi:10.21833/ijaas.2021.01.006
Guo, X., Feng, Q., Yin, Z., Si, J., Xi, H., and Zhao, Y. (2022). Critical role of groundwater discharge in sustaining streamflow in a glaciated alpine watershed, northeastern Tibetan Plateau. Sci. Total Environ. 822, 153578. doi:10.1016/j.scitotenv.2022.153578
Hasson, S., Böhner, J., and Lucarini, V. (2017). Prevailing climatic trends and runoff response from hindukush–karakoram–himalaya, upper Indus Basin. Earth Syst. Dyn. 8, 337–355. doi:10.5194/esd-8-337-2017
Hayat, H., Akbar, T. A., Tahir, A. A., Hassan, Q. K., Dewan, A., and Irshad, M. (2019). Simulating current and future river flows in the Karakoram and Himalayan regions of Pakistan using snowmelt-runoff model and RCP scenarios. Water, 11, 761. doi:10.3390/w11040761
Hewitt, K. (2011). Glacier change, concentration, and elevation effects in the Karakoram Himalaya, upper Indus Basin. Mt. Res. Dev. 31, 188–200. doi:10.1659/MRD-JOURNAL-D-11-00020.1
Hewitt, K. (2005). The Karakoram anomaly? Glacier expansion and the ‘elevation effect, ’ Karakoram Himalaya. Mt. Res. Dev. 25, 332–340. doi:10.1659/0276-4741(2005)025[0332:tkagea]2.0.co;2
Hock, R., Rasul, G., Adler, C., Cáceres, B., Gruber, S., Hirabayashi, Y., et al. (2019). “High mountain areas,” in IPCC special Report on the Ocean and Cryosphere in a changing climate. Editors H.-O. Pörtner, D. C. Roberts, V. Masson-Delmotte, P. Zhai, M. Tignor, E. Poloczanskaet al. (Bremen, Germany: Intergovernmental Panel on Climate Change (IPCC)). https://www.ipcc.ch/srocc/home/.
Huss, M., and Hock, R. (2018). Global-scale hydrological response to future glacier mass loss. Nat. Clim. Chang. 8, 135–140. doi:10.1038/s41558-017-0049-x
Hussain, D., Kuo, C. Y., Hameed, A., Tseng, K. H., Jan, B., Abbas, N., et al. (2019). Spaceborne satellite for snow cover and hydrological characteristic of the Gilgit river basin, Hindukush–Karakoram mountains, Pakistan. Sensors 19, 531. doi:10.3390/s19030531
Immerzeel, W., Wanders, N., Lutz, A., Shea, J., and Bierkens, M. (2015). Reconciling high-altitude precipitation in the upper Indus basin with glacier mass balances and runoff. Hydrol. Earth Syst. Sci. 19, 4673–4687. doi:10.5194/hess-19-4673-2015
Immerzeel, W. W., Droogers, P., De Jong, S., and Bierkens, M. (2009). Large-scale monitoring of snow cover and runoff simulation in Himalayan river basins using remote sensing. Remote Sens. Environ. 113, 40–49. doi:10.1016/j.rse.2008.08.010
Ismail, M. F., Naz, B. S., Wortmann, M., Disse, M., Bowling, L. C., and Bogacki, W. (2020). Comparison of two model calibration approaches and their influence on future projections under climate change in the Upper Indus Basin. Clim. Change 163, 1227–1246. doi:10.1007/s10584-020-02902-3
Kääb, A., Berthier, E., Nuth, C., Gardelle, J., and Arnaud, Y. (2012). Contrasting patterns of early twenty-first-century glacier mass change in the Himalayas. Nature 488, 495–498. doi:10.1038/nature11324
Kapnick, S. B., Delworth, T. L., Ashfaq, M., Malyshev, S., and Milly, P. C. (2014). Snowfall less sensitive to warming in Karakoram than in Himalayas due to a unique seasonal cycle. Nat. Geosci. 7, 834–840. doi:10.1038/ngeo2269
Khan, A. J., Koch, M., and Tahir, A. A. (2020). Impacts of climate change on the water availability, seasonality, and extremes in the Upper Indus Basin (UIB). Sustainability 12, 1283. doi:10.3390/su12041283
Khanal, S., Lutz, A. F., Kraaijenbrink, P. D. A., van den Hurk, B., Yao, T., and Immerzeel, W. W. (2021). Variable 21st century climate change response for rivers in High Mountain Asia at seasonal to decadal time scales. Water Resour. Res. 57. doi:10.1029/2020WR029266
King, O., Bhattacharya, A., Bhambri, R., and Bolch, T. (2019). Glacial lakes exacerbate Himalayan glacier mass loss. Sci. Rep. 9, 18145–18149. doi:10.1038/s41598-019-53733-x
Kirby, M., Mainuddin, M., Khaliq, T., and Cheema, M. (2017). Agricultural production, water use and food availability in Pakistan: Historical trends, and projections to 2050. Agric. Water Manag. 179, 34–46. doi:10.1016/j.agwat.2016.06.001
Latif, Y., Ma, Y., Ma, W., Muhammad, S., Adnan, M., Yaseen, M., et al. (2020). Differentiating snow and glacier melt contribution to runoff in the Gilgit River basin via degree-day modelling approach. Atmosphere, 11, 1023. doi:10.3390/atmos11101023
Li, D., Li, Z., Zhou, Y., and Lu, X. (2020). Substantial increases in the water and sediment fluxes in the headwater region of the Tibetan plateau in response to global warming. Geophys. Res. Lett. 47, e2020G–e87745G. doi:10.1029/2020GL087745
Li, D., Lu, X., Overeem, I., Walling, D. E., Syvitski, J., Kettner, A. J., et al. (2021). Exceptional increases in fluvial sediment fluxes in a warmer and wetter High Mountain Asia. Science 374, 599–603. doi:10.1126/science.abi9649
Li, D., Lu, X., Walling, D. E., Zhang, T., Steiner, J. F., Wasson, R. J., et al. (2022). High Mountain Asia hydropower systems threatened by climate-driven landscape instability. Nat. Geosci. 15, 520–530. doi:10.1038/s41561-022-00953-y
Liu, S., Zhang, Y., Zhang, Y., and Ding, Y. (2009). Estimation of glacier runoff and future trends in the Yangtze River source region, China. J. Glaciol. 55, 353–362. doi:10.3189/002214309788608778
Lutz, A. F., Immerzeel, W. W., Kraaijenbrink, P. D., Shrestha, A. B., and Bierkens, M. F. (2016). Climate change impacts on the upper Indus hydrology: Sources, shifts and extremes. PloS one 11, e0165630. doi:10.1371/journal.pone.0165630
Lutz, A., Immerzeel, W., Shrestha, A., and Bierkens, M. (2014). Consistent increase in High Asia's runoff due to increasing glacier melt and precipitation. Nat. Clim. Chang. 4, 587–592. doi:10.1038/nclimate2237
Maurer, J. M., Schaefer, J., Rupper, S., and Corley, A. (2019). Acceleration of ice loss across the Himalayas over the past 40 years. Sci. Adv. 5, eaav7266. doi:10.1126/sciadv.aav7266
Minora, U., Bocchiola, D., D'Agata, C., Maragno, D., Mayer, C., Lambrecht, A., et al. (2013). 2001–2010 glacier changes in the central Karakoram national park: A contribution to evaluate the magnitude and rate of the" Karakoram anomaly. Cryosphere Discuss. 7, 2891–2941. doi:10.5194/tcd-7-2891-2013
Mukhopadhyay, B., and Khan, A. (2014). A quantitative assessment of the genetic sources of the hydrologic flow regimes in Upper Indus Basin and its significance in a changing climate. J. Hydrol. X. 509, 549–572. doi:10.1016/j.jhydrol.2013.11.059
Mukhopadhyay, B., and Khan, A. (2015a). A reevaluation of the snowmelt and glacial melt in river flows within Upper Indus Basin and its significance in a changing climate. J. Hydrol. X. 527, 119–132. doi:10.1016/j.jhydrol.2015.04.045
Mukhopadhyay, B., Khan, A., and Gautam, R. (2015b). Rising and falling River flows: Contrasting signals of climate change and glacier mass balance from the eastern and Western Karakoram. Hydrological Sci. J. 60, 2062–2085. doi:10.1080/02626667.2014.947291
Nash, J. E., and Sutcliffe, J. V. (1970). river flow forecasting through conceptual models part I—a discussion of principles. J. Hydrol. X. 10, 282–290. doi:10.1016/0022-1694(70)90255-6
Nie, Y., Pritchard, H. D., Liu, Q., Hennig, T., Wang, W., Wang, X., et al. (2021). Glacial change and hydrological implications in the Himalaya and Karakoram. Nat. Rev. Earth Environ. 2, 91–106. doi:10.1038/s43017-020-00124-w
Orlova, J., and Branfireun, B. A. (2014). Surface water and groundwater contributions to streamflow in the james Bay lowland, Canada. Arct. Antarct. Alp. Res. 46, 236–250. doi:10.1657/1938-4246-46.1.236
Pritchard, H. D. (2019). Asia’s shrinking glaciers protect large populations from drought stress. Nature 569, 649–654. doi:10.1038/s41586-019-1240-1
Quick, M. C., and Pipes, A. (1973). U.B.C. WATERSHED MODEL/Le modéle du bassin versant U.C.B. Hydrol. Sci. J. doi:10.1080/02626667709491701
Reggiani, P., and Rientjes, T. (2015). A reflection on the long-term water balance of the Upper Indus Basin. Hydrol. Res. 46, 446–462. doi:10.2166/nh.2014.060
Roca, M. (2012). Case study of reservoir sedimentation. Wallingford: HR Wallingford. http://eprints.hrwallingford.com/id/eprint/891.
Saifullah, M., Liu, S., Adnan, M., Ashraf, M., Zaman, M., Hashim, S., et al. (2020). Risks of glaciers lakes outburst flood along China Pakistan economic corridor Glaciers and the Polar Environment. London: IntechOpen. doi:10.5772/intechopen.93459
Schlosser, C. A., Strzepek, K., Gao, X., Fant, C., Blanc, É., Paltsev, S., et al. (2014). The future of global water stress: An integrated assessment. Earth's. Future 2, 341–361. doi:10.1002/2014EF000238
Shanley, J. B., Sebestyen, S. D., McDonnell, J. J., McGlynn, B. L., and Dunne, T. (2015). Water’s Way at Sleepers River watershed–revisiting flow generation in a post-glacial landscape, Vermont USA. Hydrol. Process. 29, 3447–3459. doi:10.1002/hyp.10377
Sharma, E., Molden, D., Rahman, A., Khatiwada, Y. R., Zhang, L., Singh, S. P., et al. (2019). “Introduction to the Hindu kush Himalaya assessment,” in The Hindu Kush Himalaya assessment (Berlin, Germany: Springer), 1–16. doi:10.1007/978-3-319-92288-1_1
Shean, D. E., Bhushan, S., Montesano, P., Rounce, D. R., Arendt, A., and Osmanoglu, B. (2020). A systematic, regional assessment of high mountain Asia glacier mass balance. Front. Earth Sci. 7, 363. doi:10.3389/feart.2019.00363
Spencer, S. A., Anderson, A. E., Silins, U., and Collins, A. L. (2021). Hillslope and groundwater contributions to streamflow in a Rocky Mountain watershed underlain by glacial till and fractured sedimentary bedrock. Hydrol. Earth Syst. Sci. 25, 237–255. doi:10.5194/hess-25-237-2021
Sperna Weiland, F., Van Beek, L., Kwadijk, J., and Bierkens, M. (2010). The ability of a GCM-forced hydrological model to reproduce global discharge variability. Hydrol. Earth Syst. Sci. 14, 1595–1621. doi:10.5194/hess-14-1595-2010
Tahir, A. A., Chevallier, P., Arnaud, Y., Neppel, L., and Ahmad, B. (2011). Modeling snowmelt-runoff under climate scenarios in the Hunza River basin, Karakoram range, northern Pakistan. J. Hydrol. X. 409, 104–117. doi:10.1016/j.jhydrol.2011.08.035
Thakuri, S., and Salerno, F. (2016). Glacio-hydrological simulation in dudh koshi River basin, Nepal. Int. J. Sci. Dev. Res. 1, 72–78. IJSDR1602013.
Ul Hussan, W., Khurram Shahzad, M., Seidel, F., Costa, A., and Nestmann, F. (2020). Comparative assessment of spatial variability and trends of flows and sediments under the impact of climate change in the Upper Indus Basin. Water 12, 730. doi:10.3390/w12030730
Wada, Y., Van Beek, L., and Bierkens, M. F. (2011). Modelling global water stress of the recent past: On the relative importance of trends in water demand and climate variability. Hydrol. Earth Syst. Sci. 15, 3785–3808. doi:10.5194/hess-15-3785-2011
Wang, X., Liu, S.-W., and Zhang, J.-L. (2019). A new look at roles of the cryosphere in sustainable development. Adv. Clim. Change Res. 10, 124–131. doi:10.1016/j.accre.2019.06.005
Westoby, M., Brasington, J., Glasser, N., Hambrey, M., Reynolds, J., Hassan, M., et al. (2015). Numerical modelling of glacial lake outburst floods using physically based dam-breach models. Earth Surf. Dynam. 3, 171–199. doi:10.5194/esurf-3-171-2015
Wu, J., Li, H., Zhou, J., Tai, S., and Wang, X. (2021). Variation of runoff and runoff components of the upper Shule River in the northeastern qinghai–tibet plateau under climate change. Water 13, 3357. doi:10.3390/w13233357
Yao, T., Thompson, L., Yang, W., Yu, W., Gao, Y., Guo, X., et al. (2012). Different glacier status with atmospheric circulations in Tibetan Plateau and surroundings. Nat. Clim. Chang. 2, 663–667. doi:10.1038/nclimate1580
Yu, W., Yang, Y. C., Savitsky, A., Alford, D., Brown, C., Wescoat, J., et al. (2013). Hydrology and glaciers in the upper Indus Basin. Washington: International Bank for Reconstruction and Development/The World Bank. doi:10.1596/978-0-8213-9874-6
Keywords: Alam bridge, baseflow, Gilgit River Basin, glaciers melt, runoff, UBC WM, Upper Indus Basin
Citation: Adnan M, Liu S, Saifullah M, Iqbal M, Ali AF and Mukhtar MA (2022) Spatiotemporal variations in runoff and runoff components in response to climate change in a glacierized subbasin of the Upper Indus Basin, Pakistan. Front. Earth Sci. 10:970349. doi: 10.3389/feart.2022.970349
Received: 15 June 2022; Accepted: 01 August 2022;
Published: 29 August 2022.
Edited by:
Sudeep Thakuri, Tribhuvan University, NepalReviewed by:
Dongfeng Li, National University of Singapore, SingaporeCopyright © 2022 Adnan, Liu, Saifullah, Iqbal, Ali and Mukhtar. This is an open-access article distributed under the terms of the Creative Commons Attribution License (CC BY). The use, distribution or reproduction in other forums is permitted, provided the original author(s) and the copyright owner(s) are credited and that the original publication in this journal is cited, in accordance with accepted academic practice. No use, distribution or reproduction is permitted which does not comply with these terms.
*Correspondence: Shiyin Liu, c2hpeWluLmxpdUB5bnUuZWR1LmNu
Disclaimer: All claims expressed in this article are solely those of the authors and do not necessarily represent those of their affiliated organizations, or those of the publisher, the editors and the reviewers. Any product that may be evaluated in this article or claim that may be made by its manufacturer is not guaranteed or endorsed by the publisher.
Research integrity at Frontiers
Learn more about the work of our research integrity team to safeguard the quality of each article we publish.