
95% of researchers rate our articles as excellent or good
Learn more about the work of our research integrity team to safeguard the quality of each article we publish.
Find out more
ORIGINAL RESEARCH article
Front. Earth Sci. , 31 August 2022
Sec. Atmospheric Science
Volume 10 - 2022 | https://doi.org/10.3389/feart.2022.969853
This article is part of the Research Topic AI-Based Prediction of High-Impact Weather and Climate Extremes under Global Warming: A Perspective from The Large-Scale Circulations and Teleconnections View all 21 articles
This study focuses on the interdecadal increase of summertime extreme precipitation over East China in the late 1990s and physical mechanisms behind. The results show that summer extreme precipitation over East China during 1979–2020 demonstrates an upward trend and a significant interdecadal increase occurs around 1997/1998. Since 1997, extreme precipitation anomalies turn from less than normal to more than normal, corresponding to a strong upward movement in the lower troposphere over East China. A cyclonic circulation with positive vorticity controlled by a strong southeasterly flow appears in the lower level over South China. The reasons for the interdecadal increase of summer extreme precipitation over East China are analyzed from the perspective of the abnormally strong South Asian subtropical high (SAH) and the atmospheric circulation anomalies caused by zonal sea surface temperature (SST) gradient in the tropical oceans. After 1997, positive sensible heat anomalies appear over the Tibetan Plateau in spring, which is the major factor that maintains the intensity of the SAH. Besides, the SST of the tropical oceans presents an obvious “high-low-high” zonal gradient distribution with positive sea surface temperature anomaly (SSTA) in the Indian Ocean and western Pacific, and negative SSTA over the Maritime Continent. The zonal SST gradient results in an anomalous downdraft and boundary layer divergence over the Maritime Continent. The tropical zonal SST gradient triggers a local Hadley circulation, and its ascending branch is located in East China. This is a circulation condition favorable for the development of extreme precipitation. In addition, since the late 1990s, the SAH has strengthened in the upper troposphere above the southeastern China. The anomalous divergence at the upper level effectively maintains the upward movement, which in turn facilitates the occurrence of extreme precipitation. As a result, the sensible heat changes in the Tibetan Plateau in spring and the tropical SST zonal gradient jointly affect summer extreme precipitation over East China, leading to the interdecadal increase of extreme precipitation in the late 1990s.
Extreme precipitation events are difficult to predict and often occur abruptly. They can lead to serious natural disasters, cause great property losses and casualties, and impose a huge impact on many aspects of human life such as economy, society, life safety and ecological environment system. Therefore, extreme precipitation events have been widely studied worldwide. Many previous studies (e.g., Groisman et al., 1999; Alexander et al., 2006; Goswami et al., 2006) have shown that extreme precipitation events are increasing in many countries and regions around the world as global warming intensifies. It is particularly noted that the frequency and intensity of extreme precipitation are significantly increasing in the middle and high latitudes of the northern hemisphere, even in areas where average precipitation is decreasing. The IPCC Fourth Assessment Report also points out that extreme precipitation events will become more frequent in the 21st century. Groisman analyzed the precipitation data collected in countries in the temperate region (the study area covers 80% of the global temperate region). The results show that in the middle-latitude countries considered, the average summer precipitation in the last century has increased by at least 5%, yet the precipitation days do not change significantly. This implies an increasing trend of heavy summer precipitation. Some other studies (e.g., Karl and Knight, 1998) also indicate that the percentage of total annual precipitation accounted for by extreme precipitation in the United States is increasing, and the increase in total precipitation is largely attributed to the increase in extreme precipitation intensity and frequency. Studies over Australia, Canada, and Japan (e.g., Suppiah and Hennessy, 1996, 1998; Yamamoto and Sakurai, 1999; Stone et al., 2000) have come to a similar conclusion, that is, areas where precipitation increases tend to be characterized by a decrease in precipitation days and an increase in extreme precipitation events as well as an increase in precipitation intensity, leading to a more pronounced trend towards extreme precipitation. In addition, a study over Europe (Beniston, 1994) concluded that under the background of global warming, precipitation in the Alps generally decreases, but extreme precipitation events have increased significantly.
Studies on the interdecadal change of extreme precipitation have also attracted extensive attention in China. Most of the annual total precipitation in eastern China occurs in summer, and precipitation in summer is highly correlated with extreme precipitation (e.g., Mei and Yang, 2005; Su et al., 2006). A large number of studies on extreme precipitation events in China show that in the past 40 years, the average annual precipitation intensity in eastern China has been significantly increasing, especially after the 1990’s, when the frequency and intensity of precipitation both demonstrate a trend of increasing with expanding scope of influence. Extreme precipitation events occur more frequently to the south of 35°N, especially in the middle and lower reaches of the Yangtze River and southern China. Among those areas that experience more frequent extreme precipitation events, southern Anhui province and the coastal region of southern China are the areas with the most frequent extreme precipitation events, and the duration of extreme precipitation events in these regions is also longer. More extreme precipitation events have become the main reason for precipitation increase in these regions (e.g., Ren and Zhai, 1998; Zhai and Pan, 2003a; Zhai et al., 2005; Zhai and Zou, 2005; Wang and Qian., 2009; Yang et al., 2011; Chen and Zhai, 2013; Zhu et al., 2014; Shi and Wen, 2015; Zhu and Li, 2016; Zhu and Li, 2018). Extreme precipitation events with higher occurrence frequency and stronger intensity are very likely to cause disasters. In eastern China, extreme precipitation is a high impact weather event, which occurs frequently in summer and often causes floods and urban waterlogging. For example, in the summer of 1998, the extremely heavy rainfall in the Yangtze River Basin lasted for more than 40 days, resulting in multiple catastrophic floods in the entire basin and huge economic losses and casualties (e.g., Huang et al., 1998; Lu et al., 2014; Qi et al., 2016). In July 2012, Beijing was struck by extreme precipitation. Floods caused by the extreme rainfall affected 1.602 million people, and the economic loss reached 11.64 billion yuan (Zhang et al., 2013).
Physical mechanisms for precipitation formation have been explored in many studies. The formation of rain belts in eastern China is closely related to the East Asian summer monsoon activities and their anomalies (Chen et al., 1991) as well as other external forcing factors. Several studies proposed that precipitation in the Yangtze River Basin is under strong influence of SST in the equatorial eastern Pacific (e.g., Yang et al., 1992; Huang et al., 1999; Li and Shao., 2000; Wei., 2005). A few other studies (e.g., Guan and Yamagata., 2003; Park and Schubert., 1997) argued that the occurrence of droughts and floods in East Asia are related to SST in the Indian Ocean and the Pacific Ocean. It is also found that convective activities around the Philippines are closely related to droughts and floods in the Jianghuai Basin (e.g., Kurihara and Kawahara, 1986; Nitta, 1987; Huang., 1990). Zhang and Tao (1998), 2003 pointed out that precipitation anomalies during the flood season in eastern China are associated with variation of the western Pacific subtropical high (WPSH). The above factors are also very likely to be factors affecting extreme precipitation in these areas. In addition, some studies indicated that the occurrence of summer extreme precipitation in eastern China is affected by typhoons. In highly urbanized areas, the urban heat island effect is also one of the factors affecting extreme precipitation events (e.g., Pan et al., 2018; Sun et al., 2021).
Although many studies have discussed the interannual and interdecadal changes of precipitation in eastern China, few studies have focused on the interdecadal change of extreme precipitation in eastern China and possible physical mechanisms behind. The eastern China is located in the monsoon region, where the weather and climate are greatly affected by the East Asian monsoon. Furthermore, eastern China is a region of developed economy with large population density. Therefore, this region is particularly sensitive to natural disasters such as extreme precipitation. Any change in the frequency and intensity of extreme precipitation will have a significantly impact on the society and the natural environment. With increasing concerns on extreme precipitation and the accumulation and development of data, it is imperative and feasible to explore the spatiotemporal characteristics and physical mechanism of extreme precipitation that occurred in eastern China in recent years. Such studies are expected to effectively increase the lead time of extreme precipitation forecast and improve the ability for early warning of and timely response to possible disasters induced by extreme precipitation. The present study will focus on this issue.
The paper is organized as follows. Section 1 introduces the data and methods, including the thresholds used to determine extreme precipitation and the algorithms to calculate water vapor flux and water vapor flux divergence. Section 2 analyzes the spatial distribution and interdecadal change characteristics of extreme precipitation in eastern China. Section 3 starts from analysis of atmospheric circulation anomalies and focuses on analyzing interdecadal changes of water vapor transport and ascending motions. The climate background for the interdecadal change in extreme precipitation is also explored. Section 4 discusses possible physical mechanisms for the interdecadal change of extreme precipitation. Section 5 provides the summary and discussion.
In this paper, daily precipitation data for the period 1979 to 2020 are obtained from the Climate Prediction Center Merged Analysis of Precipitation (CMAP; Xie and Arkin, 1997) (https://www.cpc.ncep.noaa.gov/products/global_precip/html/wpage.cmap.shtml). The CMAP has the resolution of 0.5° × 0.5° (latitude × longitude). Meteorological variables including geopotential height, wind, vertical velocity, sea level pressure, temperature and specific humidity for the period 1979–2020 are extracted from the National Centers for Environmental Prediction/National Center for Atmospheric Research (NCEP/NCAR; Kanamitsu, et al., 2002) reanalysis product (https://psl.noaa.gov/data/gridded/data.ncep.reanalysis2.html), which is a global dataset on 2.5° × 2.5° (latitude × longitude) grids. The SST dataset (COBE SST) is provided by the National Oceanic and Atmospheric Administration Climate Diagnostic Center (NOAA; Folland and Parker, 2002) (https://psl.noaa.gov/data/gridded/data.cobe.html). It has a horizontal resolution of 1° × 1° (latitude × longitude). The average condition over 1981–2010 is taken as the climatic average. In this paper, winter is from current December to February in the subsequent year, spring is from March to May, summer is from June to August.
In the studies of extreme precipitation, the definition of extreme precipitation index mostly adopts the threshold method, and a precipitation event exceeding the threshold is determined to be an extreme precipitation event. There are mainly two types of threshold: fixed threshold and percentile threshold. The study area in this paper is eastern China and the geographical area is relatively broad. If fixed thresholds are adopted, then the extreme precipitation signals in some regions and some seasons (such as the precipitation signals of ten days and five days) will be undistinguished. Therefore, the percentile threshold method is adopted in this paper. To define the threshold of extreme precipitation index, precipitation of the same day at each grid point from 1979 to 2020 is sorted in ascending order. Those days without precipitation (precipitation <0.1 mm/d) are excluded. The 95th percentile of daily precipitation is then defined as the extreme precipitation threshold, and the extreme precipitation event is considered to occur when the threshold is exceeded. The three extreme precipitation indices are extreme precipitation amount, extreme precipitation frequency and extreme precipitation intensity.
Sufficient water vapor is an important condition for the occurrence of extreme precipitation event, and the water vapor transport in the middle and lower troposphere plays a crucial role in the maintenance of extreme precipitation event. Divergence is a physical quantity that measures the horizontal inflow of air. Positive and negative values of water vapor flux divergence can intuitively indicate the convergence and divergence of water vapor in the study area. The methods to calculate water vapor flux and water vapor flux divergence are as follows.
The calculation formula of water vapor transport flux (unit: kg/(ms)) in the whole atmosphere layer is:
In the above algorithm, the zonal component is
The formula for calculating the water vapor flux divergence D (unit: kg/(m2·s)) is:
Where a is the radius of the Earth,
In this paper, moving t test (MTT) and Yamamoto test are used to comprehensively determine the abrupt interdecadal change year of extreme precipitation index. The linear propensity estimation method is used to determine the long-term trend of extreme precipitation.
The Moving t-test technique is often used to test the significance of difference between the means of two random samples. To this end, we divide a continuous climate series x into two sub-sample sets x1 and x2, let
Null hypothesis:
The Yamamoto method is similar to the MMT method but relatively simple and clear. In this method, a signal-to-noise ratio is defined as:
Where the meanings of the symbols are the same as that in the MMT. If
The significance test is to make a hypothesis on the parameters or the overall distribution form of the population (random variable) in advance, and then use the sample information to determine whether this hypothesis (alternative hypothesis) is reasonable, that is, to determine whether there is a significant difference between the actual situation of the population and the original hypothesis. In this paper, T test and F test are used, and the formulas are expressed by (6) and (7), respectively.
Figure 1 displays spatial distribution characteristics of summer extreme precipitation amount, precipitation intensity, and precipitation frequency in eastern China from 1979 to 2020. In general, the distribution characteristics of extreme precipitation amount (Figure 1A) and extreme precipitation intensity (Figure 1B) are very similar. Both of them show higher values in the south than in the north, and both show a decreasing trend from southeast to northwest, that is, they decrease from coastal to inland regions. The areas with larger extreme precipitation amount and higher extreme precipitation intensity are located in the southeastern coastal areas, southern Anhui Province and western Hubei Province. The southeastern coastal area is frequently affected by typhoons in summer, where a large amount of extreme precipitation with high intensity occurs; southern Anhui and western Hubei are mountainous areas, where the southerly airflow and accompanied water vapor transport tend to form mesoscale water vapor convergence, which is conducive to the occurrence of extreme precipitation events. Therefore, the probability of extreme precipitation in southern Anhui and western Hubei is also high (Wang et al., 2015). In addition, southern Anhui is adjacent to the Poyang Lake and the Yangtze River is located to its north. Frequent extreme precipitation events greatly increase the risk of flood disasters. The regions with high occurrence frequency of extreme precipitation are mainly located in south and southwest China. High occurrence frequency of extreme precipitation can also be found in Beijing and western Hebei (Figure 1C). The occurrence frequency of extreme precipitation in the lower Yellow River Basin is low. Figures 1D–F shows the long-term variation trends of extreme precipitation amount, extreme precipitation intensity, and extreme precipitation frequency. The trend characteristics show that extreme precipitation amount (Figure 1D) and extreme precipitation intensity (Figure 1E) are relatively consistent, both of which display a linear increasing feature in Southeast China, East China and northern Guangxi. And the change trends are significant at the 95% confidence level by F test. On the whole, the frequency of extreme precipitation in most areas of eastern China (Figure 1F) increases linearly and the most obvious increase occurs in northern Guangxi and southeastern coastal region.
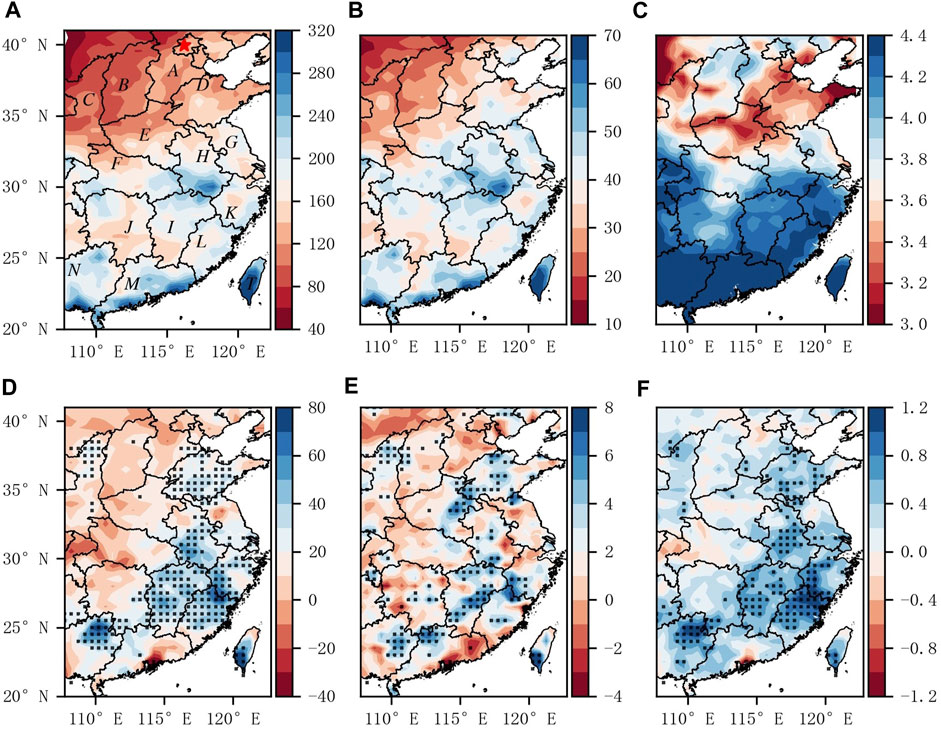
FIGURE 1. Eastern China in the summers from 1979 to 2020: extreme precipitation amount (A) (units: mm); extreme precipitation intensity (B) (units: mm/d); extreme precipitation frequency (C) (units: (D); linear trend of extreme precipitation amount (D) (units:
Figure 2 shows the time series of extreme precipitation amount, extreme precipitation intensity and extreme precipitation frequency in eastern China in the summers of 1979–2020. The solid lines in Figure 2 display the time series of the above three indices, and the bars represent the anomaly series. It can be seen that the extreme precipitation indexes before the mid-to late 1990’s are mostly characterized by negative anomalies. After the mid-to late 1990’s, however, the extreme precipitation indexes are mostly characterized by positive anomalies and show an upward trend, which is consistent with their linear trends shown in Figure 1. The dotted lines in Figure 2 are the 9-years moving averages of individual extreme precipitation indexes. It can be found that these three indices of extreme precipitation all present an upward trend, and the upward trend is much more obvious in the late 1990’s, indicating that there may exist an abrupt interdecadal change in extreme precipitation in the late 1990’s.
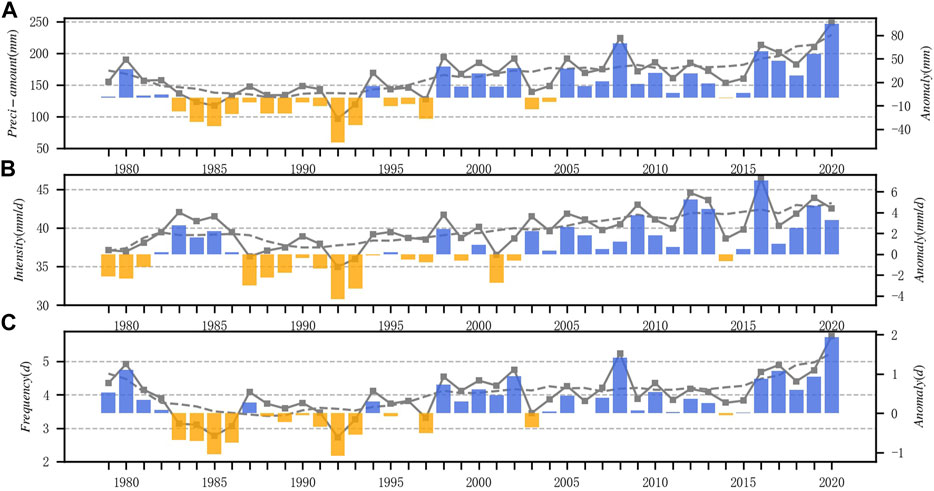
FIGURE 2. Eastern China: time series of extreme precipitation amount (A); time series of extreme precipitation intensity (B); time series of extreme precipitation frequency (C). The dotted line in each panel represents the 9-years moving average, and the bars represent the anomalies.
The moving t test Eqs 3,4 and the Yamamoto method Eq. 5 are applied to detect the abrupt change of extreme precipitation characteristics on the interdecadal scale. Results of the two methods both indicate that 1997 is the year of abrupt change for extreme precipitation in eastern China (Figure 3). After 1997, the amount of extreme precipitation, the intensity of extreme precipitation and the frequency of extreme precipitation all increase significantly compared with those before 1997. It can be seen from the time series of extreme precipitation in Figure 2 that, the extreme precipitation showed an obvious linear increase in the past 40 years. In order to better extract and test the abrupt features of precipitation series, we recalculated the linear trends of extreme precipitation amount, intensity and frequency, and subtract the linear trend from the original time series. It is found that, after eliminating the linear trend, the interdecadal increase of extreme precipitation in East China still occurs in late 1990’s. The results are consistent with the conclusions showed in the Figure 3. In this paper, we select the sliding window of 9-years, which is conducive to studying the interdecadal variation characteristics of rainfall change. We also test the different sliding windows (e.g., 5-,7- and 11-years) to verify the interdecadal abrupt change points are independence of the selected sliding window. It is find that when the sliding window is 5 years, due to the short time series, it is impossible to obtain the accurate abrupt point. When the sliding window is 7- to 11-years, the results are consistent with the results of this paper. Based on this, we believe that the sliding window selected in this paper is appropriate and does not affect the judgment of the abrupt point. Therefore, 1997 is taken as the time line to separate the study period into two sub-periods: 1979–1997 (P1) and 1998–2020 (P2). The purpose of using two different methods to test the abrupt change of extreme precipitation is to avoid possible errors caused by individual methods.
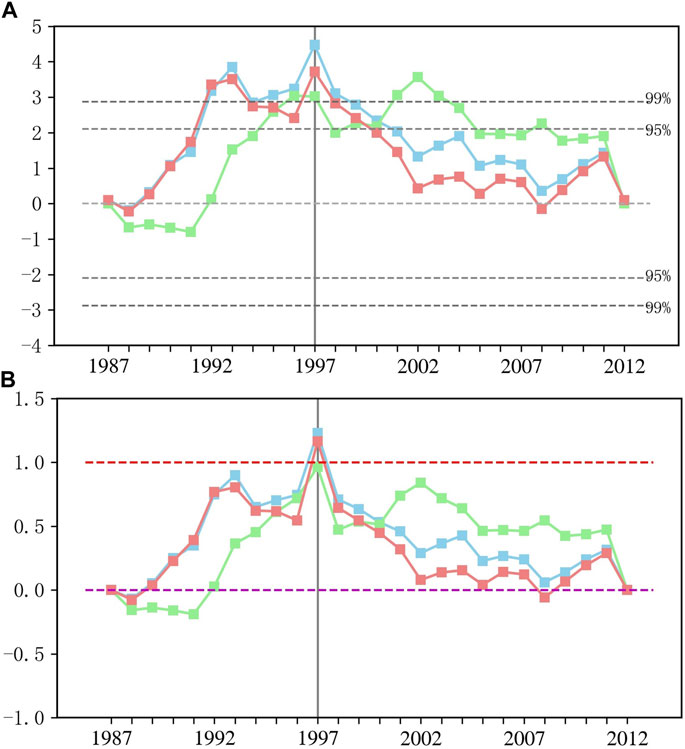
FIGURE 3. Moving t-test (A) and Yamamoto test (B) of extreme precipitation (blue line), extreme precipitation intensity (green lines), and extreme precipitation frequency (red lines).
Figure 4 shows the interdecadal differences in extreme precipitation amount, extreme precipitation intensity and extreme precipitation frequency between P2 and P1 periods (P2-P1) in eastern China. It can be seen that the interdecadal differences of these three indices are positive in most regions, especially in Fujian, Jiangxi, Guangdong, Guangxi and other regions in the southeastern coastal area. This result indicates that extreme precipitation in P2 period is more than that in P1 period. And the frequency and intensity of extreme precipitation also increase significantly, which is consistent with the linear increasing trend (Figures 1D–F). It is worth noting that the interdecadal difference of extreme precipitation in northern Hebei and Beijing is negative, indicating that the interdecadal variation of extreme precipitation in this area is contrary to the trend in other areas of eastern China.
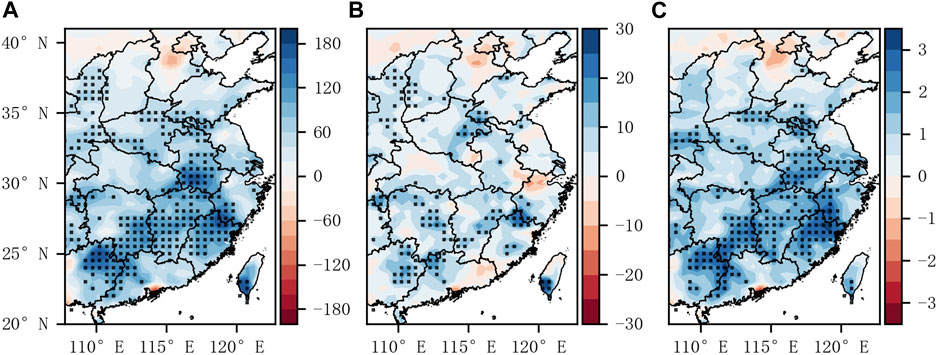
FIGURE 4. Interdecadal differences between P2 and P1 periods in eastern China (P2-P1): extreme precipitation amount (A) (units: mm); extreme precipitation intensity (B) (units: mm/d); extreme precipitation frequency (C) (units: d). Dotted areas indicate values exceeding the 95% confidence level by t test.
The atmospheric circulation provides a large-scale background for the occurrence of extreme precipitation events (Ding and Chan., 2005). Usually, sufficient water vapor supply and strong upward movement are necessary conditions for the occurrence and maintenance of large-scale extreme precipitation. In order to study the characteristics of the atmospheric circulation anomalies in P2 period with high occurrence of extreme precipitation events, we calculate interdecadal differences (P2-P1) in various elements involved in the atmospheric circulation between P1 and P2 periods (Figure 5). Figure 5A is the 500 hPa vertical velocity field, which shows an upward movement in eastern China and the Indo-China Peninsula. The high value area is located in the northeast of Taiwan Island as well as Vietnam and Thailand in the Indo-China Peninsula, while descending motions prevail in the low latitude area (0°–10°N) during P2. Figure 5B presents the interdecadal difference in sea level pressure. Negative values appear in eastern China, indicating that the sea-level pressure in P2 period is lower than that in P1 period over this region. And the central area of negative values is basically the same as the center of upward motion shown in Figure 5A, indicating that the upward motion at 500 hPa to a certain extent is driven by the convergence in lower levels close to the ground. However, there is no obvious correlation between the interdecadal differences of sea level pressure and 500 hPa vertical motion in the low latitudes. Figure 5C shows the interdecadal differences in 850 hPa wind and relative vorticity. Positive vorticity circulation appears in eastern part of China, and upward movement appears in the lower levels, which is controlled by the southerly wind originated from the ocean. Looking at water vapor flux and its divergence in the whole layer (Figure 5D), it is found that the divergence of water vapor flux in most areas of eastern China is negative, indicating that these areas experience strong water vapor convergence. At the same time, warm and moist air mass with abundant water vapor content has been continuously transported to eastern China. In summary, the upward movement in the middle and lower levels is stronger in the P2 period than in the P1 period. Meanwhile, more warm moist air mass is transport to eastern China in P2 period than in P1 period. The above changes in the atmospheric circulation all are favorable for the increase in extreme precipitation in eastern China.
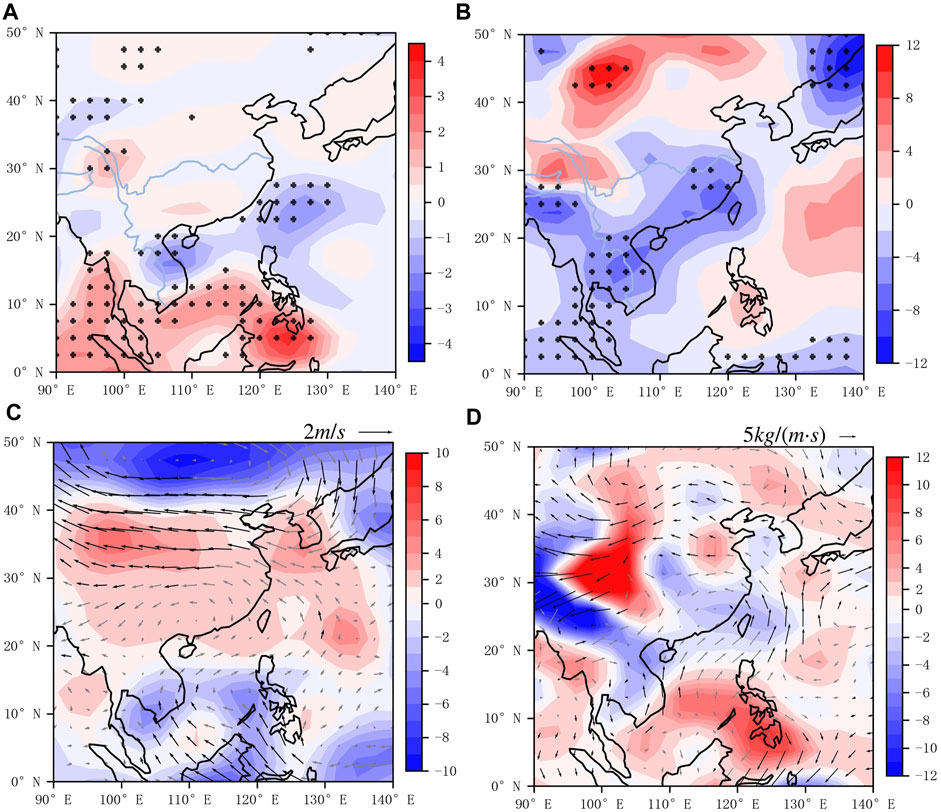
FIGURE 5. Interdecadal difference between P1 and P2 periods (P2-P1): 500 hPa vertical velocity (A); sea level pressure (B); 850 hPa wind field and relative vorticity (C); 1000–500 hPa water vapor flux and water vapor flux divergence (D). Dotted areas and black wind arrows indicate values exceeding the 95% confidence level by t test.
Some studies have shown that when the SAH and the WPSH are abnormally overlapped zonally, that is, when the east ridge of the SAH is abnormally close to the west ridge of the WPSH (compared with the multi-year average state), abnormal upward movements and water vapor convergence anomalies would develop above eastern China, resulting in more precipitation in the region (Zhang and Zhi., 2010).
Figure 6 shows the geopotential heights of 500 hPa (A) and 200 hPa (B), and the contours of 5,880, 5,870 and 12,500 gpm are used to represent typical ranges of the WPSH and the SAH respectively. It can be seen that during the P2 period, the WPSH and the SAH both are stronger than that in the P1 period, and ranges of their influence are also larger than before. The WPSH anomaly extends westward, and the SAH anomaly moves eastward. In other words, along the zonal direction, the two highs show the characteristics of opposite moving directions (zonal overlap). When the two high pressure systems overlap in the zonal direction, the warm moist air mass from the western Pacific ocean will be transported to eastern China by the southwesterly winds on the northwest side of the WPSH. A large value belt of southerly wind and water vapor transport can form over eastern China. Water vapor is transported from the Pacific ocean to eastern China, which, combined with the low-level convergence and upward movement, is conducive to the development of extreme precipitation. At the same time, in the P2 period, it is found that the divergence of water vapor flux in most areas of eastern China is negative, indicating that these areas experience strong water vapor convergence. And the anomalous enhancement of the SAH (Figure 6B) is favorable for divergence in the upper layer and upward movement in the middle layer. In general, the circulation pattern in the upper and lower levels is conducive to the formation of extreme precipitation in eastern China during the P2 period.
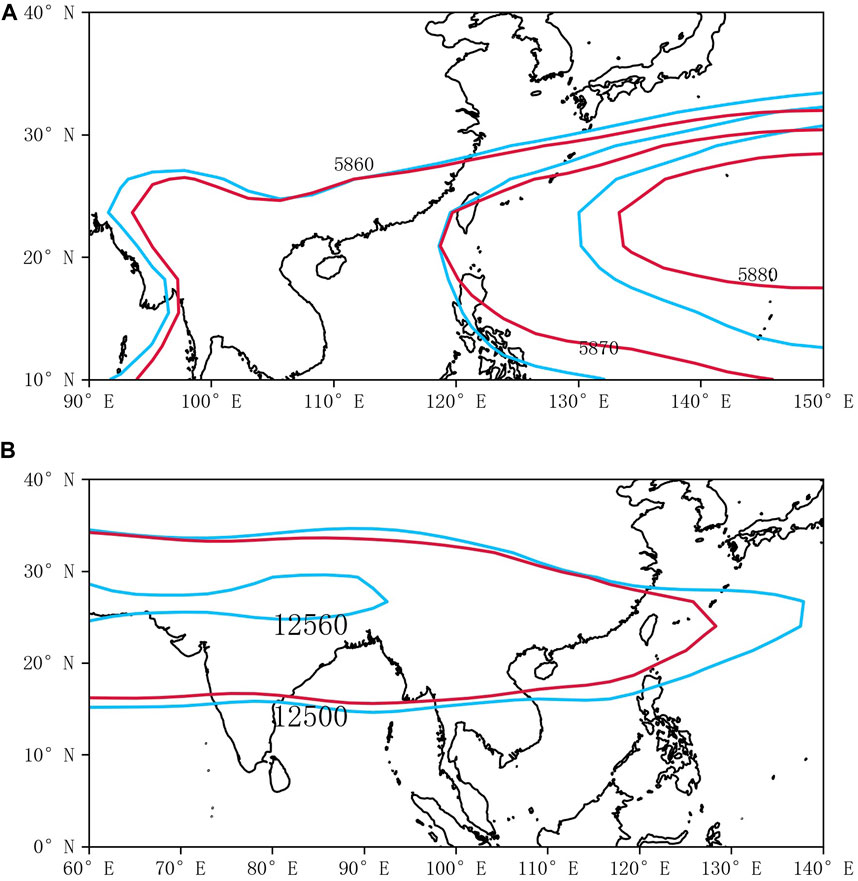
FIGURE 6. P1 period (red line) and P2 period (blue line): 500 hPa (A) geopotential height; 200 hPa (B) geopotential height.
The interdecadal difference in atmospheric circulation between P1 and P2 periods in most parts of eastern China is statistically significant at the 95% confidence level by t test, indicating that the large-scale atmospheric circulation that affects extreme precipitation in eastern China also experiences an interdecadal change in the late 1990’s. The atmospheric circulation change is favorable for the interdecadal transformation of extreme climate event in eastern China. It is also consistent with the abrupt interdecadal changes shown in the time series of extreme precipitation indexes obtained by moving t-test and Yamamoto methods (Figure 3). It can be seen that the anomaly of atmospheric circulation is an important factor that contributes to the interdecadal change of extreme precipitation over eastern China.
Sensible heat flux plays an important role in the occurrence of extreme precipitation. Figure 7 shows the interdecadal differences (P2-P1) in spring sensible heat flux over the Tibetan Plateau. It can be found that the Tibetan Plateau is an area of positive difference of sensible heat flux, indicating that the sensible heat flux during the P2 period is larger than that during the P1. Larger sensible heat fluxes can lead to higher temperature in the lower troposphere and thus increase water vapor content in the air, which is favorable for the increase in regional precipitation and extreme precipitation. Therefore, sensible heat flux is closely related to the occurrence of extreme precipitation.
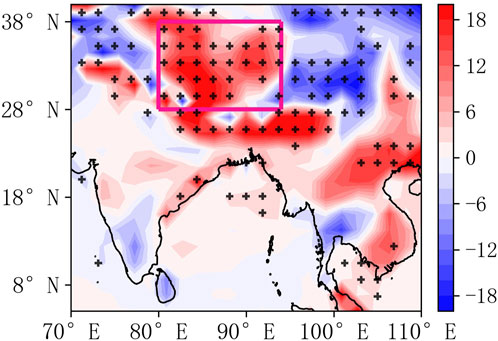
FIGURE 7. Interdecadal differences in spring sensible heat flux over the Tibetan Plateau (P2-P1). The red box indicates the Tibetan Plateau region. Dotted areas indicate values exceeding the 95% confidence level by t test.
In addition, sensible heat flux over the Tibetan Plateau in spring is the main factor that maintains the intensity of the SAH. The correlation analysis between the time series of regional average sensible heat flux in spring over the Tibetan Plateau from 1979 to 2020 and 500 hPa geopotential height in summer during the same period (Figure 8) reveals that the area of high correlation coefficient is consistent with the range of the SAH shown in Figure 6B. This result indicates that the springtime sensible heat flux over the Tibetan Plateau has a significant positive correlation with the SAH. In other words, the sensible heat flux in spring over the Tibetan Plateau is the dominant factor that contributes to the strengthening of SAH during the P2 period (Figure 6B).
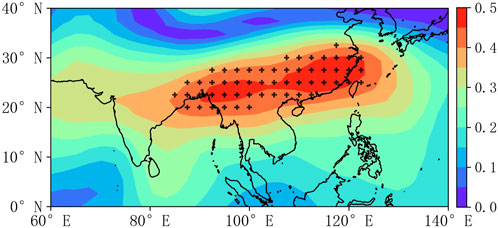
FIGURE 8. Correlation between interdecadal differences in spring sensible heat flux over the Tibetan Plateau and differences in geopotential height at 200 hPa (P2-P1). Dotted areas indicate values exceeding the 95% confidence level by t test.
The Pacific SST is one of the main factors affecting the atmospheric circulation (Zhang and Ding, 2004; Yang et al., 2008). By studying the interdecadal difference in SST between P1 and P2 (Figure 9), it can be found that the SST differences in the tropical oceans in winter, spring and summer shows positive values in the western Pacific and the Indian Ocean, but there is an area of relatively small SST difference in the Maritime Continental region (100°-120°E). And the surface temperature of the Indian Ocean and the Western Pacific continue to increase, forming “warm pools.“ This result indicates that SST in the tropical oceans show a more significant zonal gradient during P2. The positive SST difference in the western Pacific in winter is the most obvious, and positive SST differences significant at the 95% confidence level occur over the entire area over 120°–160°E. This “high-low-high” SST distribution is conducive to descending motion over the Maritime Continent. In addition, the continuous warming of the Indian Ocean and the Western Pacific also affects the intensity of the SAH and the WPSH, that is, the Indian Ocean and the Western Pacific warm pools force the SAH and the WPSH to be strengthened, which leads to the adjustment of the atmospheric circulation. As a result, more warm moist air mass above the ocean in the northwest side of the WPSH is transported to eastern China (Figure 5D), leading to abnormally intense summer extreme precipitation events there.
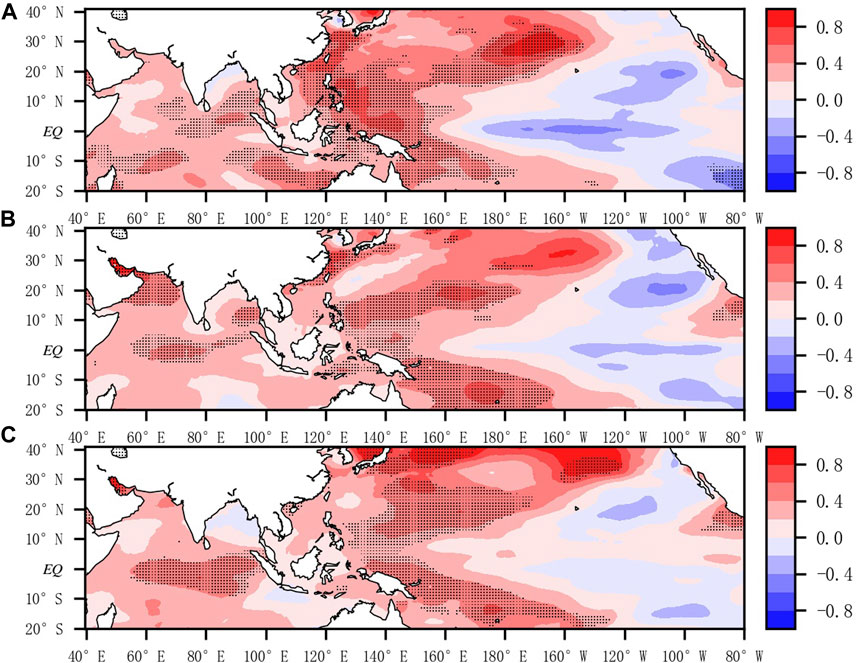
FIGURE 9. Interdecadal differences in SST between P1 and P2 periods (P2-P1): winter (A); spring (B); summer (C). Dotted areas indicate values exceeding the 95% confidence level by t test.
The ascending and descending branches of the Walker Circulation (Figure 10A) in low-latitude regions (0°–10°N average) are significantly stronger during P2 compared to that during P1. Large interdecadal differences can be found in the Walker Circulation (P2-P1). That is, after 1997, driven by the warm pool in the equatorial Indian Ocean and the Western Pacific, the Walker circulation during the P2 period is significantly stronger than that in the previous period of P1. The ascending branches of the Walker Circulation are located at 60–80°E and 160–180°E, respectively, and the descending branch is located at 80–160°E. The strongest descending motion is concentrated over 90–120°E. In addition, the anomalous ascending motion above 700 hPa that occurs near 140°E is also favorable for abnormal intensification of the WPSH at 500 hPa.
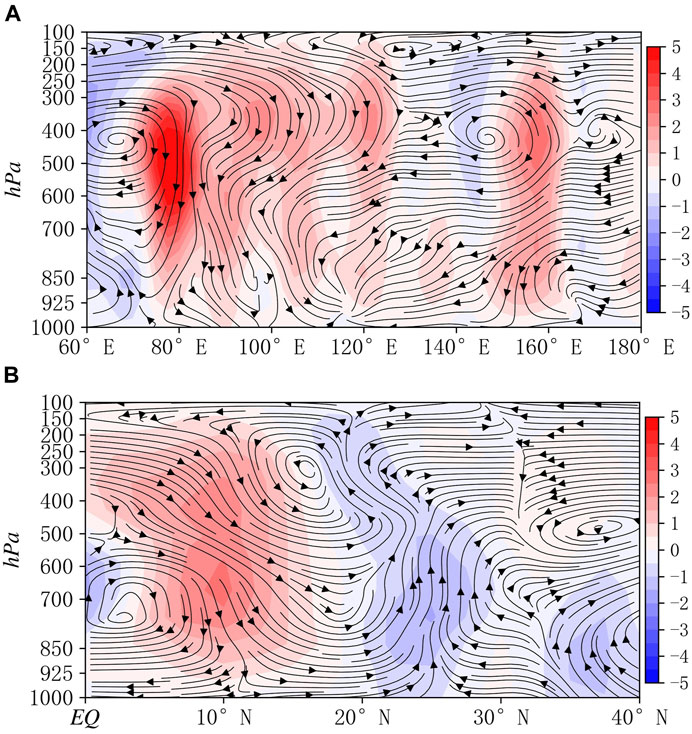
FIGURE 10. Interdecadal differences between P1 and P2 periods: Walker circulation (0°-10°N average) (A); Hadley circulation (100°–120°E average) (B). Shaded: vertical velocity (note that vertical velocity is multiplied by 100 for better visualization).
At the same time, the ascending branch of the Walker Circulation in the equatorial western Pacific leads to the formation of a meridional Hadley circulation on its north side (Figure 10B) and a counterclockwise circulation anomaly center in the middle and upper troposphere (400–200 hPa) along the vertical direction. The Hadley circulation links the wind fields in the low and middle to high latitudes and thus plays a crucial role in the exchanges of heat, momentum and water vapor between different latitudes. In the P2 period, the local Hadley circulation in East Asia is abnormally strong with upward movements at around 20–28°N and 32–40°N and downward movements at around 0–10°N and 30°N. This circulation pattern is consistent with the ascending motion shown in Figure 5A and the area of negative sea level pressure anomalies shown in Figure 5B. The strongest upward movement occurs near 25°N, which is more favorable for the intensification of WPSH than that in the P1 period. The descending branch near 10°N tilts to the north near the ground, which further strengthens the southerly winds over eastern China. On the one hand, it is conducive to the northward movement of warm moist air mass from the northwestern Pacific; on the other hand, it strengthens upward movement in this region. The above analysis reveals that the joint impacts of the latitudinal and longitudinal circulations promote the occurrence and development of extreme precipitation in eastern China in summer.
The major conclusions of the present study about extreme precipitation in eastern China are based on analysis of the average state over the entire region. However, it is worth noting that with the increases in both rainfall amount and occurrence frequency of extreme precipitation in most regions of eastern China, the variation trend of extreme precipitation in Beijing-Tianjin-Hebei region and parts of the Pearl River Delta is actually opposite to that in other regions of eastern China. Despite the fact that large-scale weather and climate background is becoming more conducive to the occurrence of extreme precipitation events, extreme precipitation events in the above two regions are decreasing rather than increasing. This indicates that in addition to large-scale weather and climate background, there are some other factors that can affect the occurrence and development of extreme precipitation events in these two regions. Considering the fact that these two regions are highly urbanized, it is reasonable to hypothesize that urbanization could be a key factor that affects extreme precipitation. It is worth further exploring this research topic in the future.
The SAH is a planetary-scale vortex center in the upper troposphere above the Tibetan Plateau in summer. It is also the most powerful and stable atmospheric activity center in the upper troposphere in the northern hemisphere summer. The activities of SAH have important impacts on Asian weather and climate, especially on precipitation in eastern China (Qian et al., 2002; Wu et al., 2004; Liu et al., 2013; Peng et al., 2016). The WPSH is a large-scale subtropical high-pressure system in the middle troposphere over the western Pacific, and it is also an important circulation system in the middle and low latitudes. The peak period of the WPSH activities appears in summer, when its scope and intensity both reach the maximum. The WPSH is one of the main atmospheric activity centers that affect the weather and climate in eastern China, and the east-west oscillation of the WPSH has an important impact on precipitation in Eastern China (Yao et al., 2005; Liu and Ding., 2009; Wang and Qian., 2009; Wang et al., 2011; Ren et al., 2013; Ye et al., 2014; Zhang et al., 2014, Zhang et al., 2015; Lin et al., 2016; Huang et al., 2015; He et al., 2018). This study shows that the contribution of the SAH is the most obvious in the interdecadal change of extreme precipitation that occurred around 1997. Note that although the WPSH intensity has increased during the P2, it does not directly modulate the interdecadal change of extreme precipitation in South China.
In addition, the strength of the East Asian summer monsoon and the location change in the upper-and lower-level jets are also factors that can affect extreme precipitation in eastern China. Many studies have analyzed the influence of a single or two factor on extreme precipitation in Eastern China, but few studies have focused on the physical mechanism study for extreme precipitation and interaction between various factors. In order to comprehensively understand the causes for the interdecadal change in extreme precipitation in Eastern China, more work needs to be done.
This paper analyzes the interdecadal change in summer extreme precipitation over East China that occurred in the late 1990’s. The influence mechanism of summer extreme precipitation over East China is explored based on analysis of atmospheric circulation anomalies on the interdecadal time scale. Major conclusions are as follows.
From 1979 to 2020 (P2), summer extreme precipitation in East China overall shows an upward trend, and there is a significant interdecadal increase that occurred around 1997. After 1997, the extreme precipitation changes from less than normal to higher than normal. Spatial distributions of extreme precipitation amount and intensity are similar, i.e., larger extreme precipitation amount and higher precipitation intensity are more concentrated in the south than in the north. The extreme precipitation events decrease from southeast to northwest and the coastal areas experience more extreme precipitation than inland areas. The areas with more extreme precipitation and extreme precipitation intensity are located in the southeastern coastal region as well as southern Anhui Province and western Hubei Province.
In the P2 period, there is a strong upward movement in the lower troposphere above eastern China and a positive vorticity circulation develops at 850 hPa, which is controlled by strong southeasterly winds. From the perspective of water vapor transport in the whole atmosphere, convergence of warm and moist air originated from the northwestern Pacific Ocean can be found in eastern China, and convective activities are obviously strong in this region. These atmospheric conditions are favorable for the increase of extreme precipitation in eastern China.
Sensible heat flux in the Tibetan Plateau in spring is the main factor that helps to maintain the intensity of the SAH. After 1997, positive anomalies of sensible heat flux develop over the Tibetan Plateau in spring. According to the significant positive correlation between the plateau sensible heat in spring and the SAH intensity, the intensification of the SAH strengthens the upper-level divergence over South China, providing a favorable background condition for the development of updrafts and convection activities there.
Besides, the interdecadal difference in SSTA in the tropical oceans presents an obvious “high-low-high” pattern with larger zonal SST gradient during P2. Positive SST anomalies occur in the Indian Ocean and western Pacific, and negative SST anomalies appear over the Maritime Continent. The tropical zonal SST gradient triggers a secondary Hadley circulation with its ascending branch located in eastern China. This is a circulation condition favorable for the occurrence of extreme precipitation. In addition, since the late 1990’s, the South Asian High has strengthened in the upper troposphere over southeastern China. The anomalous divergence at the upper levels effectively maintains the upward movement there, which in turn facilitates the occurrence of extreme precipitation. The sensible heat flux changes in the Tibetan Plateau in spring and the increased zonal tropical SST gradient jointly affect summer extreme precipitation over East China, leading to the interdecadal increase in extreme precipitation.
The original contributions presented in the study are included in the article/supplementary material, further inquiries can be directed to the corresponding authors.
ZZ and YH obtained funding; ZZ and YH contributed to the idea and research of the study; ZZ and YH designed this manuscript; JL performed the statistical analysis; JL drafted the manuscript; ZZ and YH performed manuscript review and editing. All authors listed have made a substantial, direct, and intellectual contribution to the work and approved it for publication.
This work is sponsored jointly by the National Natural Science Foundation of China (41975167 and 41975090), the Natural Science Foundation of Hunan Province, China (2022JJ20043), the Scientific Research Program of National University of Defense Technology (18/19-QNCXJ).
The authors acknowledge the National Natural Science Foundation of China for supporting this study. The authors also thank NOAA and NECP/NCAR for providing their free multiple databases.
The authors declare that the research was conducted in the absence of any commercial or financial relationships that could be construed as a potential conflict of interest.
All claims expressed in this article are solely those of the authors and do not necessarily represent those of their affiliated organizations, or those of the publisher, the editors and the reviewers. Any product that may be evaluated in this article, or claim that may be made by its manufacturer, is not guaranteed or endorsed by the publisher.
Alexander, L. V., Zhang, X., Peterson, T. C., Caesar, J., Gleason, B., Klein Tank, A. M. G., et al. (2006). Global observed changes in daily climate extremes of temperature and precipitation. J. Geophys. Res. 111, D05109. doi:10.1029/2005JD006290
Chen, L,-X., Zhu, Q,-G., and Luo, H,-B. (199l). East Asian monsoon (in Chinese). Beijing: China Meteorological Press, 362.
Chen, Y., and Zhai, P, -M. (2013). Persistent extreme precipitation events in China during 1951-2010. Clim. Res. 57 (2), 143–155. doi:10.3354/cr01171
Ding, Y, -H., and Chan, J. (2005). the East asian summer monsoon: An overview. Meteorol. Atmos. Phys. 89, 117–142. doi:10.1007/s00703-005-0125-z
Folland, C. K., and Parker, D. E. (1995). Correction of instrumental biases in historical sea surface temperature data. Q. J. R. Meteorol. Soc. 121, 319–367. doi:10.1002/qj.49712152206
Goswami, B. N., Venugopal, V., Sengupta, D., Madhusoodanan, M. S., and Xavier, P. K. (2006). Increasing trend of extreme rain events over India in a warming environment. Science 314, 1442–1445. doi:10.1126/science.1132027
Groisman, P. Y., Karl, T. R., Easterling, D. R., Knight, R. W., Jamason, P. F., Hennessy, K. J., et al. (1999). Changes in the probability of heavy precipitation: Important indicators of climatic change. Clim. Change 42, 243–283. doi:10.1023/A:100.5432803188
Guan, Z., and Yamagata, T. (2003). The unusual summer of 1994 in east Asia: IOD teleconnections. Geophys. Res. Lett. 30, 1544. doi:10.1029/2002GL016831
He, C., Lin, A., Gu, D., Li, C., Zheng, B., Wu, B., et al. (2018). Using eddy geopotential height to measure the western North Pacific subtropical high in a warming climate. Theor. Appl. Climatol. 131 (1-2), 681–691. doi:10.1007/s00704-016-2001-9
Huang, R, -H. (1990). Studies on the teleconnections of the general circulation anomalies of East Asia causing the summer drought and floods in China and their physical mechanism. Sci. Atmos. Sin. 14 (1), 108–117, (in Chinese) Availabale at: https://kns.cnki.net/kcms/detail/detail.aspx?FileName=DQXK199001013&DbName=CJFQ1990.
Huang, R, -H., Xu, Y, -H., Wang, P, -F., and Zhou, L, -T. (1998). The features of the catastrophic floodover the Changjiang River basin during the summer of 1998 and cause exploration. Clim. Environ. Res. (in Chin. 3 (4), 300–313. doi:10.3878/j.issn.1006-9585.1998.04.02
Huang, R, -H., Xu, Y, -H., and Zhou, L, -T. (1999). The interdecadal variation of summer precipitations in China and the drought trend in North China. Plateau Meteorol. 18 (4), 465–476. https://kns.cnki.net/kcms/detail/detail.aspx?FileName=DQXK 200302002&DbName=CJFQ2003.
Huang, Y., Wang, H., Fan, K., and Gao, Y. (2015). The Western pacific subtropical high after the 1970s: Westward or eastward shift? Clim. Dyn. 44 (7/8), 2035–2047. doi:10.1007/s00382-014-2194-5
Kanamitsu, M., Ebisuzaki, W., Woollen, J., Yang, S.-K., Hnilo, J. J., Fiorino, M., et al. (2002). NCEP-DOE AMIP-II reanalysis (R-2). Bull. Am. Meteorol. Soc. 83 (11), 1631–1643.
Karl, T. R., and Knight, R. W. (1998). Secular trends of precipitation amount, frequency, and intensity in the United States. Bull. Am. Meteorol. Soc. 79, 231–241. doi:10.1175/1520-0477(1998)079<0231:STOPAF>2.0.CO;2
Kurihara, K., and Kawahara, M. (1986). Extremes of East Asian weather during the post ENSO years of 1983/84 Severe cold winter and hot dry summer. J. Meteorological Soc. Jpn. 64, 493–503. doi:10.2151/JMSJ1965.64.4_493
Li, S, -S., and Shou, S, -W. (2000). Equatorial eastern Pacific SST and analysis on causes of summerer flood/droughts in the Changjiang and Huaihe River basin. Q. J. Appl. Meteorololgy (in Chinese) 11 (3), 331–338. doi:10.3969/j.issn.1001-7313.2000.03.010
Lin, R., Zhu, J., and Zheng, F. (2016). Decadal shifts of East Asian summer monsoon in a climate model free of explicit GHGs and aerosols. Sci. Rep. 6, 38546. doi:10.1038/srep38546
Liu, B., Wu, G., Mao, J., and He, J. (2013). Genesis of the south asian high and its impact on the asian summer monsoon onset. J. Clim. 26 (9), 2976–2991. doi:10.1175/JCLI-D-12-00286.1
Liu, Y, -Y., and Ding, Y, -H. (2009). Influence of the western north pacific summer monsoon on summer rainfall over the Yangtze River basin. Chinese Journal of Atmospheric Sciences 33 (6), 1225–1237. https://d.wanfangdata.com.cn/periodical/daqikx200906009.
Lu, R, -Y., Dong, H, -L., Su, Q., and Ding, H. (2014). The 30-60-day intraseasonal oscillations over the subtropical Western North Pacific during the summer of 1998. Adv. Atmos. Sci. 31 (1), 1–7. doi:10.1007/s00376-013-3019-x
Mei, W., and Yang, X, -Q. (2005). Trends of precipitation variations in the mid-lower Yangtze River valley of China. JOURNAL OF NANJING UNIVERSITY(NATURAL SCIENCES) 41 (6), 577–589. doi:10.3321/j.issn:0469-5097.2005.06.001
Nitta, T. (1987). Convective activities in the tropical Western Pacific and their impact on the Northern Hemisphere summer circulation. Journal of the Meteorological Society of Japan. 64, 373–390. doi:10.2151/JMSJ1965.65.3_373
Pan, J, -S., Teng, D, -G., Zhang, F, -Q., Zhou, L, -L., Luo, L., Weng, Y, -H., et al. (2018). Dynamics of local extreme rainfall of super Typhoon Soudelor (2015) in East China. Sci. China Earth Sci. 61, 572–594. doi:10.1007/s11430-017-9135-6
Park, C. K., and Schubert, S. D. (1997). On the nature of the 1994 East Asian summer drought. J. Clim. 10 (5), 1056–1070. doi:10.1175/1520-0442(1997)010<1056:OTNOTE>2.0.CO;2
Peng, L, -X., Sun, Z, -B., Chen, H, -S., and Zhu, W. (2016). Analysis on the multi-center structure of summer south Asia high and its thermal influence factors. Chinese Journal of Atmospheric Sciences 40 (5), 1089–1106. doi:10.3878/j.issn.1006-9895.1601.14310
Qi, Y, -J., Zhang, R, -H., and Li, T. (2016). Structure and evolution characteristics of atmospheric intraseasonal oscillation and its impact on the summer rainfall over the Yangtze River basin in 1998. Chinese Journal of Atmospheric Sciences (in Chinese) 40 (3), 451–462. doi:10.3878/j.issn.1006-9895.1507.15107
Qian, Y, -F., Zhang, Q., and Zhang, X, -H. (2002). the South asian high and its effects on China’s mid-summer climate abnormality. Journal of Nanjing University(Natural Science) 38 (3), 295–307. doi:10.3321/j.issn:0469-5097.2002.03.004
Ren, F, -M., and Zhai, P, -M. (1998). Study on changes of China′s extreme temperatures during 1951-1990. SCIENTIA ATMOSPHERICA SINICA 22 (2), 217–226. https://kns.cnki.net/kcms/detail/detail.aspx?FileName=DQXK802.009&DbName=CJFQ1998.
Ren, X., Yang, X, -Q., and Sun, X. (2013). Zonal oscillation of Western Pacific Subtropical High and subseasonal SST variations during Yangtze persistent heavy rainfall events. J. Clim. 26 (22), 8929–8946. doi:10.1175/JCLI-D-12-00861.1
Shi, X, -H., and Wen, M. (2015). Distribution and variation of persistent heavy rainfall events in China and possible impacts of heating source anomaly over QinghaiXizang Plateau. Plateau Meteorology (in Chinese) 34 (3), 611–620. doi:10.7522/j.issn.1000-0534.2014.00039
Stone, D. A., Weaver, A. J., and Zwiers, F. W. (2000). Trends in Canadian precipitation intensity. Atmosphere-Ocean 28 (2), 321–347. doi:10.1080/07055900.2000.9649651
Su, B, -D., Jiang, T., Ren, G, -Y., and Chen, Z, -H. (2006). Observed trends of precipitation extremes in the Yangtze River basin during 1960 to 2004. Advances in Climate Change Research 2 (1), 9–14. doi:10.3969/j.issn.1673-1719.2006.01.002
Sun, X, -Y., Lou, Y, -L., Gao, X, -Y., Wu, M, -G., Li, M, -X., Huang, L, -N., et al. (2021). On the localized extreme rainfall over the great bay area in south China with complex topography and strong UHI effects. Mon. Weather Rev. 149, 2777–2801. doi:10.1175/MWR-D-21-0004.1
Suppiah, R., and Henessy, K. J. (1996). Trends in the intensity and frequency of heavy rainfall in tropical Australia and links with the Southerm Oscillation. Aust. Meteorol. Mag. 45, 1–17.
Suppiah, R., and Hennessy, K. J. (1998). Trends in total rainfall, heavy rain events and number of dry days in Australia, 1910–1990.Int. J. Climatol. 18:1141–1164. doi:10.1002/(sici)1097-0088(199808)18:10<1141::aid-joc286>3.0.co;2-p
Wang, J., Yu, J, -H., and He, J, -Q. (2015). The study on characteristic and change of extreme rainfall over Jianghuai region. Climatic Environ Res (in Chinese) 20 (1), 80–88. doi:10.3878/j.issn.1006-9585.2014.13222
Wang, L, -J., Chen, X., and Guan, Z, -Y., (2011). Relationship between the position variation of the West pacific subtropical high and the diabatic heating during persistent heavy rain events in yangtze-huaihe rivers basin. Journal of Tropical Meteorology 27 (3), 327–335. doi:10.3969/j.issn.1004-4965.2011.03.005
Wang, Z, -F., and Qian, Y, -F. (2009). Frequency and intensity of extreme precipitation events in China. Advances in Water Science 20 (1), 1–9. doi:10.14042/j.cnki.32.1309.2009.01.005
Wei, F,-Y. (2005). “The effect of different time scale factors on the summertime rainfall over the middle and lower reaches of the Yangtze River,” in Proceeding of the 2005 Annual Conference of Chinese Meteorological Society, Suzhou, Joctober 1, 2005, 1150–1155. (in Chinese).
Wu, G, -X., Mao, J, -Y., and Duan, -A. M. (2004). Recent progress in the study on the impacts of Tibetan plateau on asian summer climate. ACTA METEOROLOGICA SINICA 62 (5), 528–540. doi:10.3321/j.issn:0577-6619.2004.05.002
Xie, P., and Arkin, P. A. (1997). Global precipitation: A 17-year monthly analysis based on gauge observations, satellite estimates, and numerical model outputs. Bull. Am. Meteorol. Soc. 78 (11), 2539–2558. doi:10.1175/1520-0477(1997)078<2539:gpayma>2.0.co;2
Yamamoto, R., and Sakurai, Y. (1999). Long-term intensification of extremely heavy rainfall intensity in recent 100 years. World Resource Review 11, 271–281.
Yang, J, -H., Jiang, Z, -H., and Bai, H, -Z. (2008). Teleconnection between summer extreme precipitation event of east part of northwest China and pacific SSTA. Plateau Meteorology 27 (2), 331–338. doi:10.3969/j.issn.000-0534.2008.02-0331-08
Yang, S, -Y., Lu, Q, -F., Ju, X, -H., et al. (2011). The non-uniformity characteristic of extreme precipitation in Northeast China during the flood period during 1961-2010. Transactions of Atmospheric Sci. 34 (6), 756–762. doi:10.3969/j.issn.1674-7097.2011.06.014
Yang, X, -Q., Xie, Q., and Huang, S, -S. (1992). Correlations between drought/flood in Yangtze River valley and anomalies of central-eastern equatorial Pacific SST and Arctic sea ice extent. Journal of Tropical Meteorology (in Chinese) 8 (3), 261–266. doi:10.16032/j.issn.1004-4965.1992.03.009
Yao, X, -P., Yu, Y, -B., and Liu, H, -Z. (2005). Characteristicks of the subtropical anticyclone during the abnormal rainfall period over the huaihe river region 2003. Journal of Tropical Meteorology 21 (4), 393–401. doi:10.3969/j.issn.1004-4965.2005.04.007
Ye, T, -S., Zhi, R., Zhao, J, -H., and Gong, Z, -Q. (2014). The two annual northward jumps of the West Pacific Subtropical High and their relationship with summer rainfall in Eastern China under global warming. Chinese Phys. B 23 (6), 069203–069536. doi:10.1088/1674-1056/23/6/069203
Zhai, P, -M., and Pan, X, -H. (2003a). Change in extreme temperature and precipitation over northern China during the second half of the 20th century. Acta Geographica Sinica 58, 1–10. https://kns.cnki.net/kcms/detail/detail.aspx?FileName=DLXB 2003S1000&DbName=CJFQ2003.
Zhai, P, -M., Zhang, X, -B., Wan, H., and Pan, X, -H. (2005). Trends in total precipitation and frequency of daily precipitation extremes over China. J. Clim. 18 (7), 1096–1108. doi:10.1175/JCLI-3318.1
Zhai, P, -M., and Zou, X, -K. (2005). Changes in temperature and precipitation and their impacts on drought in China during 1951-2003. Advances in Climate Change Research 1 (1), 16–18. doi:10.3969/j.issn.1673-1719.2005.01.004
Zhang, D.-L., Lin, Y., Zhao, P., Yu, X., Wang, S., Kang, H., et al. (2013). The beijing extreme rainfall of 21 july 2012: “Right results” but for wrong reasons. Geophys. Res. Lett. 40, 1426–1431. doi:10.1002/grl.50304
Zhang, L., Zhi, X, -F., and Karray, F. (2010). Retinal vessel extraction by matched filter with first-order derivative of Gaussian. Comput. Biol. Med. 30 (4), 438–445. doi:10.1016/j.compbiomed.2010.02.008
Zhang, Q, -Y., and Tao, S, -Y. (1998). Influence of Asian mid high latitude circulation on East Asian summer rainfall. Acta Meteorologica Sinica (in Chinese) 56 (2), 199–211. doi:10.11676/qxxb1998.019
Zhang, Y, -L., and Ding, Y, -G. (2004). The teleconnection between summer extreme precipitation over east China and north pacific SST. Transactions of Atmospheric Sciences 27 (2), 244–252. doi:10.3969/j.issn.1674-7097.2004.02.014
Zhang, Y., Li, Y, -H., and Liu, K. (2015). Effect of western pacific subtropical high on regional rainfall anomalies in summer over huang-huai-hai plain. Arid Zone Research 32 (3), 518–525. doi:10.13866/j.azr.2015.03.16
Zhang, Y., Li, Y, -H., and Wang, J, -S. (2014). Analysis on the cause of the abnormally persistent high temperature in south of China in july 2013. Journal of Tropical Meteorology 30 (6), 1172–1180. doi:10.3969/j.issn.1004-4965.2014.06.018
Zhu, Z., and Li, T. (2016). A new paradigm for continental U.S. Summer rainfall variability: Asia-north America teleconnection. J. Clim. 29 (20), 7313–7327. doi:10.1175/JCLI-D-16-0137.1
Zhu, Z., and Li, T. (2018). Amplified contiguous United States summer rainfall variability induced by East Asian monsoon interdecadal change. Clim. Dyn. 50 (9/10), 3523–3536. doi:10.1007/s00382-017-3821-8
Keywords: extreme precipitation, interdecadal change, southern asian subtropical high, western pacific subtropical high, sea surface temperature, atmospheric circulation anomalies
Citation: Zang Z, Luo J and Ha Y (2022) Interdecadal Increase in Summertime Extreme Precipitation over East China in the Late 1990’s. Front. Earth Sci. 10:969853. doi: 10.3389/feart.2022.969853
Received: 15 June 2022; Accepted: 25 July 2022;
Published: 31 August 2022.
Edited by:
Xiefei Zhi, Nanjing University of Information Science and Technology, ChinaReviewed by:
Zhiwei Zhu, Nanjing University of Information Science and Technology, ChinaCopyright © 2022 Zang, Luo and Ha. This is an open-access article distributed under the terms of the Creative Commons Attribution License (CC BY). The use, distribution or reproduction in other forums is permitted, provided the original author(s) and the copyright owner(s) are credited and that the original publication in this journal is cited, in accordance with accepted academic practice. No use, distribution or reproduction is permitted which does not comply with these terms.
*Correspondence: Junyao Luo, bHVvanVueWFvMTk5OEAxNjMuY29t; Yao Ha, aGF5YW8xOTg2QHllYWgubmV0, aGF5YW84NkBudWR0LmVkdS5jbg==
Disclaimer: All claims expressed in this article are solely those of the authors and do not necessarily represent those of their affiliated organizations, or those of the publisher, the editors and the reviewers. Any product that may be evaluated in this article or claim that may be made by its manufacturer is not guaranteed or endorsed by the publisher.
Research integrity at Frontiers

Learn more about the work of our research integrity team to safeguard the quality of each article we publish.