 Aldo Febriansyah Putra
 Piyaphong Chenrai
94% of researchers rate our articles as excellent or good
Learn more about the work of our research integrity team to safeguard the quality of each article we publish.
Find out more
ORIGINAL RESEARCH article
Front. Earth Sci., 23 August 2022
Sec. Quaternary Science, Geomorphology and Paleoenvironment
Volume 10 - 2022 | https://doi.org/10.3389/feart.2022.969170
This article is part of the Research TopicFrontiers in Southeast Asian Geosciences, volume IIView all 7 articles
Geomorphic indices have widely been applied to assess relative tectonic activity. The relative tectonic activity is mainly associated with relative uplift and long-term tectonic deformation. By considering this, the strike-slip basins along the Northern Sumatran Fault become suitable locations for the assessment. This study aims to evaluate the relative tectonic activity of the Northern Sumatran Fault with the focus on its strike-slip basins using geomorphic indices. This study utilized the Indonesian national digital elevation model (DEMNAS) with spatial resolution at 8.25-m. Here are the six geomorphic indices applied in this study along with the average values of the results: mountain front sinuosity (1.14–1.94), valley width-to-height ratio (0.58–1.93), stream length-gradient index (93.81–599.70), index of basin shape (1.66–3.16), asymmetric factor (7.45–19.93), and hypsometric integral (0.41–0.59). These results were used to generate the index of relative tectonic activity. The Northern Sumatran Fault exhibits, generally, alternating moderate and high tectonic activities and there is a northward decrease from very high to moderate tectonic activity in its northern part. The variation of relative tectonic activity of the fault coincides with the distribution of seismicity. This may suggest that the long-term tectonic deformation of the Northern Sumatran Fault has persisted to recent time.
The increased availability of digital elevation models (DEM) and Geographic Information System (GIS) based interpretation software has supported the applications of relative tectonic activity assessment using geomorphic indices, as reflected by the growing number of studies on this topic approximately in the last 20 years worldwide (Koukouvelas et al., 2018). These two aspects enable the extraction and analysis of landscape information in great detail. Relative tectonic activity assessment from geomorphic indices represents relative uplift rates and long-term tectonic deformation (Bull, 2007; Frankel and Owen, 2013). This assessment has been widely applied in varying tectonic settings and scales: extensional regime (Ramírez-Herrera, 1998; Özkaymak and Sözbilir, 2012; Özkaymak, 2015; Tepe and Sözbilir, 2017), compressional regime (Wells et al., 1988; Selçuk, 2016; Mishra, 2019; Rimando and Schoenbohm, 2020), and strike-slip regime (Gürbüz and Gürer, 2008; Sarp and Düzgün, 2012; Sarp et al., 2013; Selim et al., 2013; Sarp, 2015; Khalifa et al., 2018; Saber et al., 2018; Elias et al., 2019). Wide applications of the relative tectonic activity assessment using geomorphic indices have demonstrated the reliability of this approach in addressing the distribution of tectonic activity in an area.
The Sumatran Fault is a 1900-km long right-lateral fault and is seismically-active. The Sumatran Fault traverses the Barisan Mountains with lazy-Z geometry and is located in close proximity with arc volcanoes (Figure 1A). Previous studies on the geomorphic expressions and seismicity clustering divided the Sumatran Fault into 16–19 segments (Bellier et al., 1997; Sieh and Natawidjaja, 2000; Burton and Hall, 2014; Natawidjaja, 2018). Since the Sumatran Fault is highly-segmented and most of the segments are arranged in right-stepping manner, this fault is related to more than a dozen of strike-slip basins along its length (Muraoka et al., 2010; Sutrisno et al., 2019). The occurrences of strike-slip basins along its length make the Sumatran Fault a suitable tectonic feature for the assessment of relative tectonic activity. Although, this study is focused on strike-slip basins, the results from this study can be applied to other tectonic basins.
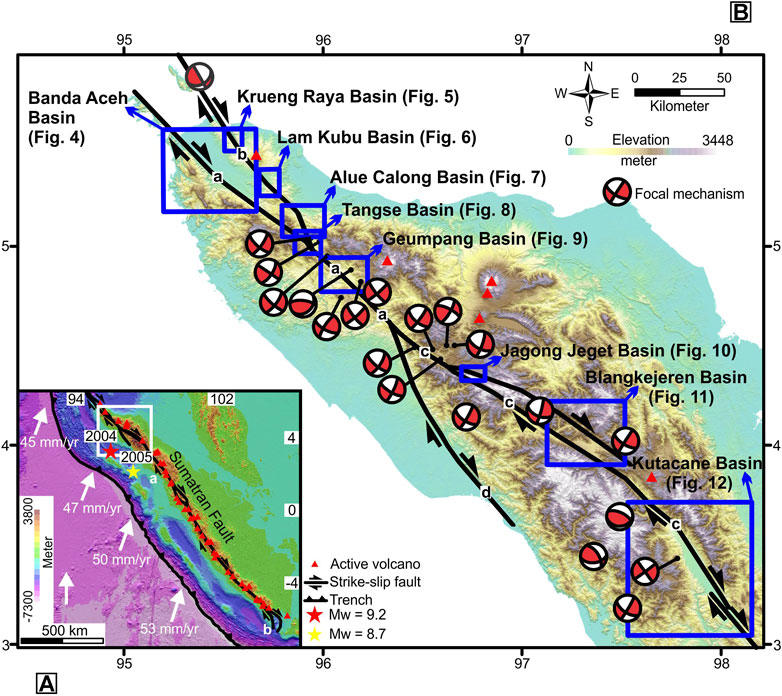
FIGURE 1. Map of: (A) tectonic features of Sumatra showing the locations of Singkel Basin (a), Sunda Strait (b), and the epicentres of 2004 and 2005 megathrust earthquakes. The convergence rates and directions are referring to Delescluse and Chamote-Rooke (2007). (B) Regional map of the Northern Sumatran Fault and the study locations. The analyzed basins are indicated in the blue rectangles. The main faults in this region are the Aceh (a), Seulimeum (b), Tripa (c), and Batee (d) Faults. Focal mechanisms are from Global Centroid Moment Tensor database (Dziewonski et al., 1981; Ekström et al., 2012).
This study is focused on the assessment of relative tectonic activity by using geomorphic indices in the Northern Sumatran Fault (Figure 1B). In terms of earthquake history, the northern part of the Northern Sumatran Fault is considered as seismic gap of earthquake equal to or greater than 7.0 (Hurukawa et al., 2014). Large earthquakes were related to the southern part of the Northern Sumatran Fault and occurred in 1935 and 1936. Moreover, four paleoseismic events were documented in the northern section of this fault with recurrence interval of 130–210 years (Tsutsumi et al., 2020) and it shows absence of large earthquake, at least, in about 130 years (Hurukawa et al., 2014). On the other hand, the 2004 Mw 9.2 Sumatra-Andaman and 2005 Mw Nias Earthquakes (Figure 1A) increased the seismic hazard of this fault due to the stress changes (Cattin et al., 2009). With this earthquake history, there is a need to assess the relative tectonic activity of the Northern Sumatran Fault in long-term period through geomorphic indices.
The assessment of relative tectonic activity from geomorphic indices is applicable to evaluate relative uplift rates, thus, strike-slip basin is a suitable tectonic feature. Not only does the fault-bounded area in a strike-slip basin undergoes subsidence, but also the basin flanks experience uplift based on numerical models (e.g., van Wijk et al., 2017; Nabavi et al., 2018). Moreover, previous studies on the tectonic activity of the Northern Sumatran Fault mainly focused on the strike-slip motion of the fault (e.g., Ito et al., 2012; Muksin et al., 2018; Simanjuntak et al., 2018; Tong et al., 2018; Muksin et al., 2019). Hence, it is necessary to evaluate the tectonic activity of the Northern Sumatran Fault based on vertical motion and to under the possible relationship between different indices and geomorphological features in the study area.
Nine strike-slip basins along the Northern Sumatran Fault were evaluated in this study (Figure 1B). The purpose of this study is to assess the relative tectonic activity of the Northern Sumatran Fault with the focus on its strike-slip basins using geomorphic indices. Mountain-front sinuosity (Smf), valley width-to-height ratio (Vf), stream length-gradient index (SL), index of basin shape (Bs), asymmetric factor (AF), and hypsometric integral (HI) were applied in this study. Index of relative tectonic activity (Iat) was generated by combining the analyzed geomorphic indices and was employed to show the relative uplift along the Northern Sumatran Fault.
Sumatra is situated in oblique subduction setting which is responsible in the generation of trench-parallel strike-slip fault and arc volcanism. As a trench-parallel strike-slip fault, the Sumatran Fault is interpreted to be driven by slip partitioning (McCaffrey et al., 2000; McCaffrey, 2009; Cao and Neubauer, 2016; Bradley et al., 2017). Based on the slip partitioning interpretations, most of dip-slip motion is accommodated by the accretionary prism, while the strike-slip motion is taken by the Sumatran Fault. In this case, the fore-arc sliver block moves rigidly to the northwest while the subducting plate undergoes diffuse internal deformation (Bradley et al., 2017). This interpretation is based on the consistent geodetic and geological slip-rates of about 14–15 mm/yr along the Sumatran Fault and the northward decrease of plate convergence rate (Bradley et al., 2017).
The onset of the Sumatran Fault should be examined by considering the tectonic events in the Singkel Basin, Sunda Strait, and the Barisan Mountains. The Batee Fault, a branch of the Sumatran Fault (Figure 1B), continued to the offshore and was interpreted to cause right-lateral offset of the Paleogene continental margin in the Late Oligocene (Karig et al., 1980). Moreover, the Singkel Basin is a N-S elongated basin bounded to the west by the Batee Fault (Matson and Moore, 1992), while pull-apart basins developed due to the Sumatran Fault in the Sunda Strait (Susilohadi et al., 2009). Both the Singkel Basin and the pull-apart basins in the Sunda Strait showed opening of the basin in the Late Miocene (Matson and Moore, 1992; Susilohadi et al., 2009). In the Pliocene, the depocenter of the Singkel Basin migrated southwards and the graben system in the Sunda Strait became increasingly well-developed (Matson and Moore, 1992; Susilohadi et al., 2009). The Barisan Mountains reached its peak uplift in the Late Pliocene and this event must have been related to major activity of the Sumatran Fault (de Smet and Barber, 2005). Thus, Late Miocene and Late Pliocene could be important periods for the development of the Sumatran Fault. For further reading on this topic, schematic illustration on the evolution of the Sumatran Fault since Late Oligocene is provided by Sutrisno et al. (2021).
The Northern Sumatran Fault consists of four segments based on geomorphic expression (Sieh and Natawidjaja, 2000; Natawidjaja, 2018): the Aceh, Seulimeum, Tripa, and Batee Faults. The Northern Sumatran Fault displays mainly right-lateral strike-slip focal mechanisms along its length (Figure 1B). Using local seismicity network, Muksin et al. (2019) found that the Northern Sumatran Fault can be detected to the depth of about 16 km and the most active section of this fault approximately stretches from about 4.4oN to 5.1oN. Fernández-Blanco et al. (2015) found that the maximum principal stress is oriented in NNE-SSW from field evidence in the northern section of this fault.
The Aceh and Seulimeum Faults are located in the northern part of the study area and merge at about 5oN (Figure 1B). The Aceh Fault forms the mountain-piedmont boundary in the northern part of its section before continuing southward to the mountainous area (Figure 1B). Sieh and Natawidjaja (2000) reported right-lateral stream offset of about 20 km due to the Aceh Fault in the mountainous area. Moreover, Ito et al. (2012) and Tong et al. (2018) revealed that the Aceh Fault displays creeping segment. The creeping segment extends from about 4.2oN to 5.0oN (Tong et al., 2018). Ito et al. (2012) yielded geodetic slip-rate of about 20 ± 6 mm/yr from Global Positioning System (GPS), while Tong et al. (2018) concluded maximum slip-rate of about 22 mm/yr based on interferometric synthetic aperture radar (InSAR). Furthermore, the Aceh Fault was related to the 2013 Mw 6.1 earthquake which took place near the Tangse and Geumpang Basins (Ito et al., 2016). The earthquake showed right-lateral movement in NW-SE direction and it caused maximum horizontal co-seismic offset of 7.4 cm near the Geumpang Basin (Ito et al., 2016).
The Seulimeum Fault has dilatational stepover and part of its section crosses Pliocene sedimentary unit and Quaternary volcanic deposit (Bennett et al., 1981; Sieh and Natawidjaja, 2000). Previous studies found that Seulimeum Fault shows higher recent tectonic activity than the Aceh Fault in their northern section based on the geomorphic expression (Tabei et al., 2015; Natawidjaja 2018; Tsutsumi et al., 2020). In terms of earthquake history, the Seulimeum Fault has four surface-rupturing events that occurred between 1,265–1365 AD and 1892 AD (Tsutsumi et al., 2020). This fault was also related to an earthquake with magnitude of 6.7 in 1964 (Hurukawa et al., 2014). Regarding the distribution of seismicity, greater numbers of earthquake occur at the junction of the Aceh and Seulimeum Faults (Muksin et al., 2018). The Seulimeum Fault coincides with the occurrences of earthquake along its length until the Krueng Raya Basin, while the northern section of the Aceh Fault displays the absence of earthquake (Muksin et al., 2018).
Tripa and Batee Faults are major strike-slip faults in the southern part of the study area and they diverge at about 4.5oN. The Tripa Fault is characterized by restraining bend and graben valley in the northwest and southeast, respectively (Sieh and Natawidjaja, 2000). The activity of the Tripa Fault is shown by the stream offset of about 21 km in the Kuala Tripa and Meureubo Rivers (Sieh and Natawidjaja, 2000). The Tripa Fault is related to the large earthquakes in 1935 and 1936 with magnitude of 7.0 and 7.2, respectively (Hurukawa et al., 2014). Ito et al. (2012) reported geodetic slip-rate of 16 ± 6 mm/yr related to this fault. In addition, the Batee Fault shows minor tectonic activity based on geomorphic expression (Sieh and Natawidjaja, 2000) and negligible geodetic slip-rate (Ito et al., 2012).
This study focuses on the nine strike-slip basins along the Northern Sumatran Fault (Figure 1B). The 8.25-m digital elevation model (DEM) of DEMNAS, provided by the Geospatial Information Agency, the Republic of Indonesia, was used in this study. DEMNAS is considered as a suitable data source for geomorphic study due to better resolution compared to other data source (e.g., Koukouvelas et al., 2018). DEMNAS is the result of combining trusted mass-point data with Interferometric Synthetic Aperture Radar (IFSAR 5-m spatial resolution), TerraSAR-X (5-m spatial resolution), and Advanced Land Observing Satellite Phased Array Type L-band Synthetic Aperture Radar (ALOS PALSAR; 11.25-m spatial resolution) (Geospatial Information Agency, 2018). In addition, EGM2008 is used as the vertical datum (Geospatial Information Agency, 2018).
The data were imported and analyzed within ArcGIS 10.8.1 software package. This study used the main segments of the Sumatran Fault from Sieh and Natawidjaja (2000) and Natawidjaja (2018) to outline the fault zone. To identify the occurrences of strike-slip basins, the DEM was used to generate shaded relief models and slope maps. The distinguishing feature of a strike-slip basin is the basin-bounding fault which is represented by mountain front. The mountain front can be delineated on the shaded relief models and it is marked by the break in slope.
The drainage basins and streams were extracted using Spatial Analyst and Conversion toolboxes in ArcGIS 10.8.1 giving accurate basin geometry and stream length. The drainage basins analyzed in this study are representative to the tectonic activity of the basin-bounding fault. It is because the drainage basins host the transverse streams that cross the mountain fronts and the mountain fronts act as the pour points of the drainage basins. The drainage basins with area equal to or greater than 0.25 km2 were analyzed in this study, adapted from Rimando and Schoenbohm (2020). Threshold value on the area of drainage basins is needed to prevent small basins that are unrelated to fluvial activity (Rimando and Schoenbohm, 2020). Drainage basins and streams that fulfilled this criterion were then selected.
In order to investigate the relative tectonic activity of the strike-slip basins along the Northern Sumatran Fault, six geomorphic indices were performed and the results were grouped into classes. Measurement procedures of the geomorphic indices in this study are presented in Figure 2. A single index of relative tectonic activity (Iat) was then calculated from the six indices in each of the basin-bounding fault.
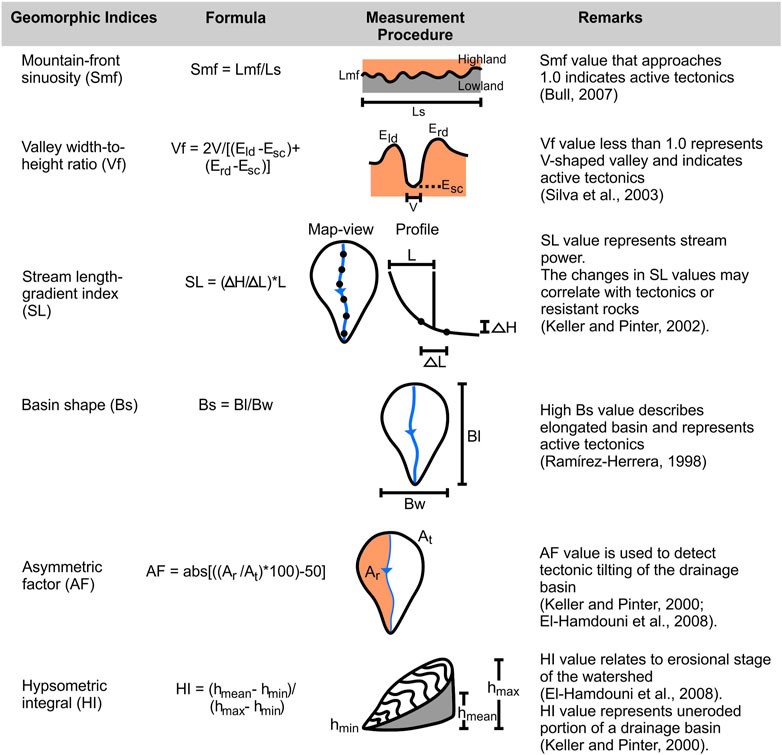
FIGURE 2. Measurement procedures of the geomorphic indices used in this study. Explanations on the abbreviations are provided in the text.
Mountain front sinuosity (Smf) is defined as the ratio between the length of the mountain front (Lmf) and the length of the structure (Ls) (Figure 2). The Smf is used to assess the interplay between erosional processes tending to erode mountain front making it more sinuous and active vertical tectonics leading to a straight mountain front (Bull, 2007; El-Hamdouni et al., 2008). Smf values approaching 1.0 suggest the most tectonically-active mountain fronts. Smf values increase when the uplift of tectonic activity is reduced and erosional process increases in mountain front (El-Hamdouni et al., 2008). For the classification of Smf values, this study assigns Smf Class 1 to range from 1.0 to 1.5 (highly-active structure), Smf Class 2 from 1.5 to 3.0 (moderately-active structure), and Smf Class 3 for Smf values greater than 3.0 (inactive structure) based on Bull (2007).
The valley width-to-height ratio (Vf) is described as the ratio between the width of the valley and the mean height of the divide (Figure 2). This ratio involves the width of the valley (V), elevation of the channel floor (Esc), and elevation of the drainage divides (Eld and Erd; elevation of the drainage divides to the left and right of the main stream, respectively). Vf is implemented to assess the balance between tectonic activity and the downcutting of stream. Vf values less than 1.0 indicate V-shaped valley and active faulting, while Vf values greater than 1.0 are related to U-shaped valley and greater role of erosion (Silva et al., 2003).
Measurements for Vf values in this study were conducted at a distance of about 250–500 m from the mountain front, depending on the drainage basin area. The measurements were applied in a cross-section approximately perpendicular to the stream flow. The measurements were implemented on main streams in the drainage basins. The classification of Vf values in this study is adapted from El-Hamdouni et al. (2008) as following: Vf Class 1 (Vf<0.5; narrow V-shaped valley), Vf Class 2 (0.5≤Vf<1.0; V-shaped valley), and Vf Class 3 (Vf≥1.0; U-shaped valley).
This study implemented the stream length-gradient index of Hack (1973). The stream length-gradient index (SL) incorporates the gradient of a channel reach (∆H/∆L; ∆H: difference in elevation; ∆L: length of the channel reach) and the distance from the divide to the midpoint of the stream being evaluated (L) (Figure 2). SL values along the streamline demonstrate the stream power (Keller and Pinter, 2002). If the stream has reached its equilibrium, the SL values become constant or gently change (Burbank and Anderson, 2012). High SL values may be caused by resistant underlying formation or tectonic effect (Keller and Pinter, 2002; Burbank and Anderson, 2012).
In this study, SL values were determined along the transverse streams until they reached the mountain fronts. To obtain the gradient, this study used ∆L of 200 m. The SL values of the transverse streams developing in each basin-bounding fault block were averaged for the purpose of classification. SL values are modified from Tarı and Tüyüz (2016) and grouped into three classes including SL Class 1 (SL>400; high stream power), SL Class 2 (100<SL≤400; moderate stream power), and SL Class 3 (SL≤100; low stream power). On the other hand, the SL values were interpolated into maps using kriging method to show the spatial variation of the stream power.
The index of basin shape (Bs) is applied to describe the plan-view geometry of the drainage basin. This index involves the planimetric length (Bl) and width (Bw) of the drainage basins (Figure 2). This index compares elongated drainage basins with high Bs values with those more circular with lower Bs values (Ramírez-Herrera, 1998). Elongated basin (high Bs values) during high tectonic activity becomes to circular basin (low Bs values) through constant topographic development during low tectonic activity (Kumar et al., 2022).
In this study, Bl was measured from the river mouth to the farthest point in the drainage basin, while Bw was determined at the widest portion of the drainage basin. The Bs values classified from previous studies are differently applied for several study areas. For example, El-Hamdouni et al. (2008) divided Bs values to three classes: Bs Class 1 (Bs≥4), Bs Class 2 (3≤Bs<4), and Bs Class 3 (Bs<3), while Elias (2015) divided Bs values as Bs Class 1 (2.93<Bs<4.37), Bs Class 2 (1.8<Bs<2.47), and Bs Class 3 (1.24<Bs<1.70). In this study, Bs values are categorized in three classes: Bs Class 1 (Bs≥3.0; highly-elongated drainage basin), Bs Class 2 (1.5≤Bs<3.0; elongated drainage basin), and Bs Class 3 (Bs<1.5; less elongated drainage basin).
The asymmetric factor (AF) is used to evaluate tectonic effect on the tilting of the drainage basins (Keller and Pinter, 2002; El-Hamdouni et al., 2008). The AF value is generated by making the ratio between the area of the drainage basin to the right of the main stream (Ar; relative to the streamflow direction) and the total area of the drainage basin (At) (Figure 2). AF values that approach 0 indicate that the drainage basins are symmetric, while greater AF values indicate asymmetric basins and tectonic tilting has developed. The AF values are modified from Pérez-Peña et al. (2010) and grouped into three classes including AF Class 1 (AF>15; highly-asymmetric drainage basin), AF Class 2 (5<AF≤15, asymmetric drainage basin), and AF Class 3 (AF≤5; symmetric drainage basin).
The hypsometric integral (HI) describes the distribution of elevation in a given basin and represents the area below hypsometric curve or the volume of the basin that has been uneroded (Strahler, 1952; Keller and Pinter, 2002). Parameters used in the calculation of HI included maximum elevation (hmax), minimum elevation (hmin), and average elevation (hmean) of the drainage basin (Figure 2). El-Hamdouni et al. (2008) used HI values to indicate erosional stage of the watershed. Meanwhile, Sarp et al. (2013) demonstrated the use of HI values to indicate the relative dominance between tectonics and erosion. HI values are also related to tectonic uplift rates as exemplified by Gao et al. (2013) and Khalifa et al. (2018). In this study, HI values were grouped into three classes according to El-Hamdouni et al. (2008): HI Class 1 (HI>0.5; youthful morphology), HI Class 2 (0.4≤HI≤0.5; mature morphology), and HI Class 3 (HI<0.4; old morphology). By considering the uses of HI values from previous authors, youthful morphology tends to relate to active tectonics, while mature morphology may represent the balance between tectonics and erosion. Old morphology may develop with the dominance of erosional processes.
The values of geomorphic indices are commonly categorized into classes to help the recognition of low, moderate, and high tectonic activity (e.g., El-Hamdouni et al., 2008; Sarp et al., 2013; Saber et al., 2018). El-Hamdouni et al. (2008) summarized the geomorphic indices into the index of relative tectonic activity (Iat). Iat is calculated by combining all the classes of the geomorphic indices used in this study, and then the combing value is divided by the number of the used geomorphic indices for each basin-bounding fault (El-Hamdouni et al., 2008). Hence, the basin-bounding faults in this study are classified based on Iat values to define the degree of tectonic activity. In this study, Iat classification is adapted from El-Hamdouni et al. (2008): Iat Class 1 (Iat<1.5; very high tectonic activity), Iat Class 2 (1.5≤Iat<2.0; high tectonic activity), and Iat Class 3 (2.0≤Iat<2.5; moderate tectonic activity). The spatial variation of the Iat values along the Northern Sumatran Fault will be addressed in this study.
The assessment of the relative tectonic activity of the Northern Sumatran Fault is focused on the strike-slip basins as indicated in Figure 1B. The geomorphic indices were evaluated in the basin-bounding faults of the strike-slip basins. Summary on the results of the geomorphic indices is provided in Figure 3.
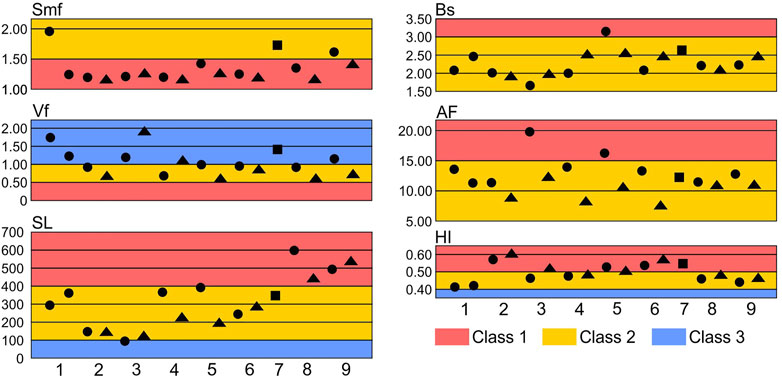
FIGURE 3. Geomorphic indices of the strike-slip basins along the Northern Sumatran Fault: Smf, mountain front sinuosity; Vf, valley width-to-height ratio; SL, stream length-gradient index; Bs, index of basin shape; AF, asymmetric factor; HI, hypsometric integral. The average values and classes of the geomorphic indices measured from the eastern (triangle shapes) and western (circular shapes) basin-bounding faults. The Jagong Jeget Basin is measured from the main basin-bounding fault (rectangle shapes). Numbers at the base of the chart correspond to the names of the strike-slip basins and they follow the order in the result section.
The Banda Aceh Basin is bounded to the west by the Aceh Fault (Figures 1B, 4A). The Aceh Fault is expressed as two segments in the north and south, namely the western basin-bounding fault 1 and 2, respectively (Figure 4A). The western basin-bounding fault 1 has Smf values ranging from 1.44 to 2.54 with average Smf value of 1.94 (Figure 3). The western basin-bounding fault 2 shows Smf value of 1.23 (Figure 3). The Smf values in the western basin-bounding fault 1 are dominated by Smf Class 2, while the western basin-bounding fault 2 only has the Smf Class 1 (Figure 4B). The Vf values of the western basin-bounding fault 1 range from 0.34 to 9.81 with average value of 1.74. The western basin-bounding fault 2 possesses Vf values spanning from 0.53 to 1.83 and the average Vf value is 1.23. As illustrated in Figures 4B,Vf Class 3 dominates both of the basin-bounding faults and the proportion decreases towards Vf Class 1. The western basin-bounding fault 2 shows the absence of Vf Class 1.
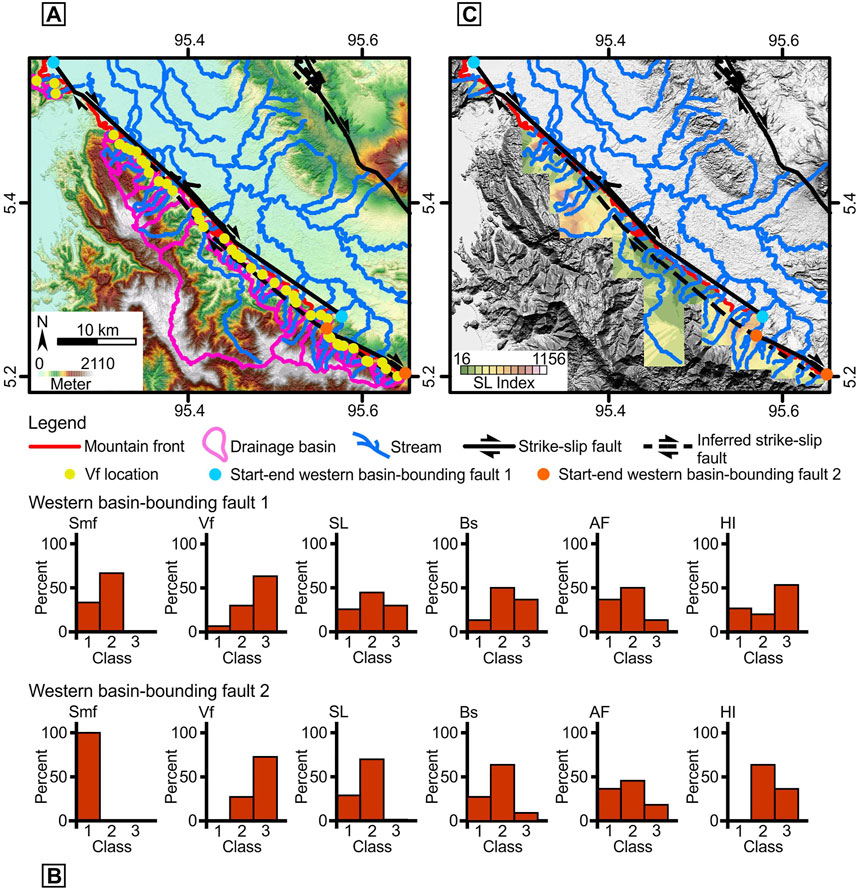
FIGURE 4. The Banda Aceh Basin: (A) the mountain fronts, faults, and drainage basins, (B) classification of geomorphic indices, and (C) stream length-gradient map.
The western basin-bounding fault 1 and 2 have average SL values of 294.84 and 359.47, respectively (Figure 3). The SL Class 2 dominates both in the western basin-bounding fault 1 and 2 (Figure 4B). However, the western basin-bounding fault 1 has similar proportion of SL Class 1 and 3 while the western basin-bounding fault 2 has SL Class 1 far larger than the SL Class 3. Regarding the spatial variation of the SL values, the western basin-bounding fault 1 shows less developed downstream increase in SL values compared to the western basin-bounding fault 2 (Figure 4C).
The western basin-bounding fault 1 and 2 have 30 and 11 drainage basins, respectively. The average Bs values of the western basin-bounding fault 1 and 2 are 2.09 and 2.48. The Bs values of the western basin-bounding fault 1 range from 0.70 to 6.05, while the western basin-bounding fault 2 has Bs values from 0.71 to 3.75. As shown in Figure 4B, both basin-bounding faults show the dominance of Bs Class 2. However, Bs Class 3 takes greater proportion than Bs Class 1 in the western basin-bounding fault 1 and the western basin-bounding fault 2 has the opposite distribution. In terms of drainage basin asymmetry, the average AF values of the western basin-bounding fault 1 and 2 are 13.66 and 11.45, respectively. The AF values range from 0.19 to 37.40 in the western basin-bounding fault 1, while the western basin-bounding fault 2 has AF values from 0.03 to 21.54. The western basin-bounding fault 1 and 2 display similar pattern and the AF Class 2 dominate in both faults (Figure 4B). Moreover, the average HI values of 0.41 and 0.42 are owned by the western basin-bounding fault 1 and 2, respectively. The western basin-bounding fault 1 shows HI values starting from 0.24 to 0.60. The HI values ranging from 0.31 to 0.48 can be observed in the western basin-bounding fault 2. The HI values in western basin-bounding fault 1 are dominated by HI Class 3 and followed by the HI Class 1 and HI Class 2. For the western basin-bounding fault 2, the HI Class 2 holds greater proportion (Figure 4B) and the HI Class 3 takes smaller part, while the HI Class 1 is absent.
The Krueng Raya Basin is situated within the zone of the Seulimeum Fault (Figures 1B, 5A). The geomorphic indices were measured in the eastern and western basin-bounding faults. The Smf values of the eastern basin-bounding faults are 1.12 and 1.15, thus yielding average Smf value of 1.14. The western basin-bounding fault possesses Smf values of 1.15 and 1.21 with average Smf value of 1.18. Smf values in both of the basin-bounding faults are classified as Smf Class 1 (Figure 5B). The Vf values in the eastern basin-bounding fault range from 0.35 to 1.19 with average of 0.70. The western basin-bounding fault has Vf values from 0.32 to 1.67 and the average Vf value is 0.92. Both of the basin-bounding faults are dominated with Vf Class 2 as shown in Figure 5B. The eastern basin-bounding fault has the Vf Class 1 as the second highest proportion, while the western basin-bounding fault possesses the Vf Class 2 followed by Vf Class 3 and 1 (Figure 5B).
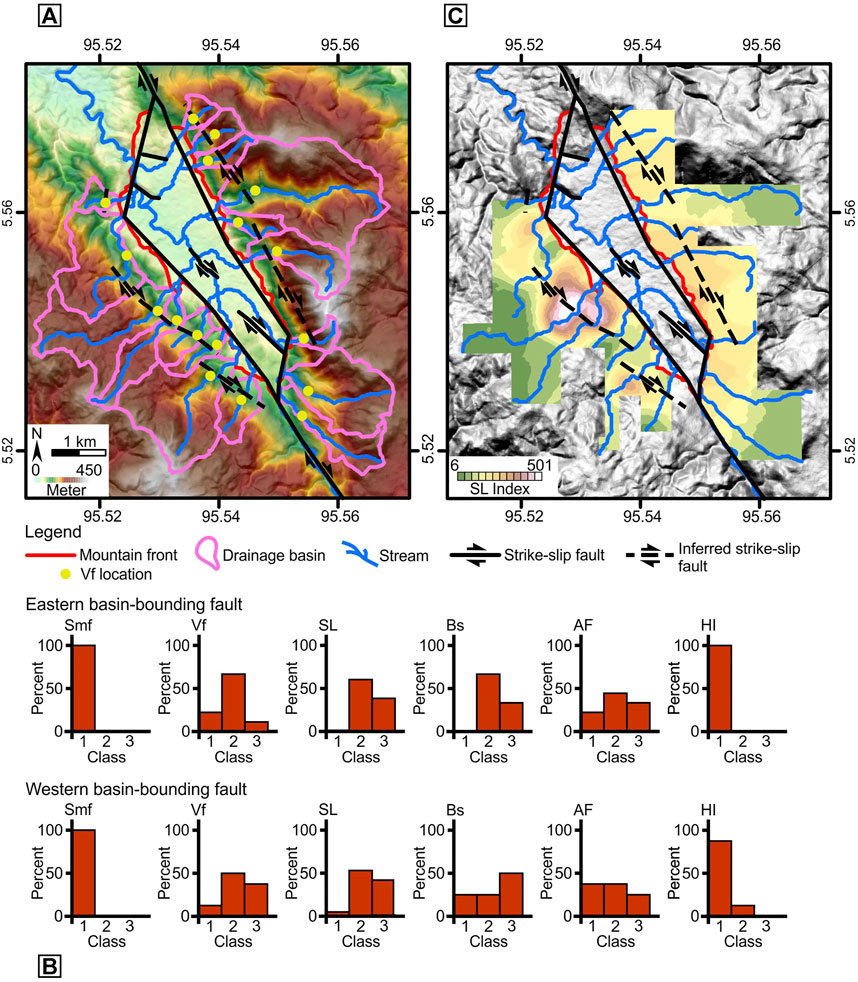
FIGURE 5. The Krueng Raya Basin: (A) the mountain fronts, faults, and drainage basins, (B) classification of geomorphic indices, and (C) stream length-gradient map.
The eastern and western basin-bounding faults of the Krueng Raya Basin have similar average SL values of 141.28 and 146.09, respectively. Both of the basin-bounding faults have similar classification of SL values where the SL Class 2 takes the largest proportion followed by the SL Class 3. The SL Class 1 constitutes small proportion in both of the basin-bounding faults. The SL values in both basin-bounding faults, generally, increase downstream (Figure 5C), demonstrating the evidence of active deformation. In the western basin-bounding fault block, higher SL values coincide with the inferred strike-slip fault (Figure 5C).
The Krueng Raya Basin has 9 and 8 drainage basins in the east and west, respectively. The drainage basins in the eastern basin-bounding fault block show Bs values spanning from 1.05 to 2.89 with Bs average value of 1.90. The western basin-bounding fault has Bs values from 1.19 to 3.52 and the average Bs value is 2.01. The eastern basin-bounding fault is dominated by Bs Class 2 and followed by Bs Class 3 with the absence of Bs Class 1 (Figure 5B). On the other hand, the western basin-bounding fault has Bs Class 3 as the highest proportion and the Bs Class 1 and 2 with the same proportion. Furthermore, the average AF values for the eastern and western basin-bounding faults are 8.88 and 11.45, respectively. The AF values in the eastern basin-bounding fault stretch from 0.52 to 27.22, while the western basin-bounding fault has AF values from 0.98 to 26.02. Both of the basin-bounding faults are dominated with AF Class 2, but the AF Class 1 and 3 show opposite pattern in the two basin-bounding faults (Figure 5B). Moreover, the average HI values of the eastern and western basin-bounding faults, are 0.59 and 0.56, respectively. The HI values in the eastern basin-bounding fault range from 0.55 to 0.64. The western basin-bounding fault has HI values ranging from 0.48 to 0.64. The two basin-bounding faults are dominated by HI Class 1 as shown in Figure 5B.
The Lam Kubu Basin is formed by the Seulimeum Fault (Figures 1B, 6A). The eastern basin-bounding faults of this basin has Smf values from 1.13 to 1.41 and the average Smf value is 1.24. The Smf values of the western basin-bounding faults are from 1.04 to 1.42 with the average Smf value of 1.20. All of the Smf values in the eastern and western basin-bounding faults are grouped into the Smf Class 1 (Figure 6B). The eastern basin-bounding fault has the highest average Vf value in the study area with 1.93. The Vf values range from 0.72 to 3.09 in the eastern basin-bounding fault. Meanwhile, the western basin-bounding fault has Vf values from 0.44 to 2.21 with the average Vf value of 1.19. As shown in Figure 6B, the eastern and western basin-bounding faults show that the proportion decreases from Vf Class 3 to Vf Class 1.
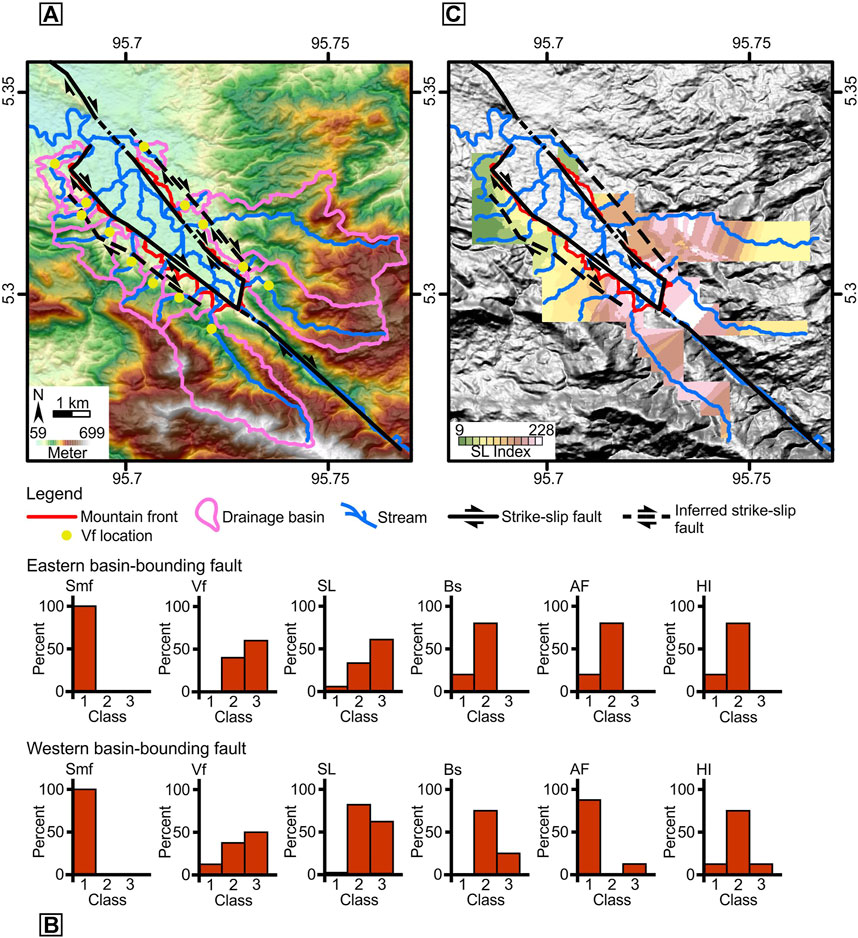
FIGURE 6. The Lam Kubu Basin: (A) the mountain fronts, faults, and drainage basins, (B) classification of geomorphic indices, and (C) stream length-gradient map.
The eastern basin-bounding fault possesses average SL value of 119.61, while the western basin-bounding fault has the lowest average SL value in the study area with 93.81 (Figure 3). The eastern basin-bounding fault has SL values dominated by SL Class 3, while the western basin-bounding fault has SL Class 2 with the highest proportion. As shown in the Figure 6C, the SL values in both basin-bounding faults, generally, increase downstream, becoming an indication of active deformation.
The Lam Kubu Basin has 5 and 8 drainage basins in the east and west, respectively. The eastern basin bounding fault has Bs values from 1.55 to 3.00 with average Bs value of 1.97. The Bs values range from 0.74 to 2.31 in the western basin-bounding fault with the average Bs value of 1.66, the lowest in the study area (Figure 3). As depicted in Figure 6B, the Bs Class 2 dominates in both of the basin-bounding faults. Furthermore, the eastern basin-bounding fault has AF values from 9.33 to 18.54 with AF average value of 12.27. The highest average AF value of 19.93 can be found in the western basin-bounding fault of this basin (Figure 3). The AF values span from 1.69 to 31.25 in the western basin-bounding fault. For this index, the eastern basin-bounding fault has AF Class 2 taking most of the proportion, while the western basin-bounding fault is dominated by AF Class 1. Regarding the geomorphic stage, the average HI values of the eastern and western basin-bounding fault are 0.51 and 0.46, respectively. The HI values are from 0.43 to 0.60 for the eastern basin-bounding fault. For the western basin-bounding fault, the HI values span from 0.35 to 0.71. As shown in Figure 6B, the both basin-bounding faults are dominated by HI Class 2.
The Alue Calong Basin is bounded by the Seulimeum Fault and is located at higher elevation compared to the Krueng Raya and Lam Kubu Basins (Figures 1B, 7A). The Smf values of the eastern basin-bounding fault of this basin range from 1.05 to 1.30 with average Smf value of 1.14. The western basin-bounding fault shows Smf values from 1.05 to 1.48 and the average Smf value is 1.19. Smf values from the eastern and western basin-bounding faults are categorized into Smf Class 1 (Figure 7B). The average Vf value of the eastern bounding fault is 1.13 with the Vf values ranging from 0.36 to 2.94. The average Vf value of the western basin-bounding fault is 0.68 and the Vf values span from 0.21 to 1.69. As shown in Figure 7B, the proportion increases from Vf Class 1 to Vf Class 3 in the eastern basin-bounding fault. The western basin-bounding fault displays decreasing proportion from Vf Class 1 to Vf Class 3 (Figure 7B).
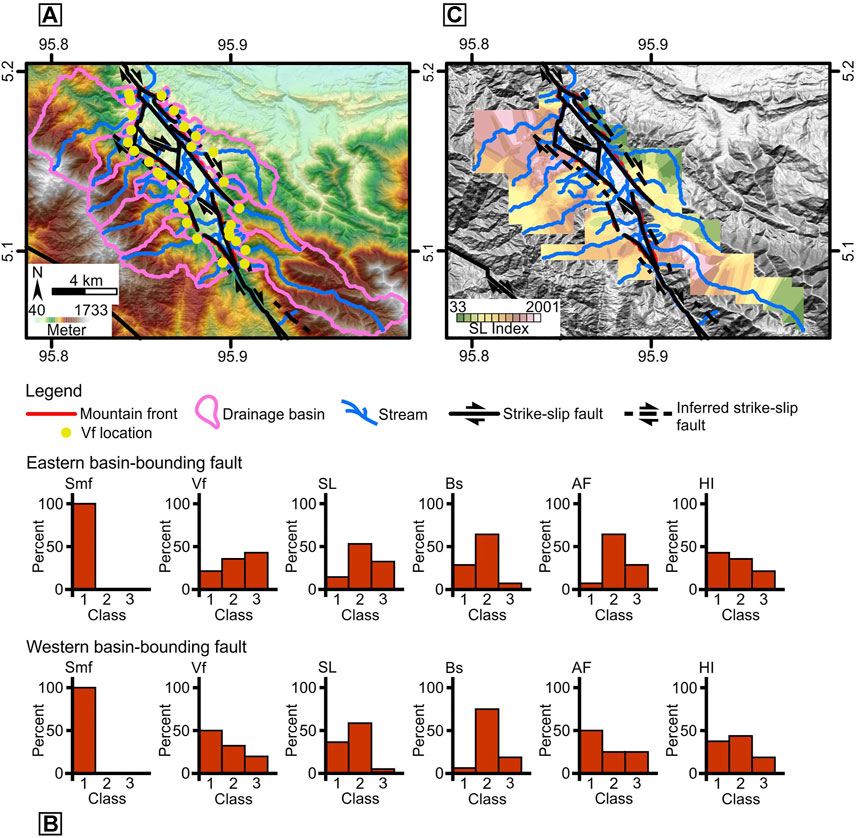
FIGURE 7. The Alue Calong Basin: (A) the mountain fronts, faults, and drainage basins, (B) classification of geomorphic indices, and (C) stream length-gradient map.
The average SL values of the eastern and western basin-bounding faults are 229.99 and 366.05, respectively. The SL Class 2 occupies most of the SL values of both basin-bounding faults. The difference is that the SL Class 3 is the second highest in the eastern basin-bounding fault, while the SL Class 1 is the second highest in the western basin-bounding fault (Figure 7B). The SL map on Figure 7C shows that the SL values in both basin-bounding faults, generally, increase towards the mountain fronts.
The Alue Calong Basin has 14 and 16 drainage basins in the east and west, respectively. The Bs values of the eastern basin-bounding fault are from 1.45 to 3.68 with average Bs value of 2.51. The western basin-bounding fault has average Bs value of 1.99 and the Bs values range from 0.99 to 3.68. The Bs values in both basin-bounding faults are dominated by Bs Class 2 (Figure 7B). On the other hand, the average AF values of the eastern and western basin-bounding faults are 8.18 and 14.19, respectively. The AF values span from 0.86 to 18.95 in the eastern basin-bounding fault and they range from 0.63 to 27.77 in the western basin-bounding fault. The AF values in the eastern basin-bounding fault are mostly classified as AF Class 2, while the AF values of the western basin-bounding fault are mostly categorized as AF Class 1 (Figure 7B). Moreover, the average HI values of the eastern and western basin-bounding faults are 0.48 and 0.47, respectively. The range of HI values for the eastern basin-bounding fault is from 0.34 to 0.65. The HI values of the western basin-bounding fault are from 0.37 to 0.58. The HI values in the eastern basin-bounding fault show decreasing proportion from HI Class 1 to HI Class 3. The HI values in the western basin-bounding fault are mostly classified as HI Class 2 and followed by HI Class 1 (Figure 7B).
The Tangse Basin is bounded to the east by the Seulimeum Fault and to the west by the Aceh Fault (Figures 1B, 8A). The eastern basin-bounding fault has Smf values of 1.21 and 1.28 with average Smf value of 1.24, while the western basin-bounding fault shows Smf value of 1.42. Smf Class 1 dominates in this strike-slip basin (Figure 8B). The Vf values of the eastern basin-bounding fault range from 0.27 to 1.17 with average Vf value of 0.63. The western basin-bounding fault has average Vf value of 0.99 with the Vf values spanning from 0.29 to 2.21. As illustrated in Figure 8B, the Vf values of the eastern basin-bounding fault are dominated by Vf Class 2 and Vf Class 1. The western basin-bounding fault is dominated by Vf Class 3 and is followed by Vf Class 1 (Figure 8B).
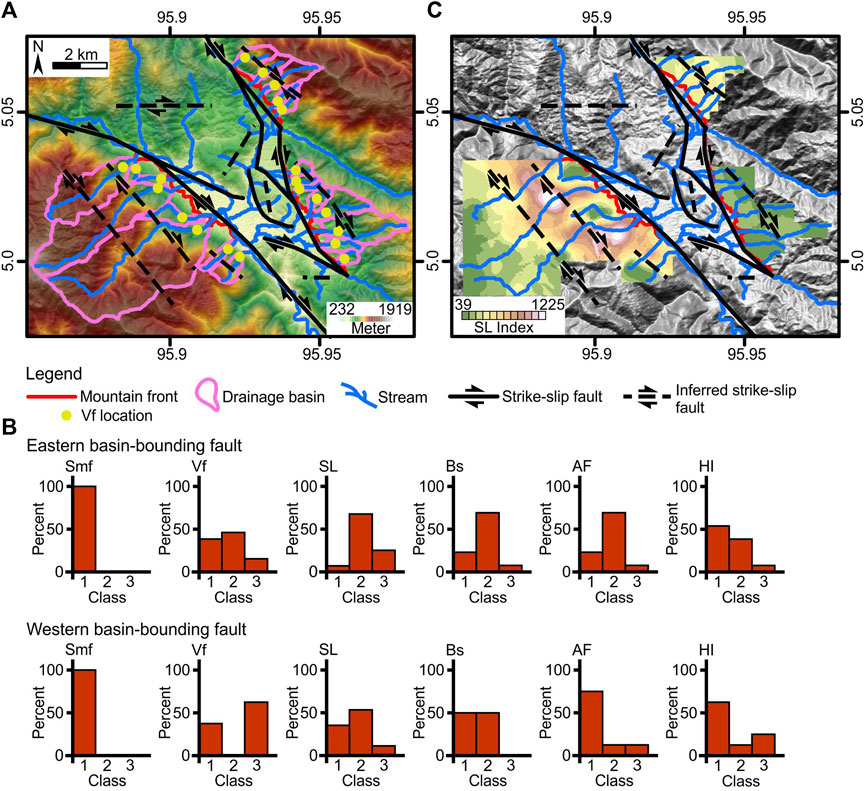
FIGURE 8. The Tangse Basin: (A) the mountain fronts, faults, and drainage basins, (B) classification of geomorphic indices, and (C) stream length-gradient map.
The average SL values of the eastern and western basin-bounding faults differ significantly with 189.30 and 389.28, respectively. The SL values in both basin-bounding faults are mostly classified as SL Class 2. However, the SL Class 1 holds the second highest proportion in the western basin-bounding fault and the SL Class 3 becomes the second highest proportion in the eastern basin-bounding fault (Figure 8B). The SL map on Figure 8C shows that there is general downstream increase in SL values in both of the basin-bounding faults.
The eastern and western basin-bounding faults of the Tangse Basin have 13 and 8 drainage basins, respectively. The average Bs value of the eastern basin-bounding fault is 2.56 with the Bs values ranging from 1.48 to 3.93. The western basin-bounding fault has the highest average Bs values in the study area with 3.16 and the Bs values span from 1.87 to 5.43. The eastern basin-bounding fault is dominated by Bs Class 2, while the western basin-bounding fault has Bs Class 1 and 2 with the same proportion (Figure 8B). On the other hand, the average AF values of the eastern and western basin-bounding faults are 10.60 and 16.30, respectively. The AF values in the eastern basin-bounding fault range from 0.96 to 19.60, while the AF values in the western basin-bounding fault span from 0.59 to 23.97. The AF values of the eastern basin-bounding fault are mostly classified as AF Class 2 and the western basin-bounding fault is dominated by AF Class 1 (Figure 8B). Furthermore, the eastern and western basin-bounding faults have average HI values of 0.50 and 0.52, respectively. The HI values in the eastern basin-bounding fault range from 0.35 to 0.58, while the western basin-bounding fault has HI values from 0.36 to 0.66. Both eastern and western basin bounding-faults are dominated by HI Class 1 (Figure 8B).
The Geumpang Basin is bounded to the west by the Aceh Fault and to the east by a subsidiary fault (Figures 1B, 9A). The eastern basin-bounding fault has Smf value of 1.17, while the western basin-bounding fault possesses Smf values ranging from 1.10 to 1.44 with average Smf value of 1.24. The eastern and western basin-bounding faults show the dominance of Smf Class 1 (Figure 9B). The Vf values of the eastern basin-bounding fault span from 0.03 to 3.38 with average Vf value of 0.88. The western basin-bounding fault has average Vf value of 0.95 with the Vf values ranging from 0.27 to 3.73. The eastern basin-bounding fault displays the same proportion of Vf Class 1 and 3, while the western basin-bounding fault is dominated by Vf Class 2 (Figure 9B).
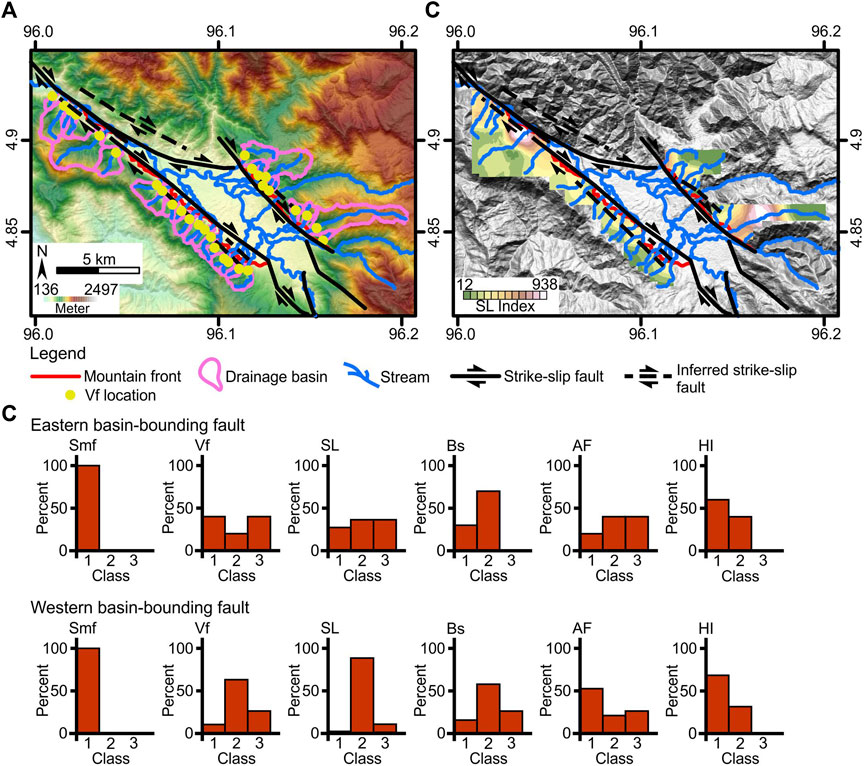
FIGURE 9. The Geumpang Basin: (A) the mountain fronts, faults, and drainage basins, (B) classification of geomorphic indices, and (C) stream length-gradient map.
The eastern and western basin-bounding faults have average SL values of 281.13 and 242.91, respectively. The SL Class 2 and 3 are equally dominate in the eastern basin-bounding fault, while the SL Class 2 is dominated in the western basin-bounding fault (Figure 9B). Regarding the spatial variation of SL values, both eastern and western basin-bounding faults display general trend of increasing SL values towards downstream (Figure 9C).
The Geumpang Basin has 10 and 19 drainage basins in the east and west, respectively. The eastern basin-bounding fault has average Bs value of 2.45, while the western basin-bounding fault has average Bs value of 2.08. The Bs values range from 1.60 to 3.98 in the eastern basin-bounding fault. The western basin-bounding fault has Bs values from 1.11 to 4.17. The Bs Class 2 takes the largest proportion in both eastern and western basin-bounding faults (Figure 9B). Moreover, the eastern basin-bounding fault displays AF values from 0.07 to 18.02 with average AF value of 7.45. The AF values in the western basin-bounding fault range from 1.46 to 25.81 with average AF value of 13.39. The eastern basin-bounding fault is dominated by the AF Class 2 and 3, while the AF Class 1 dominates the western basin-bounding fault (Figure 9B). Regarding the degree of landform dissection, the eastern and western basin-bounding faults have average HI values of 0.56 and 0.53, respectively. The eastern basin-bounding fault has HI values from 0.43 to 0.74. The HI values of the western basin-bounding fault range from 0.42 to 0.63. Both eastern and western basin-bounding faults have similar classification of HI values as illustrated in Figure 9B.
The Jagong Jeget Basin is formed at the foot of push-up ridge due to the bend of the Tripa Fault (Figures 1B, 10A). The Smf value of the basin-bounding fault is 1.72 and is categorized as Smf Class 2 (Figure 10B). The basin-bounding fault has Vf values spanning from 0.34 to 4.21 with average Vf value of 1.41. The Vf values are mostly categorized as Vf Class 2. The Vf Class 3 takes the largest proportion and it is followed by Vf Class 1 (Figure 10B).
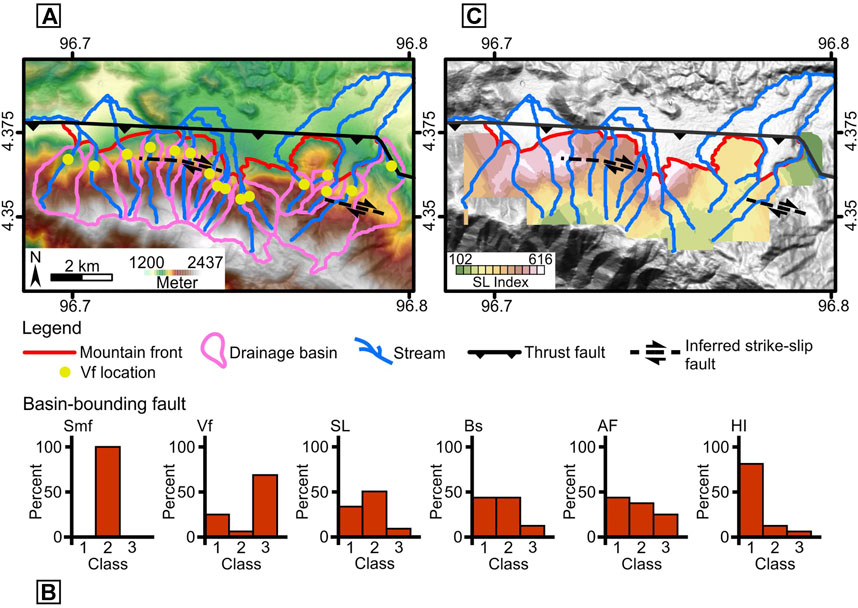
FIGURE 10. The Jagong Jeget Basin: (A) the mountain fronts, faults, and drainage basins, (B) classification of geomorphic indices, and (C) stream length-gradient map.
The basin-bounding fault of the Jagong Jeget Basin shows average SL values of 351.87. The SL Class 2 takes majority of the proportion and is followed by the SL Class 1 (Figure 10B). As expressed on the SL map (Figure 10C), the SL values increase towards downstream.
The Jagong Jeget Basin has 16 drainage basins. The Bs values of the basin-bounding fault are observed from 1.42 to 5.0 with average Bs value of 2.64. The Bs values of this basin-bounding fault are dominated by the Bs Class 1 and 2 (Figure 10B). On the other hand, the AF values range from 0.65 to 20.06 with average AF value of 10.65. The AF values of this basin-bounding fault show decreasing proportion from AF Class 1 to AF Class 3. The average HI value of the basin-bounding fault is 0.54 with the HI values from 0.31 to 0.68. The HI values of this basin-bounding fault are dominantly categorized as HI Class 1 (Figure 10B).
The Blangkejeren Basin is bounded to the east and west by the Tripa Fault (Figures 1B, 11A). The eastern and western basin-bounding faults have average Smf values of 1.14 and 1.34, respectively. The eastern basin-bounding fault has Smf values ranging from 1.06 to 1.27, while the western basin-bounding fault has Smf values from 1.28 to 1.39. With these Smf values, the eastern and western basin-bounding faults show dominance of the Smf Class 1 (Figure 11B). The eastern basin-bounding fault has Vf values from 0.08 to 1.68 with average Vf value of 0.58. The Vf values of the western basin-bounding fault range from 0.30 to 2.95 with average Vf value of 0.91. As illustrated in Figure 11B, the eastern basin-bounding fault shows decreasing proportion from Vf Class 1 to Vf Class 3. The western basin-bounding fault displays that the Vf Class 1 takes the largest proportion, followed by Vf Class 3 and 2 (Figure 11B).
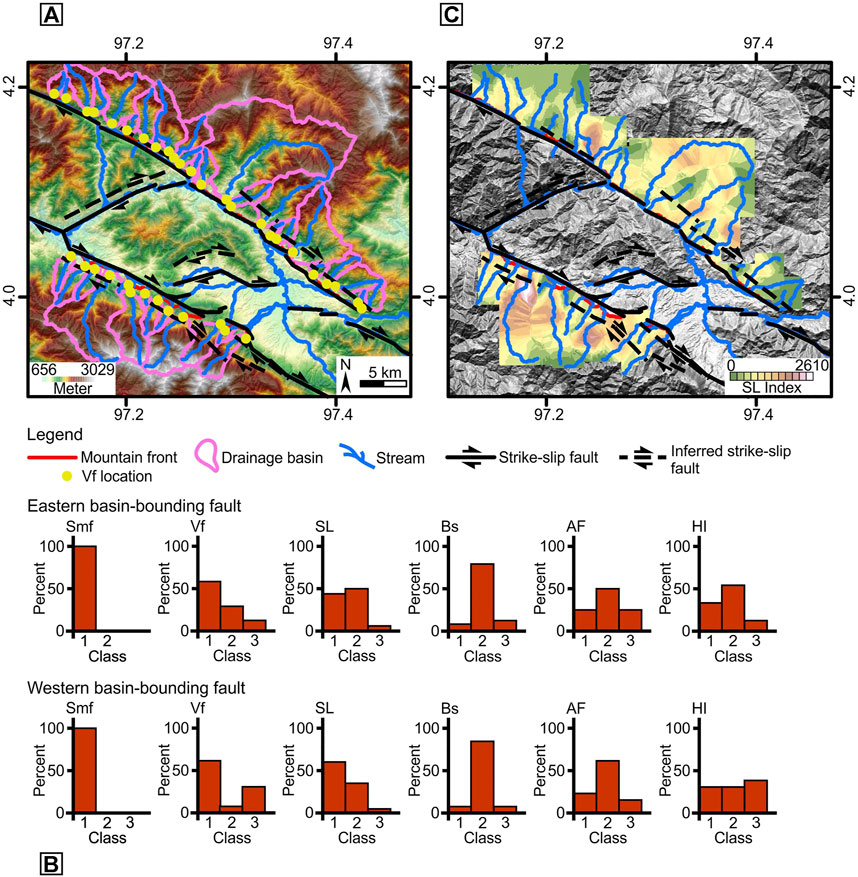
FIGURE 11. The Blangkejeren Basin: (A) the mountain fronts, faults, and drainage basins, (B) classification of geomorphic indices, and (C) stream length-gradient map.
The eastern basin-bounding fault has average SL value of 437.09 and the western basin-bounding fault has the highest average SL value in the study area with 599.70 (Figure 3). The SL values in the eastern basin-bounding fault are grouped mainly into SL Class 1 and 2. Meanwhile, the SL Class 1 takes the largest proportion in the western basin-bounding fault. The SL values in the eastern and western basin-bounding faults show an increasing pattern to downstream direction (Figure 11C).
The eastern and western basin-bounding faults of the Blangkejeren Basin have 24 and 13 drainage basins, respectively. The Bs values in the eastern basin-bounding fault range from 0.94 to 3.81 with average Bs value of 2.09. The western basin-bounding fault has Bs values from 1.50 to 3.15 with average Bs value of 2.22. The AF values in the eastern basin-bounding fault span from 0.15 to 30.16, while the western basin-bounding fault has the AF values from 2.73 to 23.46. The average AF values of the eastern and western basin-bounding faults are 10.08 and 11.47, respectively. The Bs and AF values of the eastern and western basin-bounding faults have a similar classification pattern (Figure 11B). Moreover, the HI values in the eastern basin-bounding fault are from 0.35 to 0.61 with average HI value of 0.47. The western basin-bounding fault possesses HI values from 0.36 to 0.59 with average HI value of 0.45. The HI values in the eastern basin-bounding fault are dominated by HI Class 2 which is followed by HI Class 1 (Figure 11B). The western basin-bounding fault shows a similar proportion of the HI Class 1 and 2, while the HI Class 3 has a slightly higher proportion (Figure 11B).
The Tripa Fault bounds the Kutacane Basin in the east and west (Figures 1B, 12A). The eastern basin-bounding fault of this basin displays Smf values from 1.06 to 1.78, while the western basin-bounding fault has Smf values from 1.33 to 1.95. The average Smf values of the eastern and western basin-bounding faults are 1.40 and 1.61, respectively. The eastern basin-bounding fault shows greater proportion of Smf Class 1 than Smf Class 2, while the western basin-bounding fault displays the opposite pattern (Figure 12B). The Vf values of the eastern basin-bounding fault range from 0.07 to 3.47, while the western basin-bounding fault has Vf values from 0.12 to 6.96. The average Vf values of the eastern and western basin-bounding faults are 0.71 and 1.15, respectively. The eastern western basin-bounding fault shows decreasing proportion from Vf Class 1 to Vf Class 3, while the western basin-bounding fault exhibits similar proportion for Vf Class 1 and 3 (Figure 12B).
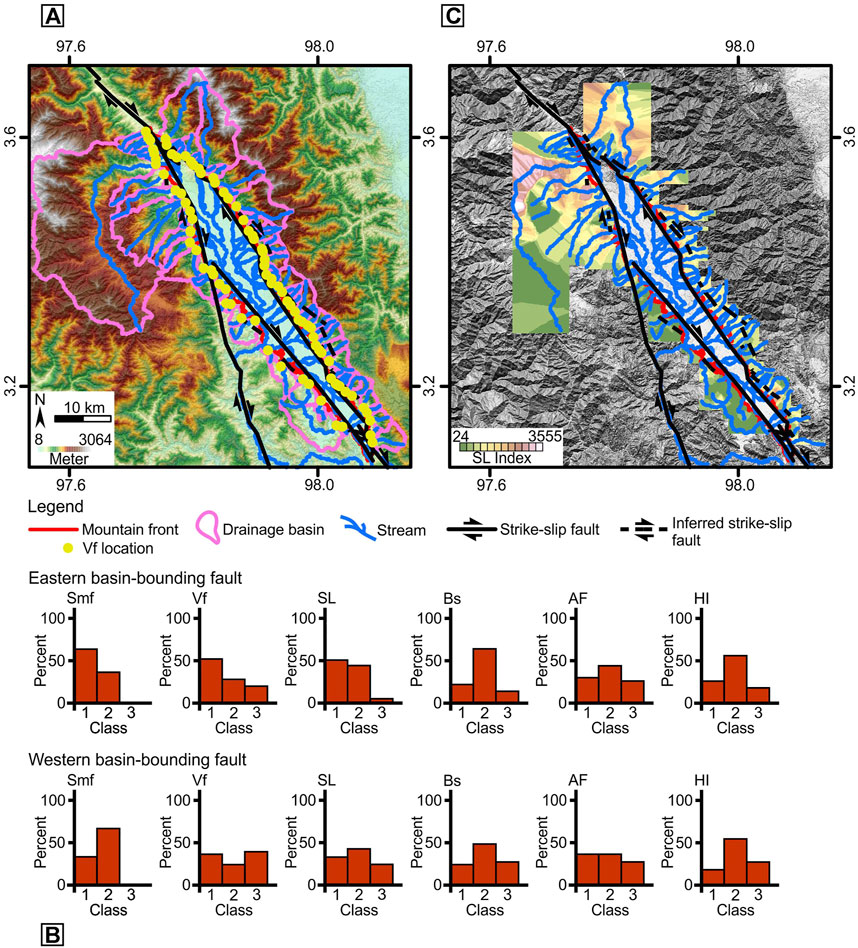
FIGURE 12. The Kutacane Basin: (A) the mountain fronts, faults, and drainage basins, (B) classification of geomorphic indices, and (C) stream length-gradient map.
The average SL values of the eastern and western basin-bounding faults are 535.80 and 492.47, respectively. The eastern basin-bounding fault is dominated by the SL Class 1, while the western basin-bounding fault has the SL Class 2 holding the largest proportion (Figure 12B). In terms of spatial variation, the SL values in both basin-bounding faults increase downstream, but the pattern is less developed in the western basin-bounding fault (Figure 12C).
The eastern basin-bounding fault of the Kutacane Basin has 50 drainage basins, while the western basin-bounding fault has 33 drainage basins. The average Bs values of the eastern and western basin-bounding faults are 2.46 and 2.24, respectively. The Bs values span from 0.99 to 5.26 in the eastern basin-bounding fault. Meanwhile, the western basin-bounding fault has Bs values from 0.69 to 6.64. Both of the basin-bounding faults have the Bs Class 2 holding the highest proportion (Figure 12B). The AF values of the eastern basin-bounding fault range from 0.38 to 29.62 with AF average value of 10.90. The western basin-bounding fault shows AF values from 0.16 to 39.31 with average AF value of 12.85. The AF Class 1 and 2 take a large proportion in both eastern and western basin-bounding faults (Figure 12B). The eastern and western basin-bounding faults have average HI values of 0.46 and 0.43, respectively. The HI values span from 0.34 to 0.64 in the eastern basin-bounding fault and from 0.24 to 0.60 in the western basin-bounding fault. The HI Class 2 dominates in both basin-bounding faults. However, the HI Class 1 has greater proportion than the HI Class 3 in the eastern basin-bounding fault, while the western basin-bounding fault has an opposite pattern (Figure 12B).
The index of relative tectonic activity (Iat) was applied to summarize the results from different geomorphic indices and to illustrate the spatial variation of the relative tectonic activity of the strike-slip basins along the Northern Sumatran Fault. Lower Iat values correspond to higher tectonic activity. The results of the Iat values will be explained according to the main segments governing the strike-slip basins (Figure 13).
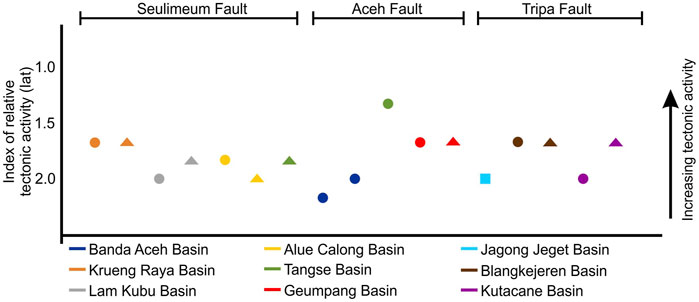
FIGURE 13. The index of relative tectonic activity of the strike-slip basins along the Northern Sumatran Fault. The triangle, circular, and rectangle shapes are the eastern, western, and main basin-bounding faults, respectively.
The Aceh Fault takes the role in the formation of the Banda Aceh, Tangse, and the Geumpang Basins. The western basin-bounding fault 1 of the Banda Aceh Basin has the lowest tectonic activity with Iat value of 2.17, while the western basin-bounding fault 2 shows Iat value of 2.00 (Figure 13). The Aceh Fault in the Tangse Basin shows the highest tectonic activity in the area with Iat value of 1.33 (Figure 13). The Geumpang Basin displays Iat values of 1.67 for its eastern and western basin-bounding faults (Figure 13).
The Seulimeum Fault is responsible in the formation of the Krueng Raya, Lam Kubu, Alue Calong, and Tangse Basins. The Krueng Raya Basin has Iat values of 1.67 for its eastern and western basin-bounding faults. The Lam Kubu Basin shows Iat values of 1.83 and 2.00 for its eastern and western basin-bounding faults, respectively. The eastern and western basin-bounding faults of the Alue Calong Basin possess Iat values of 2.00 and 1.83, respectively. The Iat value of the Seulimeum Fault in the Tangse Basin is 1.83 (Figure 13).
The Tripa Fault creates the basin-bounding faults for the Jagong Jeget, Blangkejeren, and Kutacane Basins. The basin-bounding faults of the Blangkejeren Basin and the eastern basin-bounding fault of the Kutacane Basin possess Iat value of 1.67 (Figure 13). Meanwhile, the basin-bounding fault of the Jagong Jeget Basin and the western basin-bounding fault of the Kutacane Basin have Iat values of 2.00 (Figure 13).
The Smf and Vf were applied to assess the tectonic activity operating at the mountain front and the nearby main valley. The Smf captures the sum of on-going uplift and the erosional processes, while the Vf is related to the response of streams (Bull, 2007). In this study area, the mountain-fronts of the strike-slip basins are mostly classified as highly-active structures (Smf Class 1; Figure 3). The western basin-bounding fault 1 of the Banda Aceh Basin, the basin-bounding fault of the Jagong Jeget Basin, and the western basin-bounding fault of the Kutacane Basin were observed to be moderately-active structures (Figure 3). Regarding the response of streams to uplift, the average Vf values suggest that the Northern Sumatran Fault displays the combination of V-shaped and U-shaped valleys (Figure 3). The Smf and Vf values of the Northern Sumatran Fault suggest that active tectonic deformation operates in the area. This interpretation is consistent with the previous studies finding that the Northern Sumatran Fault is tectonically-active (Bellier et al., 1997; Sieh and Natawidjaja, 2000; Natawidjaja, 2018; Hady and Marliyani, 2020; Tsutsumi et al., 2020).
The SL was implemented to evaluate the stream power of the transverse streams in the basin-bounding fault blocks. As noted earlier, increasing stream power may be attributed to tectonic effects or the stream crosses resistant underlying rock formation (Keller and Pinter, 2002; Burbank and Anderson, 2012; Mishra, 2019). The Northern Sumatran Fault exhibits a consistent pattern which the stream power generally increases towards the mountain front (Figure 4C to 12C). Only the western basin-bounding fault 1 of the Banda Aceh Basin and the western basin-bounding fault of the Kutacane Basin where such pattern is less developed. The Northern Sumatran Fault also shows southward increase of stream power (Figure 3). This pattern appears to be correlated to the generally increasing relief of the elevation (Figure 1B). In the case of the Northern Sumatran Fault, the SL values are representative to tectonic activity since the values are generally increasing towards mountain fronts and changes in SL values are often accompanied by faults (Figure 4C to 12C).
The geometric development of the drainage basins is the topic addressed by the application of Bs and AF. The Bs represents the effects of tectonics to the planimetric drainage basin shape, while the AF helps to assess the tilting of the drainage basins (Ramírez-Herrera, 1998; Keller and Pinter, 2002; El-Hamdouni et al., 2008). In this study area, the Bs values generally represent the elongated and highly-elongated drainage basins (Figures 3, 4B–12B). The AF values also point to the same direction that the asymmetric and highly-asymmetric drainage basins take large proportion in the strike-slip basins of the Northern Sumatran Fault (Figures 3, 4B–12B). The active tectonic deformation of the Northern Sumatran Fault obviously governs the development of the drainage basins based on these geomorphic indices.
The HI was intended to provide evidence on the geomorphic stage of the drainage basins in this study area. It is found that the drainage basins in this study are predominantly categorized as youthful and mature morphologies (Figures 3,4B,12B). Youthful morphology may have been maintained by continuing uplift, while the mature morphologies may relate to tectonic uplift accompanied by increasing degree of erosion. As demonstrated by previous authors (Gao et al., 2013; Sarp et al., 2013; Khalifa et al., 2018) that HI values are indicative to relative dominance between tectonics and erosion, these evidences further explain the active tectonic deformation of the Northern Sumatran Fault.
The Northern Sumatran Fault, generally, demonstrates alternating occurrences of high and moderate tectonic activities and it shows a northward decrease from very high to moderate tectonic activity in its northern section (Figures 13,14A,14B). The distribution of seismicity along the Northern Sumatran Fault also shows variation (Muksin et al., 2018; Natawidjaja, 2018; Muksin et al., 2019). Moreover, variation in the relative tectonic activity along a strike-slip fault is also exemplified by the western section of the North Anatolian Fault (Sarp et al., 2013), East Anatolian Fault (Khalifa et al., 2018), North Bozgush Fault (Saber et al., 2018), and the Ovacık Fault (Yazıcı et al., 2018).
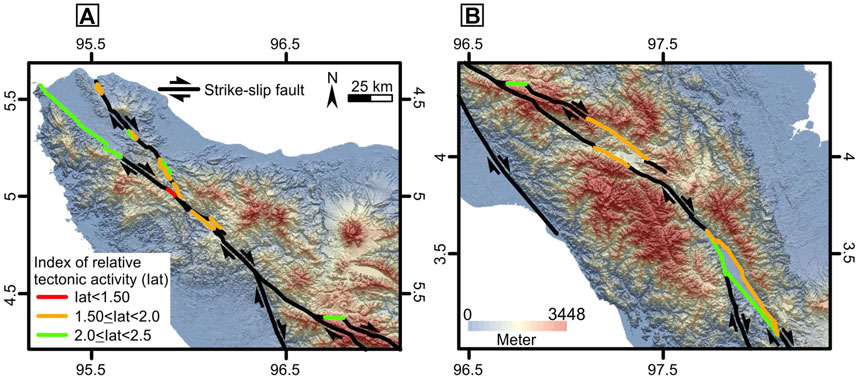
FIGURE 14. Index of relative tectonic activity in: (A) the northern part of the Northern Sumatran Fault; (B) the southern part of the Northern Sumatran Fault. Fault segments are modified after Sieh and Natawidjaja (2000) and Natawidjaja (2018).
This study utilizes DEMNAS due to its high spatial resolution and accuracy for the assessment of relative tectonic activity using geomorphic indices. DEMNAS, with its 8.25-m spatial resolution, contributes significantly in this study. The high resolution DEM can reveal more details of stream networks and watersheds compared to coarser resolution DEM. Since the stream networks and watersheds reflect geomorphologic indices, the difference between high and coarser resolution DEMs can affect geomorphic indices. For example, small channels can be extracted from high resolution DEM and affect several geomorphic indices such as Smf, Bs and Af. Moreover, terrain slope is underestimated from coarser resolution DEM due to the threshold characteristic of the DEM resolution. This problem becomes worse when DEM gets coarser resolution or smooth surface. Hence, high resolution of DEM is essential to the assessment of relative tectonic activity with geomorphic indices (e.g., Bull, 2007; Keller and Rockwell, 2022). However, the wider availability and lesser computation demand of coarser resolution DEM, compared with high resolution DEM are preferred for relative tectonic activity study in all regions. The recommended resolution for geomorphic index study is less than 30-m resolution DEM.
There is a need to discuss the short-term and long-term tectonic deformation of the Northern Sumatran Fault. Frankel and Owen (2013) suggested that the comparison of short-term and long-term tectonic deformation will provide idea on the spatial and temporal changes related to the structural development. In this discussion, the short-term tectonic deformation refers to the previous studies on the distribution of seismicity and GPS velocities. The relative tectonic activity derived from geomorphic indices represent long-term tectonic deformation.
The relative tectonic activity of the Aceh Fault ranges from moderate to very high tectonic activities, while the Seulimeum Fault shows moderate and high tectonic activities (Figure 14A). In terms of seismicity distribution, greater occurrences of earthquakes were observed towards the junction of the Aceh and Seulimeum Faults (Muksin et al., 2018; Natawidjaja, 2018). Such greater occurrences of earthquakes coincide with very high tectonic activity of the Aceh Fault and high tectonic activity of the Seulimeum Fault (Figure 14A). Furthermore, Muksin et al. (2018) showed that the Seulimeum Fault is related to the occurrences of earthquakes along its strike. The case is different with the western basin-bounding faults of the Banda Aceh Basin that have moderate tectonic activity (Figure 14A) and lack of earthquake (Muksin et al., 2018). This study agrees with previous studies considering that the Seulimeum Fault may accommodate greater tectonic activity than the Aceh Fault in the northern section and some of the right-lateral movement may be shifted northward (Tabei et al., 2015; Natawidjaja, 2018; Tsutsumi et al., 2020). It is because the western basin-bounding faults of the Banda Aceh Basin may develop earlier than the Seulimeum Fault due to their higher topographic relief (Figures 1B,4A,5A). If the Aceh Fault is followed north-westwards to the offshore, Ghosal et al. (2012) revealed that the fault is active based on the formation of push-up ridge involving recent sediments.
The Tripa Fault displays moderate and high tectonic activities in the strike-slip basins (Figure 14B). Moderate tectonic activity is observed in the basin-bounding fault of the Jagong Jeget Basin and in the western basin-bounding fault of the Kutacane Basin. The basin-bounding faults of the Blangkejeren Basin and the eastern basin-bounding fault of the Kutacane Basin show high tectonic activity (Figure 14B). This study agrees with Natawidjaja (2018) that the faults bounding the three basins are active. However, Natawidjaja (2018) did not consider that the western basin-bounding fault of the Kutacane Basin to be active and this study finds such fault showing moderate tectonic activity. Furthermore, the relative tectonic activity assessment in the Kutacane Basin is supported by Simanjuntak et al. (2018). It was found that the lineaments of the basin-bounding faults coincided with the distribution of seismicity (Simanjuntak et al., 2018). The eastern-basin bounding fault of the Kutacane Basin was also related to an earthquake with magnitude of 6.2 in 1996 (Hurukawa et al., 2014). There was also an earthquake to the northwest of the Jagong Jeget Basin with magnitude of 6.0 in 1997 (Hurukawa et al., 2014). Moreover, since the Tripa Fault is related to large earthquakes based on Hurukawa et al. (2014), it can be inferred that, in this study area, the fault segments with moderate or high tectonic activities from geomorphic indices may be capable of producing large earthquakes.
Furthermore, in the northern part of the Northern Sumatran Fault, basin-bounding faults with high and very high tectonic activities (Figure 14A) coincide with geodetic slip-rate of 20 ± 6 mm/yr from Ito et al. (2012). On the other hand, another evaluation conducted in the central part of the Northern Sumatran Fault, which was near by the Jagong Jeget Basin of moderate tectonic activity, yielded geodetic slip-rate of 16 ± 6 mm/yr (Ito et al., 2012). The increase in relative uplift rates in the Northern Sumatran Fault is followed by the increase in geodetic slip-rates. Another case coming from the Precordillera and Sierras Pampeanas of Central Andes demonstrates similar pattern. Rimando and Schoenbohm (2020) discovered that uniform average values of geomorphic indices in the Precordillera match with the GPS gradients in the area. It was also observed that the westward increase in tectonic activity from geomorphic indices in Sierras Pampeanas was followed by the increase in GPS slip-rates (Rimando and Schoenbohm, 2020). The cases in the Northern Sumatran Fault and the Precordillera and Sierras Pampeanas of Central Andes exemplify that long-term tectonic deformation rate has persisted and represented by the short-term observation.
Comparison of the relative tectonic activity derived from geomorphic indices with the distribution of seismicity and GPS velocities brings three insights on the Northern Sumatran Fault. First, fault sections with very high and high tectonic activities are related to higher occurrences of earthquakes. Second, although the fault section is associated with less occurrences or absence of earthquakes, the fault may show moderate until high tectonic activity from geomorphic point of view. Third, the Northern Sumatran Fault demonstrates the case that the relative tectonic activity derived from geomorphic indices generally point to the same direction as the distribution of seismicity and GPS velocities.
This study demonstrates the application of geomorphic indices to study relative tectonic activity of basin-bounding faults in the Northern Sumatran Fault. This study implemented six geomorphic indices: mountain front sinuosity (Smf), valley width-to-height ratio (Vf), stream length-gradient (SL), index of basin shape (Bs), asymmetric factor (AF), and hypsometric integral (HI). The results of geomorphic indices show active tectonic deformation in the strike-slip basins of the Northern Sumatran Fault. The index of relative tectonic activity (Iat) was produced based on the results of the geomorphic indices. The Northern Sumatran Fault, generally, displays alternating moderate and high tectonic activities, accompanied by a northward decrease in its northern part from very high to moderate tectonic activity. The spatial variation of the tectonic activity from geomorphic indices in the Northern Sumatran Fault also coincides with the distribution of seismicity and GPS velocities. This is the first attempt to apply geomorphic indices for relative tectonic assessment in the Northern Sumatran Fault and the same approach could be implemented to study other strike-slip basins.
The original contributions presented in the study are included in the article/supplementary material, further inquiries can be directed to the corresponding author.
This research was part of the Ph.D. project of AP. The research plan was thus developed between the Ph.D. candidate and the supervisors PC. The data analysis and interpretation was conducted by AP. The manuscript was developed, written and revised by all authors. PC approved the final version of the manuscript.
The first author is supported by the Chulalongkorn University Graduate Scholarship Programme for ASEAN or Non-ASEAN Countries. The authors gratefully acknowledge the financial support from the Ratchadaphisek Somphot Endowment Fund, Chulalongkorn University.
Reviewers are thanked for their useful and constructive comments.
The authors declare that the research was conducted in the absence of any commercial or financial relationships that could be construed as a potential conflict of interest.
All claims expressed in this article are solely those of the authors and do not necessarily represent those of their affiliated organizations, or those of the publisher, the editors and the reviewers. Any product that may be evaluated in this article, or claim that may be made by its manufacturer, is not guaranteed or endorsed by the publisher.
Bellier, O., Sébrier, M., Pramumijoyo, S., Beaudouin, Th., Harjono, H., Bahar, I., et al. (1997). Paleoseismicity and seismic hazard along the great Sumatran Fault (Indonesia). J. Geodyn. 24, 169–183. doi:10.1016/s0264-3707(96)00051-8
Bennett, J. D., Bridge, D. McC., Cameron, N. R., Djunuddin, A., Ghazali, S. A., Jeffery, D. H., et al. (1981). Geologic map of the bandaaceh quadrangle, Sumatra. Scale 1: 250 000. Bandung: Geological Research and Development Centre.
Bradley, K. E., Feng, L., Hill, E. M., Natawidjaja, D. H., and Sieh, K. (2017). Implications of the diffuse deformation of the Indian Ocean lithosphere for slip partitioning of oblique plate convergence in Sumatra. J. Geophys. Res. Solid Earth 122, 572–591. doi:10.1002/2016JB013549
Bull, W. B. (2007). Tectonic geomorphology of mountains: A new approach to paleoseismology. Malden: Blackwell Publishing.
Burton, P. W., and Hall, T. R. (2014). Segmentation of the Sumatran Fault. Geophys. Res. Lett. 41, 4149–4158. doi:10.1002/2014GL060242
Cao, S., and Neubauer, F. (2016). Deep crustal expressions of exhumed strike-slip fault systems: Shear zone initiation on rheological boundaries. Earth. Sci. Rev. 162, 155–176. doi:10.1016/j.earscirev.2016.09.010
Cattin, R., Chamot-Rooke, N., Pubellier, M., Rabaute, A., Delescluse, M., Vigny, C., et al. (2009). Stress change and effective friction coefficient along the Sumatra-Andaman-Sagaing fault system after the 26 December 2004 (Mw = 9.2) and the 28 March 2005 (Mw = 8.7) earthquakes. Geochem. Geophys. 10, 1–21. doi:10.1029/2008GC002167
de Smet, M. E. M., and Barber, A. J. (2005). “Tertiary stratigraphy,” in Sumatra: Geology, resources, and tectonic evolution. Editors A. J. Barber, M. J. Crow, and J. S. Milsom (London: The Geological Society), 86–97.
Delescluse, M., and Chamot-Rooke, N. (2007). Instantaneous deformation and kinematics of the India-Australia Plate. Geophys. J. Int. 168, 818–842. doi:10.1111/j.1365-246X.2006.03181.x
Dziewonski, A. M., Chou, T. -A., and Woodhouse, J. H. (1981). Determination of earthquake source parameters from waveform data for studies of global and regional seismicity. J. Geophys. Res. 86, 2825–2852. doi:10.1029/jb086ib04p02825
Ekström, G., Nettles, M., and Dziewonski, A. M. (2012). The global CMT project 2004-2010: Centroid-moment tensors for 13.017 earthquakes. Phys. Earth Planet. Interiors 201—202, 1–9. doi:10.1016/j.pepi.2012.04.002
El-Hamdouni, R., Irigaray, C., Fernández, T., Chacón, J., and Keller, E. A. (2008). Assessment of relative active tectonics, southwest border of the Sierra Nevada (Southern Spain). Geomorphol. (Amst). 96, 150–173. doi:10.1016/j.geomorph.2007.08.004
Elias, Z., Sissakian, V. K., and Al-Ansari, N. (2019). Assessment of the tectonic activity in northwestern part of the Zagros Mountains, northeastern Iraq by using geomorphic indices. Geotech. Geol. Eng. 37 (5), 3995–4007. doi:10.1007/s10706-019-00888-z
Elias, Z. (2015). The neotectonic activity along the lower Khazir River by using SRTM image and geomorphic indices. Earth 4 (1), 50–58. doi:10.11648/j.earth.20150401.15
Fernández-Blanco, D., Philippon, M., and van Hagke, C. (2015). Present-day stress orientations in the great Sumatran Fault in north Sumatra. gr. 97, 30–33. doi:10.1127/1864-5658/2015-12
Frankel, K. L., and Owen, L. A. (2013). in Transform plate margins and strike-slip fault systems” in Treatise on Geomorphology. Editor L. A. Owen (San Diego: Academic Press), 37–70.
Gao, M., Zeilinger, G., Xu, X., Wang, Q., and Hao, M. (2013). DEM and GIS analysis of geomorphic indices for evaluating recent uplift of the northeastern margin of the Tibetan Plateau, China. Geomorphol. (Amst). 190, 61–72. doi:10.1016/j.geomorph.2013.02.008
Geospatial Information Agency (2018). Demnas. Avaialble at: https://tanahair.indonesia.go.id/demnas/#/ (Accessed July 4, 2022).
Ghosal, D., Singh, S. C., Chauhan, A. P. S., and Hananto, N. D. (2012). New insights on the offshore extension of the Great Sumatran Fault, NW Sumatra, from marine geophysical studies. Geochem. Geophys. Geosyst. 13, 2012GC004122–18. doi:10.1029/2012GC004122
Gürbüz, A., and Gürer, Ӧ. F. (2008). Tectonic geomorphology of the north Anatolian Fault zone in the lake sapanca basin (eastern marmara region, Turkey). Geosci. J. 12, 215–225. doi:10.1007/s12303-008-0022-9
Hack, J. T. (1973). Stream-profiles analysis and stream-gradient index. J. Res. U. S. Geol. Surv. 1, 421–429.
Hady, A. K., and Marliyani, G. I. (2020). Updated segmentation model and cummulative offset measurement of the Aceh segment of the Sumatran Fault system in west Sumatra, Indonesia. J. Appl. Geol. 5, 84–100. doi:10.22146/jag.56134
Hurukawa, N., Wulandari, B. R., and Kasahara, M. (2014). Earthquake history of the Sumatran Fault, Indonesia, since 1892, derived from relocation of large earthquakes. Bull. Seismol. Soc. Am. 104, 1750–1762. doi:10.1785/0120130201
Ito, T., Gunawan, E., Kimata, F., Tabei, T., Meilano, I., Agustan, A., et al. (2016). Co-seismic offsets due to two earthquakes (Mw 6.1) along the Sumatran Fault System derived from GNSS measurements. Earth Planets Space 68 (57), 57–58. doi:10.1186/s40623-016-0427-z
Ito, T., Gunawan, E., Kimata, F., Tabei, T., Simons, M., Meilano, I., et al. (2012). Isolating along-strike variations in the depth extent of shallow creep and fault locking on the northern Great Sumatran Fault. J. Geophys. Res. 117, 1–16. doi:10.1029/2011JB008940
Karig, D. E., Lawrence, M. B., Moore, G. F., and Curray, J. R. (1980). Structural frame work of the fore-arc basin, NW Sumatra. J. Geol. Soc. Lond. 137, 77–91. doi:10.1144/gsjgs.137.1.0077
Keller, E. A., and Pinter, N. (2002). Active tectonics: Earthquakes, uplift, and landscape. Second Edition. Upper Saddle River: Prentice-Hall.
Keller, E. A., and Rockwell, T. (2022). in Tectonic Geomorphology of mountain fronts” in treatise on Geomorphology. Editor J. F. Shroder. Second Edition (San Diego: Academic Press), 376–403.
Khalifa, A., Çakir, Z., Owen, L. A., and Kaya, Ş. (2018). Morphotectonic analysis of The east Anatolian Fault, Turkey. Turk. J. Earth Sci. 27, 110–126. doi:10.3906/yer-1707-16
Koukouvelas, I. K., Zygouri, V., Nikolakopoulos, K., and Verroios, S. (2018). Treatise on the tectonic geomorphology of active faults: The significance of using a universal digital elevation model. J. Struct. Geol. 116, 241–252. doi:10.1016/j.jsg.2018.06.007
Kumar, N., Dumka, R. K., Mohan, K., and Chopra, S. (2022). Relative active tectonics evaluation using geomorphic and drainage indices, in Dadra and Nagar Haveli, Western India. Geod. Geodyn. 13 (3), 219–229. doi:10.1016/j.geog.2022.01.001
Matson, R. G., and Moore, G. F. (1992). in Structural influences on neogene subsidence in the central Sumatra fore-arc basin” in geology and geophysics of continental margins. Editors J. Watkins, F. Zhiqiang, and K. McMillen (Tulsa: American Association of Petroleum Geologists), 157–181.
McCaffrey, R. (2009). The tectonic framework of the sumatran subduction zone. Annu. Rev. Earth Planet. Sci. 37, 345–366. doi:10.1146/annurev.earth.031208.100212
McCaffrey, R., Zwick, P. C., Bock, Y., Prawirodirdjo, L., Genrich, J. F., Stevens, C. W., et al. (2000). Strain partitioning during oblique plate convergence in northern Sumatra: Geodetic and seismologic constraints and numerical modeling. J. Geophys. Res. 105, 28363–28376. doi:10.1029/1999jb900362376
Mishra, M. N. (2019). Active tectonic deformation of the Shillong Plateau, India: Inferences from river profiles and stream-gradients. J. Asian Earth Sci. 181, 103904–103923. doi:10.1016/j.jseaes.2019.103904
Muksin, U., Bauer, K., Muzli, M., Ryberg, T., Nurdin, I., Masturiyono, M., et al. (2019). AcehSeis project provides insights into the detailed seismicity distribution and relation to fault structures in Central Aceh, Northern Sumatra. J. Asian Earth Sci. 171, 20–27. doi:10.1016/j.jseaes.2018.11.002
Muksin, U., Rusydy, I., Erbas, K., and Ismail, N. (2018). Investigation of Aceh Segment and Seulimeum Fault by using seismological data; A preliminary result. J. Phys. Conf. Ser. 1011, 012031–012035. doi:10.1088/1742-6596/1011/1/012031
Muraoka, H., Takahashi, M., Sundhoro, H., Dwipa, S., Soeda, Y., Momita, M., et al. (2010). “April. Geothermal systems constrained by the Sumatran fault and its pull-apart basins in Sumatra, Western Indonesia,” in Proceedings World Geothermal Congress (Indonesia: Bali), 1–9.
Nabavi, S. T., Alavi, S. A., and Maerten, F. (2018). 2D finite-element elastic models of transtensional pull-apart basins. Comptes Rendus Geosci. 350, 222–230. doi:10.1016/j.crte.2018.06.001
Natawidjaja, D. H. (2018). Updating active fault maps and sliprates along the Sumatran Fault Zone, Indonesia. IOP Conf. Ser. Earth Environ. Sci. 118, 012001–012011. doi:10.1088/1755-1315/118/1/012001
Ӧzkaymak, Ç., and Sӧzbilir, H. (2012). Tectonic geomorphology of the spildağı high ranges, Western anatolia. Geomorphol. (Amst). 173-174, 128–140. doi:10.1016/j.geomorph.2012.06.003
Ӧzkaymak, Ç. (2015). Tectonic analysis of the Honaz Fault (Western Anatolia) using geomorphic indices and the regional implications. Geodin. Acta 27, 110–129. doi:10.1080/09853111.2014.957504
Pérez-Peña, J. V., Azor, A., Azañón, J. M., and Keller, E. A. (2010). Active tectonics in the Sierra Nevada (Betic Cordillerea, SE Spain): Insights from geomorphic indexes and drainage pattern analysis. Geomor 119, 74–87. doi:10.1016/j.geomorph.2010.02.020
Ramírez-Herrera, M. T. (1998). Geomorphic assessment of active tectonics in the acambay graben, Mexican volcanic belt. Earth Surf. Process. Landf. 23, 317–332. doi:10.1002/(sici)1096-9837(199804)23:4<317::aid-esp845>3.0.co;2-v
Rimando, J. M., and Schoenbohm, L. M. (2020). Regional relative tectonic activity of structures in the Pampean flat slab segment of Argentina from 30 to 32oS. Geomorphol. (Amst). 350, 106908–106917. doi:10.1016/j.geomorph.2019.106908
Saber, R., Çaglayan, A., and Isik, V. (2018). Relative tectonic activity assessment and kinematic analysis of the North Bozgush Fault Zone, NW Iran. J. Asian Earth Sci. 164, 219–236. doi:10.1016/j.jseaes.2018.06.023
Sarp, G., and Düzgün, Ş. (2012). Spatial analysis of morphometric indices: The case of bolu pull-apart basin, Western section of North Anatolian Fault system, Turkey. Geodin. Acta 25, 86–95. doi:10.1080/09853111.2013.841382
Sarp, G. (2015). Tectonic controls of the North Anatolian Fault System (NAFS) on the geomorphic evolution of the alluvial fans and fan catchments in Erzincan pull-apart basin; Turkey. J. Asian Earth Sci. 98, 116–125. doi:10.1016/j.jseaes.2014.11.017
Sarp, G., Toprak, V., and Düzgün, Ş. (2013). Activity level of tectonic basins, Western section of the north Anatolian Fault zone, Turkey. Int. Geol. Rev. 55, 350–366. doi:10.1080/00206814.2012.710373
Selçuk, A. S. (2016). Evaluation on the relative tectonic activity in the eastern lake van basin, east Turkey. Geomor 270, 9–21. doi:10.1016/j.geomorph.2016.07.009
Selim, H. H., Tüyüz, O., Karakaş, A., and Taş, K. Ö. (2013). Morphotectonic evidence from the southern branch of the North Anatolian Fault (NAF) and basins of the south Maramara sub-region, NW Turkey. Quant. Int. 292, 176–192. doi:10.1016/j.quaint.2012.11.022
Sieh, K., and Natawidjaja, D. H. (2000). Neotectonics of the Sumatran Fault, Indonesia. J. Geophys. Res. 105, 28295–28326. doi:10.1029/2000jb900120
Silva, P. G., Goy, J. L., Zazo, C., and Bardaji, T. (2003). Fault-generated mountain fronts in southeast Spain: Geomorphologic assessment of tectonic and seismic activity. Geomorphol. (Amst). 50, 203–225. doi:10.1016/s0169-555x(02)00215-5
Simanjuntak, A. V. H., Muksin, U., and Sipayung, R. M. (2018). Earthquake relocation using HypoDDMethod to investigate active fault system in Southeast Aceh. J. Phys. Conf. Ser. 1116, 032033–032039. doi:10.1088/1742-6596/1116/3/032033
Strahler, A. N. (1952). Hypsometric (area-altitude) analysis of erosional topography. Geol. Soc. Am. Bull. 63, 1117–1142. doi:10.1130/0016-7606(1952)63[1117:haaoet]2.0.co;2
Susilohadi, S., Gaedicke, C., and Djajadihardjo, Y. (2009). Structures and sedimentary deposition in the Sunda Strait, Indonesia. Tectonophysics 467, 55–71. doi:10.1016/j.tecto.2008.12.015
Sutrisno, L., Bonté, D., Daud, Y., Smit, J., Beekman, F., Van Wees, J. D., et al. (2019). “Assessing the role of pull-apart basins for high-temperature geothermal resources in transcurrent tectonic setting: Sumatra and California compared,” in European geothermal congress (Netherlands: Den Haag), 1–8.
Sutrisno, L., Smit, J., Bonté, D., Daud, Y., Beekman, F., Purwanto, W., et al. (2021). Influence of inherited basement structures on the active Sumatran Fault and volcanic arc, Indonesia. ESSOAr [preprint]. doi:10.1002/essoar.105060881 (Accessed June 30, 2022).
Tabei, T., Kimata, F., Ito, T., Gunawan, E., Tsutsumi, H., Ohta, Y., et al. (2015). “Geodetic and geomorphic evaluations of earthquake generation potential of the Northern Sumatran Fault,” in International symposium on geodesy for earthquake and natural hazards (GENAH). Editor M. Hashimoto (Cham: Springer), 21–28. doi:10.1007/1345_2015_200
Tarı, U., and Tüyüz, O. (2016). The effects of the north Anatolian Fault on the geomorphology in the eastern marmara region, northwestern Turkey. Geodin. Acta 28, 139–159. doi:10.1080/09853111.2015.1065308
Tepe, Ç., and Sözbilir, H. (2017). Tectonic geomorphology of the kemalpaşa basin and surrounding horsts, southwestern part of the gediz graben, western anatolia. Geodin. Acta 29, 70–90. doi:10.1080/09853111.2017.1317191
Tong, X., Sandwell, D. T., and Schmidt, D. A. (2018). Surface creep rate and moment accumulation rate along the Aceh Segment of the Sumatran Fault from L-band ALOS-1/PALSAR-1 observations. Geophys. Res. Lett. 45, 3404–3412. doi:10.1002/2017GL076723
Tsutsumi, H., Soeda, Y., Ismail, N., Ali, B., and Tabei, T. (2020). Tectonic landform and paleoseismic activity of the northernmost Sumatran Fault, Aceh province, Indonesia. ESSOAr [preprint]. doi:10.1002/essoar.105043191 (Accessed June 30, 2022).
van Wijk, J., Axen, G., and Abera, R. (2017). Initiation, evolution and extinction of pull-apart basins: Implications for opening of the Gulf of California. Tectonophysics 719-720, 37–50. doi:10.1016/j.tecto.2017.04.019
Wells, S. G., Bullard, T. F., Menges, C. M., Drake, P. G., Karas, P. A., Kelson, K. I., et al. (1988). Regional variations in tectonic geomorphology along a segmented convergent plate boundary, Pacific Coast of Costa Rica. Geomorphol. (Amst). 1, 239–265. doi:10.1016/0169-555x(88)90016-5
Keywords: northern sumatran fault, relative tectonic activity, geomorphic indices, strike-slip basin, digital elevation model
Citation: Putra AF and Chenrai P (2022) Relative tectonic activity assessment of the Northern Sumatran Fault using geomorphic indices. Front. Earth Sci. 10:969170. doi: 10.3389/feart.2022.969170
Received: 14 June 2022; Accepted: 26 July 2022;
Published: 23 August 2022.
Edited by:
Basilios Tsikouras, Universiti Brunei Darussalam, BruneiReviewed by:
Muhammad Aufaristama, University of Twente, NetherlandsCopyright © 2022 Putra and Chenrai. This is an open-access article distributed under the terms of the Creative Commons Attribution License (CC BY). The use, distribution or reproduction in other forums is permitted, provided the original author(s) and the copyright owner(s) are credited and that the original publication in this journal is cited, in accordance with accepted academic practice. No use, distribution or reproduction is permitted which does not comply with these terms.
*Correspondence: Piyaphong Chenrai, cGl5YXBob25nX2NAaG90bWFpbC5jb20=
Disclaimer: All claims expressed in this article are solely those of the authors and do not necessarily represent those of their affiliated organizations, or those of the publisher, the editors and the reviewers. Any product that may be evaluated in this article or claim that may be made by its manufacturer is not guaranteed or endorsed by the publisher.
Research integrity at Frontiers
Learn more about the work of our research integrity team to safeguard the quality of each article we publish.