 Xiaoyu Gao1,2
 Shuqin Zhang
 Gang Fu
- 1State Key Laboratory of Severe Weather, Chinese Academy of Meteorological Sciences, Beijing, China
- 2Ministry of Education Key Laboratory for Earth System Modeling, Department of Earth System Science and Joint Center for Global Change Studies, Tsinghua University, Beijing, China
- 3College of Oceanography and Meteorology, South China Sea Institute of Marine Meteorology, Key Laboratory of Climate Resources and Environment in Continental Shelf Sea and Deep Sea of Department of Education of Guangdong Province, Guangdong Ocean University, Zhanjiang, China
- 4Department of Marine Meteorology, College of Oceanic and Atmospheric Sciences, Ocean University of China, Qingdao, China
- 5Collaborative Innovation Center on Forecast and Evaluation of Meteorological Disasters/Key Laboratory of Meteorological Disasters of Ministry of Education, Nanjing University of Information Science and Technology, Nanjing, China
- 6College of Atmospheric Sciences, Chengdu University of Information Technology, Chengdu, China
Explosive cyclones (ECs) pose serious challenges for weather forecasting and significant threats to human life and property. In searching for the key points that make a cyclone go through explosive deepening off the East Asian coast, we present a comparative analysis of ECs and nonexplosive cyclones (or ordinary cyclones; OCs) using 10 years of ERA5 reanalysis data with high temporal and spatial resolutions. Their differences in synoptic backgrounds are shown, and mechanisms of the initial developments are compared quantitatively from the perspective of potential vorticity (PV). Among the identified 135 cyclones, 72 went through explosive growth and 37.5/36.1/20.8/5.6% of these ECs are ranked as weak/medium/strong/super ECs. ECs feature stronger low-level baroclinicity and higher PV than OCs. The decomposition of the local PV tendency shows the dominant role of the PV advection (with a correlation coefficient of 0.8). During the initial development, ECs have an average meridional temperature contrast 4 K larger than OCs within 20 latitudes at the low troposphere in the upstream, due to a stronger cold advection. The upstream colder air increases the horizontal temperature gradient and thus produces steeper isentropic surfaces inclining to the west. Since the PV intrusion is mainly along the isentropic surfaces, the increase in their slope significantly enhances the downward transport of PV from upper air. The importance of the horizontal gradient of potential temperature is further proved by numerical experiments with the Weather Research and Forecast (WRF) model on typical winter ECs. In sensitivity experiments, the low troposphere meridional temperature contrast decreasing by the average difference between ECs and OCs significantly decreases PV and stops the cyclones from explosive deepening. Despite the importance of diabatic processes in the deepening of mid-latitude cyclones emphasized by many studies, this study shows that the PV intrusion dominated by cold air mass is the key cause of winter explosive cyclogenesis in this region.
1 Introduction
Explosive cyclones (ECs), also known as “meteorological bombs” (Rice 1979), are extratropical cyclonic systems that go through rapid development. They pose serious threats to maritime traffic safety (Sanders and Gyakum 1980; Lamb 1991; Liberato et al., 2011; Liberato et al., 2013) so they need to be paid much attention. The landmark study by Sanders and Gyakum (1980) defined EC as the extratropical cyclone with a central sea level pressure fall of at least 24 hPa within 24 h when adjusted geostrophically to 60°N. The latitude in this definition was adjusted to 42.5°N by Roebber (1984) and to 45°N by Gyakum et al. (1989) and Zhang et al. (2017), considering that ECs frequently occur at mid-latitude. Explosive cyclogeneses within shorter terms were also considered based on datasets with higher temporal resolution. Yoshida and Asuma (2004), Zhang et al. (2017), and Fu et al. (2020) used a 12-h pressure change to define ECs.
Despite the statistical differences, many studies marked offshore East Asia as one of the most frequent areas for explosive cyclogenesis. Sanders and Gyakum (1980), Roebber (1984), and Lim and Simmonds (2002) indicated that ECs often occur over the Northwestern Pacific in the cold season, especially in winter. The statistical analysis based on five cold seasons by Yoshida and Asuma (2004) showed that the rapid deepening of ECs over the Northwestern Pacific usually occurred within 30–60°N, 130–170°E. As shown in Figure 1A, the East Asian coast locates between the largest continent and ocean on the Earth, Eurasia, and Pacific. The Kuroshio Current transports warm seawater northeastward, which produces a large amount of heat flux into the atmosphere. In winter, the mean temperature trough is upstream of the mean geopotential height (GPH) trough within the troposphere (Figures 1B−D), and the geostrophic wind frequently brings cold air from higher latitudes to this area. The large thermal contrast cooperating with mid-latitude westerly produces strong baroclinic instability and many ECs (e.g., Yoshida and Asuma 2004). A statistical analysis based on 30 years of surface reanalysis (Chen et al., 1992) indicated that the eastern Sea of Japan and the Northwestern Pacific are two favorable areas for explosive cyclogenesis off the East Asian coast, the latter of which is located near the warm Kuroshio Current. A recent study (Zhang et al., 2022) showed that ECs over the Sea of Japan have stronger baroclinicity and cyclonic vorticity, but weaker water vapor convergence and upper-level jet stream than those over the Kuroshio/Kuroshio Extension. Although many studies have worked on the statistical characteristics of ECs off the East Asian coast, none of them discussed the cyclones that do not go through explosive cyclogenesis. This might be an important supplement to the climatology of ECs since the comparison between ECs and ordinary cyclones (OCs) can give the dominant factors for explosive cyclogenesis in a certain region, which helps to predict the deepening rate of a cyclone during its initial development.
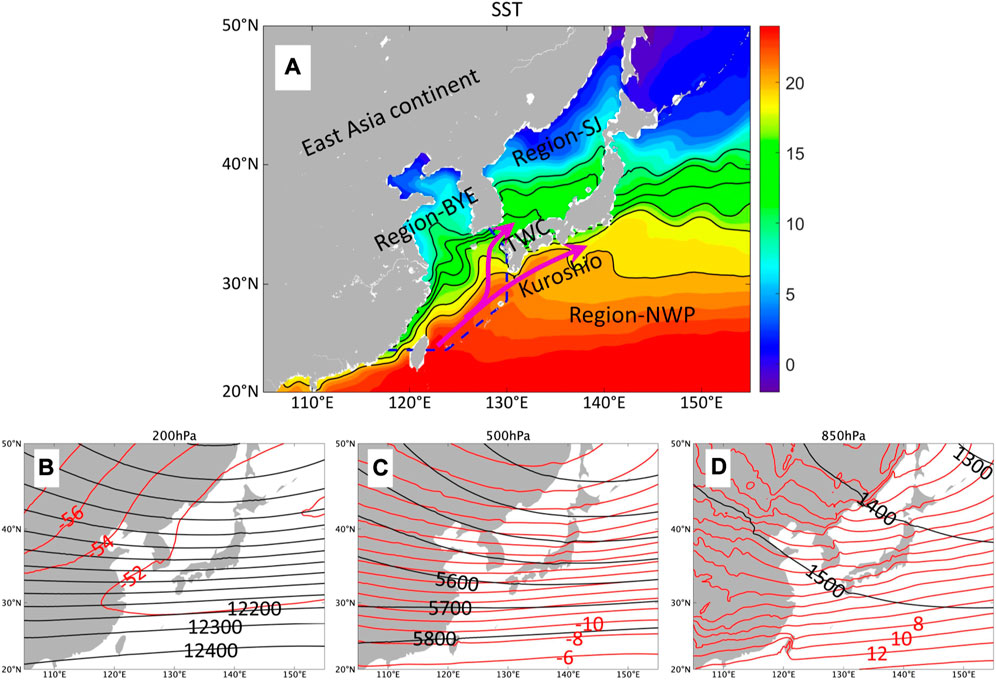
FIGURE 1. SST (A) and synoptic features at 200 hPa (B), 500 hPa (C), and 850 hPa (D) averaged in winters during 2010–2019. Contours in (A) show the SST within 10–20°C with an interval of 2°C. Blue dashed lines divide the ocean into three regions: Region-BYE (including the Bohai Sea, the Yellow Sea, and the East China Sea), Region-SJ (the Sea of Japan), and Region-NWP (the Northwestern Pacific). “TWC” denotes the Tsushima Warm Current. Black and red contours in (B–D) represent GPH (gpm) and air temperature (°C).
Multiple dynamic and thermodynamic processes are related to the rapid deepening of cyclones. The upper-level jet stream provides dynamic forcing on the left side of its exit with strong divergence, cyclonic vorticity advection, and lifting (Uccellini and Kocin 1987; Wash et al., 1988; Cammas and Ramond 1989; Nakamura 1993). The cyclonic vorticity advection at the mid-troposphere enhances the simultaneous surface deepening of cyclones downstream (Sanders 1986). A large gradient of sea surface temperature (SST) is also favorable for ECs (Kuwano-Yoshida and Asuma 2008; Taguchi et al., 2009; Kuwano-Yoshida and Enomoto 2013) since it can produce a large horizontal thermal contrast and thus a strong baroclinicity at the low level. Baroclinicity is an important factor that drives explosive cyclogenesis (Sanders 1986; Manobianco 1989; Wash et al., 1992). Iwao et al. (2012) analyzed the changes of ECs over the Northwestern Pacific in the past 30 years and showed that enhancement of low-level baroclinicity leads to the increase of ECs.
To consider both dynamic and thermodynamic factors, many studies analyzed the distributions and changes of potential vorticity (PV). Some case studies showed that upper-tropospheric PV is associated with the development of low-level cyclogenesis. There are three distinct positive PV anomalies in an extratropical cyclone: surface, lower-tropospheric, and upper-tropospheric, which are produced by the surface warm anomaly, low-tropospheric diabatic processes, and upper-level stratospheric intrusion, respectively. Downward transport of high PV in the stratosphere effectively enhances downstream surface cyclones (Bosart and Lin 1984; Reader and Moore 1995; Zhang and Fu 2018). Low-level PV anomaly coupled with upper-level PV disturbance may induce the rapid deepening of cyclones (Cordeira and Bosart, 2011). The diabatic process (i.e., the local PV generation) is notable, which is usually attributed to the latent heat release (LHR). The LHR can increase the potential temperature, leading to larger static stability and thus higher PV at lower levels (e.g., Davis et al., 1993; Ahmadi-Givi et al., 2004). Using an idealized simulation, Schemn and Wernli (2014) proved that the LHR strengthened PV anomaly, leading to speedup of both the surface wind and upper-level jet stream. Heo et al. (2015) showed that the LHR in the warm conveyor belt produces nearly half of the low-level PV generation during the initial development of a spring EC. A climatological analysis by Binder et al. (2016) indicated that the impact of the LHR depends on its location. The warm conveyor belts that ascend near the cyclone centers lead to more intensified cyclogenesis than those which ascend along the cold front since their PV generation by the LHR has greater impact on the cyclone centers. On the other hand, for cyclones with warm seclusion (also called the Shapiro–Keyser cyclones; Shapiro and Keyser, 1990), PV near the cyclone centers is strongly affected by the structure of the cold conveyor belt and bent-back front. Hirata et al. (2015) found that the cold conveyor belt-induced LHR plays a dominant role in the low-level PV generation for an EC with warm seclusion.
Despite multiple studies on the impacts of (1) PV transport from upper air and (2) low-level LHR on the PV generation and the intensity of cyclones, what makes the ECs develop faster than OCs in their early stage was rarely analyzed, which is discussed in this study. For instance, LHR mainly acts in the mature stage of cyclones, but its importance during the initial developments is still unknown. On the other hand, most discussions about mechanisms were based on case studies. To better understand the key physical processes of explosive cyclogenesis, we need a quantified comparison of ECs versus OCs by a statistical analysis. Following this motivation, this study presents the statistical analysis of both OCs and ECs which occurred off the East Asian coast in 10 winters, and compares the synoptic backgrounds for their initial developments in the perspective of PV. We also design a series of numerical experiments to further prove the conclusions. The study is organized as follows. Section 2 describes the data and methods. Section 3 shows the systematic comparison of ECs vs. OCs based on ERA5 reanalysis data, including cyclone intensity, low-level baroclinicity, and decomposition of local PV tendency. Section 4 discusses the design and results of modeling experiments. A summary is given in Section 5.
2 Data and methods
2.1 Data
This study uses the fifth generation of the European Centre for Medium-Range Weather Forecasts (ECMWF) Reanalysis (ERA5; available at https://cds.climate.copernicus.eu) to identify the cyclones and analyze their dynamic and thermal-dynamic structures. The dataset has 1-h temporal resolution, 0.25°×0.25° horizontal resolution, and 37 vertical levels. The high temporal and spatial resolutions help to analyze the changes in the fine structures of cyclones during their initial developments. The data cover 10 winters, including December, January, and February from 2010 to 2019. The ERA5 reanalysis data are also used to generate the initial and boundary conditions for the Weather Research and Forecast (WRF) model.
The satellite cloud images retrieved from visible channels of the satellite of Himawari-8 (available at https://himawari8.nict.go.jp/) are used to show the development of clouds around the ECs, as discussed in Section 4.
2.2 Algorithms for statistical analyses
Using the 0.25°×0.25° dataset, we attempted to identify all the winter cyclones that occurred over East Asia (20–50 °N, 105–155 °E, as shown in Figure 1A) during the 10 years from 2010 to 2019. The detection and tracking methods follow Hart (2003) and have been modified according to the temporal and spatial resolution of the ERA5 dataset.
To detect cyclones at each moment, the distribution of sea level pressure (SLP) is shown by contours starting at 900 hPa with an interval of 2.5 hPa. A cyclone is considered to exist when there is at least one close isobaric line within a circular area with a radius of 800 km and the local minimum of SLP is less than 1,020 hPa. The location of the minimum SLP is considered the cyclone center.
To track cyclones, the nearest two cyclones with a 1-h interval are considered the same cyclone when their distance is less than 500 km. Such a distance threshold ensures that a wide but shallow cyclone is not falsely identified as two or more cyclones when SLP around its center rapidly decreases. Finally, the cyclones whose appearances over East Asia lasted for less than 24 h are dismissed, which include those with a short lifetime as well as those that move away from this region.
The priority of this method is to find as many cyclones as possible with a low computational cost when dealing with such long-term data with high resolution. It gives reasonable results, and small changes in the thresholds do not affect the conclusions of this study.
The following definition of ECs is used to calculate the deepening rate (DR) of central SLP of the cyclone (e.g., Yoshida and Asuma 2004; Zhang et al., 2017; Fu et al., 2020):
where
Following Zhang et al. (2017), φ0 is set to be 45°. An EC is defined as a cyclone with a 12-h deepening rate (DR12) ≥ 1 hPa/h. ECs can be classified into four categories according to DR12: weak (1.00≤DR12≤1.29 hPa/h), moderate (1.30≤DR12≤1.69 hPa/h), strong (1.70≤DR12≤2.29 hPa/h), and super (DR12≥2.30 hPa/h) ECs.
We also calculate the 1-h deepening rate (DR1) to analyze the short-term variation. Synthetic analysis is used to show the characteristics of ECs and OCs. For a category of cyclones, the distribution of each variable is averaged among all cases in relative geographic coordinates within a 20°×20° box around the centers. To eliminate the differences in cyclones due to their different latitudes, for each cyclone, we analyze the anomaly values of the potential temperature and GPH instead of their true values. An anomaly value is defined as the difference between the true value at any grid point and its mean value of the 20°×20° box at the same pressure level.
We measure the low-level baroclinic instability by using the Eady growth rate (EGR; Hoskins and Valdes, 1990), which is defined by
where
The lapse rate of potential temperature (Г) is used to analyze the static stability. It is calculated by
where
The Ertel PV (Ertel 1942) is calculated by
where
The local PV tendency (
where
where
After the three terms are identified by Eqs 6–8,
3 Statistical analysis
A total of 135 cyclones are found to stay over East Asia for at least 24 h, more than a half of which went through explosive cyclogenesis. Most of them were initiated over sea, and their frequency of occurrences is quite even among the 10 years. Their intensities, spatiotemporal distribution, synoptic background, and PV structures are compared, and the mechanisms for their differences are discussed.
3.1 Intensity
As shown in Figure 2A, 72 of the 135 cyclones are ECs, among which 37.5/36.1/20.8/5.6% are categorized as weak/medium/strong/super ECs. This suggests a higher proportion for stronger ECs than that proposed by Zhang et al. (2017) with the same methods, which gives a percentage of 65.1/29.1/3.9/1.9% over the Sea of Japan and 45.6/33.2/18.6/2.6% over the Northwestern Pacific. Zhang et al. (2017) analyzed ECs from October to April during 2000–2015 by using 1°×1° reanalysis data. Cooler months for the cyclones in this study are more beneficial to stronger cyclogenesis, and high-resolution reanalysis data could increase the climatological frequency of ECs.
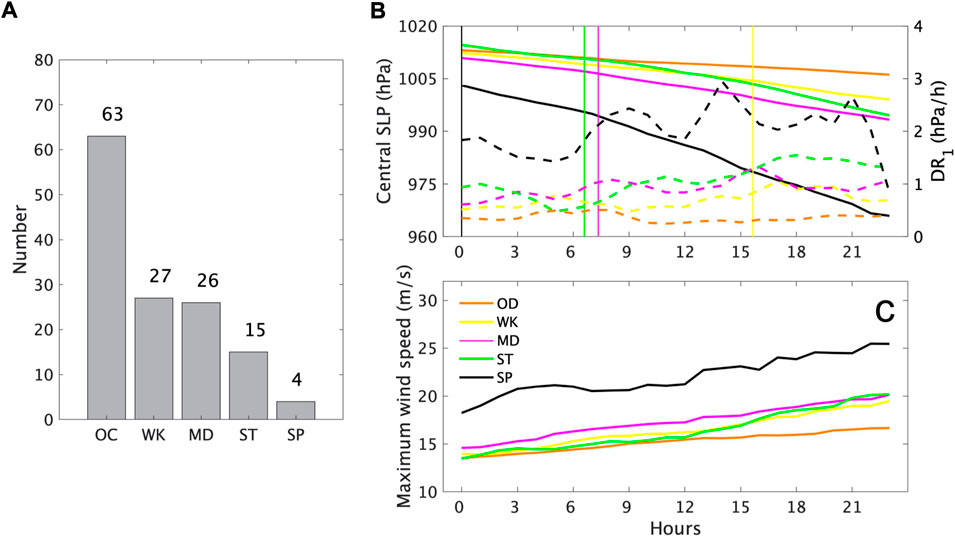
FIGURE 2. Numbers of different categories of cyclones (A), 24-h variation of their central SLPs (B), and maximum wind speed (C). Solid and dashed curves in (B) represent the central SLPs and 1-h deepening rate, respectively, and vertical lines show the beginning of explosive growth. “WK,” “MD,” “ST,” and “SP” denote weak, medium, strong, and super ECs, respectively.
Except for the super ECs, average central SLPs for other categories are quite similar at the initial moment (Figure 2B). Stronger ECs have a greater deepening rate for the whole time, and their explosive growths start earlier. It is notable that the maximum wind speed varies according to the central SLP (Figures 2B,C), but a greater deepening rate is not a guarantee for stronger wind. Before 20 h, the strong ECs have an average wind weaker than medium ECs (Figure 2C). In awareness of this fact, Fu et al. (2020) chose a wind speed of 17.2 m s−1 as the threshold value in the definition of ECs since the major threat of cyclones to shipping safety is due to strong winds.
3.2 Spatiotemporal distribution
The cyclone tracks are dense to the east of 120°E (Figure 3A). The mean 24-h tracks for OCs and different ECs distribute around Japan Island, and are quite close to the areas of the Kuroshio and Tsushima Warm Current (Figure 1A). Cyclones with greater deepening rates have a further south average initial location, indicating that explosive cyclogenesis might be related to deeper GPH trough in the mid-troposphere, higher SST, or more adequate water vapor.
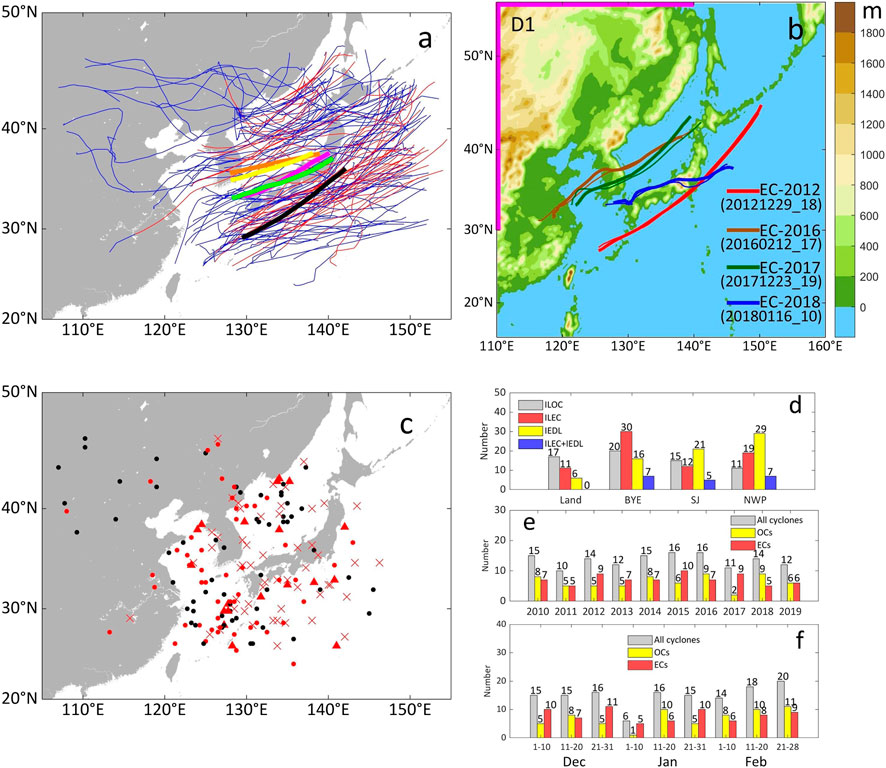
FIGURE 3. Distribution of cyclones over East Asia in 10 winters. Thin lines in (A) show the tracks for 135 cyclones, with red parts denoting where cyclones were explosively deepened. Thick orange, yellow, purple, green, and black lines denote the average 24-h tracks for OCs, weak, medium, strong, and super ECs, respectively. Black and red dots in (C) show the initial locations for OCs and ECs (denoted by ILOC and ILEC). Red crosses show the initial explosive deepening locations for ECs (denoted by IEDL), and red triangles show the initial locations for ECs which went through explosive deepening from the beginning (denoted by ILEC+IEDL). Bars in (D) denote the numbers of the four kinds of locations over land, Region-BYE, Region-SJ, and Region-NWP (located in Figure 1A). Bars in (E) and (F) denote the numbers of cyclones in different years and different dates, respectively. The model domain for WRF modeling discussed in Section 4 is shown in (B). Shadings denote the terrain. Thick purple lines locate the boundaries where the temperature is modified for Exp-MT. Other thick lines show the tracks for the four ECs, thin lines show their tracks simulated by Exp-Ctrl, and the numbers show the initial moments of the four ECs in the form of yyyymmdd_hh in UTC.
As shown in Figures 3C,D, most ECs were initiated over sea, and the frequency of marine explosive cyclogeneses (i.e., the initial explosive deepening) is as high as 85%. More ECs started to explosively deepen in Region-SJ/NWP than in Region-BYE, which is probably related to the warm currents in these regions. A total of 19 ECs went through explosive deepening at their initial moments, 7/5/7 of which existed in Region-BYE/SJ/NWP.
Each year, 10 or more cyclones occurred in East Asia (Figure 3E). 2015 met both the most cyclones (16) and most ECs (10). It is to be noted that 2015 is the warmest year, and its highest frequency of ECs agrees with the conclusion drawn by Iwao et al. (2012) that global warming enhances extratropical cyclones with the increase in both low-level baroclinicity and humidity. As shown in Figure 3F, 46/37/52 cyclones occurred in December/January/February, 28/21/23 of which are ECs. Cyclones are more likely to go through explosive deepening in December and January than in February.
3.3 Synoptic background
The synoptic background for ECs has stronger low-level baroclinicity than that for OCs. As shown in Figure 4, at the initial time, OCs usually have an upper-level GPH trough upstream, and the geostrophic wind is almost parallel to isotherms at 500 hPa. The thermodynamic structure (Figures 4A–C) shows that the strong cold/warm advections in the west/east of the cyclone centers mainly exist within the low troposphere. Horizontal thermal contrast is larger for ECs (Figures 4D–F), and the maximum difference is located about 6-degree north of the centers. GPH anomalies are lower around centers and higher in the east and west at 850 hPa and 925 hPa, respectively, indicating deeper troughs and stronger temperature advections within the low troposphere. The typical characteristics of cyclones also include upper-level jet streams with a maximum speed of about 50 m s−1 (Figure 4G) and abundant water vapor along the warm conveyor belt (Figure 4H). For ECs, the wind speed is larger in upper-level jet streams (Figure 4J), and precipitable water is more in the south (Figure 4K). Meanwhile, the SST for ECs in Region-BYE and Region-SJ is ∼0.5°C higher than that for OCs (Figures 4I, L), which also helps to enhance the cyclones.
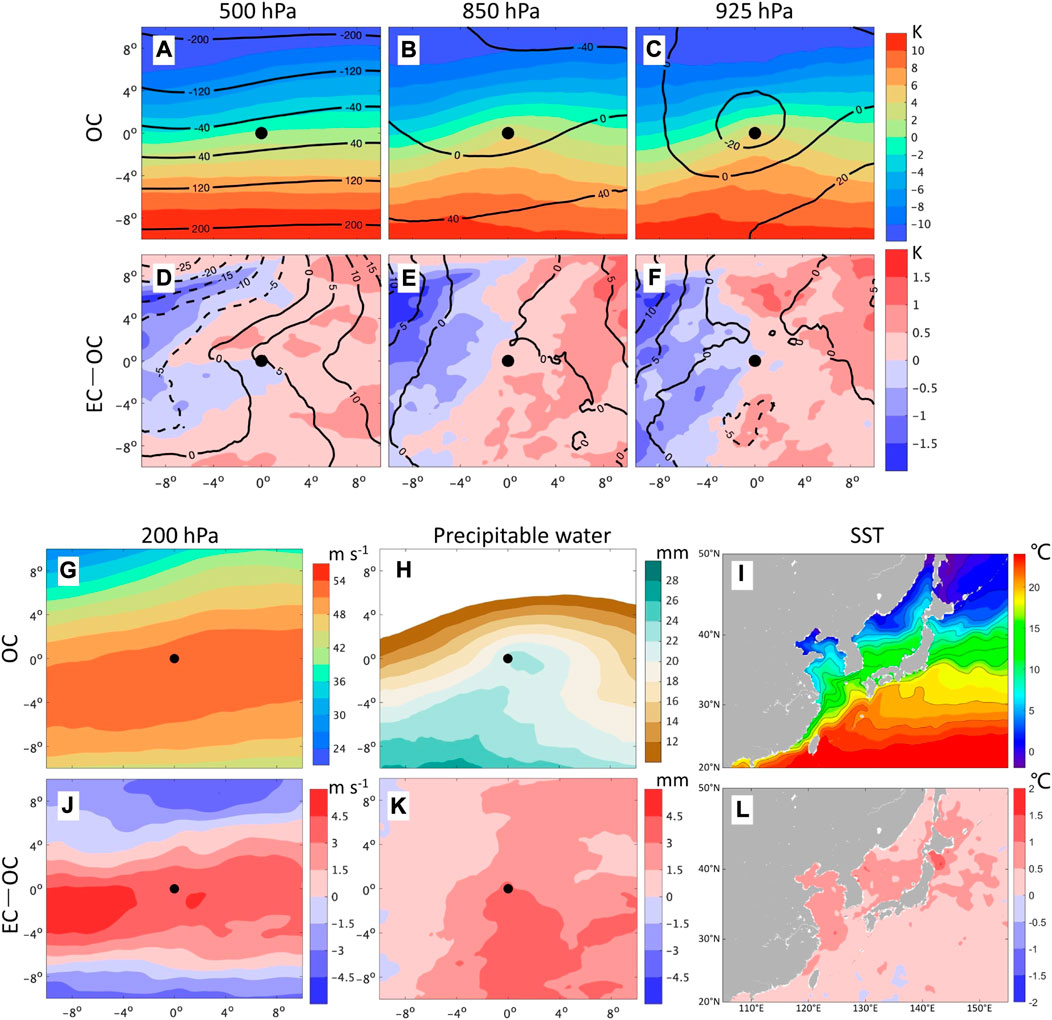
FIGURE 4. Comparison of initial conditions for OCs and ECs. The first row shows average potential temperature anomaly (shadings) and GPH anomaly (gpm; contours) for OCs at 500 (A), 850 (B), and 925 (C) hPa. The second row shows the difference in average potential temperature anomaly (shadings) and GPH anomaly (gpm; contours) between ECs and OCs at 500 (D), 850 (E), and 925 (F) hPa. The third row shows the average 200 hPa wind speed (G) and precipitable water (H) for OCs. The fourth row shows the difference in average 200 hPa wind speed (I) and precipitable water (J) between ECs and OCs. Black dots locate the cyclone centers.
The stronger temperature advection and horizontal thermal contrast in the low troposphere for ECs lead to stronger low-level baroclinicity. As shown in Figure 5A, the low troposphere has much weaker static stability over sea than that over land. The average Г decreases from southwest to northeast. It is above 7×10⁻⁴ K Pa−1 over the East China Sea and most of the Yellow Sea, but below 6×10⁻⁴ K Pa−1 over the Sea of Japan and the Northwestern Pacific Ocean where the average EGR is above 1 d−1. The weak static stability can be attributed to the warm sea surface, which transports heat into the low troposphere and makes the potential temperature decrease slower according to the air pressure. Both the weak static stability and the strong baroclinicity are beneficial to cyclogenesis, which is an explanation for most winter cyclones going through these regions (Figure 3A). During the initial development of OCs, a large EGR exists within ±4 latitudes around centers (Figure 5B) and is more widely distributed in the east (since the warm front zone is usually wider than the cold front zone), while Г is smaller around the center (since the warm tongue around the center enhances with pressure as shown in Figures 4A–C). Both variables are larger for ECs (Figure 5C). With stronger cold advection, the EGR increases by >0.2 d−1 in the southwest, and its maximum value near the cold front is pushed southward. Г increases significantly in the same area, and the maximum increment exists in the south of the west boundary, leading to a larger difference in static stability between the center and the west for ECs. This is quite important for explosive cyclogenesis, which is discussed in Subsection 3.5.
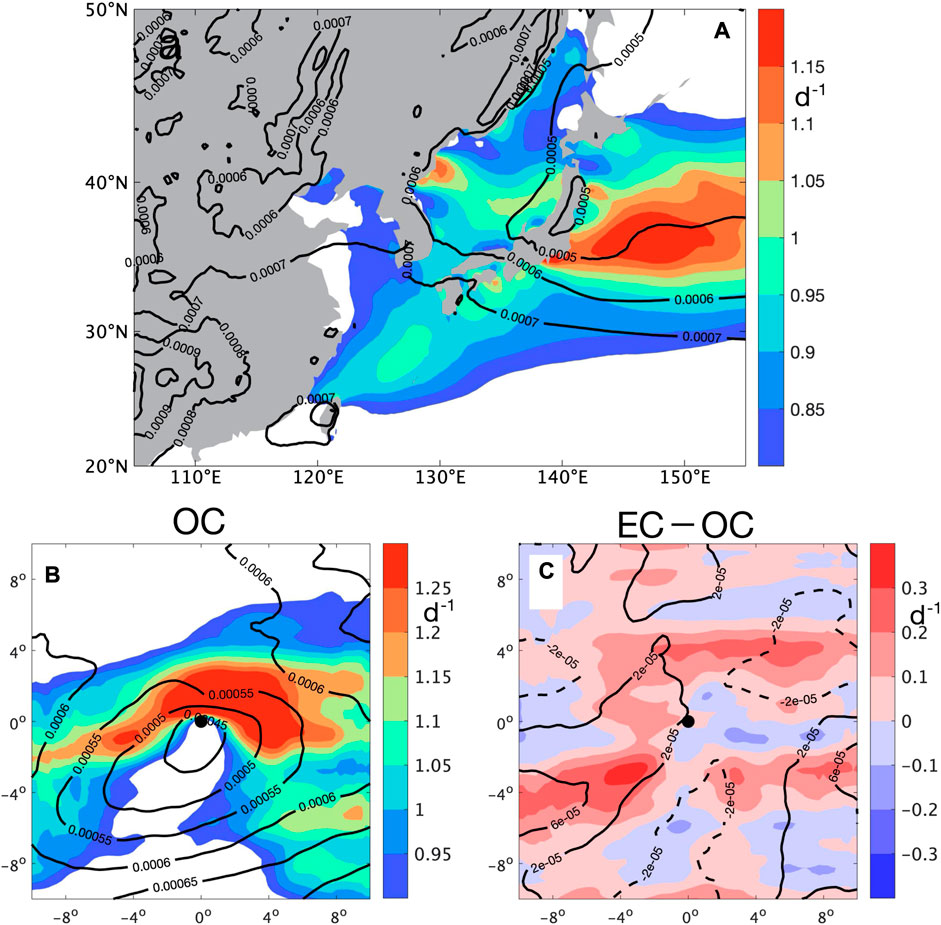
FIGURE 5. Low-level baroclinicity and static stability over East Asia (A) and around the OC center (B), and the difference between ECs and OCs (C). Shadings denote EGR, and contours denote Г (unit: K Pa−1). Solid/dashed lines in (C) denote average Г for ECs larger/smaller than OCs. Both variables are retrieved from “daily values” between 850 and 700 hPa. For (A), “daily values” are the potential temperatures and wind velocities averaged during 00–23 UTC of each day, and EGR and Г are averaged within 10 winters. For (B–C), “daily values” are averaged in relative geographic coordinates within the 20°×20° box around the center during the first 24 h for each cyclone, and EGR and Г are averaged among all OCs or ECs.
3.4 PV budget
The enhancement of low-level PV plays an important role in cyclogenesis (Campa and Wernli, 2012). It usually comes from two mechanisms: PV intrusion from the upper air and PV production by diabatic heating. The former is done by a downdraft in the upstream of the westerly, and the latter involves the changes in the thermal structure by multiple processes. The warm sea surface heats the low troposphere and enhances the near-surface PV. The condensation within ascending motion releases latent heat and enhances the lower-level PV (while decreasing the upper-level PV). The evaporation of precipitation has the opposite effect. The diabatic term in the PV budget only focuses on their composite effects.
As shown in Figure 6, there is a PV intrusion in the west of cyclones, which is stronger for ECs than for OCs. For OCs, the initial PV is less than 1 PVU (1 PVU=1×10⁻⁶ m2 s−1 K kg−1) around the center and increases to over 1.2 PVU within 12 h (Figures 6A–C). A high PV tongue extends downward in the west, making the mid-troposphere have much higher PV in the west than in the east. When the cold air mass from the Eurasian continent meets the warm air mass above the ocean, a baroclinic atmospheric background is created. The isentropic surfaces incline to the west. Since adiabatic movements are parallel to the isentropic surfaces, the westerlies tend to transport high PV from the upper air down to the low troposphere. The enhancement of local PV (i.e., horizontal advection and vertical transport of the PV term, diabatic PV production) and the weakening of static stability along the motion from upstream to the cyclone center (Figure 5B) can increase the local relative vorticity, which is increased by ∼50% around the center within 12 h.
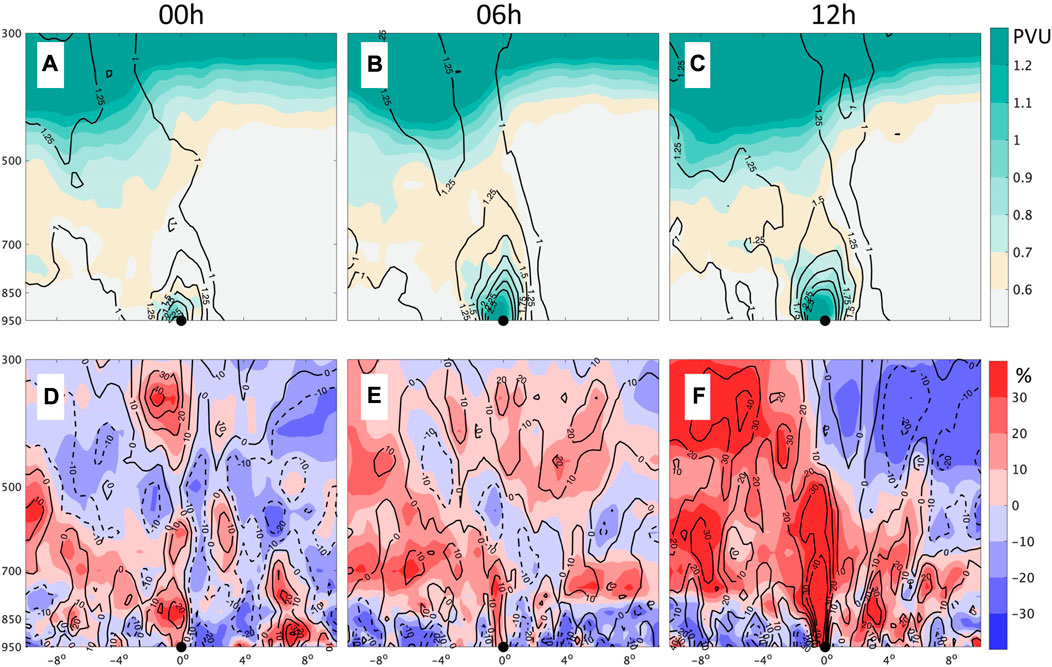
FIGURE 6. Zonal cross sections of the average PV and relative vorticity going through the cyclone center (denoted by the black dots) during initial development. The first row shows the average PV (shadings) and relative vorticity (contours; unit: 10−4 s−1) for OCs. The second row shows the difference in PV (shadings) and relative vorticity (contours; unit: %) between ECs and OCs, with solid/dashed lines denoting relative vorticity for ECs larger/smaller than OCs. The left/middle/right column shows the situation 0/6/12-h after the cyclones are identified.
For ECs, the PV around centers is much higher (Figures 6D–F) and increases more rapidly. At the initial moment (0 h), a stripe where PV is over 10% higher for ECs starts over the center and inclines to the west (Figure 6D). Then the difference grows larger, and PV within 300–850 hPa is significantly higher for ECs in the west at 12 h. The relative vorticity difference has a pattern quite similar to the PV difference within the whole troposphere, indicating the close relationship between PV and the dynamic strength of cyclones. It is to be noted that for both categories of cyclones, PV around the center is higher than low-troposphere PV in the west at the initial time, indicating that PV advection around the center is negative, and PV generation by a diabatic process is an important term in cyclogenesis, which is consistent with former studies (e.g., Schemn and Wernli, 2014; Heo et al., 2015).
The local PV tendency is analyzed to further discuss the origin of PV transport. The four terms in Eq. 5 are calculated in a quasi-cubic box within 500–950 hPa over the 20°×20° box around the center for each cyclone by Eqs 6–9. As shown in Figure 7, the PV advection dominates the enhancement of PV. During the first 3 h, PV tendencies are similar for both categories, but the adiabatic change (defined as the summation of advection and vertical transport) for ECs is larger than that for OCs (Figure 7A), with a larger positive advection term and a larger negative vertical transport term (Figure 7B). The advection term keeps increasing for ECs and varies little for OCs in the next 18 h (Figure 7B), accompanied by the increasing difference in PV tendencies (Figure 7A). At 21 h, both the PV tendency and advection term for ECs are ∼4 PVU/h larger than those for OCs. The vertical transport term varies with an opposite trend to the advection term, indicating that higher PV is converged into the box by horizontal airflow and is diverged by lifting. The net diabatic term over the column is negative for OCs as diabatic PV erosion above the maximum heating level may suppress the diabatic PV production below. The net diabatic PV is enhanced within ECs due to their stronger LHR. However, the difference is not significant before 10 h (Figure 7B) when the total PV tendency for ECs is already 1 PVU/h larger than that for OCs (Figure 7A), indicating that the enhancement of diabatic PV production is a result rather than the cause of the initial enhancement of PV. The correlation between PV advection and PV tendency is >0.8 (Figure 7C), which is much stronger than others (Figures 7D,E), further proving the crucial role of PV advection.
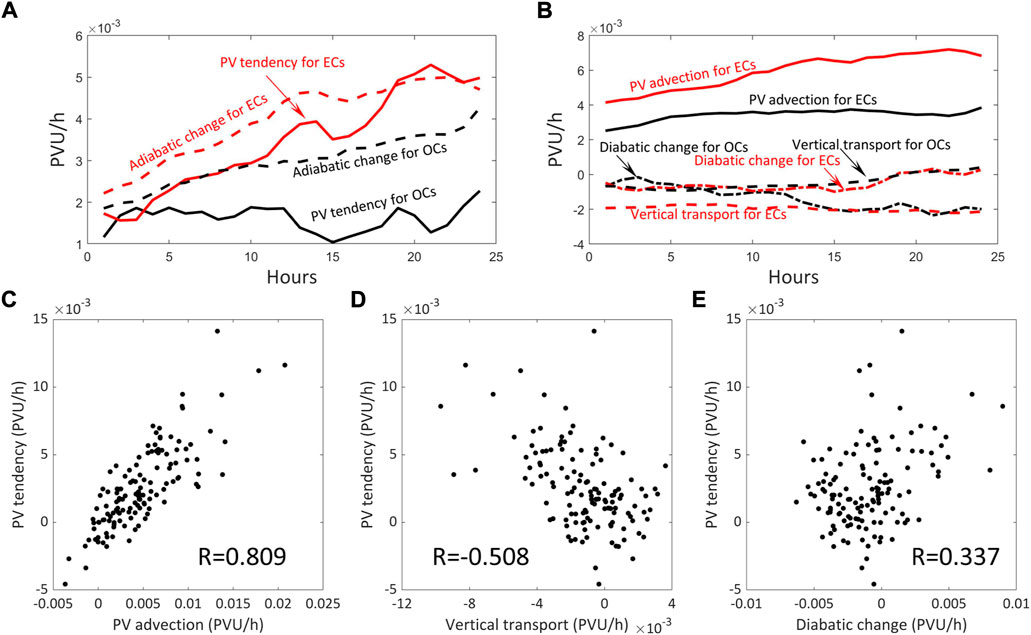
FIGURE 7. Contribution of PV advection, vertical transport, and diabatic change to PV tendency. The upper row shows the variation of each term during initial development averaged among OCs (black lines) and ECs (red lines). The lower row shows the distribution of PV tendency and PV advection (C)/vertical transport (D)/diabatic change (E) averaged during the initial 24 h for each cyclone, with R denoting the correlation coefficient.
3.5 Structure of PV intrusion
What dominates the enhancement of the PV convergence for ECs? According to Eq. 7, within a quasi-cubic box, it can be decomposed into four terms, which denote the horizontal transport of PV across the box’s four lateral boundaries. As shown in Figure 8, the most significant difference in PV transport exists at the west boundary, where northwesterly brings higher PV into the box for ECs. It is also evident at the north boundary (Figure 8D), which offsets part of the enhancement of PV input at the west boundary since a positive difference in vPV here means stronger PV output from the box. Thus, the stronger input of PV in the west of cyclones is the key cause for the higher PV for the ECs. At the north boundary, the vPV difference has a similar pattern to the v difference (Figure 8D), indicating that the stronger output of PV here is due to stronger wind. Meanwhile, the zonal and meridional winds at the west boundary for ECs are only 1–2 m s−1 stronger than those for OCs, and the difference in uPV is weakly related to wind speed (Figure 8A). It is because the ECs already have higher PV at the west boundary during the initial development, which is produced by vertical PV intrusion rather than horizontal transport.
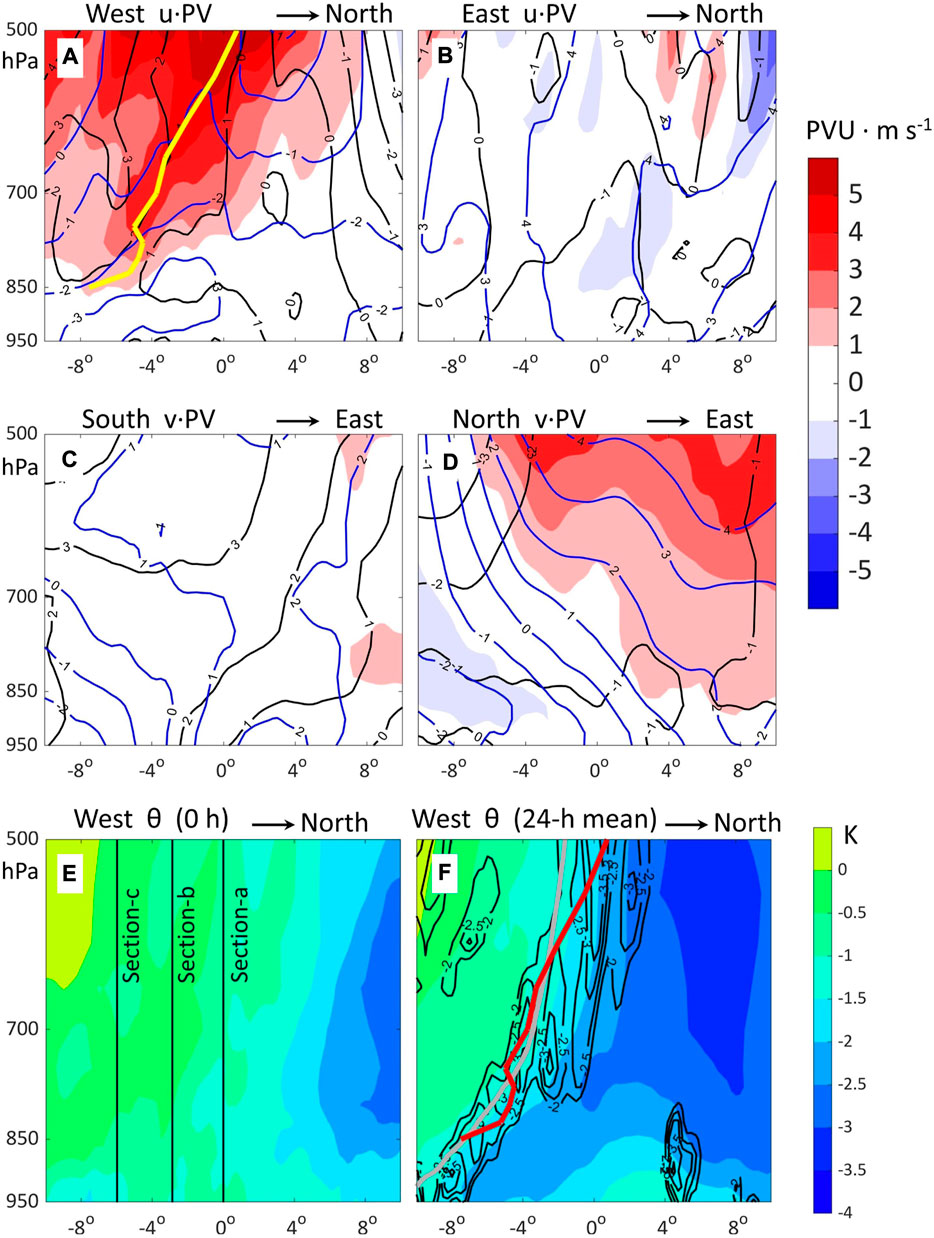
FIGURE 8. Difference in the 24-h averaged wind speed and PV transport between ECs and OCs at the west (A), east (B), south (C), and north (D) boundary, as well as difference in thermal structures at the west boundary at initial time (E) and averaged during the first 24 h (F). In (A) and (B), shadings denote the difference in the product of the zonal wind speed and PV, while in (C) and (D), shadings denote the difference in the product of the meridional wind speed and PV. Black/blue contours denote the difference in the zonal/meridional wind speed (unit: m s−1). In (E) and (F), shadings denote potential temperature, and contours in (F) denote its meridional gradient (i.e.,
The difference in thermal structures gives an explanation for the stronger PV intrusion. As shown in Figures 8E,F, the horizontal gradient of potential temperature in the west of ECs is much stronger. At the initial moment, the meridional temperature contrast is ∼3 K larger within 20 latitudes (Figure 8E), which is further enhanced later. During the next 24 h, colder air mass invades the lower levels while moving southward. The average temperature contrast for ECs is ∼4 K larger than that for OCs (Figure 8F), and the difference of >1.5 K is significant in statistics (which can pass the t-test with confidence of 0.95). Figure 8F also shows a belt where the meridional gradient of the potential temperature (i.e.,
Figure 9 shows more details of the PV intrusion during initial development by comparing PV at zonal cross-sectors at 0°, −3°, and −6° (as shown in Figure 8E). As shown in Figures 9aA–aG, cA–cG, eA–eG, positive differences in both PV and the zonal gradient of the potential temperature (i.e.,
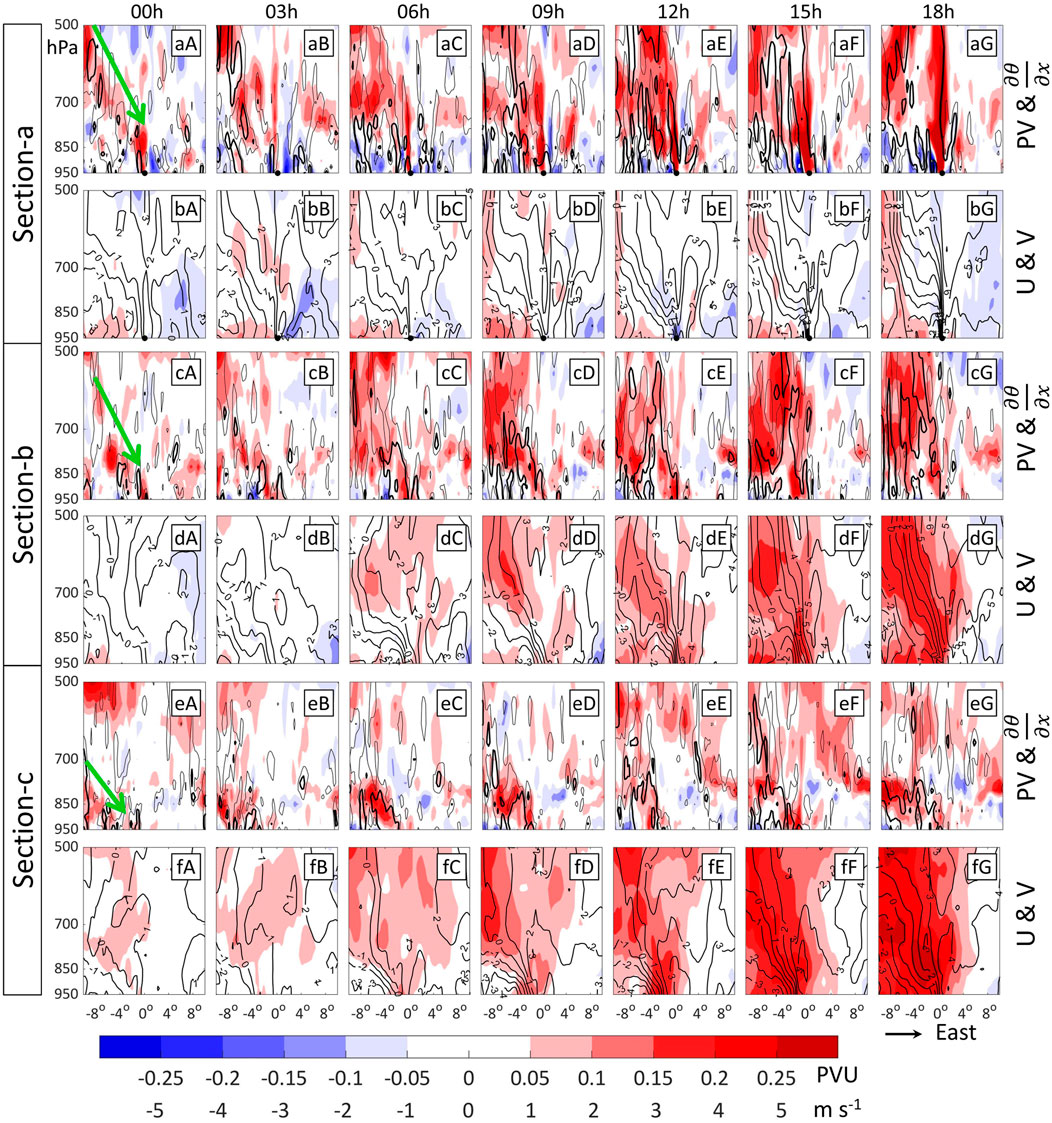
FIGURE 9. Difference in dynamic and thermal dynamic structures between ECs and OCs at the three zonal cross sections shown in Figure 8E during initial development. Each section connects the west and east boundaries of the 20°×20° box around cyclone centers. The first/third/fifth row shows differences in PV (shadings) and
The perspective of PV well explains the EC development. The initiation and deepening of a cyclone can be attributed to the enhancement of PV around the cyclone center, which is impacted by both adiabatic and diabatic processes. The adiabatic process is the key cause for the initial development of a higher PV for ECs. Compared to OCs, there is a stronger upstream perturbation within the low troposphere for ECs, which brings colder air mass. The invasion of colder air increases upstream static stability so that PV from higher levels is transported downward along steeper isentropic surfaces, leading to a stronger southeastward PV advection. Meanwhile, stronger stability in the west makes the stretching of the air parcel more significant while moving eastward so that the relative vorticity is enhanced with a larger ratio than PV. The stronger relative vorticity provides dynamic forcing for cyclogenesis and further enhances the cold advection. The diabatic process includes the sensible heat flux from the underlying surface and LHR by moist processes. The latter is closely related to the dynamic strength since a stronger warm conveyor belt leads to thicker clouds and stronger precipitation. The net diabatic PV modification is stronger for ECs resulting from stronger LHR. Its correlation coefficient with PV tendency is only ∼0.3, and the evident difference between ECs and OCs only starts after t=10 h, indicating that the diabatic effect is probably a by-product rather than the cause for the initial higher PV. The next section tries to prove the impact of the cold air mass based on numerical modeling, and compares it with other factors related to diabatic effects, such as background humidity and SST.
4 WRF numerical experiments
4.1 Case overview
A total of four EC cases (denoted by EC-2012, EC-2016, EC-2017, and EC-2018) were chosen to study with numerical modeling, whose initial moments and tracks are shown in Figure 3B. EC-2017 and EC-2016 are ranked as strong and weak ECs, respectively, and the others are medium ECs. All the cyclones were rapidly deepened while moving northeastward. They stayed over East Asia for less than 2 days, and their tracks are typical for winter cyclones in this region (Figure 3A). Figure 10 shows the synoptic backgrounds for all the cyclones during their explosive deepening. The patterns are similar. A deep upper-air trough occurred upstream (the first column in Figure 10). Strong low-level cold advection was produced by the large temperature gradient along the geostrophic wind (the second column in Figure 10). Strong high-pressure systems were in the west of the cyclones (the third column in Figure 10), which are related to the cold air masses. There was a hook-shaped cloud system accompanied by EC-2017 (Figure 10K), which is a result of the cooperation of cold air and the warm conveyor belt. The low-level cold advection is quite strong, producing heavy precipitation along the cold front and pushing the clouds southeastward. It also produced some low clouds (in the ellipse in Figure 10K) by enhancing the static instability near the sea surface. This feature is not shared by EC-2016 and EC-2018. The cold advections for these two cyclones are weaker, and widespread clouds occurred on both sides of the fronts (Figures 10G, O).
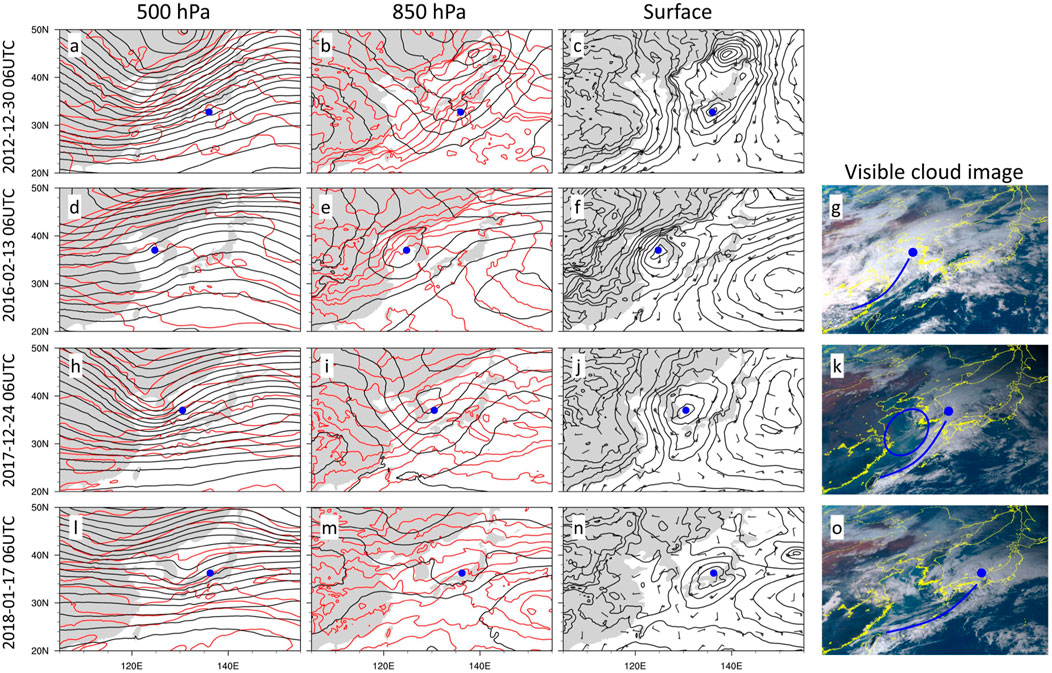
FIGURE 10. Synoptic backgrounds for the four ECs at their early stages. The first/second/third/fourth row shows the situation for EC-2012/2016/2017/2018. The time for each row is marked left. The first column shows GPH (black contours with interval of 40 gpm) and temperature (red contours with interval of 4°C) at 500 hPa. The second column is the same as the first column, except at 850 hPa. The third column shows the SLP (black contours with interval of 2.5 hPa) and surface wind (wind barbs). The fourth column shows the visible cloud images for the last 3 ECs. Blue dots locate the cyclone center, and blue lines in fourth column locate the cold fronts. The ellipse in (n) shows the clear sky area with sporadic low clouds left by cold advection.
Given the typicality of tracks and synoptic patterns of the four ECs, the modeling experiments for them can exhibit the common mechanisms for explosive cyclogenesis.
4.2 WRF modeling design
A series of numerical modeling experiments were conducted using the advanced research WRF model version 3.9.1. According to the cyclone tracks, the modeling domain occupies most of East Asia (Figure 3B) with 251×201 grid points and a horizontal grid of 0.2°. For each EC, the WRF modeling started at 0000 UTC on the same day it was initiated and lasted for 48 h. Other details of the model configuration are given in Table 1.
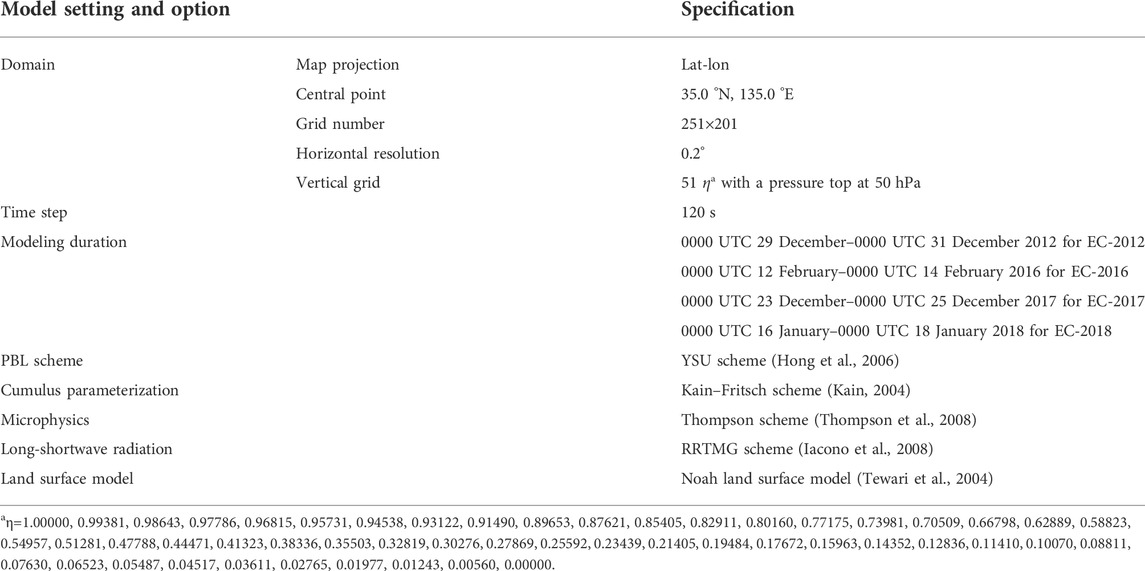
TABLE 1. Configuration for WRF model.
The initial and boundary conditions were derived from the ERA5 reanalysis. We conducted a group of control experiments (Exp-Ctrl) and five groups of sensitivity experiments (denoted by Exp-MT, Exp-MH, Exp-MH2, Exp-SST, and Exp-SST2). Other than Exp-Ctrl, each group weakened one process related to explosive cyclogenesis. Exp-MH (short for “modifying humidity”) and Exp-MH2 cut the background relative humidity by 10% and half. Exp-SST and Exp-SST2 decreased the global SST by 0.7 and 4°C, respectively. In Exp-MT (short for “modifying temperature”), the background temperature was increased by 4×(φ–30°)/20 K (φ is the latitude) between 500 hPa and 850 hPa at the north and west boundaries (located by the thick purple lines in Figure 3B).
To discuss the mechanisms for explosive cyclogenesis, Exp-MH, Exp-SST, and Exp-MT eliminated the advantage of ECs over OCs in a way. The decrease of water vapor/SST in Exp-MH/Exp-SST is close to the difference between ECs and OCs (Figures 4K, L). Exp-MT heated the cold air mass and decreased the temperature gradient by 4 K per 20 latitudes at the west boundary, which also weakened the low-level thermal contrast down to the OC level (Figure 8F). The modification which can change the ECs to OCs indicates the key cause for their explosive development. On the other hand, both Exp-MH2 and Exp-SST2 gave ideal scenarios. Exp-MH2 can show cyclogenesis under extremely dry conditions. In Exp-SST2, the sea surface is almost as cold as the land surface, which can show whether the cyclones could have gone through explosive deepening without sensible heating by the ocean.
4.3 Evaluation of the control run
Exp-Ctrl reasonably reproduces the development of the four ECs. As shown in Figure 3B, for each EC case, the cyclone track for Exp-Ctrl is similar to the reanalysis. The WRF model can capture the movement of EC-2018 along the west coast of Japan Island, and the model errors for EC-2012 are less than 50 km. Although the simulated cyclone center for EC-2017 is ∼200 km away from reanalysis, it is still a small error considering the scale of subtropical cyclones. The model also well reproduces the decrease of their central SLP and the enhancement of maximum wind speed (Figure 11). The model slightly underestimates/overestimates the central SLP for EC-2012/EC-2017, which does not influence the following discussion since the simulated deepening rates are quite close to reanalysis. The maximum wind speed is larger for Exp-Ctrl than for reanalysis. It is to be noted that the model resolution is higher than ERA5, and stronger winds for Exp-Ctrl are probably more realistic. Furthermore, we interpolated the SLP and surface wind speed for Exp-Ctrl into the ERA5 grid within the 20°×20° boxes around the cyclone centers to compare with the reanalysis. The root-mean-square error (RMSE) of SLP/wind speed is 1.74 h Pa/2.7 m s−1 averaged among all the ECs during the last 36 forecast hours, and the average bias is only 0.31 h Pa/0.96 m s−1. Given the good agreement between the WRF model and reanalysis, we can treat Exp-Ctrl as the true atmosphere.
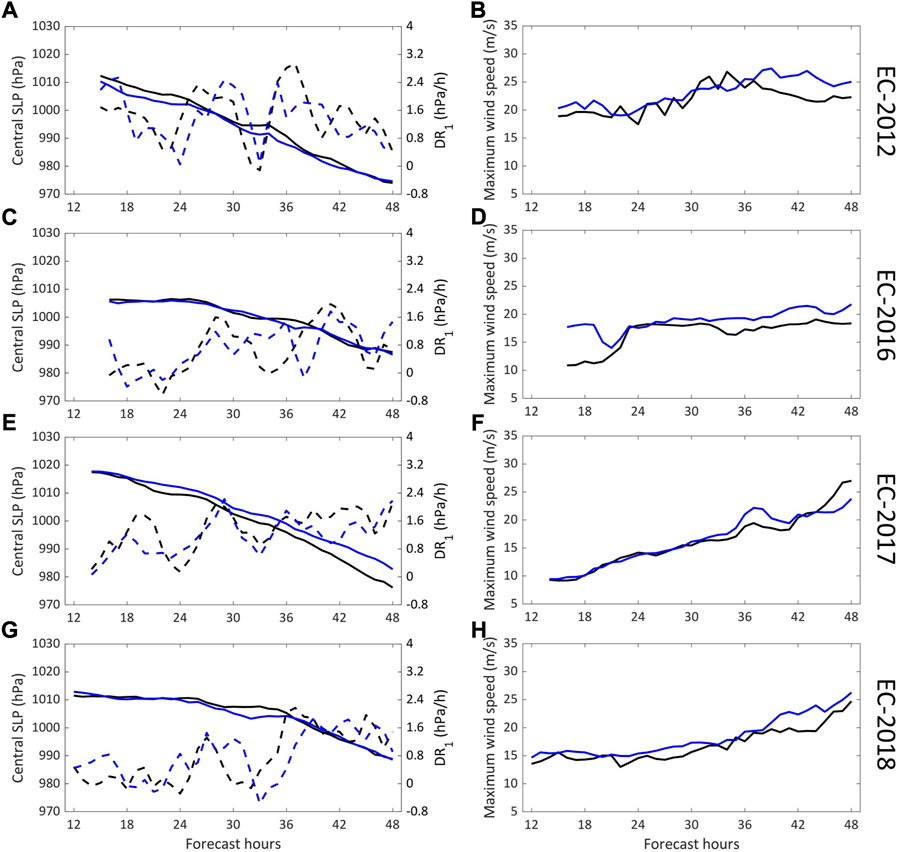
FIGURE 11. Comparison between the reanalysis and the model. The left column shows the time series of central SLP (solid lines) and hourly deepening rate (dashed lines) for the four ECs. The right column shows the time series of the maximum wind speed. Black and blue lines denote the ERA5 reanalysis and Exp-Ctrl, respectively. The EC number for each row is marked right.
4.4 Sensitivity experiments
Exp-MT and Exp-SST2 can significantly weaken the cyclones and stop them from explosive cyclogenesis, while the other sensitivity experiments make minor differences. Note that in this subsection, all the variables mentioned are averaged among all the four EC cases. As shown in Figure 12A, the average 24-h deepening rate is 1.17 hPa h−1 for Exp-Ctrl. Exp-MT/Exp-SST2 decreases it to 0.89/0.91 hPa h−1. The deepening rate for Exp-MH/Exp-MH2 is almost the same as that for Exp-Ctrl, while that for Exp-SST it is slightly lower. For Exp-Ctrl, the average central SLP is ∼1010 hPa at 16 h and decreases to ∼982 hPa at 48 h (Figure 12B). For Exp-MT/Exp-SST2, it is ∼1013/1011 hPa at 16 h and ∼994/990 hPa at 48 h, which is 12/8 hPa higher than that for Exp-Ctrl. Consistent with the strength of cyclones, the surface wind is also significantly weakened by these two groups (Figure 12C). Although the cyclones for Exp-SST2 are deeper than those for Exp-MT, its surface wind is weaker. It is because the modification in Exp-SST2 can directly change the near-surface convergence.
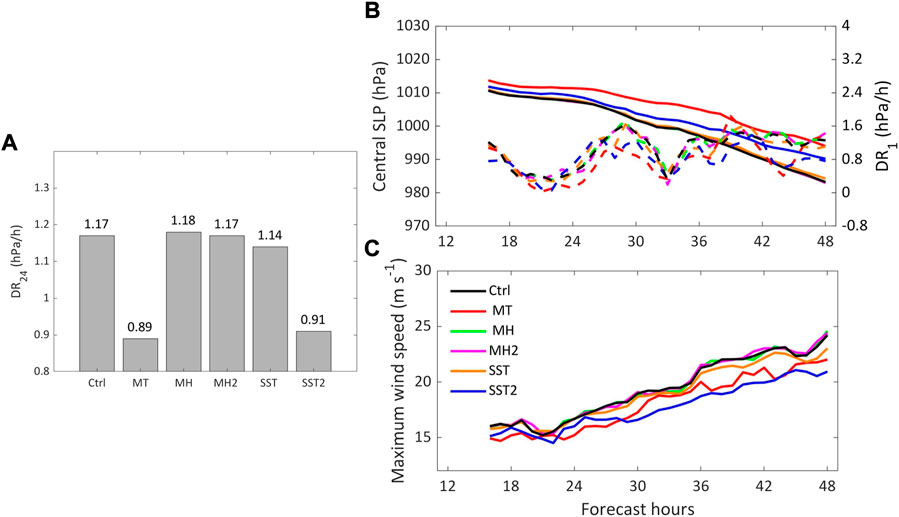
FIGURE 12. Simulated 24-h deepening rates (during the last 24 forecast hours) (A), time series of cyclone central SLPs (B), and maximum wind speeds (C) for six experiments. Solid and dashed curves in (B) represent the central SLPs and 1-h deepening rates, respectively. All variables are averaged among all the four ECs.
The strength of ECs is closely related to the PV structure. Figure 13 shows the difference in 24-h averaged PV and the potential temperature between Exp-Ctrl and Exp-MT. Along with the colder air mass, PV around cyclone centers for Exp-Ctrl is significantly larger than that for Exp-MT, and the positive difference mainly exists in the west. At 500 hPa, the west and north boundary meets the largest difference in >0.25 PVU. From 700 hPa down to 925 hPa, the area of the positive difference moves southward, which is close to the edge of the cold air mass. The difference in relative vorticity has a similar pattern to PV. At low levels, the relative vorticity around cyclone centers for Exp-Ctrl is ∼2×10⁻⁵ s−1 larger than that for Exp-MT (Figures 13B–D). As shown in Figures 13E,F, the PV transport across the west boundary for Exp-Ctrl is much larger than that for Exp-MT, which is consistent with its larger meridional gradient of air temperature. The largest difference locates at a line tilting northward with height.
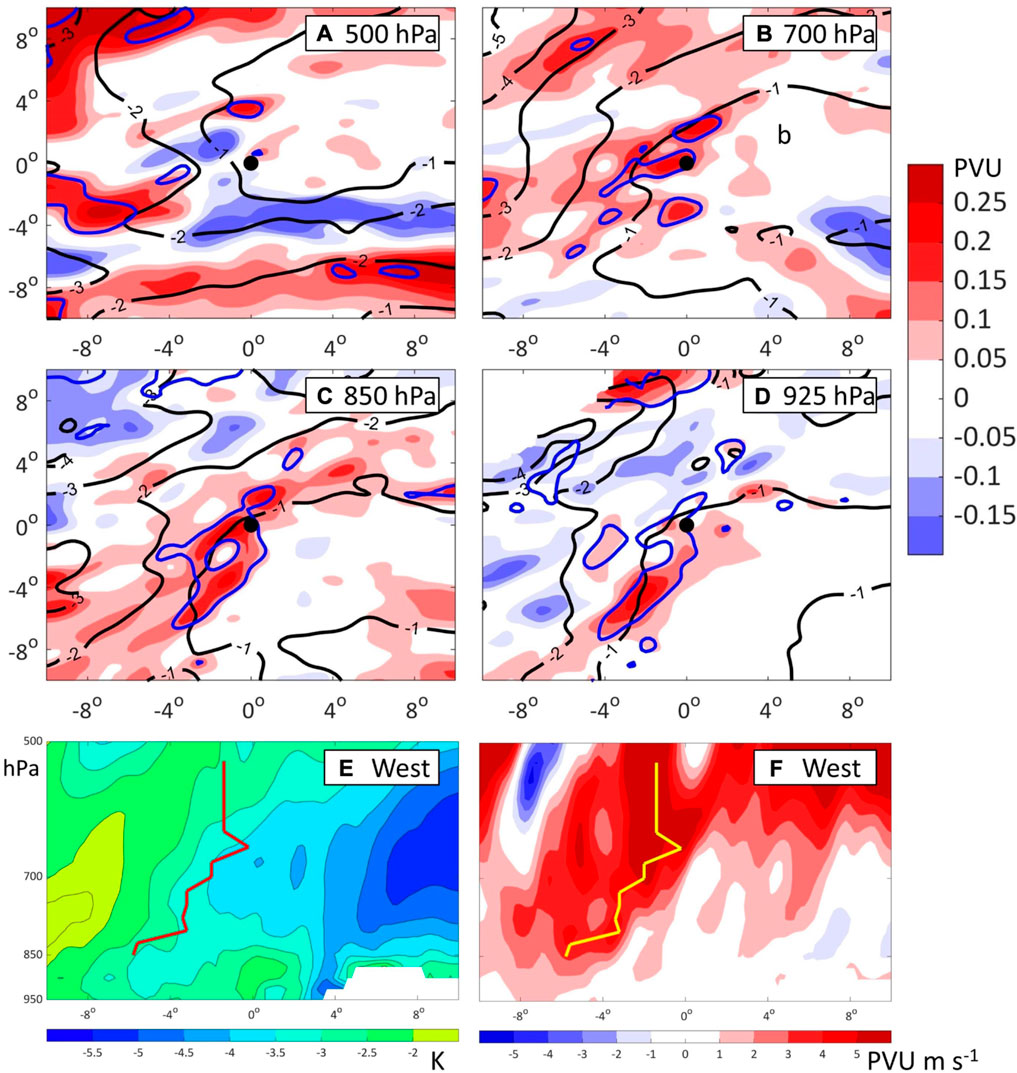
FIGURE 13. Differences in PV (shadings) and potential temperature (black contours; unit: K) between Exp-Ctrl and Exp-MT at different levels around the cyclone centers (A–D), as well as differences in potential temperature (E) and uPV (F) at the west boundary. Blue lines in (A–D) show the relative vorticity for Exp-Ctrl 2×10⁻⁵ s−1 larger than Exp-MT. Black dots in (A–D) locate the cyclone centers. The thick red line in (E) and yellow line in (F) locate the maximum of uPV at each level. Each variable is averaged among the four ECs during their first 24-h.
Comparing Figures 13E,F with Figures 8A,F, one can find that the differences in both the PV transport and temperature gradient between Exp-Ctrl and Exp-MT have similar patterns to those between ECs and OCs. By weakening the low-level meridional temperature gradient by 4 K per 20 latitudes, Exp-MT successfully weakens the upstream PV intrusion and changes the ECs to OCs. On the other hand, the warm sea surface is an important factor in the deepening of cyclones, which can be told from the performance of Exp-SST2. However, the difference in SST cannot distinguish ECs from OCs (cf., Exp-Ctrl and Exp-SST).
Many studies have proven that LHR is important for PV generation and explosive cyclogenesis. Heo et al. (2015) shut down the cumulus parameterization and diabatic heating in a microphysics scheme in the sensitive experiment, and showed that ∼50% of the low-level PV generation is contributed by LHR for an EC case. Interestingly, Exp-MH/Exp-MH2 cut the water vapor by 10/50% over the whole domain but can hardly decrease the deepening rate. As shown in Figure 14, the water vapor contents around cyclone centers for them are similar to those of Exp-Ctrl. The 24-h averaged precipitable water is abundant along the warm conveyor belt, and the gradient is large near the cold front. The decreases in Exp-MH and Exp-MH2 than in Exp-Ctrl are trivial, indicating a weak correlation between the background humidity and the humidity around cyclones. The transport of water vapor and thus the LHR are dominated by the dynamic strength of cyclones.
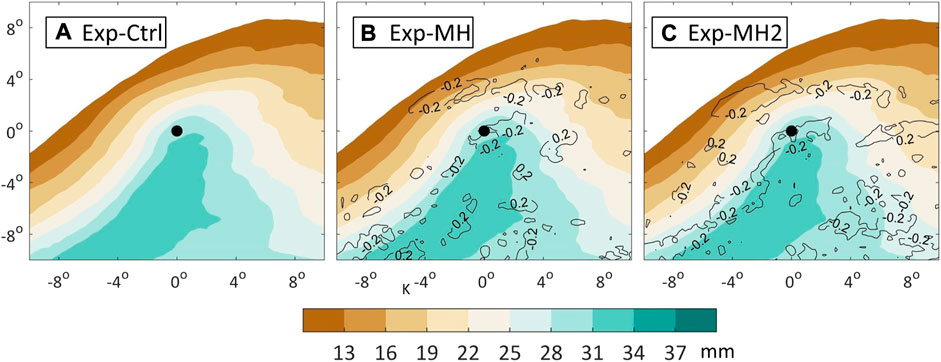
FIGURE 14. Precipitable water around cyclone centers for each modeling experiment. Contours in (B)/(C) denote the difference between Exp-MH/Exp-MH2 and Exp-Ctrl. Precipitable water is averaged among the four ECs during their first 24 h.
Results of the numerical experiments emphasize the important role of cold air mass on the intrusion of upper-level PV, which is fully consistent with statistical analysis. Background humidity has a weak impact. Although the warm sea surface is important in cyclogenesis, the difference in SST between ECs and OCs is too small to have significant impacts.
5 Conclusion
ECs frequently show up off the East Asian coast in winter and cause great casualties and property loss. To analyze the main reason for explosive cyclogenesis that makes ECs different from other cyclones, we compare the initial developments between ECs and OCs based on statistics.
Using the detection and tracking methods followed by Hart (2003), this study identifies 135 cyclones which form over East Asia for at least 24 h within 10 winters. More than half of them are ranked as ECs, and most of the initial explosive deepening occurs over sea. Detailed analyses are carried out to compare the synoptic backgrounds and changes in PV structures. The local PV tendency is decomposed to check the key factor in higher PV for ECs. The simulations of WRF numerical experiments on four typical winter ECs are quite consistent with the statistical analysis. The results show the following:
1) The PV intrusion plays a dominant role in changing the low-level PV for ECs. The correlation between PV tendency and the diabatic term is weak, indicating a similar impact of the diabatic process on both OCs and ECs. It is not the key cause of explosive cyclogenesis.
2) For ECs, the low-level cold advection is stronger. It increases upstream static stability so that stronger PV intrusion occurs along the steeper isentropic, which enhances the PV advection. Moreover, the stronger stability in the west makes the stretching of the air parcel more significant while moving eastward so that the relative vorticity is further enhanced.
3) Explosive cyclogenesis is not sensitive to the structure of water vapor content and LHR in the early stage. Conversely, the water vapor content and LHR are very dependent on the dynamic strength of the cyclone. Although LHR has an important impact on the mature stage of cyclones (e.g., Schemn and Wernli, 2014; Heo et al., 2015; Binder et al., 2016), it is a result rather than the cause of the initial development.
In addition to the consensus that diabatic processes play crucial roles in explosive cyclogenesis, we emphasize the importance of the cold advection (which is also associated with baroclinic instability) and quantitatively give the difference in the thermal structure that makes ECs different from OCs in this region. However, the relationship between diabatic processes and the thermal structure is complicated and still an open question, which will be discussed in our ongoing studies.
Data availability statement
The original contributions presented in the study are included in the article/Supplementary Material; further inquiries can be directed to the corresponding authors.
Author contributions
XG designed the research and performed the analysis. XG, PL, and SZ wrote the manuscript. GF revised the manuscript. All authors discussed the results and commented on the manuscript.
Funding
This research was jointly funded by the National Key Research and Development Program of China (Grant No. 2021YFC3101800) and the National Natural Science Foundation of China (41976200, 42005116 and 41905071).
Acknowledgments
We would like to thank the reviewers for their helpful comments and suggestions that improved the manuscript.
Conflict of interest
The authors declare that the research was conducted in the absence of any commercial or financial relationships that could be construed as a potential conflict of interest.
Publisher’s note
All claims expressed in this article are solely those of the authors and do not necessarily represent those of their affiliated organizations, or those of the publisher, the editors, and the reviewers. Any product that may be evaluated in this article, or claim that may be made by its manufacturer, is not guaranteed or endorsed by the publisher.
References
Ahmadi-Givi, F., Graig, G. C., and Plant, R. S. (2004). The dynamics of a midlatitude cyclone with very strong latent-heat release. Q. J. R. Meteorol. Soc. 130 (596), 295–323. doi:10.1256/qj.02.226
Binder, H., Boettcher, M., Joos, H., and Wernli, H. (2016). The role of warm conveyor belts for the intensification of extratropical cyclones in northern hemisphere winter. J. Atmos. Sci. 73 (10), 3997–4020. doi:10.1175/JAS-D-15-0302.1
Bosart, L. F., and Lin, S. C. (1984). A diagnostic analysis of the Presidents' Day storm of February 1979. Mon. Weather Rev. 112 (11), 2148–2177. doi:10.1175/1520-0493(1984)112<2148:ADAOTP>2.0.CO;2
Cammas, J. P., and Ramond, D. (1989). Analysis and diagnosis of the composition of ageostrophic circulations in jet-front systems. Mon. Weather Rev. 117 (11), 2447–2462. doi:10.1175/1520-0493(1989)117<2447:aadotc>2.0.co;2
Chen, S. J., Kuo, Y. H., Zhang, P. Z., and Bai, Q. F. (1992). Climatology of explosive cyclones off the East Asian coast. Mon. Weather Rev. 120 (12), 3029–3035. doi:10.1175/1520-0493(1992)120<3029:coecot>2.0.co;2
Cordeira, J. M., and Bosart, L. F. (2011). Cyclone interactions and evolutions during the “perfect storms” of late october and early november 1991. Mon. Weather Rev. 139 (6), 1683–1707. doi:10.1175/2010MWR3537.1
Davis, C. A., Stoelinga, M. T., and Kuo, Y. H. (1993). The integrated effect of condensation in numerical simulations of extratropical cyclogenesis. Mon. Weather Rev. 121 (8), 2309–2330. doi:10.1175/1520-0493(1993)121<2309:TIEOCI>2.0.CO;2
Fu, G., Sun, Y., Sun, J., and Li, P. (2020). A 38-year climatology of explosive cyclones over the northern hemisphere. Adv. Atmos. Sci. 37 (2), 143–159. doi:10.1007/s00376-019-9106-x
Gyakum, J. R., Anderson, J. R., Grumm, R. H., and Gruner, E. L. (1989). North pacific cold-season surface cyclone activity: 1975–1983. Mon. Weather Rev. 117 (6), 1141–1155. doi:10.1175/1520-0493(1989)117<1141:npcssc>2.0.co;2
Hart, R. E. (2003). A cyclone phase space derived from thermal wind and thermal asymmetry. Mon. Weather Rev. 131 (4), 585–616. doi:10.1175/1520-0493(2003)131<0585:ACPSDF>2.0.CO;2
Heo, K. Y., Seo, Y. W., Ha, K. J., Park, K. S., Kim, J., Choi, J. W., et al. (2015). Development mechanisms of an explosive cyclone over East sea on 3–4 April 2012. Dyn. Atmos. Oceans 70, 30–46. doi:10.1016/j.dynatmoce.2015.03.001
Hirata, H., Kawamura, R., Kato, M., and Shinoda, T. (2015). Influential role of moisture supply from the kuroshio/kuroshio extension in the rapid development of an extratropical cyclone. Mon. Weather Rev. 143 (10), 4126–4144. doi:10.1175/mwr-d-15-0016.1
Hong, S. Y., Noh, Y., and Dudhia, J. (2006). A new vertical diffusion package with an explicit treatment of entrainment processes. Mon. Weather Rev. 134 (9), 2318–2341. doi:10.1175/mwr3199.1
Hoskins, B. J., and Valdes, P. J. (1990). On the existence of storm-tracks. J. Atmos. Sci. 47 (15), 1854–1864. doi:10.1175/1520-0469(1990)0472.0.CO;2
Iacono, M. J., Delamere, J. S., Mlawer, E. J., Shephard, M. W., Clough, S. A., and Collins, W. D. (2008). Radiative forcing by long-lived greenhouse gases: Calculations with the AER radiative transfer models. J. Geophys. Res. 113, D13103. doi:10.1029/2008JD009944
Iwao, K., Inatsu, M., and Kimoto, M. (2012). Recent changes in explosively developing extratropical cyclones over the winter Northwestern Pacific. J. Clim. 25 (20), 7282–7296. doi:10.1175/JCLI-D-11-00373.1
Kain, J. S. (2004). The kain–fritsch convective parameterization: An update. J. Appl. Meteor. 43 (1), 170–181. doi:10.1175/1520-0450(2004)043<0170:tkcpau>2.0.co;2
Kuwano-Yoshida, A., and Asuma, Y. (2008). Numerical study of explosively developing extratropical cyclones in the Northwestern Pacific region. Mon. Weather Rev. 132 (2), 712–740. doi:10.1175/2007mwr2111.1
Kuwano-Yoshida, A., and Enomoto, T. (2013). Predictability of explosive cyclogenesis over the Northwestern Pacific region using ensemble reanalysis. Mon. Weather Rev. 141 (11), 3769–3785. doi:10.1175/MWR-D-12-00161.1
Lamb, H. H. (1991). Historic storms of the north sea, British isles and northwest europe. Cambridge: Cambridge University Press, 204.
Liberato, M. L., Pinto, J. G., Trigo, I. F., and Trigo, R. M. (2011). Klaus–an exceptional winter storm over northern Iberia and southern France. Weather 66 (12), 330–334. doi:10.1002/wea.755
Liberato, M. L. R., Pinto, J. G., Trigo, R. M., Ludwig, P., Ordóñez, P., Yuen, D., et al. (2013). Explosive development of winter storm xynthia over the subtropical north atlantic ocean. Nat. Hazards Earth Syst. Sci. 13 (9), 2239–2251. doi:10.5194/nhess-13-2239-2013
Lim, E. P., and Simmonds, I. (2002). Explosive cyclone development in the southern hemisphere and a comparison with northern hemisphere events. Mon. Weather Rev. 130 (9), 2188–2209. doi:10.1175/1520-0493(2002)130<2188:ecdits>2.0.co;2
Manobianco, J. (1989). Explosive East Coast cyclogenesis over the west-central north atlantic ocean: A composite study derived from ECMWF operational analyses. Mon. Weather Rev. 117 (11), 2365–2383. doi:10.1175/1520-0493(1989)117<2365:eeccot>2.0.co;2
Nakamura, H. (1993). Horizontal divergence associated with zonally isolated jet streams. J. Atmos. Sci. 50 (14), 2310–2313. doi:10.1175/1520-0469(1993)050<2310:hdawzi>2.0.co;2
Reader, M. C., and Moore, G. K. (1995). Stratosphere-troposphere interactions associated with a case of explosive cyclogenesis in the Labrador Sea. Tellus A 47 (5), 849–863. doi:10.1034/j.1600-0870.1995.00124.x
Roebber, P. J. (1984). Statistical analysis and updated climatology of explosive cyclones. Mon. Weather Rev. 112 (8), 1577–1589. doi:10.1175/1520-0493(1984)112<1577:saauco>2.0.co;2
Sanders, F., and Gyakum, J. R. (1980). Synoptic-dynamic climatology of the “bomb”. Mon. Weather Rev. 108 (10), 1589–1606. doi:10.1175/1520-0493(1980)108<1589:sdcot>2.0.co;2
Sanders, F. (1986). Explosive cyclogenesis in the west-central North Atlantic Ocean, 1981-84. Part I: Composite structure and mean behavior. Mon. Weather Rev. 114 (10), 1781–1794. doi:10.1175/1520-0493(1986)114<1781:ecitwc>2.0.co;2
Schemm, S., and Wernli, H. (2014). The Linkage between the warm and the cold conveyor belts in an idealized extratropical cyclone. J. Atmos. Sci. 71 (4), 1443–1459. doi:10.1175/JAS-D-13-0177.1
Seiler, C., and Zwiers, F. W. (2016). How will climate change affect explosive cyclones in the extratropics of the Northern Hemisphere?. Clim. Dyn. 46, 3633–3644. doi:10.1007/s00382-015-2791-y
Shapiro, M. A., and Keyser, D. (1990). “Fronts, jet streams and the tropopause,” Extratropical cyclones. Editors C. W. Newton, and E. O. Holopainen (Boston, MA: American Meteorological Society), 167–191
Taguchi, B., Nakamura, H., Nonaka, M., and Xie, S. P. (2009). Influences of the Kuroshio/Oyashio extensions on air-sea heat exchanges and storm-track activity as revealed in regional atmospheric model simulations for the 2003/04 cold season. J. Clim. 22 (24), 6536–6560. doi:10.1175/2009JCLI2910.1
Tewari, M., Chen, F., Wang, W., Dudhia, J., LeMone, M. A., Mitchell, K., et al. (2004). “Implementation and verification of the unified NOAH land surface model in the WRF model,“ in 20th conference on weather analysis and forecasting/16th conference on numerical weather prediction, 11–15
Thompson, G., Field, P. R., Rasmussen, R. M., and Hall, W. D. (2008). Explicit forecasts of winter precipitation using an improved bulk microphysics scheme. Part II: Implementation of a new snow parameterization. Mon. Wea. Rev. 136, 5095–5115. doi:10.1175/2008MWR2387.1
Uccellini, L. W., and Kocin, P. J. (1987). The interaction of jet streak circulations during heavy snow events along the east coast of the United States. Weather Forecast. 2 (4), 289–308. doi:10.1175/1520-0434(1987)002<0289:tiojsc>2.0.co;2
Wash, C. H., Hale, R. A., Dobos, P. H., and Wright, E. J. (1992). Study of explosive and nonexplosive cyclogenesis during FGGE. Mon. Weather Rev. 120 (1), 40–51. doi:10.1175/1520-0493(1992)120<0040:soeanc>2.0.co;2
Wash, C. H., Peak, J. E., Calland, W. E., and Cook, W. A. (1988). Diagnostic study of explosive cyclogenesis during FGGE. Mon. Weather Rev. 116 (2), 431–451. doi:10.1175/1520-0493(1988)116<0431:dsoecd>2.0.co;2
Yoshida, A., and Asuma, Y. (2004). Structures and environment of explosively developing extratropical cyclones in the northwestern Pacific region. Mon. Weather Rev. 132 (5), 1121–1142. doi:10.1175/1520-0493(2004)132<1121:saeoed>2.0.co;2
Zhang, S., Fu, G., Lu, C., and Liu, J. W. (2017). Characteristics of explosive cyclones over the northern pacific. J. Appl. Meteorol. Climatol. 56 (12), 3187–3210. doi:10.1175/JAMC-D-16-0330.1
Zhang, S., and Fu, G. (2018). Structures and evolutions of explosive cyclones over the northwestern and northeastern pacific. J. Ocean. Univ. China 17, 581–593. doi:10.1007/s11802-018-3418-9
Keywords: explosive cyclone, East Asian coast, potential vorticity, baroclinic instability, diabatic heating
Citation: Gao X, Lu P, Zhang S, Hu Y, Fu G, Sun X and Zhang Q (2022) A comparative study on initial developments between explosive and nonexplosive cyclones off the East Asian coast in winter. Front. Earth Sci. 10:968736. doi: 10.3389/feart.2022.968736
Received: 14 June 2022; Accepted: 09 September 2022;
Published: 30 September 2022.
Edited by:
Guihua Wang, Fudan University, ChinaReviewed by:
Chenghai Wang, Lanzhou University, ChinaMichelle Simoes Reboita, Federal University of Itajubá, Brazil
Copyright © 2022 Gao, Lu, Zhang, Hu, Fu, Sun and Zhang. This is an open-access article distributed under the terms of the Creative Commons Attribution License (CC BY). The use, distribution or reproduction in other forums is permitted, provided the original author(s) and the copyright owner(s) are credited and that the original publication in this journal is cited, in accordance with accepted academic practice. No use, distribution or reproduction is permitted which does not comply with these terms.
*Correspondence: Ping Lu, bHVwaW5nQG1haWwudHNpbmdodWEuZWR1LmNu; Shuqin Zhang, emhhbmdzaHVxaW4xMjM0QDEyNi5jb20=