- Seismological Bureau of the Ningxia Hui Autonomous Region, Yinchuan, China
In 2014, aquifers in the provinces of Jiangsu and Anhui exhibited abnormal and quasi-synchronous increases in water level of unknown origin. Based on the related theories of fluid and rock mechanics, and using atmospheric pressure and tidal effects, we analyzed the changes in the porosity and hydraulic conductivity of the aquifer media for three wells in Jiangsu (Su02, Su03, and Su18) and one well in Anhui (Dingyuan 04) in the undrained state. By constructing a dynamic change model of the well–aquifer system in two states (force and water balance), the hydrodynamic mechanism of the quasi-synchronous rise in the water level in each well was explored. The results show that the rise in the well water level was not related to aquifer compression but was mainly due to an increase in recharge and the recharge exceeding the discharge. These findings indicate that recharge caused by the infiltration of rainwater was the mechanism behind the observed anomaly.
Introduction
Atmospheric pressure, the tidal effects of wells, and aquifer parameters (i.e., porosity and hydraulic conductivity) have received significant attention in research in China and abroad (Bredehoeft, 1967; George and Edwin, 1979; Kamp and Gale, 1983; Narasinmhan et al., 1984; Tian and Gu, 1985; Rojstaczer, 1988; Zhang et al., 1989; Li et al., 1990; Erskine, 1991; John et al., 1991; Zhang et al., 1995; Lai et al., 2013). In the undrained state, in which there is no exchange of water in the well–aquifer system and no change in mass, any changes in pore fluid pressures are caused by stress and strain. As such, the tidal factor and coefficient of atmospheric pressure can be used to quantitatively obtain the porosity, the volumetric compressibility coefficient of a solid framework and water, and other corresponding aquifer parameters, including the hydraulic conductivity and specific storage.
Before a large earthquake, regional stress loading and unloading may cause the closing and opening of fractures in the fault zone, resulting in simultaneous changes in multiple fluids. In addition, the comprehensive effects of the focal stress field, regional stress field, and other environmental factors are common causes of precursory anomalies, including those of underground fluids, among others. This indicates that the study on the characteristics and mechanisms of synchronous rises in the well water level can reveal the internal genetic relationship between abnormal changes in underground fluids and crustal tectonic deformation, changes in hydrodynamic and chemical dynamic conditions, and the process of earthquake preparation.
Su02, Su03, Su18, and Dingyuan wells are located in East China, which is the most developed and rapidly growing region in China. Moreover, this region hosts the central and southern sections of the Tan Lu fault zone and its vicinity. In the second half of 2014, the water levels of wells Su04, Su03, and Su18 in Jiangsu, and well Dingyuan04 in Anhui rose abnormally, showing quasi-synchronous characteristics (Figure 1). Based on the digital water levels and atmospheric pressures of these four wells, and on the related theories of fluid and rock mechanics, we established a dynamic change model of the well–aquifer system under two conditions—force and water balance—to determine the changes in aquifer parameters (e.g., porosity and hydraulic conductivity) of each well. Additionally, we analyzed the hydrodynamic mechanism behind the anomaly to eliminate the influence of non-structural factors and clarify if the observed changes were reflective of seismic activity.
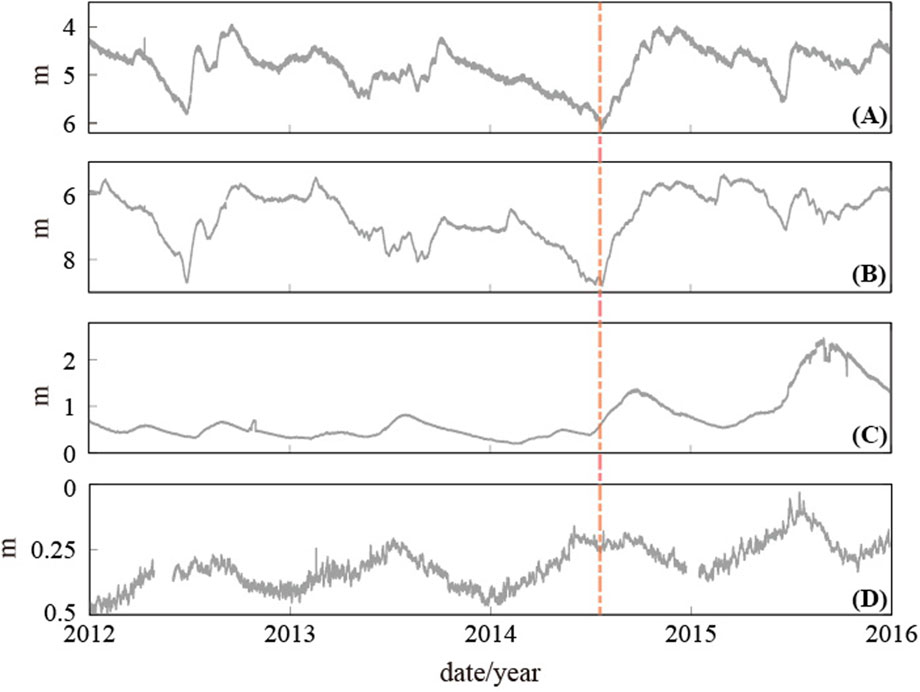
FIGURE 1. Water levels in the four studied wells over time. Burial depths of the water levels in wells (A) Su02 (B) Su03, and (D) Dingyuan04 (C) Change in the water head height of well Su18. The orange dashed line marks the onset of quasi-synchronous changes in the water level.
Data and methods
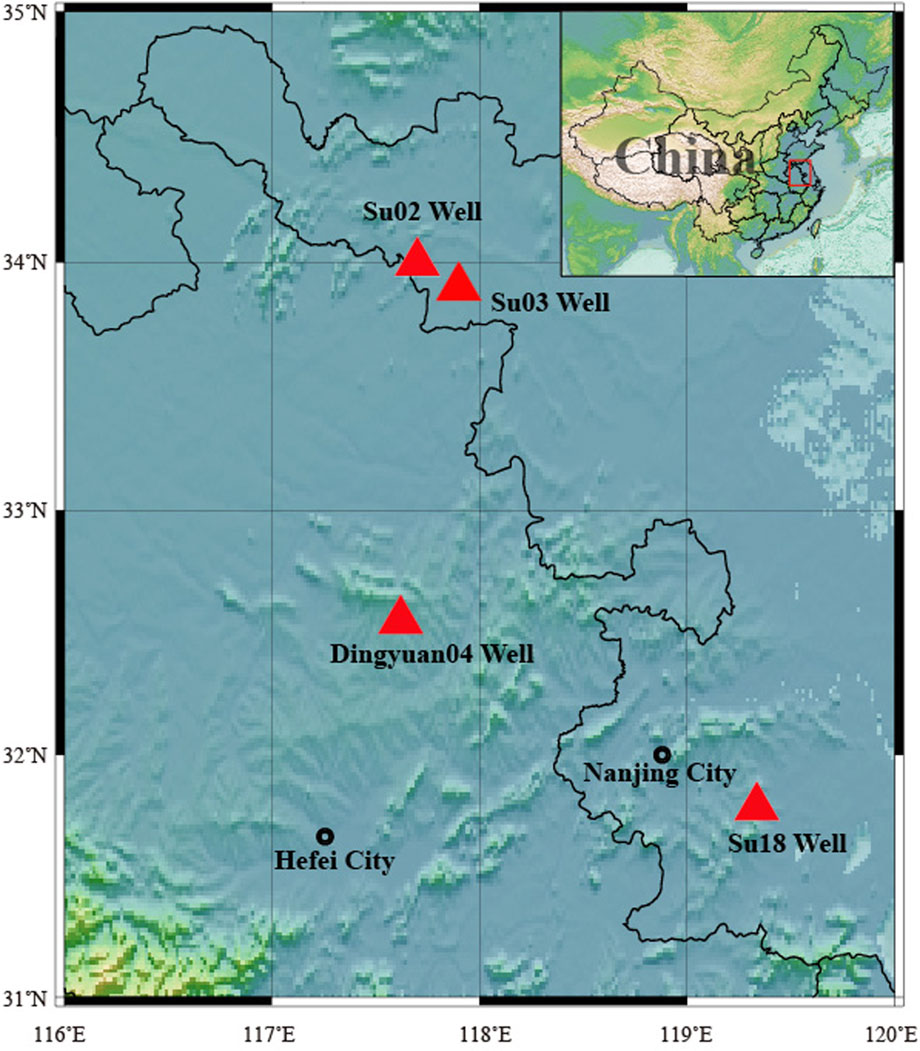
The four wells studied here, Su02, Su03, Su18, and Dingyuan04, have been operational for many years and therefore provide continuous and stable data and clear tidal patterns. Complete atmospheric pressure data since January 2012 are available, making them ideal observation wells for digital water level analysis. The spatial distribution and specific parameters of each well are shown in Figure 2 and Table 1, respectively. A pressure-type water level meter was used to observe the water level depth values in the wells; that is, a pressure sensor was used to detect changes in the water column pressure in the well holes, which were subsequently automatically converted into water level depth values. The reading accuracy was at the millimeter level. Sampling was performed hourly. We prepared digital observation data of the water levels and hourly air pressure values from the four wells and filled in missing data by combining cubic spline interpolations and general polynomial piecewise fitting values. We also calculated the theoretical hourly solid Earth tide values at each well site. Finally, we compiled a Microsoft Excel file for each well site that contained the following data: time (equal-interval hourly values), water level, air pressure, and theoretical solid Earth tide. Note that the water level must be converted from the buried depth value to the hydraulic head height value, in meters.
Convolution regression method
Convolutional regression methods that take into consideration the nonlinear relationship between the water level and atmospheric pressure, as well as the lag time, have been widely used in air pressure corrections in recent years (Rasmussen and Crawford, 1997; Toll and Rasmussen, 2007; Darner and Sheets, 2012; Hussein et al., 2013; Yang et al., 2014). For example, the maximum lag time was set to 7 h for air pressure correction only, and 12 h for air pressure and solid tide correction simultaneously. Using convolution regression, without considering other factors (such as recharge and discharge), the variation in the well water level can be expressed as:
where i is the lag time, m is the selected maximum lag time, △W(t) is the water level change at time t, α(i) is the unit impulse response function of air pressure at time delay i, △B(t-i) is the change in air pressure at time t-i, β(i) is the response coefficient of the Earth tide, and △ET(t-i) is the change of the Earth tide at time t-i. The water level after barometric correction can be expressed as:
where Wt* is the correction amount of each water level observation value in m-n time, m is the selected maximum lag time, n is the number of observation data, and αm is the pressure unit impulse response function corresponding to the maximum lag time.
The core idea behind such methods is to introduce a step response function for well water levels to atmospheric pressure, use water level and atmospheric pressure data to obtain the best fitted value of the function, and then correct the water level using said function. If a solid tidal factor, which is usually replaced by sensor measurements or a theoretical solid tide, is considered, convolutional regressions can simultaneously correct the atmospheric pressure and solid tide in the water level data of observation wells.
Atmospheric pressure and tidal factor
The factors affecting water level were decomposed into four sub-categories—atmospheric pressure, tide, a trend component, and a random component—allowing the tidal component to be eliminated using convolutional regression. Then, the trend and random components were removed using general polynomial piecewise fitting, leaving atmospheric pressure as the only factor affecting the remaining water level. Atmospheric pressure data with clear trends required advanced linear detrending. Finally, the remaining water level (i.e., that with atmospheric pressure as the only effect term) and the corrected atmospheric pressure were used to obtain the atmospheric pressure coefficient using the difference method. In general, first-order differences were sufficient.
To obtain the tidal factor, the convolution regression method was first used to remove the atmospheric pressure component (atmospheric pressure correction) from the well water level, and then, general polynomial piecewise fitting was used to remove the trend and random components until the remaining water level had tides as the only effect term. Finally, the Venedikov harmonic analysis program (Venedikov et al., 2005) was used to obtain the tidal factor and other parameters of the wave with the largest amplitude in the remaining water level.
Porosity and hydraulic conductivity
Based on the results of previous studies (Bredehoeft, 1967; Zhang et al., 1989; Li et al., 1990), the atmospheric pressure coefficient of the water level, Bp, and the tidal factor, Bg, can be expressed as:
From Equations 3, 4, the following can be obtained:
where α is the volumetric compressibility coefficient of the solid frame, β is that of water, n is the porosity of the aquifer, ρ is the density of water, and g is the gravitational acceleration, making the product of ρ and g the unit weight of water, which is 0.098 hpa/mm. The specific storage, SS, can be calculated using Equation 6 (Davis and Dewiest, 1966). The hydraulic conductivity, K, tidal wave frequency, ω, pressure conductivity coefficient of the aquifer, a, and phase lag, φ, satisfy the relationships in Equations 7)–(9 (Li et al., 1990).
In equation 7, T is the transmissivity coefficient, k0 is the real part of the Kelvin function, r0 is the radius of the well, and ω is the fixed frequency of a specific group of waves in the tidal wave (such as the M2 wave for which
The hydraulic conductivity, K, is therefore:
Rainfall water level dynamic combined water tank model
There are two common ways in which rainfall influences water level observation. One is direct recharge; that is, precipitation during the rainy season causes the well water levels to rise synchronously. The other is delayed recharge; that is, the rise in the well water level lags behind atmospheric precipitation for a period of time. In view of this, Wang et al. (2010) proposed a combined water tank model of rainfall water level dynamics that analyzes the impact of precipitation on the dynamic change in the water level by comparing the fitted value of the water level with the measured value. The model uses the density function based on the Gamma distribution Γ(β) and establishes a unit impulse response function γ(τ) to deal with the lag delay effect of groundwater recharge. The mathematical expression is as follows:
where t0 is a time factor, β is a dimensionless constant, and γ(τ) indicates that a single precipitation occurs at τ supply intensity formed at any time. Continuous or intermittent precipitation recharge can be expressed by the superposition of the above unit impulse response function:
where Pe(t) is the effective precipitation that can form the recharge intensity at time t, Tjq reflects the ability of the well–aquifer system to obtain the direct infiltration recharge of precipitation, and Tiq reflects the ability of the well–aquifer system to obtain the lateral recharge. The model uses Equation 14 to calculate the cumulative recharge intensity R formed by the precipitation at a certain time and before, and then, the water level value at the next time can be predicted by:
where H is the water level value, subscript n represents the current time, n+1 represents the next time, and Rn is the cumulative recharge intensity generated by precipitation until time n. Parameter z0 is the height of the discharge datum, and Th reflects the water storage capacity of the well–aquifer system.
When using precipitation data to predict water level changes, the model first uses precipitation and water level data in the normal dynamic change period to calculate z0, β, t0, Th, Tiq, and Tjq.
Results and discussion
Water level amplitude spectra characteristics of each well
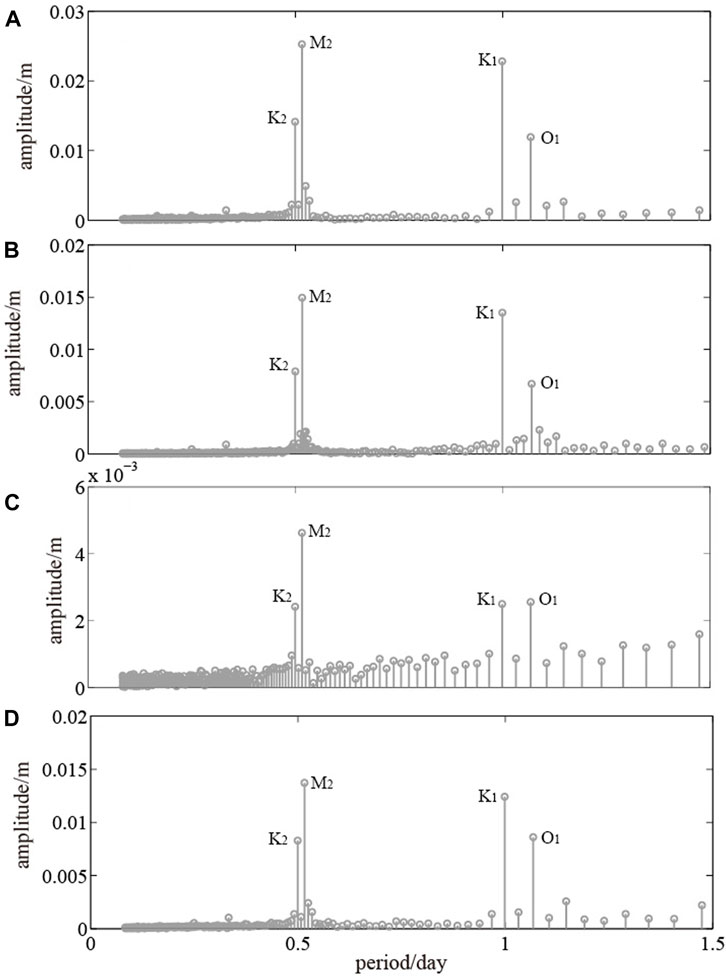
The tidal variation of the well water level is periodic. In different periodic waves, the main components are five diurnal waves (O1, K1, P1, Q1, J1) and five half diurnal waves (M2, N2, L2, S2, K2). We performed an amplitude spectrum analysis of the water level of each well since the start of digital observations in 2012 and found that tide-driven changes in the water level in the four wells were mainly in the M2, K2, O1, and K1 waves, among which the M2 wave had the largest amplitude, as shown in Figure 3. Therefore, Venedikov harmonic analysis was used to obtain the tidal factor of the M2 wave for all four wells.
Atmospheric pressure coefficient and tidal factor
1) Using the residual water level (the water level with only the barometric effect term) and the barometric pressure, we obtained the barometric coefficient with first-order difference (Figure 4, left). The barometric coefficient of well Su02 was the largest (the average value was close to 10 mm/hpa), followed by well Su03, while that of Su18 was the smallest (the average value was approximately 1.1 mm/hpa). (2) Using the remaining water level (the water level with only the tidal response term) to obtain the M2 wave tidal factor of each well through the Venidikov harmonic analysis program (Figure 4, right) indicated that the tidal effect of well Su02 was the highest, with an average of approximately 2.0 mm/10−9. The average tidal effect of well Su03 was approximately 1.07 mm/10−9, while those of wells Su18 and Dingyuan04 were relatively small (average value of approximately 0.2 mm/10−9).
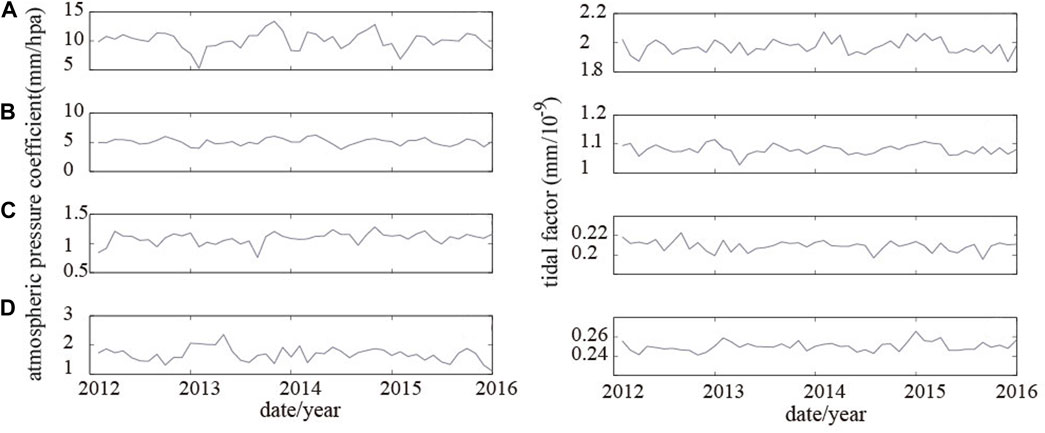
FIGURE 4. Atmospheric pressure coefficient and tidal factor. Note: the atmospheric pressure coefficient is shown on the left for (A) Su02 (B) Su03, (C) Su18, and (D) Dingyuan04. The tidal factor for (A) Su02 (B) Su03, (C) Su18, and (D) Dingyuan04 is shown on the right.
Porosity and hydraulic conductivity characteristics of each well
Figures 5, 6 show the porosity and hydraulic conductivity, respectively, of wells Su02, Su03, Su18, and Dingyuan04 since 2011. The window length for calculation was 48 months from 2012 to 2015, with a step length of 1 month. The porosity and hydraulic conductivity of each well increased simultaneously from the second half of 2014 to the beginning of 2015, while this phenomenon was not prominent in other periods. This result corresponds well with the observation that the water level began to rise in each well at nearly the same time during the second half of 2014. Since the second half of 2015, changes in the porosity and hydraulic conductivity of each well had returned to a relatively steady state.

FIGURE 5. Monthly time series of (A,C) porosity and (B,D) hydraulic conductivity for wells (left) Su02 and (right) Su03.

FIGURE 6. Monthly time series of (A,C) porosity and (B,D) hydraulic conductivity for wells (left) Su18 and (right) Dingyuan04.
Hydrodynamic mechanism
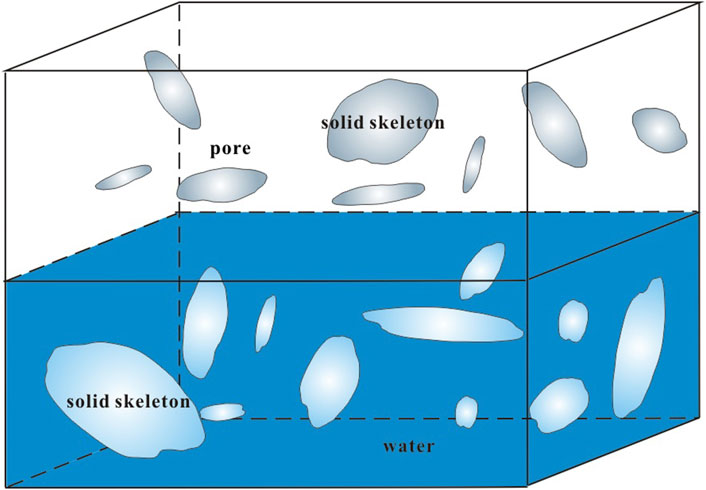
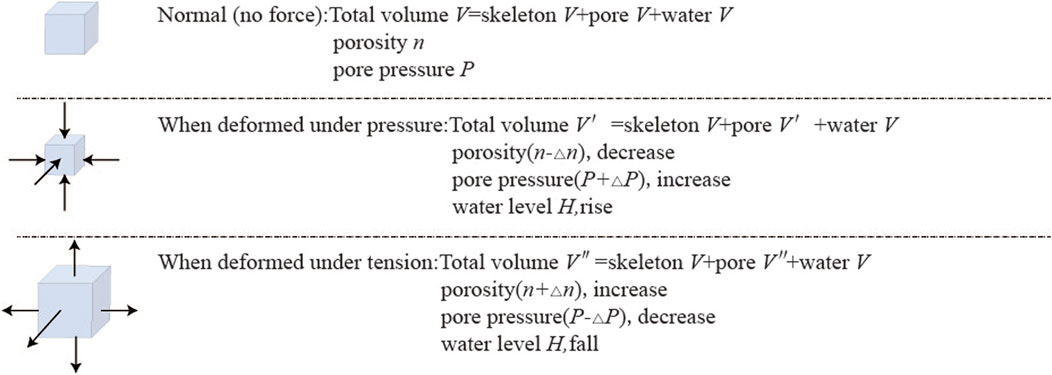
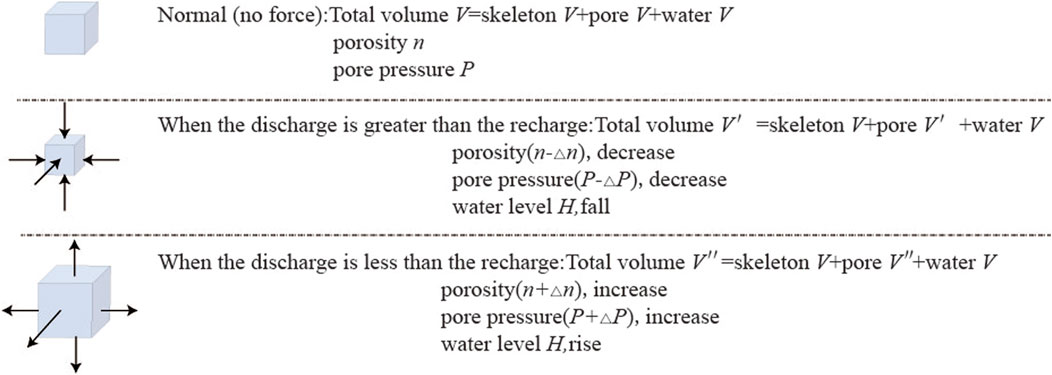
To explain the quasi-synchronous water level rise in the wells since the second half of 2014, we constructed a hydrodynamic model that analyzed the mechanism underlying such water level rises with respect to changes in stress (tension and compression) and environmental interference (ground water extraction and replenishment). In the natural state, the aquifer medium is formed by the coupling of solids, liquids, and gases. The volume of the aquifer medium is divided into four types—total or apparent volume, rock skeletal volume, pore volume, and water volume—where the total apparent volume is equal to the sum of the other three volumes, as shown in Figure 7. With changes in groundwater dynamics caused by an altered stress state in the aquifer (Figure 8), the aquifer medium deforms under pressure and porosity decreases, pore pressure increases, and well water levels appear to rise. In contrast, when the aquifer medium deforms under tension, porosity increases, pore pressure decreases, and well water levels appear to fall. Meanwhile, with changes in groundwater dynamics caused by changes in the water balance of the aquifer medium (Figure 9), porosity decreases and the decline in the water level is related to the outflow (i.e., discharge exceeds recharge and recharge decreases) and pore pressure decreases. Conversely, when porosity increases, the water level rise is related to external water flowing into the well bore (i.e., recharge exceeds discharge and recharge increases) and pore pressure increases.
From the second half of 2014 to the beginning of 2015, wells Su02, Su03, Su18, and Dingyuan04 experienced a quasi-synchronous rise in the water level as well as a synchronous increase in their porosity and hydraulic conductivity. Here, we assumed that the change in the water balance in the aquifer medium caused by recharge and discharge is an instantaneous response. The aquifer medium of each well is a linear, homogeneous, and isotropic elastomer, and the water in the well is an ideal fluid. When the pore pressure caused by recharge increases, the porosity also increases and the well water level rises. On the contrary, when the pore pressure caused by drainage decreases, the porosity also decreases and the well water level drops. The observed increase in the porosity and hydraulic conductivity provided more favorable conditions for shallow groundwater in the region, such that when porosity increased, the rise in the water level was related to the recharge exceeding the discharge, and to the increase in recharge. In reality, the factors affecting porosity and hydraulic conductivity are complex. Owing to the lack of data on structure, sedimentation, hydrodynamic force, and geochemistry, a more comprehensive and in-depth analysis could not be carried out. Further validation using more detailed information and more in-depth research are needed in the future.
Rainfall influences the well water level mainly through lateral runoff recharge, cross layer recharge, and the load effect. For the load effect, there is almost no time lag. When collecting rainfall causes a flood, the well water level rises, and when the water level drops, the well water level decreases. Based on Figures 10, 11, there was almost no rainfall load effect for the four wells. However, lateral runoff recharge and cross layer recharge were well perceivable; the water level of the four wells had a lag response to rainfall between 2 and 3 months.

FIGURE 10. Comparison between the fitted values of the well water level obtained using the combined water tank model of rainfall water level dynamics and the measured values in wells (A) Su02 and (B) Su03. Note: rainfall (monthly, gray; annual, light purple), measured values (black curve), fitted values (gray dashed).

FIGURE 11. Comparison between the fitted values of the well water level obtained using the combined water tank model of rainfall water level dynamics and the measured values in wells (A) Su18 and (B) Dingyuan04. Note: rainfall (monthly, gray; annual, purple), measured values (black curve), the fitted values (gray dashed).
Figures 10, 11 show the combined water tank model based on rainfall water level dynamics. The monthly dynamic changes in the water levels of the four wells were inverted by using the monthly value of regional precipitation. Z0, β, t0, Th, Tiq, and Tjq values were calculated using precipitation and water level data collected during the normal dynamic change of each well (Table 2). Through comparative analysis of the fit and the measured values, we found that rainfall infiltration supply directly influenced the rise in the water level and the synchronous increase in porosity and hydraulic conductivity coefficients in the studied period.
Conclusion
In general, amplitude spectral analysis of well water levels is used to determine which group of tidal waves to select to calculate tidal (e.g., tidal factor and phase lag) and aquifer (e.g., porosity and hydraulic conductivity) parameters. Our analysis of the water levels of wells Su02, Su03, Su18, and Dingyuan04 indicates that among the main groups of waves included M2, K2, O1, and K1, in which M2 waves had the largest amplitude. Thus, all tidal and aquifer parameters in this study were calculated for M2 waves.
The porosity and hydraulic conductivity of each well increased from the second half of 2014 to the beginning of 2015, a finding that was consistent with the quasi-synchronous water level rise in each well in the second half of 2014. The established groundwater dynamics model based on changes in the aquifer water balance explained this phenomenon well. Based on the combined water tank model of rainfall water level dynamics, the monthly dynamic changes in the water levels of the four wells were inverted using monthly regional precipitation values. Through a comparative analysis of the fit and measured values, we found that rainfall infiltration supply was directly responsible for the synchronous increases in the water level, porosity, and hydraulic conductivity in the studied period.
Data availability statement
The raw data supporting the conclusions of this article will be made available by the authors, without undue reservation.
Author contributions
All authors listed have made a substantial, direct, and intellectual contribution to the work and approved it for publication.
Funding
This work was supported by the Earthquake Science and Technology Spark Plan Project (XH19048) and the Ningxia Natural Science Foundation Project (2020AAC03438).
Acknowledgments
We are very thankful for the guidance and help of Yongtai Che of the Institute of Geology, China Earthquake Administration, and Yaowei Liu of the National Academy of Natural Disaster Prevention and Control, Ministry of Emergency Management.
Conflict of interest
The authors declare that the research was conducted in the absence of any commercial or financial relationships that could be construed as a potential conflict of interest.
Publisher’s note
All claims expressed in this article are solely those of the authors and do not necessarily represent those of their affiliated organizations, or those of the publisher, the editors and the reviewers. Any product that may be evaluated in this article, or claim that may be made by its manufacturer, is not guaranteed or endorsed by the publisher.
References
Bredehoeft, J. D. (1967). Response of well-aquifer systems to earth tides. J. Geophys. Res. 72 (12), 3075–3087. doi:10.1029/JZ072i012p03075
Darner, R. A., and Sheets, R. A. (2012). Using existing data to estimate aquifer properties, Great Lakes Region, USA. Ground Water 50 (3), 477–484. doi:10.1111/j.1745-6584.2011.00848.x
Ding, F., Ma, H., and Luo, G. (2021). Evaluation of groundwater types in earthquake observation wells and relationship between formation cause and recharge. Pure Appl. Geophys. 178 (2), 399–410. doi:10.1007/s00024-021-02658-6
Erskine, A. D. (1991). The effect of tidal fluctuation on a coastal aquifer in the UK. Ground Water 29 (4), 556–562. doi:10.1111/j.1745-6584.1991.tb00547.x
George, H. R., and Edwin, S. R. (1979). Determination of aquifer parameters from well tides. J. Geophys. Res. 84 (B11), 6071–6082. doi:10.1029/JB084iB11p06071
Hussein, M. E., Odling, N. E., and Clark, R. A. (2013). Borehole water level response to barometric pressure as an indicator of aquifer vulnerability. Water Resour. Res. 49 (10), 7102–7119. doi:10.1002/2013WR014134
John, B., Keith, E. S., and Mousa, D. S. (1991). Estimating aquifer parameters from analysis of forced fluctuations in well level: An example from the nubian formation near aswan, Egypt: 1. Hydrogeological background and large-scale permeability estimates. J. Geophys. Res. 96 (B7), 12127–12160. doi:10.1029/91JB00955
Kamp, G., and Gale, J. E. (1983). Theory of earth tide and barometric effects in porous formations with compressible grains. Water Resour. Res. 19 (2), 538–544. doi:10.1029/WR019i002p00538
Lai, G. J., Hong, K. G., and Wei, L. W. (2013). Transfer functions of the well-aquifer systems response to atmospheric loading and earth tide from low to high-frequency band. J. Geophys. Res. Solid Earth 118 (5), 1904–1924. doi:10.1002/jgrb.50165
Li, C. H., Chen, Y. H., and Tian, Z. J. (1990). The dynamic response of well-aquifer system to earth tides and its influence. (in Chinese with English abstract).
Narasinmhan, T. N., Kanehiro, B. Y., and Witherspon, P. A. (1984). Interpretation of earth tide response of three deep, confined aquifers. J. Geophys. Res. 89 (B3), 1913–1924. doi:10.1029/JB089iB03p01913
Rasmussen, T. C., and Crawford, L. A. (1997). Identifying and removing barometric pressure effects in confined and unconfined aquifers. Ground Water 35 (3), 502–511. doi:10.1111/j.1745-6584.1997.tb00111.x
Rojstaczer, S. (1988). Determination of fluid flow properties from the response of water levels in wells to atmospheric loading. Water Resour. Res. 24 (11), 1927–1938. doi:10.1029/WR024i011p01927
Tian, Z. J., and Gu, Y. Z. (1985). Analysis and processing of data on fluctuations of groundwater level. Seismol. Geol. 7 (3), 51–62. (in Chinese with English abstract).
Toll, N. J., and Rasmussen, T. C. (2007). Removal of barometric pressure effects and earth tides from observed water levels. Ground Water 45 (1), 101–105. doi:10.1111/j.1745-6584.2006.00254.x
Venedikov, A. P., Arnoso, J., and Vieira, R. (2005). New version of program VAV for tidal data processing. Comput. Geosci. 31, 667–669. doi:10.1016/j.cageo.2004.12.001
Wang, X. S., Wang, G. C., and Dong, J. N. (2010). Rainfall dynamic model and anomaly identification of groundwater level in fault zone. Acta Seismol. Sin. 32 (5), 570–578. (in Chinese with English abstract).
Yang, L., Ma, J. Y., and Cao, J. Q. (2014). Inversion of the volumetric strain of aquifer according to the tidal effect of groundwater in the North China region. Earthq. Res. China 30 (2), 249–259. (in Chinese with English abstract).
Zhang, Z. D., Zheng, J. H., and Feng, C. G. (1989). Quantitative relationship between the earth tide effect of well water level, the barometric pressure effect and the parameters of aquifer. Northwest. Seismol. J. 11 (3), 47–52. (in Chinese with English abstract).
Zhang, Z. D., Zheng, J. H., and Zhang, G. C. (1995). Response functions of well aquifer system to tide. Northwest. Seismol. J. 17 (3), 66–71. (in Chinese with English abstract).
Zhou, Z. H., Tian, L., Zhao, J., Wang, H., and Liu, J. (2020). Stress-related pre-seismic water radon concentration variations in the panjin observation well, China (1994–2020). Front. Earth Sci. (Lausanne). 8, 596283. doi:10.3389/feart.2020.596283
Keywords: well-aquifer system, undrained state, convolutional regression, hydrogeological parameter, water level rise
Citation: Ding F, Ma H, Luo G, Dai Y, He J, Zhu P and Wu X (2022) Hydrodynamic mechanism of quasi-synchronous water level rise in observation wells. Front. Earth Sci. 10:963816. doi: 10.3389/feart.2022.963816
Received: 09 June 2022; Accepted: 04 August 2022;
Published: 31 August 2022.
Edited by:
Maoliang Zhang, Tianjin University, ChinaReviewed by:
Zhi Hua Zhou, China Earthquake Networks Center, ChinaXiaolong Sun, National Institute of Natural Hazards, China
Copyright © 2022 Ding, Ma, Luo, Dai, He, Zhu and Wu. This is an open-access article distributed under the terms of the Creative Commons Attribution License (CC BY). The use, distribution or reproduction in other forums is permitted, provided the original author(s) and the copyright owner(s) are credited and that the original publication in this journal is cited, in accordance with accepted academic practice. No use, distribution or reproduction is permitted which does not comply with these terms.
*Correspondence: Heqing Ma, bWFocTIyMkAxNjMuY29t
 Fenghe Ding
 Heqing Ma*
 Guofu Luo