- 1Research Institute for Earth Resources, Kangwon National University, Chuncheon, South Korea
- 2Division of Earth Sciences, Korea Polar Research Institute, Incheon, South Korea
- 3Science Division, Monterey Bay Aquarium Research Institute, Moss Landing, CA, United States
- 4Department of Geophysics, Kangwon National University, Chuncheon, South Korea
The shallow migration path of mudflow of the mud volcano MV420 on the continental slope of the Canadian Beaufort Sea is investigated in terms of thermal and geotechnical characteristics. MV420 is a nearly flat topped active mud volcano that emits methane and fluidized mud. Its top is at a depth of water of 420 m, within the gas hydrate stability zone. During the summer 2017 IBRV Araon expedition, several measurements of marine heat flow were conducted in the area of juvenile mud mound/pond morphologies identified by multibeam bathymetry and backscatter intensity images obtained by the Monterey Bay Aquarium Research Institute’s autonomous underwater vehicle. The heat probe (a gravity corer with temperature, pressure, and tilt sensors) appeared to penetrate to a depth of >70 m below the seafloor. The sediment bulk density in the mudflow migration path of MV420, estimated by pressure change with controlled stretches of a winch cable, was 1.56 g/cm3. The subsurface temperature reaches up to 18°C and profiles show that the maximum local temperature occurs from 20 to 40 m below the seafloor, implying substantial vertical variability of geothermal gradients. Our finding of large positive and small negative geothermal gradients above and below the depth of the local temperature maximum may represent stagnant hot mud along the mudflow migration path, indicating a pulsative eruption of the mudflow. Gas hydrate is stable only within a few meter thick layer near the seafloor above the path because of the cold bottom water (0.4°C) covering the top of the mud volcano. Furthermore, the thermal conductivity of 0.939 W/m/K and the marine heat flow of 22.5 mW/m2 at a control site outside MV420 is estimated as the background heat flow in the slope, for which little data exists.
1 Introduction
Mud volcanoes are surface expressions generically formed by a surface discharge of focused fluidized mudflow (Niemann and Boetius, 2010; Mazzini and Etiope, 2017). The mudflow discharge (including fluid and gas) are caused by high pressure at great depth or instability of sediments (Kopf, 2002; Niemann and Boetius, 2010; Mazzini and Etiope, 2017). Although the study of onshore mud volcanoes in terms of tectonic settings, mechanism, and activity began in the early 1900s, a comprehensive study of offshore mud volcanoes was promoted in the late 1900s with help from the enhanced capability of subaqueous geophysical survey instruments and accuracy of the positioning of bottom samplers (Milkov, 2000). Offshore mud volcanoes can be identified based on their characteristic shape (subcircular elevated bathymetry) and gas emanating from the seafloor (Milkov, 2000). Offshore mud volcanoes occur on continental margins but rarely in the abyssal plains, and their total number in the oceans varies with studies from at least 300 (Etiope and Milkov, 2004) to the order of 103–105 (Milkov, 2000).
Recent studies have shown that mud volcanoes may be offshore sources of methane, a greenhouse gas (Dimitrov, 2003; Sauter et al., 2006; Wallmann et al., 2006; Menapace et al., 2017). Although the annual amount of methane emitted into the atmosphere through mud volcanoes was estimated to be ∼5 Tg CH4 (Dimitrov, 2003), the estimated value does not consider the consumption of methane by anoxic methane oxidation (AOM) in surface sediments in offshore mud volcanoes. For example, methane flux from offshore mud volcanoes in the Black Sea is considered on the order of one-10th compared to the estimations neglecting the AOM process (Wallmann et al., 2006). Mudflow discharge rate, a source of energy for the chemosynthetic communities to carry out the AOM process, is one of the controlling factors regulating the AOM processes inside mud volcanoes (de Beer et al., 2006; Niemann and Boetius, 2010). Because mudflow and porewater discharge are observed from the surface sediment and variability of discharge rates occurs between sites, even per site, it is hard to illustrate the whole discharge of a mud volcano.
To better understand the discharge, it could help to know the thermodynamic properties of the deeper mudflow migration path, as the flow paths branch off toward the seafloor (Menapace et al., 2017). Because the driving force of the discharge is the vertical difference in pressure and temperature along the migration path, such information is essential for quantifying the magnitude of discharge, but remains poorly understood due to a lack of observation.
The over-penetration of sediment cores frequently inferred by the presence of mud smears on the core weight and winch cable (Figure 1A), especially when coring in soft sediments. Experiments to determine the overpenetration of the gravity corer below the seafloor and use the data to better understand the subsurface conditions are rare. However, the temperatures at greater depths below the seafloor of the offshore mud volcano have been collected by overpenetrating a few meter long gravity corer which was equipped with temperature sensors. For example, the subsurface temperature with a low thermal gradient at the depth interval of ∼25–40 m below seafloor (mbsf) was reported from the Håkon Mosby mud volcano in Barents Sea (Feseker et al., 2008) and ∼63–67 mbsf from the Dvurechenskii mud volcano in Black Sea (Feseker et al., 2009).
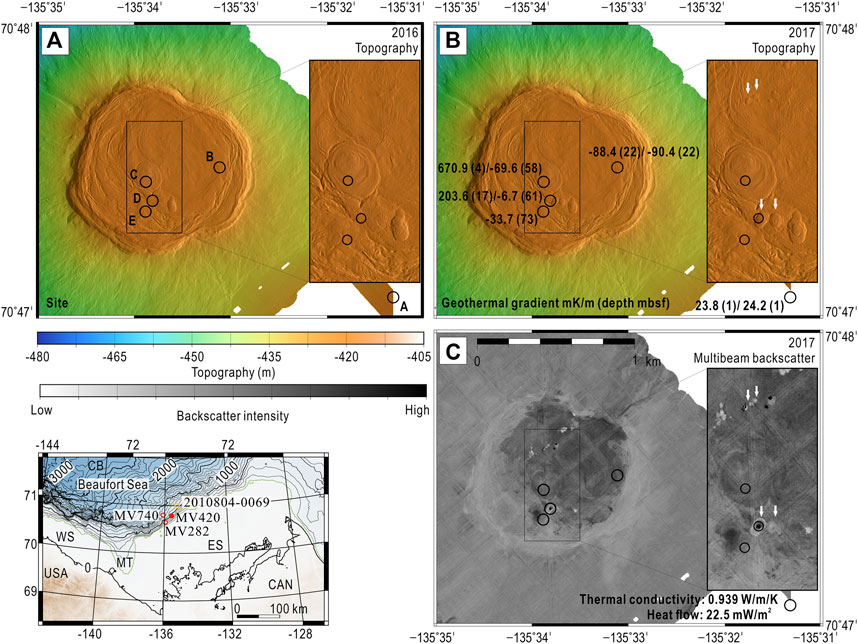
FIGURE 1. Acoustic survey results with the autonomous underwater vehicle (AUV) in MV420. Multibeam echosounder bathymetry obtained in 2016 (A) and 2017 (B), and backscatter intensity images from the multibeam echosounder in 2017 (C) are shown. New mound morphologies (white arrows in Figure subset B) formed in 1 year. Five sites (A to E in Figure subset (A) and the observed geothermal gradient (numbers in Figure subset B) with penetrating depth (numbers with parentheses in Figure subset B) for each site are depicted in Table 1. Thermal conductivity and heat flow are shown in (C). The inset exhibits regional bathymetry of the Canadian Beaufort Sea and the location of three mud volcanoes (red circles): MV282, MV420 (closed), and MV740 (Paull et al., 2015). The comparison site for sediment bulk density is 2010804–0069 (orange square) (MacKillop et al., 2022). The subsea permafrost limit is considered to follow an isobath of water depth ∼100 m below sea level (dashed green line) (Taylor et al., 2013). WS, Western Shelf; MT, Mackenzie Trough; ES, Eastern Shelf; CB, Canadian Basin.
In the Canadian Beaufort Sea, offshore mud volcanoes are distributed across the continental slope (Blasco et al., 2013; Paull et al., 2015). Recent studies on the MV420 mud volcano, so named because it is at a water depth of 420 m below sea level (mbsl), show it is a methane-related active mud volcano with the characteristics of a gas-charged conduit below the flat top, the appearance of gas hydrate, chemosynthetic bio community, and deep origin of expelled flow (Figure 1 inset) (Paull et al., 2015; Gwiazda et al., 2018; Lee et al., 2018). The isotopic data of the pore water indicate that surface porewater of MV420 contains water formed by the smectite-illite transition occurring at 60–200°C. Considering the geothermal gradient ∼30 mK/m within the continental shelf (Dixon, 1996), mud expulsion at MV420 may be deeper to a few kilometers. MV420 is repeatedly investigated using an autonomous underwater vehicle (AUV) by the Monterey Bay Aquarium Research Institute to identify detailed changes in appearance, including new developments in mudflows (Figures 1A,B).
In 2017, a joint Korea-USA-Canada research team operated the icebreaker RV Araon campaign at the mud volcano area on the continental slope of the Canadian Beaufort Sea (Jin et al., 2018). A backscatter image obtained in 2017 delineates newly formed mound morphology at the top of the volcano (Figure 1C) (Jin et al., 2018). A heavy-weighted marine heat probe, comprising a gravity corer as a frame and pressure, temperature, and tilt sensors, was lowered into these newly formed mound morphologies. Based on pressure reading, we claim the probe reached a greater depth of several dekameters below from the MV420 top. Furthermore, during an overpenetration of the probe, the probe was descended several times in controlled increments. All three sensors were synchronized with time so that the collected data illustrate the temperature and pressure changes, with changes in the inclination of the probe per second. As pressure changes over the depth interval below the seafloor account for sediment loading corresponding to the increment, our experiment gives a hint to assess the sediment bulk density and then temperature profile in the mudflow migration path not revealed in the study area.
The unparalleled dataset obtained in this study is the key to deciphering the thermal and geotechnical characteristics of MV420. We report both the subsurface temperature profile and sediment bulk density in the mudflow migration path up to several dekameters beneath the top of MV420. Although these datasets themselves cannot draw a complete picture of the thermal structure of MV420, they provide a unique opportunity to improve our understanding of the plumbing system of an active mud volcano.
2 Geological setting
The Beaufort Sea is a marginal sea of the Arctic Oceans north of North America and south of the central Arctic Ocean (Figure 1 inset) (International Hydrographic Organization, 1953). Its average water depth is ∼1,500 m, making it deeper than most of the Arctic Ocean due to the deep Canada Basin (Jakobsson, 2002). Landward, a gentle continental slope and a continental shelf lie subparallel to the coastline, which were formed by repetitive glacial regressive and interglacial transgressive deposits during the Quaternary period. Pliocene sediments of sand, silt, and clay thicken from several hundred meters onshore toward the shelf break to >3 km (Dixon, 1996; Dietrich et al., 1985). Marine-estuarine mud comprises Holocene layers during the most recent transgressive interval. Because no period exceeds 0°C in a mean annual temperature during the interglacials, the thawing of permafrost on the surface was minimized (Taylor et al., 2013). Subsea permafrost extending down to 700 mbsf and gas hydrate below 1,200 mbsf are identified from numerous industry wells on the continental shelf (Pelletier, 1987). Compared to the shelf studied with numerous wells and geophysical surveys, geological information on the slope is lacking (Paull et al., 2015). The extent of the subsea permafrost is believed to coincide with shelf break at 70–120 mbsl (Carmack et al., 1989; Taylor et al., 2013), even in the Mackenzie trough, where a large discharge of fresh water occurred along with the Mackenzie River (Kim et al., 2018). The subsea permafrost acts as a seal that prevents fluid from flowing through. Therefore, freshwater from molten ice, subsurface discharge from land, and gas hydrate dissociation move vertically at the extent of the end of the subsea permafrost (Blasco et al., 2013; Gwiazda et al., 2018). The shallower water column of 500 mbsl comprises the upper low salinity layer extending down to 150 m with local thermal minimum <−1°C and the lower warm and high saline layer with local thermal maximum >0.5°C at 300–350 mbsl (McLaughlin et al., 2004; Kim et al., 2018).
3 Method and instruments
3.1 AUV bathymetry and backscatter intensity
The Monterey Bay Aquarium Research Institute’s Dorado class AUV (5.2 m in length, 0.53 m in diameter) was operated in the 2017 Araon Expedition to obtain 1-m scale bathymetry (Reason 7125-AUV 400 kHz) and backscatter seafloor map along with CHIRP sub-bottom profiles (Edgetech FSAU 1–6 kHz sub-bottom profiler) and side scan images (Edgetech FSAU 110 kHz sidescan) (Caress et al., 2008; Jin et al., 2018). The AUV can operate up to a depth of 6,000 m and is equipped with a precise navigation system (ring-gyro-based inertial navigation system Kearfott SeaDevil with 300 kHz Teledyne-RDI Workhorse Navigator Doppler velocity log sonar). Typical vehicle speed is three knots, and minimum altitude from the seafloor to achieve ∼1 m horizontal and 10 cm vertical resolutions is 50 m. Data obtained from one mission were downloaded to the ship after recovery of the AUV and processed using the open-source software package MB-System. At MV420, the AUV took ∼17.3 h to map the topography and subsurface structure along 85 L-km at an average speed of 2.6 knots.
3.2 Temperature, pressure, and tilt
Temperature (Type 1854 Miniaturized Temperature Data Logger; ANTARES Datensysteme GmbH, Stuhr, Germany) and depth loggers (DST Tilt; Star-Oddi, Garðabær, Iceland) were attached to 6 m-long barrels of the gravity corer to increase survey efficiency by simultaneously collecting a sediment core along with the heat flow measurement (Figure 2A) (Kim et al., 2020; Kim et al., 2022). The closed core catcher is chosen, where acquisition of the sediment core sample is neither necessary nor available. After attaching all sensors, the total weight of the heat flow probe is ∼1700 kg in air. The diameter of the core weight is 40 cm. All sensors record data every second, so observation results for temperature, pressure, and tilt can be sorted by seconds. Six temperature loggers were attached, separated by 70–120 cm (Figures 2A,B). The temperature resolution was 0.001°C with a range of −5–50°C. A tilt sensor was located on the head (Figures 2A,C), and the tilt resolution was 1 along three axes. The depth resolution is 0.9 m, where 0.03% of a depth range for the DST Tilt we used. Data from the two loggers were downloaded after recovering the heat probe (all sensors attached to the gravity corer). The measurement of the heat flow comprised four steps:
1) Deployment of the heat probe from the ship which is stabilized in the targeted position using dynamic positioning.
2) 5–10 min wait over the seafloor to secure the vertical alignments of the probe and the relative corrections between temperature sensors.
3) 20–25 min wait in the sediments after penetration with a falling speed of 30–50 m/min to measure thermal equilibrium.
4) Retrieval.
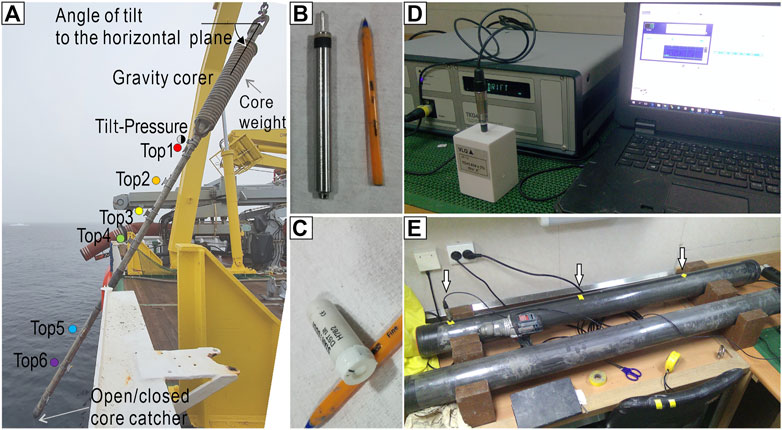
FIGURE 2. The heat probe comprises the gravity corer as a frame, temperature sensors (Antares Miniaturized Temperature Data Logger (MTL); Top1 to 6 in (A), and tilt-pressure sensor (Star-Oddi DST Tilt; Tilt Pressure on A), which was operated in the main back deck of IBRV Araon. The winch cable with the heat probe is connected to the top of the corer. The length of the corer is 8.5 m. The tilt sensor records an angle of the corer regarding a horizontal plane such that a tilt reading of 90° implies that the corer stands perpendicular to the horizontal plane. The MTL and DST Tilt are shown in (B) and (C), respectively, with a ball-pen for scale. The thermal conductivity meter (TeKa TK04) with a needle probe (TeKa VLQ) (D) is used to measure the thermal conductivity of the retrieved sediment core at intervals of 20–40 cm (white arrows in (E)). The laboratory temperature is 20°C.
During measurement, the dynamic positioning capacity of a ship and tension control of the winch are crucial to avoid secondary thermal effects due to friction between the sediments and the falling corer for such a long waiting time.
3.3 Geothermal gradient
The geothermal gradient is determined from the temperature variation over the vertical depth interval of the sediments. The distance between the Antares temperature sensors was measured before the probe was deployed. However, the heat probe penetrating the sediment is likely to be inclined, so the vertical distance between the sensors can be calculated by multiplying both the sine value of the inclination of the probe recorded by the Star-Oddi DST Tilt and the distance between sensors along the barrel. A tilt of 90° means downward vertical and −90° upward vertical status of the heat probe (Figure 2A). The location of the topmost sensor is always considered as depth 0 mbsf, and then the locations of other sensors are represented based on the topmost sensor.
To determine the geothermal gradient, readings of temperature and tilt are recorded for > a 20 min period (“direct method”) (Pfender and Villinger, 2002). The pulling out action of the probe can be identified by a change in temperature and tilt (Figure 3). The basic assumption for the direct method is that a temperature sensor would converge on the in situ temperature of the surroundings as the frictional heat dissipates. Accordingly, the geothermal gradient at each time step after penetration became stable and finally converged with time (blue lines in Figure 4). Previous studies verified that long-term approximate (“extrapolated gradient”) shows a good match with gradient with “direct method” by less than 2% deviation just in 5 min after penetration (Pfender and Villinger, 2002; O'Regan et al., 2016). The benefit of the direct method is that it decreases regression error from asymptotic approaches in extrapolating the decay curve of temperature to infinite, making it more reliable (Pfender and Villinger, 2002).
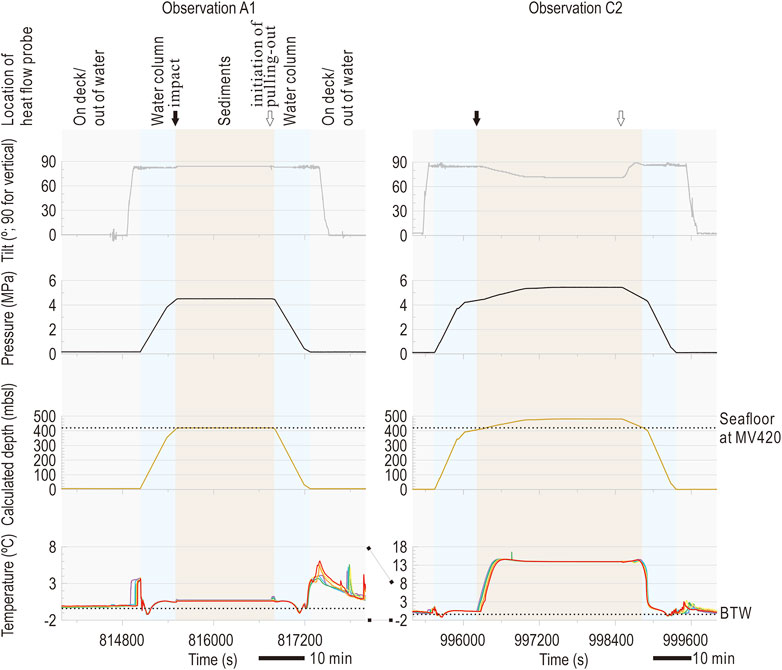
FIGURE 3. Comparison of heat flow measurements in normal penetration and overpenetration. Analysis of time series of tilt (first row) pressure (second row), and temperature (fourth row) recordings allows the location of the heat flow probe to be discriminated. The timing of impact (black arrow) and initiation of pulling out (white arrows) of the heat probe can be identified from the abrupt changes in temperature and tilt readings. In the case of overpenetration, it takes more time for the heat probe to escape sediments after the initiation of pulling out. The depth (third row) is converted from the pressure data (see text). Water depth 420 and bottom water temperature are stated in the third and fourth rows. The heat probe was left in the sediment for at least 20 min after penetration/impact. The horizontal scale bar is 10 min.
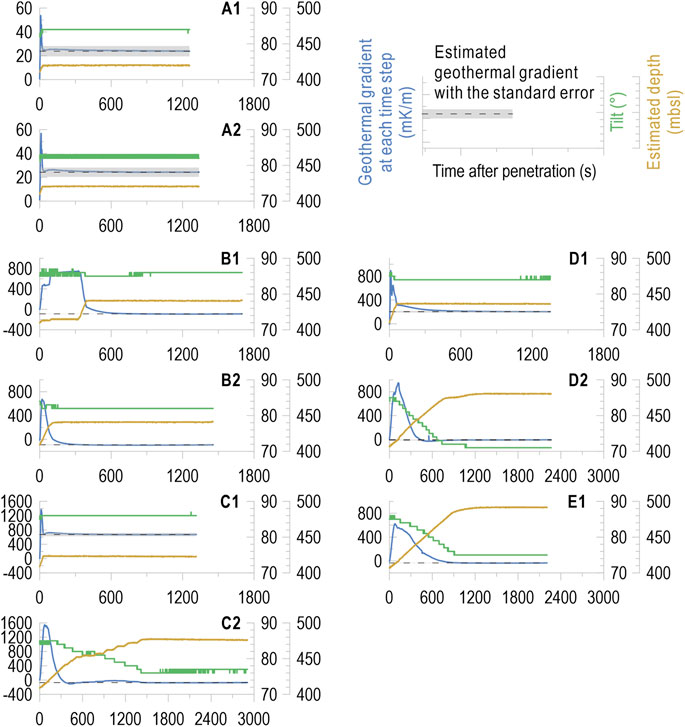
FIGURE 4. Geothermal gradient at each time step (blue line) from penetration to initiation of pulling out for Observations (A1–E1). It became convergent after an initial large peak for the first ∼5 min. At the timing just before initiation of pulling out, the geothermal gradient (dashed black line) is estimated with the standard error (gray zone) using the “direct manner” (Pfender and Villinger, 2002). The tilt (green line) and depth (gold line) are also presented. After penetration, the tilt change is less than 10°.
3.4 Thermal conductivity
The thermal conductivity of the retrieved sediment core was measured using a thermal conductivity meter (TK04 system with a needle probe; TeKa, Berlin, Germany) after maintaining it at a lab temperature of 20°C for at least 6 h for thermal equilibrium (Figures 2D,E) (Kim et al., 2020; Kim et al., 2022). With the assumption where heat vertically transfers across horizontally layered sedimentary beds, the harmonic mean is useful to find the representative value (Expedition 317 Scientists, 2011). Thermal conductivity was measured at a spacing of 20–40 cm along the retrieved core (arrows in Figure 2E). The harmonic mean for the core is estimated as follows:
where λHM is the harmonic mean, zi is the thickness of the ith bed, λi thermal conductivity of the ith bed, Z is the total thickness of the sediments (Z = ∑zi). λi itself is the average of the results of three consecutive measurements at the same depth.
Laboratory thermal conductivity, λHM above, was corrected to match the in situ value using the thermal conductivity-temperature-pressure relationship (Hyndman et al., 1974):
where λin situ is the in situ thermal conductivity, λlab the laboratory-measuring thermal conductivity, zw the water depth in meter below sea level, ρ the sediment bulk density in g/cm3, Tzw the temperature at water depth in Celsius, GG the geothermal gradient, and Tlab the temperature of the laboratory (20°C). All parameters except ρ are observed at Site A served as a control site having the same water depth as MV420, where the sediment core was retrieved. The bulk density of 1.72 g/cm3 is adopted from Station 2010804-0069, away from Site A by ∼20 km (Figure 1 inset) (MacKillop et al., 2022) because no direct measurement of the bulk density for the sediment core at Site A was conducted.
3.5 Experiment with descending the probe by a controlled distance during overpenetration
Because the temperature, pressure, and tilt data were recorded at synchronized one-second time increments. The position of the heat probe is deciphered by analysis of sensor readings after retrieval of the heat probe. Both the impact of the heat probe on the seafloor and the initiation of pulling out are represented by an abrupt increase in temperature readings with a change in tilt readings (Figure 3). When the heat probe penetrated the sea floor, there were little changes in the readings of tilt and pressure from the sensors attached to the probe because the probe is fixed in position and angle within the sediments. This is also confirmed by rapid temperature increase. Compared with normal penetration (Figure 3A), overpentration is inferred when the pressure reading (converted into water depth based on a hydrostatic pressure condition) is higher than the water depth at the site (Figure 3B). Such an overpenetration was reported when heat flow measurements were conducted in mud volcanoes. Overpenetration to ∼25–40 mbsf in the Håkon Mosby mud volcano in the Barents Sea (Feseker et al., 2008), and to ∼63–67 mbsf from the Dvurechenskii mud volcano in the Black Sea (Feseker et al., 2009) was determined by mud smear on a winch cable.
We conducted controlled overpenetration experiments. After the initial core penetration, additional cable was paid out from the winch in 2–5 m increments followed by waiting 20–120 seconds for orientation of the probe to stabilize. Three possible cases can be expected (Figure 5);
1) It Sunk into the bottom: If the probe sinks by the same amount as the cable payout increment, the tilt reading remains unchaged, but the pressure reading increases, and wire tension will indicate it is providing some support.
2) It Laid down: If the probe rotated down, the tilt reading substantially decreases, and the pressure reading only slightly increases. Wire tension may or may not provide some support.
3) It remained Fixed: If the probe were fixed, the tilt, pressure, and wire tension readings would remain unchanged.
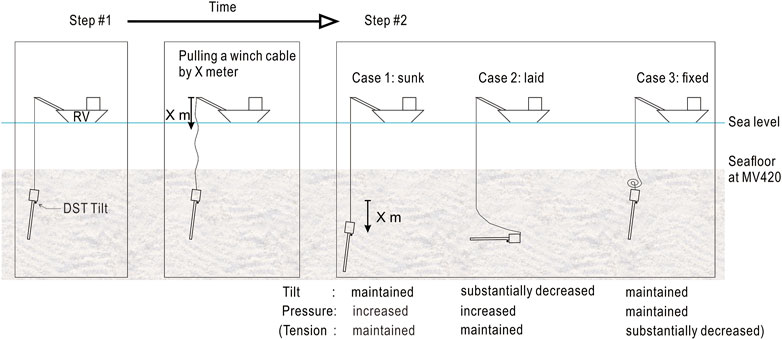
FIGURE 5. Schematic diagram of the experiment during overpenetration of the heat probe. A cable from the winch was released by controlled amount after Step #1, then the heat probe responded to the cable increment at Step #2. Response can be categorized into three situations: sunk, laid, and fixed. Depending on the situation, the sensor readings are different. Cable tension is not recorded by seconds due to a malfunction of the winch but in handwriting.
The sensor readings allow the orientation and position of the probe in Step 2 to be determined. An example of one insertion is shown in Figure 6.
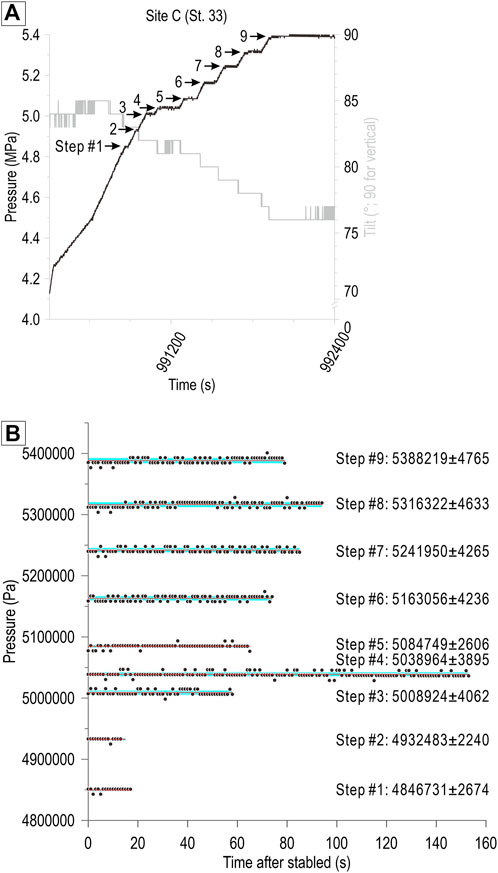
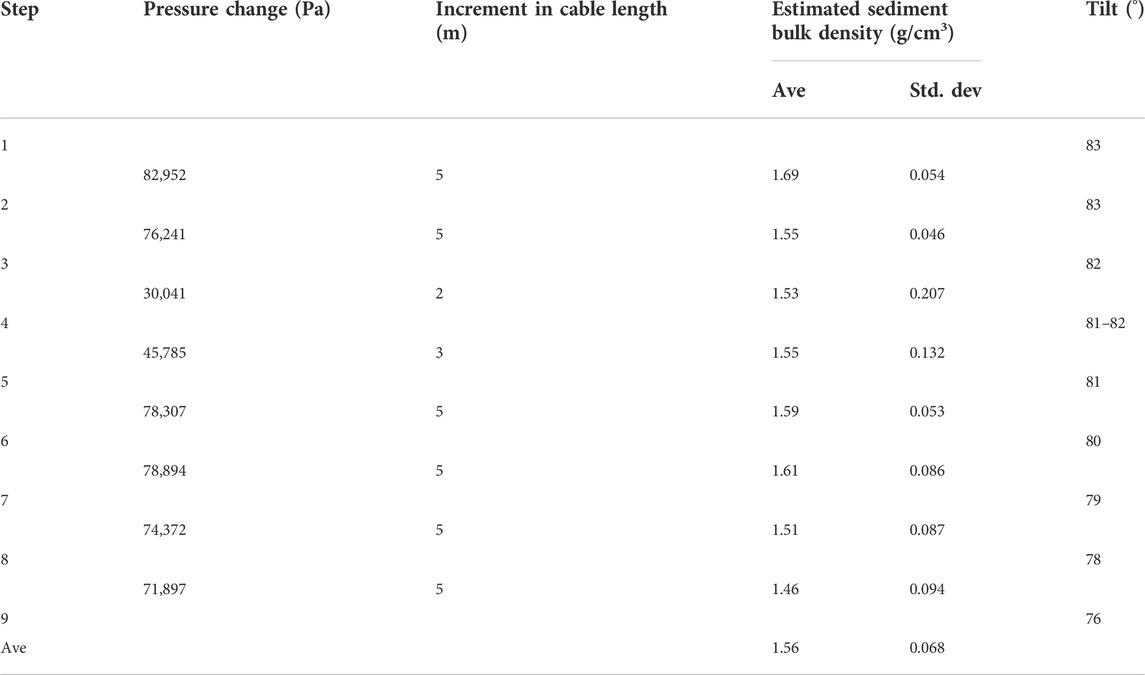
FIGURE 6. The pressure (black line) and tilt (gray line) readings during Observation C2 at Site C are shown in (A). The distinctive nine steps in pressure reading (Steps #1 to #9) are a consequence of a cable increment between those steps: all 5 m increment except 2 m between #3–4 and 3 m between #4–5. The tilt readings change slightly from 83 to 76 during the experiment. The pressure reading (black dots) for each step is displayed in (B) with an average (red line) and standard error (blue shadow). The pressure changes between steps (Table 2) correspond to the weight of the sediment column with the height of a cable increment. See the text.
3.6 Bulk density
The bulk density of sediments is an important geotechnical parameters that control buoyancy in relation to the vertical instability. For instance, diapir is the classic geological feature caused by buoyancy instability associated with lighter material being overlain by heavier material. Bulk density can be assessed using seismic wave velocity, gamma-ray attenuation in boreholes. Direct measurement on physical samples are useful if such data and samples are available. However, there is a lack of such data in MV420.
Overpenetration and continuous recording of pressure with time in MV420 provides an opportunity to infer the bulk density of sediments. The baseline is the difference in pressure readings between two vertically different levels in the medium, accounting for the weight of the medium between the two levels under the assumption of an incompressible medium. If the distance between the two levels is known, the bulk density of the medium can be estimated as:
where Pa and Pb are pressure readings at vertically different level Za and Zb in the medium, respectively, ρ the bulk density of the medium, and g the gravitational constant. The key to determining the bulk density of sediments in MV420 is to identify how the probe responded to payout of a winch cable. During Observation C2, a cable was released at a constant speed from the winch eight times: 6 times by 5 m, one time by 3 m, and one time by 2 m (Figure 6; Table 2). At each step, winch cable payout was halted for a period of >60 s except Steps 1 and 2 having a relaxation time of ∼20 s.
3.7 Penetrating depth of the heat probe below the seafloor
The bulk density of the sediments allows us to convert pressure readings to the penetration depth of the heat probe below the seafloor in the case of overpenetration.
Where Pz is the pressure reading at depth Z mbsf, Pcontrol pressure reading at the seafloor of water depth 420 mbsl, Zcontrol is water depth 420 mbsl, ρsed the estimated bulk density of sediments. Pcontrol is observed during Observation A1 and A2 at Site A, the control site out of MV420 (Figures 1A, 3).
3.8 Bottom water temperature
A Conductivity-Temperature-Depth (CTD) tool was run down to within a few meters above of seafloor to measure the bottom water temperature. At Site B the water temperature was measured just 4 m above the seafloor (Table 1).
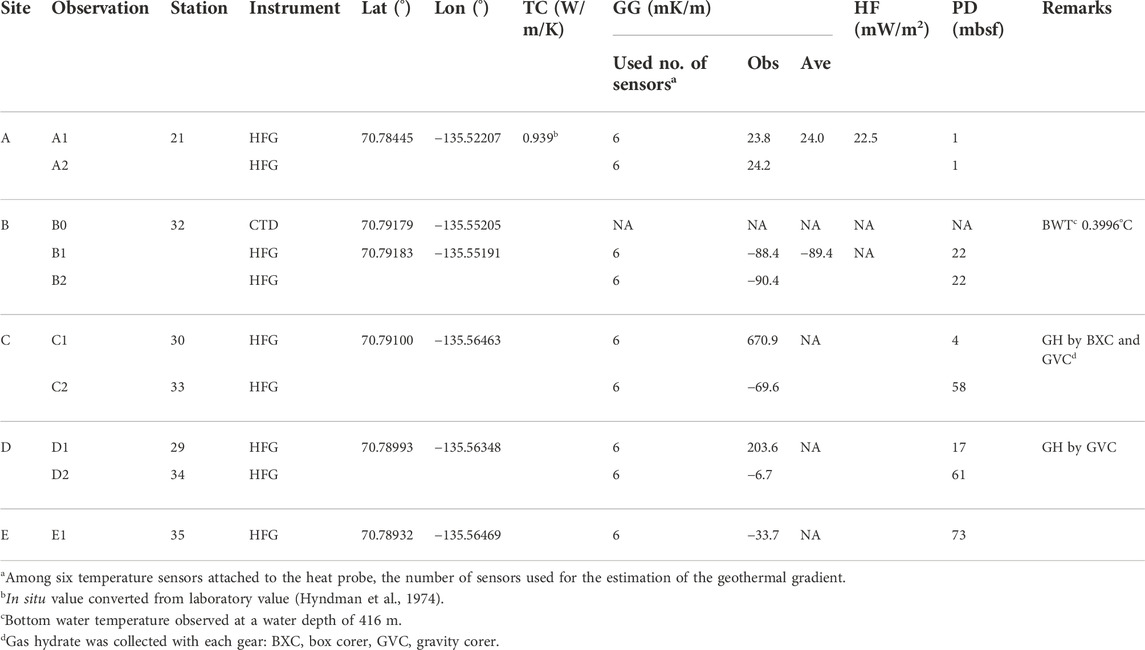
TABLE 1. Summary of site locations and results. TC, thermal conductivity; GG, geothermal gradient; HF, heat flow; PD, penetrating depth; HFG, heat flow probe for geothermal gradient; CTD, conductivity-temperature-depth.
4 Results and discussion
4.1 Site selection
The surface morphology of the flat top in MV420 is known to have change between repeat surveys conducted since 2013. Figure 1 shows the topography maps obtained in 2016 and 2017, and the backscatter intensity map in 2017 with the multibeam echosounder of the AUV. New mound morphologies were visually identified by comparing the two maps in Figures 1A,B (white arrows). As backscatter images produced by the multibeam echosounder record high backscatter intensity on harder and smoother surfaces, they provide additional information on changes in surface morphology. For instance, newly formed mound morphologies show low backscatter intensity (Figure 1C). However, some exhibit high backscatter intensity as recent mudflow forms a muddy brine lake on flat surfaces without bioturbation (Dupré et al., 2014). The occurrence of new mound morphologies on the flat top does not appear to be organized, based on visual inspection with multibeam echosounder and backscatter intensity images.
Four sites were chosen for heat flow measurements on the flat top of MV420 to discern the difference in mudflow eruption stages (Figure 1; Table 1). As time elapses, the morphology generated by the mudflow can form a convex-upward shape, or the chemosynthetic biological fauna on the surface can thrive (Paull et al., 2015). Site C was selected for the area with the highest mound morphology, showing concentric mud rims indicative of long-lasting mud flows, and Site D showed the highest intensity of backscatter. Proximity to the newly formed mound morphology at Site D may represent an early stage during an eruption of new mudflow. Site B was the only area with a high intensity of backscatter without eruption features. Site E showed intermediate backscatter intensity among sites.
Site A served as a control site having the same water depth as MV420, and was located 1.4 km from the fringe of the flat top of MV420 (Figure 1A). Although sediments below the flat-topped MV420 were interpreted to have been charged with gas based on acoustic turbidity in the sub-bottom profile, the area outside MV420 exhibited non-gas bearing sediment layers (Riedel et al., 2014; Paull et al., 2015). Gas hydrate was identified using box and gravity coring in Sites C and D (Table 1; Jin et al., 2018), and the main gas composition was assumed to be the same as previous results, biogenic methane (Paull et al., 2015; Paull et al., 2021).
4.2 Subsurface temperature
Two consecutive observations at one station, such as those at Sites A and B, are standard processes during heat flow measurement. However, the second measurement was conducted by revisiting Sites C and D. Owing to the limited survey time, only one measurement was conducted at Site E. Although ships try to find the exact location when revisiting the previous station using GPS coordinates, disparity in the grounding position of the gravity corer between the first and second measurement is unavoidable, and is expected to be much bigger than two consecutive measurements at one station.
Figure 7 depicts temperature readings from the Miniaturized Temperature Data Logger (MTL) sensors with time in all sites for all periods when the probe was within the sediments, whereas Figure 4 displays periods from impact of the heat probe with the seafloor to the initiation of its pull out. The former period is useful for investigating subsurface temperature profiles, and the latter is vital to applying the “direct method” for geothermal gradient estimation. Figure 7 also shows both the time gap between the two measurements at a site and the observed temperature ranges. All vertical axes (estimated depth, pressure, temperature, and tilt) through Figure 7 were adjusted to be equal for comparison. The gravity corer with temperature and tilt-pressure sensors were left embedded in the sediments after impact during each observation for at least 20 min (1,200 s), as shown by the flat interval of pressure readings (Figures 4, 7). The tilt angle stabilized, and the temperature readings stabilized after reaching a temperature equilibrium with the sediments. The estimated depth is mentioned later.
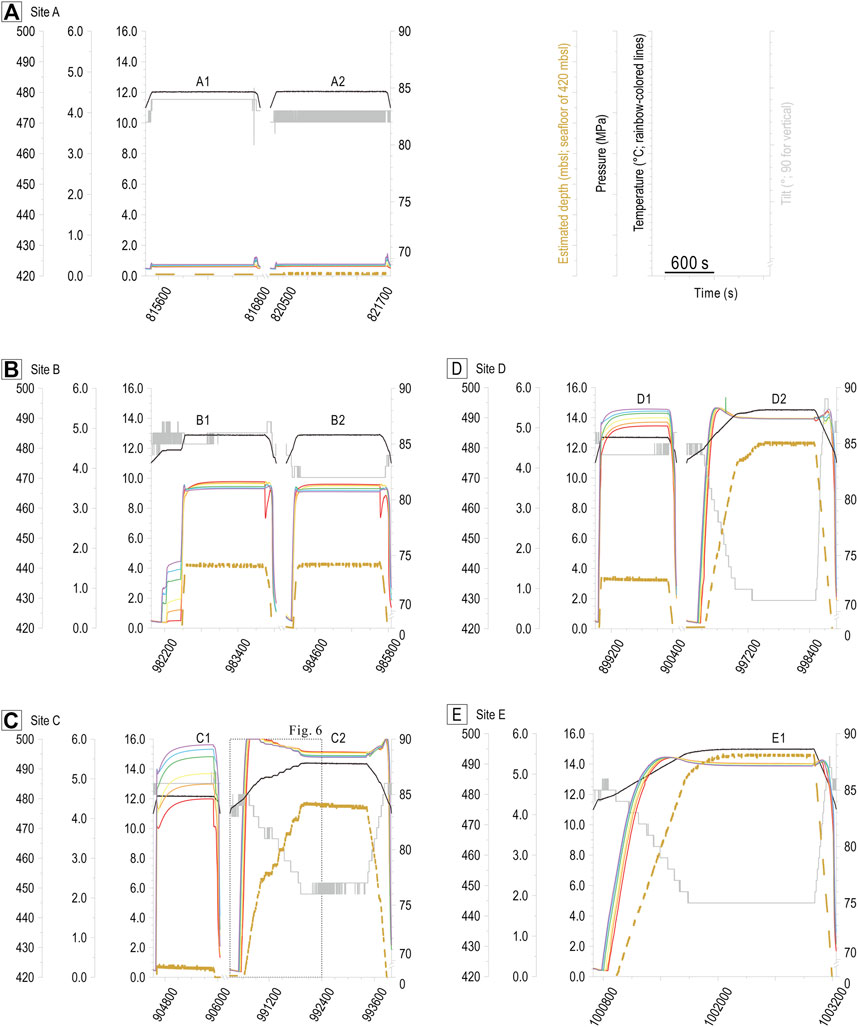
FIGURE 7. The observed results of temperature (rainbow-colored lines the same as the MTLs in Figure 2A), tilt (black line), and pressure (gray line) are represented over time when the probe is within sediments. All vertical scales are the same through the Figure subsets. Except Site (E), two measurements were performed for each site. In Sites (A) and (B), those are made consecutively once at a site, whereas in Sites (C,D), they are made by revisiting the sites (Table 1). The time gap between measurements at each site is shown. Estimated penetrating depth of the heat probe is shown as the gold dashed line. Details of Observation C2 is shown in Figure 6.
4.2.1 Site A (control site)
Two consecutive measurements (Observations A1 and A2 in Figures 4, 7A; Table 1) were performed at Site A. The tilt angle was stable during each measurement. During Observation A2, the tilt angle was recorded repeatedly between 83° and 84°. The gravity corer did not tremble, but lay on the threshold of the tilt sensor reading as the temperature recorded in the temperature sensors was stable. The temperature increased when the motion of the gravity corer embedded in the sediments was disturbed, i.e., periods of both penetration and retrieval. The temperature increased with depth within the sediments, and all the readings are higher than the bottom water temperature of 0.3996°C (Table 1).
4.2.2 Site B (MV420)
Two consecutive measurements (Observations B1 and B2 in Figures 4, 7B; Table 1) were performed at Site B. The gravity corer with sensors gradually steeped from 85° to 86° during Observation B1; however, its speed was so slow that its effect on the temperature readings was negligible. All temperature readings during the two measurements stabilized. We observed that all the readings were much higher than those at Site A, and temperature decreased with depth during a wait time for thermal equilibrium. Furthermore, the two measurements of pressure, temperature, and tilt were similar.
4.2.3 Site C (MV420)
Two measurements (Observation C1 and C2 in Figures 4, 7C; Table 1) were made during two visits, which are shown as different station numbers in Table 1, at Site C. During Observation C1, the observations resembled those of Site A; however, a substantial difference in temperature readings was observed between each MTL sensor and all temperature readings showed a much higher range (>10°C). During Observation C2, the results showed a substantial difference. Pressure and tilt changed gradually before the flat interval starting from 1,500 s after penetration. The pressure and temperature readings were higher than in Observation C1. At the flat interval of Observation C2, temperature decreased with depth, in contrast to Observation C1. In addition, the range of temperature readings was reduced. A stepwise increase in pressure reading (dotted box in Figure 7C) was identified which is consistent with the wire payout. Pressure changes between such steps help estimate sediment bulk density, as discussed later in the section on bulk density. The tilt angle during Observation C2 was still high (>70°) but smaller, i.e., less inclined to a horizontal plane.
4.2.4 Site D (MV420)
Two measurements (Observation D1 and D2 in Figures 4, 7D; Table 1) were made during two visits to Site D. The differences between the first and second measurements were substantial as those at Site C. However, the pressure and temperature readings were much higher than those at Site A.
4.2.5 Site E (MV420)
Only one measurement (Observation E1 in Figures 4, 7E) was conducted at Site E. The results were like those of Observations C2 and D2.
4.3 Sediment bulk density
The experiment using a winch cable during Observation C2 at Site C allowed estimation of the bulk density of sediments, one of the crucial geotechnical parameters along with the shallow mudflow migration path below MV420. Figure 6 depicts the stepwise increase in pressure readings by the tilt-pressure sensor. Nine steps in pressure readings were formed by extending the winch cable by a controlled amount eight times: all 5 m increments except two in-betweens Steps #3-4, and #4–5 (Table 2). In Step #3-4, only a 2 m increment of the winch cable was performed, and in Step #4-5, a 3 m increment was used.
The vertical change in the location of the heat probe was made after a cable payout based on the pressure and tilt readings. The tilt angle showed a slight decrease from 83° to 76° throughout the experiment (Figure 6; Table 2). The linear pressure increase between steps follows the constant release velocity of a cable (30 m/min). These findings support that during overpenetration, the response of the heat probe to a cable increment is sinking, neither laying down nor fixing (Figure 5). Although the tension of the winch cable was not digitally recorded due to a malfunction in the ship winch system, handwritten notes show that the tension of the winch cable did not abruptly decrease after each cable payout increment during the whole experiment. The tension remains at 520–700 kg during the whole experiment during Observation C2 at Site C. For comparison, the tension remains as 200 kg after impact of the probe on the seafloor during Observations A1 and A2 at the control site, Site A, indicating that 200 kg is the approximate weight of 420 m of a winch cable in the sea water.
A basic approach to estimating the sedimentary bulk density is based on a deduction where the difference in pressure readings between previous and next steps corresponds to the weight of the sediment column as long as there is a cable increment. Considering a gravitational constant of 9.83 m/s2, the sediment bulk density was estimated to range from 1.46 to 1.69 g/cm3 (averaged as 1.56 g/cm3 with a standard deviation of 0.07) (Table 2). For the case where a smaller cable increment of 2 or 3 m was performed, consistent results with other cases of a 5 m cable increment are estimated. Figure 8 shows the estimated bulk density with depth. It is difficult to distinguish the trend of bulk density with depth according to our findings.
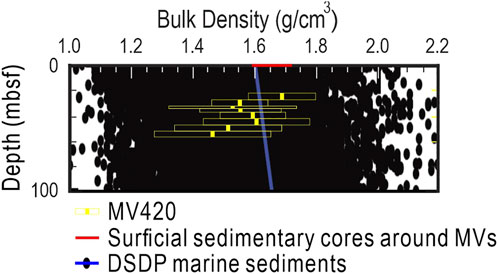
FIGURE 8. The estimated bulk density of sediments by the cable release by controlled amount in Observation C2 are represented as a bar (thick line for average value and box for ± standard deviation) with depth (thickness of a bar) (Table 2). Compilation of Deep Sea Drilling Project data (black dots with blue line for average) is also shown (Tenzer and Gladkikh, 2014) Surficial data (red line) from areas close to MV420 are depicted (Blasco et al., 2013; MacKillop et al., 2022). The estimated bulk density is slightly lower than the global data with depth.
The estimated range in the bulk sediment density provides essential information on sediments along with the shallow migration path. Bulk density information is sparse in the Beaufort continental slope area (Blasco et al., 2013). According to the recent result by MacKillop et al. (2022), the estimated bulk density is even slightly smaller than 1.72 g/cm3 of surficial sedimentary core 2010804–0069 (∼4 m in core length) retrieved close to MV420. At water depths ranging from 75 m to 600 m, surficial sedimentary core (2–7 m in core length) retrieved at five sites closed to MV282 shows 1.59–1.71 g/cm3 in bulk density (Blasco et al., 2013). When comparing global data (Figure 8; Tenzer and Gladkikh, 2014), the bulk density of the shallow migration path of MV420 appears to be smaller than the averaged density, whereas the bulk densities of the surficial sediment cores around the mud volcanoes in this region are higher than the averaged density. Considering that the general process of lithification makes the sediments heavier as its burial depth increases, our findings in MV420 need to be explained. However, critically, the estimated bulk density may not be for the homogenous mud itself, but for the mixture of matrix (mud) and possible clasts along the migration path because the actual core sample is not retrieved from deep. For example, large clasts having different lithology with matrix (mud) are often found at the surface in onshore mud volcanoes and from drilled cores in other offshore mud volcanoes (Kopf and Behrmann, 2000; Mazzini and Etiope, 2017).
Two hypotheses may explain the low bulk density of the shallow mudflow migration path. One is that low viscosity enhanced by high water content and porosity is the favored condition for the mud flow to move upward along the conduit (Lee and Widjaja, 2013). Supply of freshwater to sediments in the conduit is feasible because lateral hydrology processes in which water from the melting permafrost and dissociation of gas hydrate in the continental shelf, and freshwater through the continental shelf below the permafrost flow into the continental slope are common in Arctic continental slopes, including the Beaufort continental slope (Gwiazda et al., 2018). The water from the deep smectite-illite transformation is supplied vertically (Paull et al., 2015). In a simple calculation, an increase in volume of 12% with freshwater, sediment bulk density of 1.63 g/cm3, which corresponds to the averaged value of the global data for the same penetrating depths, leads to reduce it to 1.56 g/cm3. The second hypothesis is that the mud on the migration path may originate from the underlying deeper sediment layer with low bulk density. This is a process in which deep sediments are expelled by overpressure and form mud volcanoes (Kirkham et al., 2018), although direct evidence for this has not yet been found in MV420. According to geotechnical analysis about boreholes in this region, the depth to the top of the primary overpressure looks to be 1800–2,400 mbsf around MV420 (Issler et al., 2011). Simultaneous application of the two hypotheses cannot be ruled out because the source depths of solid and water can be different (Reitz et al., 2011).
One can ask how the probe reaches deep penetrating sediments with a rather large bulk density of 1.46–1.69 g/cm3. Bulk density has a positive relationship with sediment strength, how strong it resists against stress exerted by the corer. However, the penetration depth of the gravity corer depends on various parameters such as lithology, frictional coefficient with sediments, weight of core, speed of penetration, and so on (Wu et al., 2020). Given conditions where all parameters are the same, the penetration depth of the corer increases with decreased friction coefficient. In laboratory experiments, frictional coefficient of the pure clay composition is decreased to 0.1 at minimum, leading to a two-fold deeper penetration compared to the 1:1 clay-silicic grain composition, corresponding to a friction coefficient of 0.3 (Kopf and Brown, 2003; Wu et al., 2020). Often, the friction coefficient decreases with an increase in water content (Kuo et al., 2011). The acquisition of sediment core from the migration path is necessary to decipher which geotechnical parameters control deep penetration of the corer, as well as what lithologic composition comprises migration paths.
4.4 Geothermal gradient changing with depth
Based on the averaged bulk density, the pressure reading can be changed to the corresponding depths considering the seafloor 420 mbsl. Such depths are plotted as ‘Estimated depth (mbsl)’ (gold line) at each site in Figures 4, 7. The pressure readings at the mud volcano sites (Sites B, C, D, and E) higher than those at the control site (Site A) represent the overpenetration of the heat probe into the seafloor of MV420. Penetrating depths vary with each observation at sites, so those range from 4 to 73 mbsf (Table 1). The penetrating depths between two consecutive measurements as in Sites A and B are similar, but those between two measurements conducted by revisiting Sites C and D are not. As surface features related to mud flow deviate even at a short distance on the flat top of MV420, and oceanographic characteristics such as current and tide change with time, revisitation using the GPS coordinates does not guarantee the exact grounding location of the gravity corer.
The geothermal gradient was estimated from the temperature reading of six temperature sensors after 20 min wait for thermal equilibrium just before pulling out action of the probe (Figure 4). A linear geothermal gradient represented by a high R2 value >0.88, indicative of heat transportation by conduction, was identified in all observations except Observation D2 (Figure 9; Table 1). Two consecutive measurements as in Sites A and B yielded similar geothermal gradients, whereas two measurements by revisitation as in Sites C and D showed a considerable difference. A positive geothermal gradient (24.0 mK/m) was observed at the control site and both negative and positive geothermal gradients were observed at the mud volcano (Table 1). The geothermal gradient outside MV420, which is 28.9 mK/m and comparable to Site A in this study, was reported in a previous study (Lee et al., 2018).
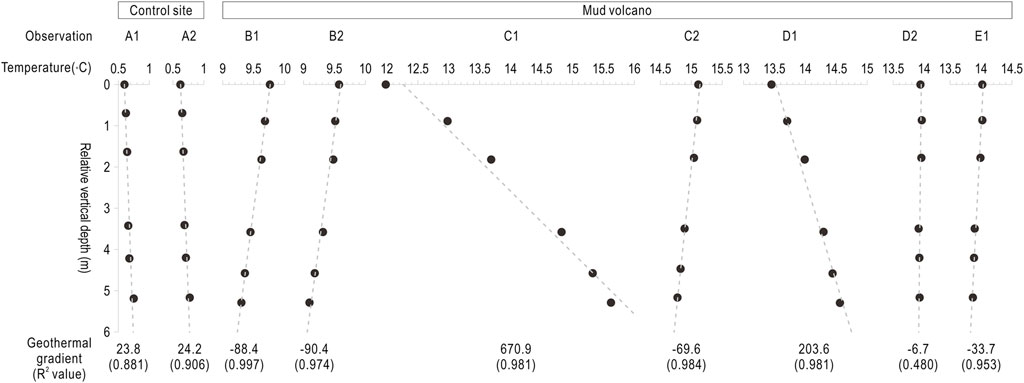
FIGURE 9. Observed results of temperature at depths (black dots) and geothermal gradient (dashed line) for Observations (A1–E1) are plotted. Six MTLs penetrated the sediments for all observations. The scale for a horizontal temperature axis is the same through all the plots. The geothermal gradient (number) and the R2 value for linear regression (number in parentheses) are shown below the plot.
Here, the temperature profile below the flat top of MV420 can be shown for the first time, as information about penetrating depth and temperature is available even though there is some limitation. Figure 10 shows the temperature profile of MV420 observed during penetration, i.e., down casting, of the heat probe. Temperature at penetrating depths is represented by the average of the temperature readings. The local thermal maximum can be observed at each site (TMs in Figure 10) where increasing and decreasing temperature trends with depth occur above and below, respectively, whereas the depth of the local thermal maxima differs by site. For example, the thermal maximum at Site C is ∼20 mbsf, but it is ∼40 mbsf at Site E. This finding provides a vital information on the interpretation of various ranges from positive to negative geothermal gradients for the same site and across sites.
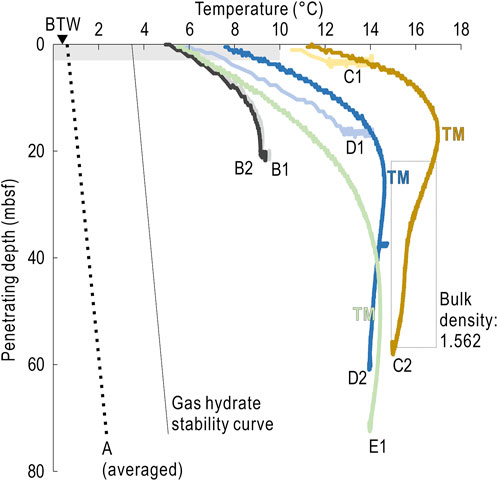
FIGURE 10. Temperature profiles below MV420 with penetrating depth, observed only during down casting, are shown (Sites B–E). The temperature value refers to the average of all MTL temperature readings at depth. Based on the temperature profile, the local temperature maximum is identified (TM). The depth of the maximum local temperature varies with the sites. The range of the earlier heat flow observation (Riedel et al., 2014) is shown as a shaded area. For comparison, an extrapolated thermal profile at Site A as a dashed line and the bottom water temperature (Observation B0) as a triangle are depicted. A dashed area along Observation C2 represents a depth interval for estimation of the bulk density. The gas hydrate stability curve is represented (solid black line) (Vadakkepuliyambatta, 2019).
One should be cautious with the interpretation of the thermal profile presented here. First, the temperature profile in Figure 10 does not mean results of complete thermal equilibrium at each depth. It shows results by continuous downcasting of the probe through sediments with a descending speed of 30 m/min at all mud volcano sites. Frictional heat between temperature sensors and sediments is expected during the probe descent. However, the observed temperature does not show a single trend of increasing with depth. As the temperature increment with depth becomes smaller, there is a certain depth at which the temperature below gets colder than the above, called the local thermal maximum. Although it is difficult to know the accurate depth of the thermal maximum due to the response time of the temperature sensors and the amount of friction heat, it is trivial that the actual thermal maximum is located above the estimated thermal maximum in Figure 10. Second, the physical configuration of the probe, where there is a distance gap between temperature sensors and a pressure sensor, cannot be negligible compared to the total penetrating depth of 70 m; an average temperature of six readings is used along with a 6 m-long barrel. The location of the temperature sensors is below the pressure sensor. Therefore, the temperature at a depth of ∼3 m can be plotted at the particular depth.
Despite the limitation implied in the thermal profile, it sheds light on understanding the geothermal gradient having large variation. The geothermal gradient observed at MV420 can vary with the penetrating depth of the gravity corer. Shallow penetration above the depth of the local thermal maximum can produce a high positive geothermal gradient, as in the case of Observations C1 (670.9 mK/m) and D1 (203.6 mK/m). However, a few negative geothermal gradients were observed by deep penetration below the depth of the local thermal maximum in the case of Observations B1 & B2 (averaged: −89.4 mK/m), C2 (−69.6 mK/m), D2 (−6.7 mK/m), and E1 (−33.7 mK/m). A decreasing geothermal gradient with depth was reported by the Håkon Mosby MV (Kaul et al., 2006). Based on our findings, previously reported high geothermal gradients of 557.9 mK/m (Lee et al., 2018) and 529.3–2,934.8 mK/m (Riedel et al., 2014) in MV420 may have been obtained by shallow penetration of temperature sensors at the depth of the thermal maximum (shaded area in Figure 10). Often, geothermal gradients are a proxy to represent the intensity of gas/fluid emission in a mud volcano (Kaul et al., 2006; Feseker et al., 2009; Lee et al., 2018). However, according to our findings, site comparison using geothermal gradients as a proxy in mud volcanoes should be performed with caution because of vertical variability in geothermal gradient even at the same site.
Questions about the local thermal maxima regarding their meaning and implications for the plumbing system may arise. Although constant to semi-constant eruption is frequently reported from onshore mud volcanoes (Mazzini and Etiope, 2017), a episodic eruption is mainly reported from offshore mud volcanoes (Feseker et al., 2014; Paull et al., 2015). For example, 25 pulses of hot subsurface fluids were observed for 431 days in the Håkon Mosby MV (Feseker et al., 2014), and a quasiperiodic eruption of methane bubbles over 12 months was observed in MV282 in the Beaufort continental slope (Figure 1 inset) (Paull et al., 2015). Studies on eruption timing and extent on MV420 have not been available until now.
Thermal modelings of magma flow along the conduit give hints to infer the thermal structure of the mud volcano related to the eruption. They deal with a similar physical configuration with the mud volcanoes where a flow ascends along with a vertical conduit surrounded by environments with a constant geothermal gradient. However, magma modelings consider substantial variation in viscosity due to temperature, composition, volatile contents, and so on (Sahagian, 2005; Costa et al., 2007), which is not expected to such extent in a mudflow. A decrease in discharge rate results in a substantial reduction of heat advected by a flow, leading to progressive cooling from the conduit top with time. Instead, an increase in discharge contributes to eruption then the overall temperature of the conduit is increased to the temperature of a flow (Costa et al., 2007).
On the other hand, from the direct observation of an onshore mud volcano in Trinidad either vertically constant or a slight negative temperature trend with depth in the conduit is explained by the heat transfer by convective mudflow (Deville and Guerlais, 2009). In offshore mud volcanoes such as Hakon Mosby in the Barents Sea (Feseker et al., 2008) and one of the Barbados mud volcano (Henry et al., 1996), a changing temperature profile from an increase to a decrease with depth at a particular depth is considered as manifestation by convective mud flow below at that depth.
We speculate that such local thermal maxima are related to the pulsative eruption in MV420. Our findings, a high positive geothermal gradient above local thermal maximum and low negative to a few geothermal gradients below, possibly support a transient status between eruptions. The local thermal maximum may reflect convective mudflow stagnant at deep depths below the mud volcano top, from which the upcoming eruptive pulse possibly originates along with the shallow migration path. To test this hypothesis, future studies of the rheology of mudflows are needed.
4.5 Thermal conductivity and marine heat flow at the control site
A sediment core of length 4.47 m was retrieved at Site A, the control site. After equilibrium of the sediment core temperature with laboratory temperature, thermal conductivity was measured with the TK04 with a needle probe in the laboratory (Figures 2E, 11). Reading thermal conductivity was possible only in the lower part of the core, possibly because sediment with high porosity and water content on the seafloor may hinder contact with the needle probe with the sediment. The water content of Core 2010804-0069 decreases with depth from ∼120% at the seafloor to ∼100% at 100 cmbsf (MacKillop et al., 2022). Finally, the thermal conductivity of 0.985 W/m/K was estimated using laboratory measurements from Site A. Thermal conductivity measured in the laboratory was converted to that with the in situ condition using the empirical relationship of thermal conductivity and other parameters such as temperature and pressure (Hyndman et al., 1979). In situ thermal conductivity was 0.939 W/m/K, which is comparable to marine sediments (Pribnow et al., 2000). Given a geothermal gradient of 24 mK/m (Figure 9), a marine heat flow of 22.5 mW/m2 was estimated (Table 1).
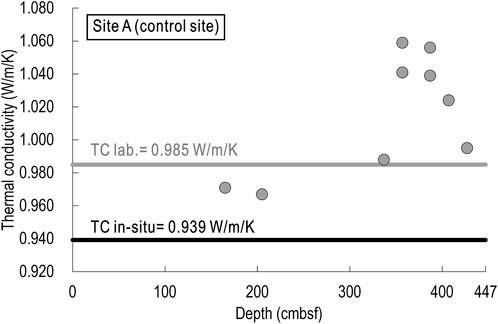
FIGURE 11. Using the TeKa TK04, laboratory-measuring thermal conductivity (dots) for sedimentary core retrieved in Site A is shown. The representative value (gray line) for the whole core and its correction to in situ condition (black line; Hyndman et al., 1974) are also displayed.
4.6 Gas hydrate stability zone
In the 2007 expedition, a gas hydrate sample was recovered by box and gravity coring at Sites C and D (Table 1) (Jin et al., 2018). Analysis of the gas hydrate sample and void gas collected by various coring during the previous expeditions indicates >94% methane with δ13C1 of −64‰ corresponding to biogenic origin (Paull et al., 2015). Based on the sulfate profile in the sediments, the sulfate-methane transition zone in MV420 is as shallow as 0.20 m, meaning a large upward flux of methane (Lee et al., 2018). Because the depth of the water of MV420 and bottom water temperature are favorable pressure-temperature conditions for gas hydrate (Sloan and Koh, 2007), methane can exist as the clathrate form at the surface of MV420 under given high methane flux (Figure 10).
With the assumption where pressure and temperature are the main parameters controlling the gas hydrate stability zone here in MV420, natural conditions for gas hydrate are no longer favored with depth. The gas hydrate stability curve is plotted based on the known gas composition, geothermal gradients from Site A, bottom water temperature from Site B, and salinity of 33.5‰ (solid black line in Figure 10) (Vadakkepuliyambatta, 2019). In the area with a geothermal gradient following 24.0 mK/m (dashed black line in Figure 10), the base of the gas hydrate stability zone is estimated to be 429 mbsf. However, places with a high geothermal gradient, such as migration path, do not lie within the gas hydrate stability zone. Temperature higher than the gas hydrate stability curve was interpreted as an increase in temperature by heat from ascent of warm and hydrate-free mudflow, which was not compensated by gas hydrate dissociation (Feseker et al., 2009). This follows the new formation of a mud mound and pond related to mudflow eruption.
Because the mudflow is focused on the surface of MV420 shown in Figure 1, the gas hydrate stability zone can extend downward to some extent out of the mudflow migration path. Even on the migration path, gas hydrate is likely stable within a thin surface layer, not resolved by the current setup of heat flow probe, because of cold bottom water temperature (triangle in Figure 10). There is a distance between the depth sensor above and the temperature sensors below along the barrel. Gas hydrate collected at Sites C and D supports the existence of such a thin gas hydrate stability zone despite the estimated thermal profile lying outside the gas hydrate stability curve.
4.7 Physical characteristics of the shallow migration path
The migration path mentioned here does not represent the deep-seated main feeder channel of a mud volcano (Roberts et al., 2010; Kirkham et al., 2018), but the shallow migration path of fluid carrying mud. The extent across the migration path can be constrained roughly based on the tilt angle and length of the gravity corer. A horizontal plane projected with the down-casted gravity corer may constrain the minimum extent. A lower tilt angle allows for a larger projection onto a horizontal plane. The projected line to the horizontal plane was calculated as the total length of the corer times the cosine of the tilt angle. Therefore, during Observation D2, where the lowermost angle of tilt was 71° and the length of the gravity corer was ∼8.5 m, a diameter of at least 2.8 m across the shallow migration path of mudflow was necessary to allow the gravity corer to be cast downward (Figure 12). For mud volcanoes having similar horizontal extent, the scale of the main feeder channel was reported as ∼250 m in diameter from the onshore exhumed fossil (Roberts et al., 2010), but estimated by modeling as 2–10 m in diameter from the offshore active (Kopf and Behrmann, 2000).
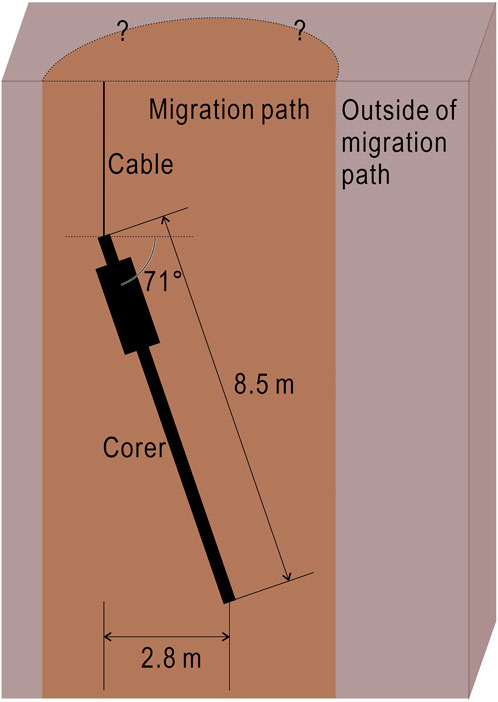
FIGURE 12. Cartoon about the extent of mudflow migration path. The most inclined angle of the probe was 71° during overpenetration. The total length of the probe is ∼8.5 m.
Figure 10 provides another insight into lateral temperature variation in the migration path. Comparison of two measurements by revisiting (Sites C and D) shows that two observation temperature profiles exhibit disparity with depth even at the same site. At Site B, where two consecutive measurements were conducted, the discrepancy between two temperature profiles with depth was negligible. This finding shows that temperature variation occurs laterally within a shallow migration path.
5 Summary and conclusion
A detailed investigation of MV420 using the heat probe (combination of the gravity corer and temperature, tilt, and pressure sensors) enabled us to reveal thermal structure and geotechnical properties of a submarine mud volcano. With a control site outside MV420 (Site A), four sites of newly formed mudflow (Sites B to E) were selected based on a comparison of multibeam echosounder bathymetry acquired in 2016 and 2017 using a state-of-the-art AUV and backscatter intensity image processed from the multibeam echosounder. Using the heavy-weighted gravity corer as a frame for the heat probe offered an unparalleled opportunity to observe the temperature profile along with the mudflow migration path below MV420. The IBRV Araon hosted this marine expedition in 2017, namely the ARA08C expedition.
The pressure change data obtained by repeatedly extending a winch cable by 5 m are crucial to estimate the sediment bulk density of the migration path at Site C. The bulk density has a value of 1.56 g/cm3 with a standard deviation of 0.068. The penetrating depth of the heat probe below the flat top of the MV ranged from 4 to 73 m, which was estimated through pressure readings and sedimentary bulk density. Unique information on the relation between penetrating depth enhances our understanding of the thermal structure of the migration path. The temperature profiles indicate that the maximum local temperature is at a depth of 20–40 mbsf, which implies that a positive geothermal gradient can be observed above the local temperature maximum and a negative one below it. The difference at the same site, such as Sites C (670.9 vs. −69.6 mK/m), and D (203.6 vs. −6.7 mK/m) can be explained in this context. Furthermore, comparisons between geothermal gradients observed in mud volcanoes, either as a proxy for other phenomena or when investigating volcanoes themselves, should take such large variability with depth into consideration.
Sites A and B, where two consecutive measurements were performed, produced similar geothermal gradients and penetrating depths each time, 23.8 vs. 24.2 mK/m at a depth of 1 mbsf for Site A and −88.4 and−90.4 mK/m at a depth of 22 mbsf for Site B, unlike in Sites C and D, where two measurements were conducted by revisitation. This finding indicates that abrupt variation over a short distance occurs across the migration path because the difference in the grounding location of the heat probe during individual visits at a station with the exact GPS coordinates is unavoidable during marine expeditions. For heat flow measurements, the extent of the shallow mudflow migration path of mudflow is restricted by a diameter of at least 2.8 m based on physically down casting of the heat probe, which has a length of ∼8.5 m and an inclination of 71°.
The reasons for the local thermal maximum were not revealed at this stage, but we speculate that the pulsative eruption nature of offshore mud volcanoes may be responsible. The mudflow that could generate an upcoming eruption was identified as the maximum local temperature, which was stagnant at least during the observation periods. This is supported by our findings of both conductive heat transport yielding a high positive geothermal gradient above the local temperature maximum and advective heat transport producing and a few negative geothermal gradients below it.
The low bulk density along with the shallow mudflow migration path is feasible because high water content and porosity leading to reduced viscosity favor mobility. Two explanations can be proposed for this situation: mudflow has an underlying source with low bulk density sediments and/or additional freshwater is supplied from surroundings such as gas hydrate dissociation, permafrost thawing, and clay transformation.
The thermal conductivity obtained from a sedimentary core at Site A was 0.939 W/m/K by a correction from laboratory to in situ value. Given a geothermal gradient of 24 mK/m, a marine heat flow of 22.5 mW/m2 was estimated. Due to the lack of heat flow data on the continental slope of the Beaufort shelf, our result provides essential information on the background heat flow.
Ascent of warm mudflow prevents methane from staying in the clathrate form along the migration path. However, either placing out of the mudflow migration path or a thin layer at the surface of the migration path is possibly favorable conditions for gas hydrate, supported by the occurrence of gas hydrate. Given the background geothermal gradient at Site A, the base of the gas hydrate stability zone is estimated to be 429 mbsf in the slope region.
Data availability statement
The original contributions presented in the study are included in the article/Supplementary Material, further inquiries can be directed to the corresponding authors.
Author contributions
Y-GK collected and analyzed the data, validated the concept, and wrote and revised the manuscript. YJ and JH also collected data, and administrated the project. CJ and B-DS validated the concept. CP and DC collected data and validated the concept.
Funding
This research was supported by the KIMST Grant 1525011795. Y-GK was also supported by the NRF grants (No. 2019R1A6A1A03033167 and No. 2020R1C1C1007495).
Acknowledgments
We would like to thank the scientific team of the ARA08C expedition (2017), the captain, and the crew of the IBRV Araon for their help in collecting data. The authors also thank the three anonymous reviewers and Matt O’Regan whose comments helped improve our manuscript.
Conflict of interest
The authors declare that the research was conducted in the absence of any commercial or financial relationships that could be construed as a potential conflict of interest.
Publisher’s note
All claims expressed in this article are solely those of the authors and do not necessarily represent those of their affiliated organizations, or those of the publisher, the editors and the reviewers. Any product that may be evaluated in this article, or claim that may be made by its manufacturer, is not guaranteed or endorsed by the publisher.
References
Blasco, S., Bennett, R., Brent, T., Burton, M., Campbell, P., Carr, E., et al. (2013). “2010 state of knowledge: Beaufort Sea seabed geohazards associated with offshore hydrocarbon development,” in Geological survey of Canada, open file.
Caress, D. W., Thomas, H., Kirkwood, W. J., Mcewen, R., Henthorn, R., Clague, D. A., et al. (2008). “High-resolution multibeam, sidescan, and subbottom survey using the MBARI AUV D. Allan B,” in Alaska sea grant college program. Editors J. R. Reynolds, and H. G. Greene (University of Alaska Fairbanks), 47–69.
Carmack, E. C., Macdonald, R. W., and Papadakis, J. E. (1989). Water mass structure and boundaries in the Mackenzie shelf estuary. J. Geophys. Res. 94, 18043–18055. doi:10.1029/jc094ic12p18043
Costa, A., Melnik, O., and Vedeneeva, E. (2007). Thermal effects during magma ascent in conduits. J. Geophys. Res. 112, B12205. doi:10.1029/2007JB004985
De Beer, D., Sauter, E., Niemann, H., Kaul, N., Foucher, J.-P., Witte, U., et al. (2006). In situ fluxes and zonation of microbial activity in surface sediments of the Håkon Mosby Mud Volcano. Limnol. Oceanogr. 51, 1315–1331. doi:10.4319/lo.2006.51.3.1315
Deville, E., and Guerlais, S. H. (2009). Cyclic activity of mud volcanoes: Evidences from Trinidad (SE caribbean). Mar. Petroleum Geol. 26 (9), 1681–1691. doi:10.1016/j.marpetgeo.2009.03.002
Dietrich, J. R., Dixon, J., and McNeil, D. H. (1985). Sequence analysis and nomenclature of upper cretaceous to holocene strata in the beaufort-mackenzie basin, current research, geological survey of Canada. Paper 85-1A, 613–628.
Dimitrov, L. I. (2003). Mud volcanoes—a significant source of atmospheric methane. Geo-Marine Lett. 23, 155–161. doi:10.1007/s00367-003-0140-3
Dixon, J. (1996). “Geological atlas of the Beaufort-Mackenzie area,” in Geological survey of Canada, miscellaneous report.
Dupré, S., Mascle, J., Foucher, J.-P., Harmegnies, F., Woodside, J., and Pierre, C. (2014). Warm brine lakes in craters of active mud volcanoes, menes caldera off NW Egypt: evidence for deep-rooted thermogenic processes. Geo-Mar. Lett. 34, 153–168. doi:10.1007/s00367-014-0367-1
Etiope, G., and Milkov, A. V. (2004). A new estimate of global methane flux from onshore and shallow submarine mud volcanoes to the atmosphere. Environ. Geol. 46, 997–1002. doi:10.1007/s00254-004-1085-1
Expedition 317 Scientists (2011). “Methods,” in Proc. IODP, 317. Editors Fulthorpe C. S., Hoyanagi K., Blum P., and Scientists T. E. (Tokyo: Integrated Ocean Drilling Program Management International, Inc.).
Feseker, T., Foucher, J. P., and Harmegnies, F. (2008). Fluid flow or mud eruptions? Sediment temperature distributions on Håkon Mosby mud volcano, SW Barents Sea slope. Mar. Geol. 247, 194–207. doi:10.1016/j.margeo.2007.09.005
Feseker, T., Pape, T., Wallmann, K., Klapp, S. A., Schmidt-Schierhorn, F., and Bohrmann, G. (2009). The thermal structure of the Dvurechenskii mud volcano and its implications for gas hydrate stability and eruption dynamics. Mar. Petroleum Geol. 26, 1812–1823. doi:10.1016/j.marpetgeo.2009.01.021
Feseker, T., Boetius, A., Wenzhöfer, F., Blandin, J., Olu, K., Yoerger, D. R., et al. (2014). Eruption of a deep-sea mud volcano triggers rapid sediment movement. Nat. Commun. 5, 5385. doi:10.1038/ncomms6385
Gwiazda, R., Paull, C. K., Dallimore, S. R., Melling, H., Jin, Y. K., Hong, J. K., et al. (2018). Freshwater seepage into sediments of the shelf, shelf edge, and continental slope of the Canadian Beaufort Sea. Geochem. Geophys. Geosyst. 19, 3039–3055. doi:10.1029/2018gc007623
Henry, P., Le Pichon, X., Lallemant, S., Lance, S., Martin, J. B., Foucher, J.-P., et al. (1996). Fluid flow in and around a mud volcano field seaward of the Barbados accretionary wedge: Results from Manon cruise. J. Geophys. Res. 101 (B9), 20297–20323. doi:10.1029/96jb00953
Hyndman, R. D., Erickson, A. J., and Von Herzen, R. P. (1974). “Geothermal measurements on DSDP leg 26,” in Initial reports of the Deep Sea Drilling project, 26, 451–463.
Hyndman, R. D., Davis, E. E., and Wright, J. A. (1979). The measurement of marine geothermal heat flow by a multipenetration probe with digital acoustic telemetry and insitu thermal conductivity. Mar. Geophys. Res. 4, 181–205. doi:10.1007/bf00286404
International Hydrographic Organization (1953). Limits of oceans and seas. Special Publication, 23. Montecarlo, Monaco: International Hydrographic Organization.
Issler, D. R., Hu, K., Lane, L. S., and Dietrich, J. R. (2011). GIS compilations of depth to overpressure, permafrost distribution, geothermal gradient, and regional geology, Beaufort-Mackenzie Basin, northern Canada. 5689 Natural Resources Canada. doi:10.4095/289113
Jakobsson, M. (2002). Hypsometry and volume of the Arctic Ocean and its constituent seas. Geochem. Geophys. Geosyst. 3, 1–18. doi:10.1029/2001gc000302
Jin, Y. K., Côté, M. M., Paull, C. K., and King, E. L. (2018). “2017 Korea-Canada-U.S.A. Beaufort sea (offshore yukon and northwest territories) research program: 2017 Araon expedition (ARA08C) cruise report,” in Geological survey of Canada, open file (Geological Survey of Canada).
Kaul, N., Foucher, J. P., and Heesemann, M. (2006). Estimating mud expulsion rates from temperature measurements on Håkon Mosby Mud Volcano, SW Barents Sea. Mar. Geol. 229, 1–14. doi:10.1016/j.margeo.2006.02.004
Kim, Y.-G., Jin, Y. K., Kim, S., Kang, S.-G., and Hong, J. K. (2018). Occurrence of ice-bonded sediments in the Mackenzie Trough, Beaufort Sea. Curr. Sci. 115, 1669–1673. doi:10.18520/cs/v115/i9/1669-1673
Kim, Y.-G., Kim, S. K., Lee, D.-H., Lee, Y. M., Kim, H. J., Kang, S.-G., et al. (2020). Occurrence of active gas hydrate mounds in the southwestern slope of the Chukchi Plateau, Arctic Ocean. Episodes 43, 811–823. doi:10.18814/epiiugs/2020/020053
Kim, Y.-G., Hong, J. K., Jin, Y. K., Jang, M., and So, B. D. (2022). Preliminary results of marine heat flow measurements in the chukchi abyssal plain, Arctic Ocean, and constraints on crustal origin. J. Eng. Geol. 32, 113–126.
Kirkham, C., Cartwright, J., Hermanrud, C., and Jebsen, C. (2018). The Genesis of mud volcano conduits through thick evaporite sequences. Basin Res. 30, 217–236. doi:10.1111/bre.12250
Kopf, A., and Behrmann, J. H. (2000). Extrusion dynamics of mud volcanoes on the Mediterranean Ridge accretionary complex. Geol. Soc. Lond. Spec. Publ. 174, 169–204. doi:10.1144/gsl.sp.1999.174.01.10
Kopf, A., and Brown, K. M. (2003). Friction experiments on saturated sediments and their implications for the stress state of the Nankai and Barbados subduction thrusts. Mar. Geol. 202, 193–210. doi:10.1016/s0025-3227(03)00286-x
Kopf, A. J. (2002). Significance of mud volcanism. Rev. Geophys. 40, 2-1–2-52252. doi:10.1029/2000rg000093
Kuo, C. Y., Tai, Y. C., Chen, C. C., Chang, K. J., Siau, A. Y., Dong, J. J., et al. (2011). The landslide stage of the Hsiaolin catastrophe: Simulation and validation. J. Geophys. Res. 116, F04007. doi:10.1029/2010jf001921
Lee, S. H.-H., and Widjaja, B. (2013). Phase concept for mudflow based on the influence of viscosity. Soils Found. 53, 77–90. doi:10.1016/j.sandf.2012.12.005
Lee, D. H., Kim, J. H., Lee, Y. M., Stadnitskaia, A., Jin, Y. K., Niemann, H., et al. (2018). Biogeochemical evidence of anaerobic methane oxidation on active submarine mud volcanoes on the continental slope of the Canadian Beaufort Sea. Biogeosciences 15, 7419–7433. doi:10.5194/bg-15-7419-2018
Mackillop, K., Ouellette, D., King, E. L., and Blasco, S. (2022). “Geotechnical characteristics and slope stability analysis of Beaufort Sea marine sediments, offshore yukon and northwest territories: methodology and results,” in Open file (Geological Survey of Canada).
Mazzini, A., and Etiope, G. (2017). Mud volcanism: An updated review. Earth-Sci. Rev. 168, 81–112. doi:10.1016/j.earscirev.2017.03.001
McLaughlin, F. A., Carmack, E. C., Macdonald, R. W., Melling, H., Swift, J. H., Wheeler, P. A., et al. (2004). The joint roles of Pacific and Atlantic-origin waters in the Canada Basin, 1997–1998. Deep-Sea Research 51, 107–128.
Menapace, W., Kopf, A., Zabel, M., and Beer, D. D. (2017). “3. Mud volcanoes as dynamic sedimentary phenomena that host marine ecosystems,” in Life at vents and seeps. Editor K. Jens (De Gruyter), 53–84.
Milkov, A. V. (2000). Worldwide distribution of submarine mud volcanoes and associated gas hydrates. Mar. Geol. 167, 29–42. doi:10.1016/s0025-3227(00)00022-0
Niemann, H., and Boetius, A. (2010). “Mud volcanoes,” in Handbook of hydrocarbon and lipid microbiology. Editor K. N. Timmis (Berlin, Heidelberg: Springer Berlin Heidelberg), 205–214.
O'regan, M., Preto, P., Stranne, C., Jakobsson, M., and Koshurnikov, A. (2016). Surface heat flow measurements from the east siberian continental slope and southern lomonosov ridge, Arctic Ocean. Geochem. Geophys. Geosyst. 17, 1608–1622. doi:10.1002/2016gc006284
Paull, C. K., Dallimore, S. R., Caress, D. W., Gwiazda, R., Melling, H., Riedel, M., et al. (2015). Active mud volcanoes on the continental slope of the Canadian Beaufort Sea. Geochem. Geophys. Geosyst. 16, 3160–3181. doi:10.1002/2015gc005928
Paull, C. K., Dallimore, S. R., Caress, D. W., Lundsten, E., Anderson, K., Melling, H., et al. (2021). A 100-km wide slump along the upper slope of the Canadian Arctic was likely preconditioned for failure by brackish pore water flushing. Marine Geology 435, 106453. doi:10.1016/j.margeo.2021.106453
Pelletier, B. R. (1987). “Marine science atlas of the Beaufort Sea: geology and geophysics,” in Geological survey of Canada miscellaneous report.
Pfender, M., and Villinger, H. (2002). Miniaturized data loggers for deep sea sediment temperature gradient measurements. Mar. Geol. 186, 557–570. doi:10.1016/s0025-3227(02)00213-x
Pribnow, D. F. C., Kinoshita, M., and Stein, C. A. (2000). Thermal data collection and heat flow recalculations for ODP Legs 101-180. Hannover, Germany: Institute for Joint Geoscientific Research, 0120432. Available from World Wide Web: http://www-odp.tamu.edu/publications/heatflow/.
Reitz, A., Pape, T., Haeckel, M., Schmidt, M., Berner, U., Scholz, F., et al. (2011). Sources of fluids and gases expelled at cold seeps offshore Georgia, eastern Black Sea. Geochimica Cosmochimica Acta 75, 3250–3268. doi:10.1016/j.gca.2011.03.018
Riedel, M., Villinger, H., Asshoff, K., Kaul, N., and Dallimore, S. R. (2014). “Temperature measurements and thermal gradient estimates on the slope and shelf-edge region of the Beaufort Sea, Canada,” in Geological Survey of Canada, open file (Natrual Resources Canada).
Roberts, K. S., Davies, R. J., and Stewart, S. A. (2010). Structure of exhumed mud volcano feeder complexes, Azerbaijan. Basin Res. 22, 439–451. doi:10.1111/j.1365-2117.2009.00441.x
Sahagian, D. (2005). Volcanic eruption mechanisms: Insights from intercomparison of models of conduit processes. J. Volcanol. Geotherm. Res. 143, 1–15. doi:10.1016/j.jvolgeores.2004.12.006
Sauter, E. J., Muyakshin, S. I., Charlou, J.-L., Schlüter, M., Boetius, A., Jerosch, K., et al. (2006). Methane discharge from a deep-sea submarine mud volcano into the upper water column by gas hydrate-coated methane bubbles. Earth Planet. Sci. Lett. 243, 354–365. doi:10.1016/j.epsl.2006.01.041
Taylor, A. E., Dallimore, S. R., Hill, P. R., Issler, D. R., Blasco, S., and Wright, F. (2013). Numerical model of the geothermal regime on the Beaufort shelf, arctic Canada since the last interglacial. J. Geophys. Res. Earth Surf. 118, 2365–2379. doi:10.1002/2013jf002859
Tenzer, R., and Gladkikh, V. (2014). Assessment of density variations of marine sediments with ocean and sediment depths. Sci. World J. 2014, 1–9. doi:10.1155/2014/823296
Vadakkepuliyambatta, S. (2019). in A graphical user interface for estimating the gas hydrate stability in marine sediments. V1 ed. (Centre for Arctic Gas Hydrate & Climate). DataverseNO.
Wallmann, K., Drews, M., Aloisi, G., and Bohrmann, G. (2006). Methane discharge into the Black Sea and the global ocean via fluid flow through submarine mud volcanoes. Earth Planet. Sci. Lett. 248, 545–560. doi:10.1016/j.epsl.2006.06.026
Keywords: mud volcano, sediment bulk density, subsurface temperature profile, geothermal gradient, marine heat flow, plumbing system, Canadian Beaufort Sea, ice breaker research vessel Araon
Citation: Kim Y-G, Jin YK, Hong JK, Paull C, Caress D, Jang C and So B-D (2022) Thermal structure and sediment bulk density of the MV420 mud volcano on the continental slope of the Canadian Beaufort Sea and its implications for the plumbing system. Front. Earth Sci. 10:963580. doi: 10.3389/feart.2022.963580
Received: 07 June 2022; Accepted: 21 November 2022;
Published: 19 December 2022.
Edited by:
Sang-Mook Lee, Seoul National University, South KoreaReviewed by:
Tobias Stål, University of Tasmania, AustraliaMatt O'Regan, Stockholm University, Sweden
Copyright © 2022 Kim, Jin, Hong, Paull, Caress, Jang and So. This is an open-access article distributed under the terms of the Creative Commons Attribution License (CC BY). The use, distribution or reproduction in other forums is permitted, provided the original author(s) and the copyright owner(s) are credited and that the original publication in this journal is cited, in accordance with accepted academic practice. No use, distribution or reproduction is permitted which does not comply with these terms.
*Correspondence: Young-Gyun Kim, WW91bmdneXVuLktpbUBnbWFpbC5jb20=; Byung-Dal So, YmRzb0BrYW5nd29uLmFjLmty
†These authors have contributed equally to this work
 Young-Gyun Kim
 Young Keun Jin2
 Jong Kuk Hong
 Byung-Dal So