 Zhengguo Zhu1,2
 Zhichun Fang
 Chaoyi Ma
94% of researchers rate our articles as excellent or good
Learn more about the work of our research integrity team to safeguard the quality of each article we publish.
Find out more
ORIGINAL RESEARCH article
Front. Earth Sci., 22 August 2022
Sec. Geohazards and Georisks
Volume 10 - 2022 | https://doi.org/10.3389/feart.2022.962445
This article is part of the Research TopicGeological Disasters and Its Prevention in Deep MiningView all 16 articles
It is difficult to monitor the deformation of a rock mass in front of a tunnel owing to the large buried depth and complex geological conditions. In this study, by using a self-designed model test box as a carrier and using loess, sand, gypsum, cement, and water as the raw materials, the class V materials similar to the surrounding rock are obtained through an orthogonal test. These are used to study the deformation law of a rock mass in front of a tunnel in different ground stress soft rock. The results show that similar materials for the surrounding rock can meet the needs of the testing concerning the physical and mechanical properties and have economic and environmental protection advantages. The three-dimensional loading of a similar geological body is used to simulate the state of the rock mass. The real-time monitoring of the rock mass stress and deformation is conducted during a simulation of tunnel excavation, and the deformation laws of the rock mass and surrounding rock in front of the tunnel are obtained. In the range of 0.26 times the tunnel diameter in front of the tunnel in the high ground stress soft rock, the deformation of the core rock mass is the largest part of the tunnel deformation. Therefore, to reasonably control the advanced deformation of the tunnel, it is necessary to pre-reinforce the core rock mass within 0.26 times the tunnel diameter in front of the tunnel. At 1 times the diameter in front of the face, a longitudinal load-bearing arch is formed in the rock mass, and this effectively controls the extrusion deformation of the core rock mass to expand forward.
Under the condition of high ground stress, some tunnel-collapse accidents caused by improper control of the surrounding rock stress release often occur in the construction of soft rock tunnels, which has caused great losses to the project. Many scholars have studied the engineering problems of soft rock tunnels with high stress and achieved fruitful results. Yang et al. (2017) found that owing to the complex tectonic stress of a deep rock mass, the stress field is a superposition of the gravity stress field and tectonic stress field; accordingly, it is mostly in a high-in-situ-stress state. Chen et al. (2021). Ma et al. (2021) found that tunnel-collapse accidents caused by improper control of the surrounding rock stress release, high ground stress, and discontinuity often occur in the construction process of soft rock tunnels, causing significant losses to the corresponding projects. A Kovacevic et al. (2021) and Cheng et al. (2018) found that to ensure the construction safety in a soft rock tunnel with high geo-stress and the stability and durability of the tunnel, it is necessary to initially study the deformation laws of the rock mass. At present, the control and monitoring processes for tunnel rock mass deformations are mainly concentrated on the surrounding rock of the excavated part. Zhang et al. (2019) and Sengani (2020) found that according to a geotechnical control deformation analysis method, all deformations of tunnel surrounding rock and instabilities caused by deformation are directly or indirectly related to the strength of the core rock mass in front of the tunnel face. Accordingly, it is necessary to control and monitor the stress release and deformation of the rock mass in front of the tunnel face. However, on the whole, these results are more inclined to construction technology and applicable to individual cases, while there are relatively few basic studies.
As an important means for studying geotechnical engineering problems, the tunnel model test is easy to operate and costs relatively less. Moreover, it can avoid certain immature theoretical problems and can directly reflect the deformation law of the rock mass as caused by tunnel excavation and interactions between the surrounding rock and support. Sun et al. (2018) conducted a physical modeling experiment to study the deformation mechanism of a tunnel excavated in deep-buried soft rock strata. Xiang et al. (2018) proposed a transparent soil model test technique and used a particle flow code (3D) numerical simulation to study the influences of the surrounding material (rock and soil) strengths and buried depths on the deformation and failure mechanisms. Hu et al. (2018) proposed a pre-supporting technique denoted the “Freeze-Sealing Pipe Roof method”, which combined a pipe-roofing method with an artificial ground freezing method and an innovative freezing scheme for the first time in China during the construction of the Gongbei Tunnel. Liu et al. (2019) relied on the Daban Mountain tunnel to build a model experiment system with a similarity ratio of 1:37, aiming to obtain the distribution law of a frost front in a cold-region tunnel under ventilation. There have also been great achievements in the study of tunnel face rock mass. Zhang et al. (2020) extended a traditional block theory to tunnels constructed using a tunnel boring machine (TBM) by incorporating a disc cutter–block interaction mechanism. Hao et al. (2021) conducted tests with 32 loading levels using three physical models combined with the numerical simulation to analyze the effect of the major principal stress direction with respect to the tunnel’s long axis on the stability of an underground tunnel. Yu et al. (2021) established a thermo–hydro–mechanical-coupled finite element model and verified it via a model test in the laboratory; then, they used it to consider the failure mode of the lining structure and investigated the influence of the burial depth on the temperature field and soil–lining interaction. Niu et al. (2021) developed a back-analysis method combining a model test and numerical simulation and derived results from the similitude criterion for the model based on similarity theory and elasticity mechanics equations. Zhou et al. (2021) studied the seismic response law of a loess tunnel based on the shaking table model of a 1/40 loess tunnel and considered the adverse conditions from an El-Centro bidirectional seismic wave and rainfall to discuss the damping effect of the loess tunnel structure (e.g., by setting a damping layer). At present, the research on the deformation law of the rock mass in front of the tunnel is not thorough, and on the whole, these results are more inclined to the construction technology and suitable for individual cases, while there is relatively little research on the foundation. Starting from the theoretical research, this study analyzes the deformation law of the square rock mass in front of the tunnel face in high-stress soft rock, makes a detailed study of the deformation characteristics of the core rock mass in front of the tunnel face and the rock around the tunnel by using the method of model test, and finally finds out the control range of the square rock mass deformation in front of the tunnel face.
1) First similarity theorem
If the numerical values of the similarity criterion between two phenomena are the same or the similarity index is 1, then two phenomena satisfy the first similarity theorem. This similarity theorem defines the mathematical relationship between the similarity ratios of each similarity parameter.
2) Second similarity theorem
The second similarity theorem establishes a functional relationship between the similarity criteria of similar phenomena. This leads to the differential equation that similar phenomena should satisfy.
3) Third similarity theorem
The third similitude theorem can be regarded as obtaining the similarity conditions of specific phenomena by adding the single-value conditions of each phenomenon, i.e., by substituting the special solution of the differential equation so that a phenomenon is different from other phenomena.
The aforementioned great similarity theorems have different meanings for workers who solve practical problems. The first similarity theorem is a theoretical concept; the second similarity theorem gives the existence and function of similarity criteria, which are often used to guide practical work. The third similarity theorem provides the necessary and sufficient conditions for the actual model test.
During the model test, the physical phenomena shown by the model should be similar to the prototype structure, i.e., the material, shape, and external load of the model should follow a certain similarity law. A similar scale refers to the ratio of physical quantities of the same dimension between the prototype structure and the model, which is often represented by the letter C.
1) Geometric conditions
The establishment of a model must be scaled according to the actual size of the prototype to achieve geometric similarity. If individual parts or components cannot be geometrically similar owing to the limitations of the test conditions, it should be ensured that their characteristics are similar to those of the prototype.
2) Medium conditions
As the similarity ratios selected for each model test parameter are different, the similarity indexes that should be met between the similarity ratios of geomechanically similar materials are shown in Eqs 1, 2:
The dimensionless similarity constants are all 1, and the similarity constant is CE= 1, so the calculation is shown in Eq. 3:
In the aforementioned equation the following are represented, C.-stress similarity ratio;
3) Boundary conditions and initial conditions
The most difficult task when simulating similar conditions in geomechanics is simulating the stress state of the rock mass. A geological body is in a complex stress environment. To simulate the actual engineering conditions, it is necessary to simulate the initial stress state of the stratum, which requires three-dimensional loading of similar geological bodies. The range of the stress redistribution caused by underground engineering construction is approximately 3–5 times the excavation space. Therefore, the size of the surrounding geological model is at least three times larger than that of the surrounding geological model.
Jianshan tunnel is located in Baiyin City, Gansu Province. The starting and ending mileage is DK277 + 300 ∼ DK283 + 830. The total length of the tunnel is 6530 m. The physical and mechanical parameters of the surrounding rock 2 km away from the starting point of the tunnel are selected as the main parameters of the model test prototype. The surrounding rock within 1700 m of this section is an extremely fragile carbonaceous slate. Considering the influence of initial ground stress, the surrounding rock grade has been revised to grade V, and the average buried depth is 575 m (Figure 1).
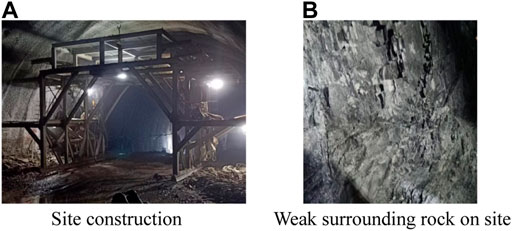
FIGURE 1. Tunnel site conditions. (A) Site construction; (B) weak surrounding rock on the site.
The tunnel site area mainly includes fold and fault structures. The core of the fold structure exists near 2650 m from the beginning of the tunnel, and with an axial direction of 110°, the north occurrence is at W∠36°S and the south occurrence is at N13°W∠32°N. The underground water in the tunnel is formed by infiltration of atmospheric precipitation into the rock fissures and mainly penetrates downward along the fissures of the rock mass. The water abundance of underground water is also poor, and the underground water is unevenly distributed throughout the year. The increase of the underground water level follows a seasonal law: it rises significantly in July, August, and September.
The ground stress field in the tunnel area is obtained using a finite element multiple regression analysis method. From the magnitude of the expansion analysis results, when the lateral pressure coefficient λ = 1.8, the average value of the maximum horizontal principal stress, δH, at the tunnel axis is 15 MPa, and the average values of
When the geometric similarity ratio of the model test is determined, for the qualitative model, it is generally taken as 100–200, and for the quantitative model, it is 20–50. In this test, considering the size of the existing model test box, if it was partially modified, it would not meet the requirements of the boundary conditions; hence, we chose to determine the appropriate similarity ratio according to the existing design.
The maximum width of the proposed tunnel is 6.8 m, the vertical height of the tunnel is 5.8 m, and the designed maximum diameter of the existing model in this study was 14 cm. The geometric similarity scale CL was 50, and the bulk density similarity scale Cγ was 1, according to the similarity index of the geomechanical model test shown in Eq. 4:
Therefore, the similarity ratios of other physical quantities could be calculated as follows:
1) Similarity ratio of stress, modulus of elasticity, and cohesion: Cσ=50, CE =50, Cc=50.
2) Similarity ratios of Poisson’s ratio and internal friction angle:
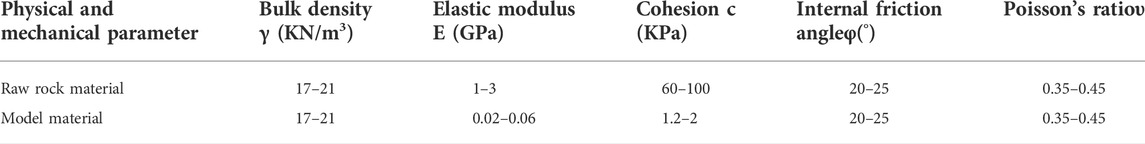
TABLE 1. Value range of material, physical, and mechanical parameters.
Loess and quartz sand were used as the main raw materials, and gypsum and cement were used as cementing materials. Water was used as the regulating agent, and these materials were used as raw materials to develop similar materials for the rock mass (Figure 2).
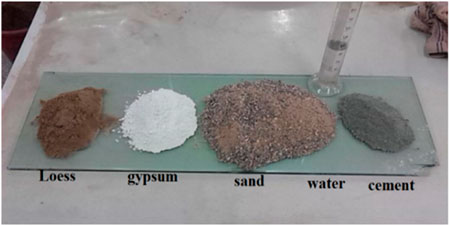
FIGURE 2. Similar materials of the surrounding rock.
In general, in the process of developing similar materials, adding quartz sand can reduce the cohesion of loess and increase the bulk density of similar materials; gypsum can reduce the bulk density of materials; the addition of cement can improve the strength of materials and can still be used as cement when mixed with water.
When there are many factors and multiple tests need to be arranged, orthogonal design is a more commonly used design method, which can skillfully arrange the tests, reduce the number of tests, and shorten the test cycle on the premise of achieving the same statistical effect. Orthogonal design not only considers the balanced dispersion of factor levels but also takes into account the neat and comparable level of factors, which is convenient for analyzing the interaction between factors. Orthogonal design is a method to scientifically arrange and analyze multi-factor and multi-level experiments by using an orthogonal table. The orthogonal table is a standardized table constructed on the basis of Latin square and orthogonal Latin square by applying combinatorial mathematics theory according to the idea of balanced dispersion. It is the basic tool of orthogonal design. The orthogonal test design scheme is shown in Table 2.
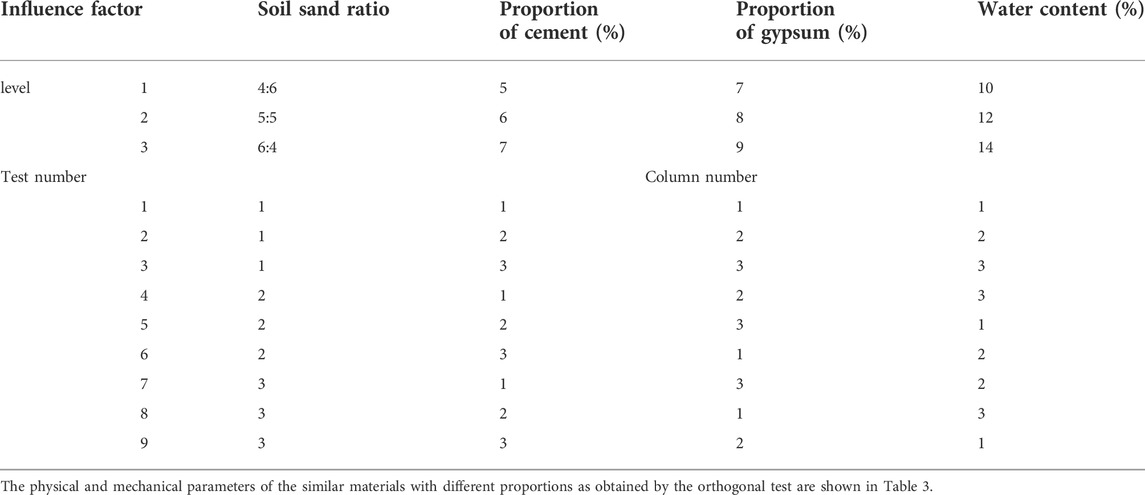
TABLE 2. Orthogonal test design scheme.
According to the aforementioned thought, different soil sand ratios, cement proportions, gypsum proportions, and water contents were selected as the four influencing factors, and three different proportions were selected for each influencing factor. Therefore, an L9 (34) orthogonal table was selected to combine the tests.
According to a comparison of the data in Table 3 and Table 1, it can be seen that the physical and mechanical parameters of the similar materials obtained from test No. 9 are within the theoretical value ranges of the model materials, thereby meeting the design requirements of the model test. Therefore, the proportions of similar materials in test No. 9 were selected as the formula for the similar materials in the model test, i.e., the soil to sand ratio was 6:4, the cement proportion was 7%, the gypsum proportion was 8%, and the water content was 10%.
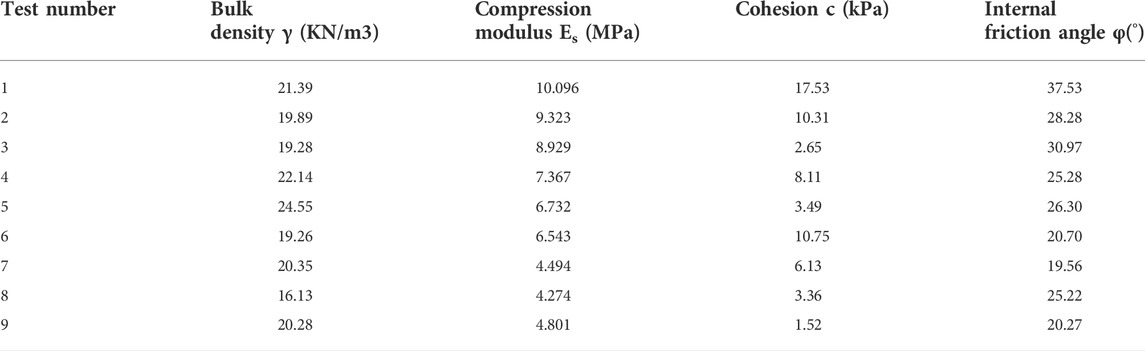
TABLE 3. Physical and mechanical parameters of similar materials with different proportions.
According to the actual project considered in this test, the tunnel width was 13.6 m, the vertical height was 11.6 m, and the proposed geometric similarity scale CL was 50. The final design of the test box size was 200 cm vertically, 200 cm horizontally, and 70 cm longitudinally (Figure 3). The frame of the model box was welded with 12 angle steel, and the six faces were designed as movable steel plates. The tunnel section in the test is approximately circular, and the tunnel diameter was 27.2 cm; this ensured that the tests conducted in the model box could meet the tunnel boundary conditions. This design not only saved a significant amount of cost but also ensured that the test could meet the theoretical requirements.
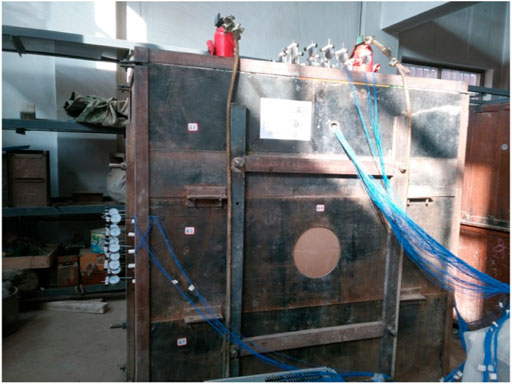
FIGURE 3. Model test box.
To simulate the high ground stress condition of the soft rock tunnel, the model needed to be loaded in three directions. This test adopted a loading mode comprising a combination of a pull rod and jack. The position of the tie rod was on the four corners of each surface of the model box, so there were four pairs of pull rods in the transverse, vertical, and longitudinal directions of the model box; when the rock mass was stressed, the relative panel was moved and pressurized by tightening the pull rod nut (Figure 4A). When the pull rod could not be tightened again, the reaction frame was considered sufficiently supported to load with the jack (Figure 4B). At the same time, the two hydraulic jacks on the top of the model system pass through mutually independent steel ropes (specification: Φ 20) so as to exert reverse load on the internal surrounding rock. In order to avoid the possible deviation and instability of the steel wire rope under its flexibility, the jack base is firmly in contact with the top boundary surface of the model system, and the top of the jack piston is stably placed with channel steel to limit the sliding movement of the steel wire rope.
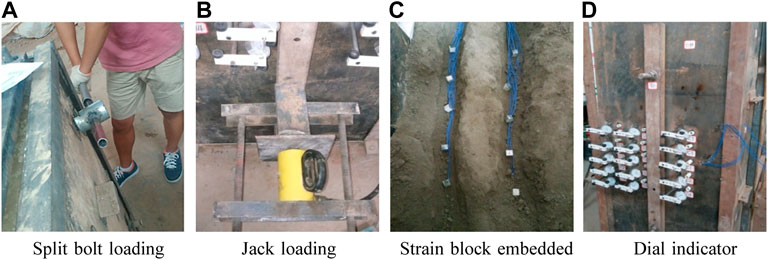
FIGURE 4. Model test loading and stress and deformation monitoring. (A) Split bolt loading; (B) jack loading; (C) strain block embedded; (D) dial indicator installation
The monitoring of the surrounding rock stress was realized by connecting the dh3818 strain gauge with an earth pressure box and strain block (Figure 4C). The earth pressure cell was a strain-type miniature earth pressure box for the model test, and the strain block was a measuring device comprising the nylon block and strain gauge.
The deformation monitoring was the key aspect of the test. The design of the monitoring device was required to allow for the deformation monitoring of the monitoring point without being affected by the surrounding rock mass. The deformation of the tunnel surrounding rock and core rock mass was mostly an inward convergence or longitudinal extrusion deformation. The deformation in other directions was not large, and it was difficult to monitor. Therefore, this test only monitored the convergence deformation of the surrounding rock and extrusion deformation of the core rock mass. In this way, the deformation considered in the test was only the vertical deformation of the vault, the lateral deformation of the wall waist, and the longitudinal deformation of the core rock mass (Figure 4D).
The tunnel excavation speed of the supporting project was 1.75 m per day. According to the proposed similarity ratio conversion, the tunnel excavation speed in the test was 7 cm per hour. The longitudinal length of the model test box was 100 cm. The monitoring section was set at the middle position (50 cm). The other sections were selected as the longitudinal 5 cm, 20 cm, 50 cm, and 65 cm positions of the model (Figure 5).
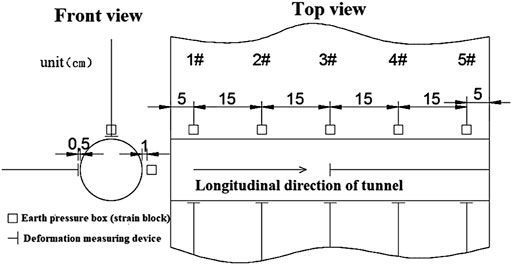
FIGURE 5. Monitoring section and monitoring device distribution.
Each section was equipped with two stress monitoring devices and two deformation monitoring devices, and their respective positions were located at the vault and wall waist of the tunnel. Because the stress and deformation of the arch crown section needed to be monitored simultaneously, the earth pressure box (strain block) and the deformation-monitoring device were staggered by 1 cm; owing to the symmetry of the wall waist, the earth pressure box (strain block) is arranged on one side, and the deformation-monitoring device was arranged on the other side. In addition, a deformation-monitoring device was arranged at the center of the face of the No. 3 section to monitor the longitudinal extrusion deformation of the core rock mass of the tunnel.
1) Test method
After the test bench was filled with similar materials in the layers, compacted, and implanted with the stress- and deformation-monitoring device, loading was started, and the stress collection work was performed simultaneously. When the stress measured by the earth pressure box (strain block) reaches the test design value, it was considered that the surrounding rock had reached the designed initial stress state.
In the process of the test, it was found that the boundary conditions had great influence on the 1 # and 5 #sections. The deformation of the rock mass monitored at section 1 # was excessively large, and the tunnel excavation was completed when the rock mass deformation of section 5 # was very small, so the monitoring was not complete. Therefore, only the monitoring data of each measuring point of sections 2 #, 3 #, and 4 # were recorded, and the change of each footage excavation focused on the shape value.
2) Experimental comparison
To compare and study the deformation of the tunnel rock mass under different stress states of the surrounding rock with and without a lining, a double-layer wire mesh was selected as a lining-similar material, and the support was employed during excavation and jacking.
To study the deformation law of the rock mass under different stress states, the designed initial stress state of the rock mass had five groups: 0.1 MPa, 0.2 MPa, 0.3 MPa, 0.4 MPa, and 0.5 MPa, and each group was set with and without a lining.
3) Test arrangement
The divisional excavation method was used for tunnel excavation (Figure 6). In each group of test excavation, a constant speed of 7 cm per hour (1.75 m per day in actual engineering according to the proposed similarity ratio) was maintained (Figure 6A), and deformation and stress values were collected once for each excavation distance; among them, the lining test (Figure 6B) pushed the wire mesh lining to a certain distance for each distance.
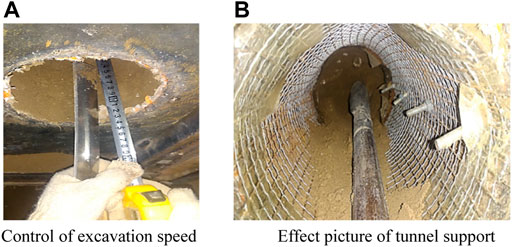
FIGURE 6. Test arrangement. (A) Control of excavation speed; (B) effect picture of tunnel support.
Mentioned in his 2011 book ADECO-RS (Analysis of Controlled Deformation-Rock and Soil), Pietro Lunardi proposed the “New Italian Tunneling Method”, where the core of this method is to strengthen the rock and soil mass in front of the tunnel face in advance and improve its stiffness so as to control the deformation of the rock and soil mass in front of the tunnel face. In this approach, all deformations of the surrounding rock and instabilities caused by deformation are directly or indirectly related to the strength of the core rock mass in front of the face. The longitudinal extrusion deformation of the core rock mass in front of the tunnel face and surrounding rock pre-convergence should be included in the study of the deformation law, and the deformation analysis should be extended to a three-dimensional space.
Figure 7 shows the deformation of the tunnel vault and wall waist with and without the lining and the longitudinal extrusion deformation curve of the core rock mass at section 3 #.
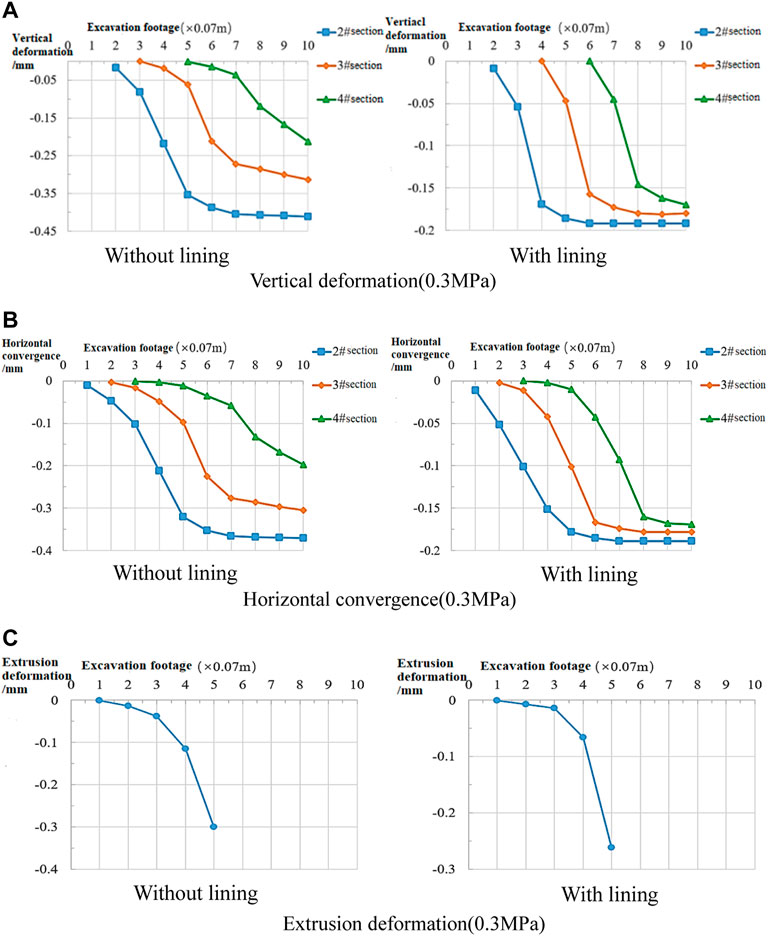
FIGURE 7. 0.3 MPa test results. (A) Vertical deformation (0.3 MPa); (B) horizontal convergence (0.3 MPa); (C) extrusion deformation (0.3 MPa).
From the deformation curve of the surrounding rock, it can be seen that the deformation of section 2# is larger than that of section 4#. The longitudinal design length of the model is 0.7 m, the position of section 2# is 0.2 m, section 3# is the middle (0.35 m), and section 4# is at 0.5 m; from the beginning of tunnel excavation to the excavation of section 2#, the stress in the entire model concentrates on the excavated side, resulting in a large deformation of section 2#; section 4# is in the second half of the model, and the rock mass to be excavated is only 0.2 m. With the excavation of the tunnel, the stress release of the surrounding rock in the model is large, so the deformation value measured in theory is too small and does not conform to the actual situation. Therefore, this study should be mainly based on the deformation law of the rock mass with section 3#, and section 2# and section 4# should correspond to the entrance and exit sections of the tunnel, respectively.
By comparing the data extracted from the map, it can be concluded that the tunnel rock mass begins to deform at the position of 14–28 cm (0.5 D–1 D, where D is the tunnel diameter) in front of the tunnel without the lining. The position where the lining test begins to deform is 7–28 cm (0.26 D–1 D) in front of the tunnel. The extrusion deformation of the core rock mass starts to deform at 1 D in front of the tunnel face regardless of whether there is a lining or not, which indicates that the size and range of the disturbance area of the rock mass in front of the tunnel face are not significantly different under the conditions of lining or not. According to this changing trend, the tunnel deformation is divided into six regions for discussion, as follows:
1) Rock mass beyond 0.5 D in front of the tunnel
The results show that the pre-convergence deformation of the arch crown and wall waist at 0.5 D in front of the tunnel is very small. The test on the vault with the lining does not detect the trend of deformation; however, the central position of the core rock mass has a relatively evident extrusion deformation. The extrusion deformation of the core rock mass measured in the lining test is 0.024 mm smaller than that in the non-lining test. Because the deformation of the rock mass at this position is very small, it is impossible to judge whether the lining affects the rock mass deformation in front of the tunnel.
2) 0.5 D—0.26 D rock mass in front of the tunnel
At the position 0.26 D away from the heading face, the rock mass is greatly disturbed, and the deformation is evident relative to that at 0.5 D away from the face. The results show that the extrusion deformation of core rock mass in the lining test is greater than that of wall waist, but the difference between them is small; however, the extrusion deformation of the core rock mass in a non-lining test is much larger than that of the arch crown and wall waist, i.e., 6.39 and 2.35 times of that of the arch crown and wall waist, respectively. It can be seen that the extrusion deformation of the tunnel face at the 0.26 D position in front of the tunnel becomes much larger than the pre-convergence of the surrounding rock in the section of the main deformation.
3) Rock mass of 0.26 D—face in front of the tunnel
In the tunnel face, the vertical displacement in the test of the vault with the lining is smaller than that of the test for the unlined vault, whereas the lateral displacement of the wall waist has no significant difference whether under the condition of a lining or not. The extrusion deformation of the core rock mass in this section is still far greater than the pre-convergence deformation of the surrounding rock. The extrusion deformation value of the core rock mass in the non-lining test is 4.92 and 3.06 times that of the arch crown and wall waist, respectively, and is 5.57 and 2.59 times of those in the lining test, respectively. The extrusion deformation of the core rock mass in the lining test is only 13% less than that in the unlined test. The results show that the core rock mass extrusion deformation remains the largest part of the tunnel advance deformation, and the influence of the lining 0.26 D away from the tunnel face on the core rock extrusion deformation is very small.
4) Tunnel face position—the 0.26 D surrounding rock section behind the face
In this section, the deformation rate of the tunnel vault is fast, and the vertical deformation value of the surrounding rock of section 2# with or without the lining exceeds the lateral deformation value of the wall waist; although the lining test is not supported in this section, it can be seen that the surrounding rock deformation in this section is 23%–29% smaller than that in the unlined test and that the surrounding rock deformation has been controlled to a certain extent.
5) 0.26 D–0.5 D surrounding rock section behind the face
In this section, the deformation rate of the surrounding rock of the arch crown is still greater than that of the wall waist, and the deformation of the surrounding rock of section 2# is still greater than that of the wall waist. Although the deformation values of other sections are less than those of the wall waist, the deformation value of the surrounding rock in this section is reduced by 36%–47% compared with that without lining, so the deformation of the surrounding rock is obviously controlled.
6) 0.5 D—1 D surrounding rock section behind the face
The results show that the vertical deformation of the surrounding rock at each section exceeds the lateral deformation of the wall waist. The deformation of the surrounding rock in the lining test is reduced by 42%–53% compared with that in the non-lining test, and the surrounding rock deformation control effect is better.
In conclusion, the longitudinal extrusion deformation of the rock mass in front of the tunnel is the most important part of the tunnel’s advanced deformation. The results show that the extrusion deformation at the central position of the tunnel face when the tunnel face reaches the lining is equivalent to the final deformation value when the tunnel vault and wall waist are stable, whereas those in the non-lining test are 1.45 and 1.47 times of the final deformation values of the vault and the wall waist, respectively. The results show that the extrusion deformation of the core rock mass is the most serious part of the advanced deformation of a soft rock tunnel with high ground stress, and its deformation should be paid significant attention. At 0.26 D away from the face, the core rock mass in front of the tunnel begins to produce an evident longitudinal extrusion deformation and shows a large deformation rate in the rock section from 0.26 D to the face. Therefore, to control the extrusion deformation of the core rock mass of the tunnel, the strength of the rock mass from the face to the front 0.26 D should be strengthened.
To study the change of the tunnel rock mass deformation law after increasing or reducing the initial ground stress, the maximum ground stress is increased and decreased, respectively. In this test, according to the initial test arrangement, lined and unlined tests are conducted, and the rock deformation laws are compared and analyzed in detail.
1) Analysis of the deformation law of the rock mass after stress increases
It can be seen from Figure 8 that the deformation of each part of the rock mass increases with an increase in the stress. The results show that the deformation of the arch crown increases from 0.314 mm to 0.363 mm, i.e., by 16%, that of the wall waist increases from 0.305 mm to 0.369 mm, i.e., 21%, and the extrusion deformation of the core rock mass increases from 0.300 mm to 0.410 mm, i.e., 37%. In the lining test, the deformation of the vault increases from 0.181 mm to 0.245 mm, i.e., 35%, that of the wall waist increased from 0.178 mm to 0.240 mm, i.e., also by 35%, and the extrusion deformation of the core rock increased from 0.262 mm to 0.356 mm, i.e., 36%.
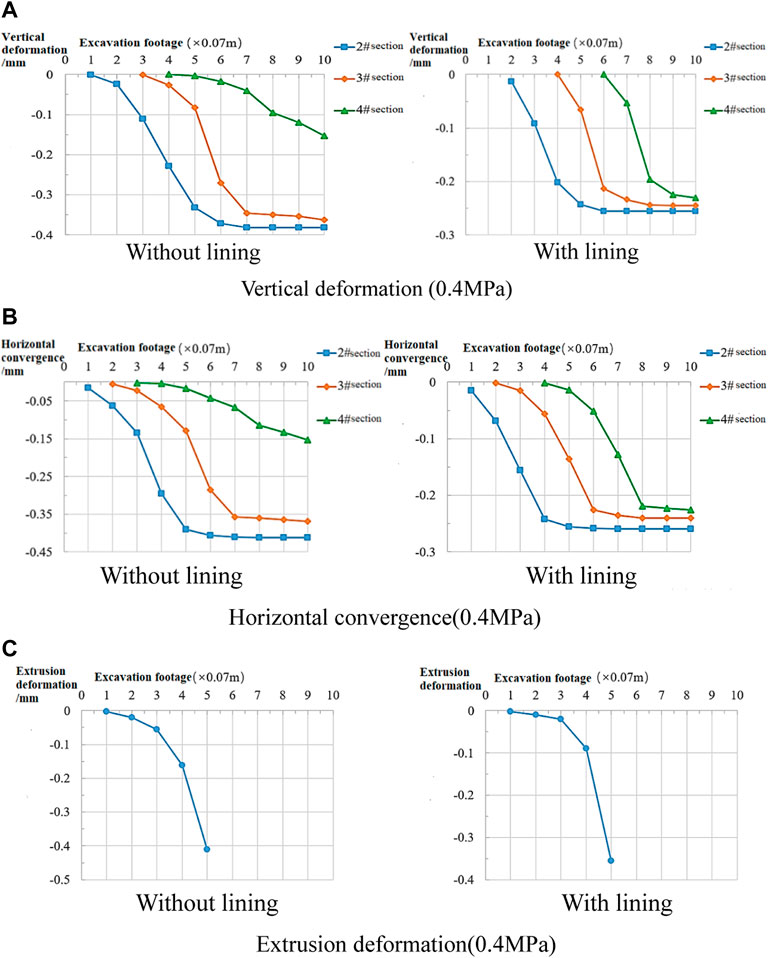
FIGURE 8. 0.4 MPa test results. (A) Vertical deformation (0.4 MPa); (B) horizontal convergence (0.4 MPa); (C) extrusion deformation (0.4 MPa).
Figures 7–9 show that the deformation of each part of the rock mass increases with the increase of stress, and the proportion of advanced deformation also increases. However, the proportion of advanced deformation of section 2 # increases evidently, whereas that of section 4 #decreases. It can be seen that the release of the stress in the whole geological body tends to transfer to the excavation side, so the deformation rate of the rock mass in the first half of the tunnel excavation is faster, and the deformation value is larger. After the stress increases, the core rock mass extrusion deformation remains the most evident part of the tunnel surrounding rock advanced deformation. The analysis shows that a large part of the tunnel’s advanced deformation is represented by extrusion of the core rock mass; therefore, with the increase of the advanced deformation of each part, the extrusion deformation of the core rock mass will evidently increase.
2) Analysis of the deformation law of the rock mass after stress decrease
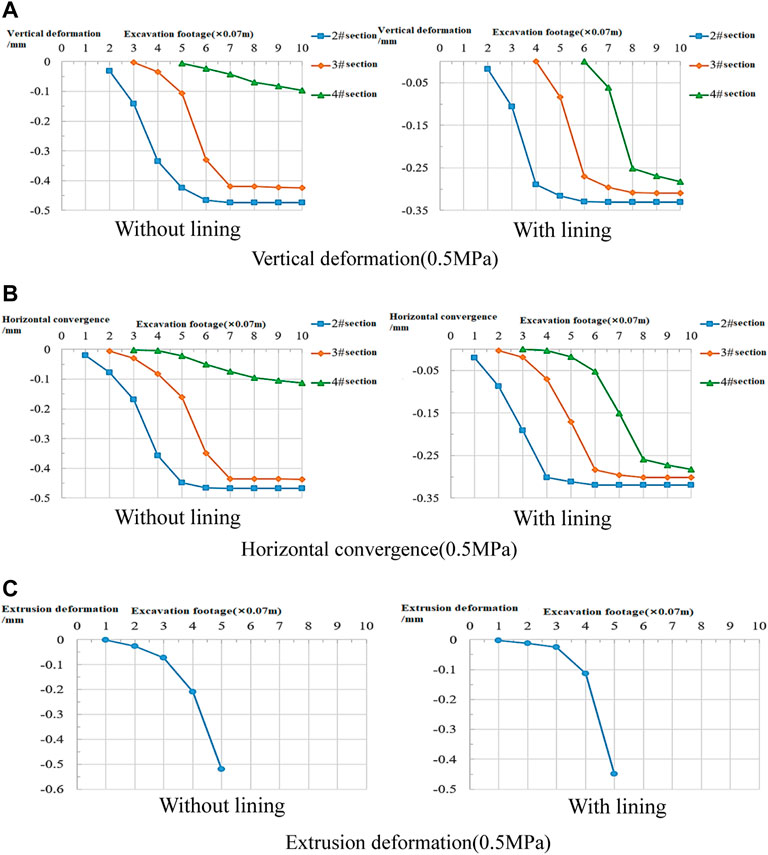
FIGURE 9. 0.5 MPa test results. (A) Vertical deformation (0.5 MPa); (B) horizontal convergence (0.5 MPa); (C) extrusion deformation (0.5 MPa).
Figure 10 shows that after a reduction of the ground stress, the deformation of the arch crown in the 3# section without the lining decreases by 20% from 0.314 mm to 0.250 mm, and that of the wall waist decreases by 25% from 0.305 mm to 0.230 mm; the extrusion deformation of the core rock mass decreases from 0.300 mm to 0.192 mm, i.e., by 36%. In the lining test, the deformation of the vault is reduced from 0.181 mm to 0.115 mm, i.e., by 36%; the wall waist is reduced from 0.178 mm to 0.115 mm, i.e., by 35%; the extrusion deformation of the core rock mass is reduced from 0.262 mm to 0.168 mm, i.e., by 36%.
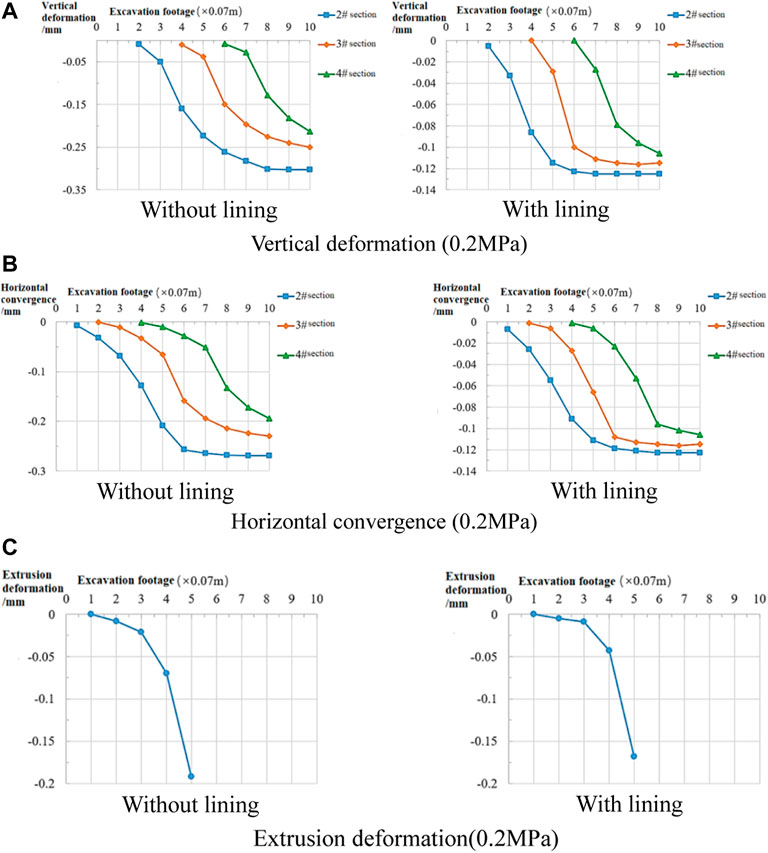
FIGURE 10. 0.2 MPa test results. (A) Vertical deformation (0.2 MPa); (B) horizontal convergence (0.2 MPa); (C) extrusion deformation (0.2 MPa).
Figure 11 shows that when the initial stress decreases, the deformation of each part of the rock mass decreases and the proportion of the advanced deformation also decreases. The disturbed range of the rock mass in front of the tunnel is shortened from 1D to 0.9 D, and the disturbance range is evidently reduced. Compared with the situation in which the disturbance area of the rock mass is within 1D in front of the face after the increase of initial stress, it can be found that under the stable condition of the tunnel, the disturbance range in front of the face does not expand with the increase of the initial stress. The main reason is that the deformation of the core rock mass in front of the face is limited. With the increase in the distance from the face, the disturbed rock mass compresses the core rock mass in the process of stress release. The higher the ground stress, the greater the extrusion effect (which controls the extrusion deformation of the core rock mass). Further analysis shows that the deformation of the core rock mass is controlled in the position close to the face. Simultaneously, the longitudinal bearing arch of the rock mass in front of the tunnel is also formed and prevents the extrusion deformation of the core rock mass from expanding to a larger range.
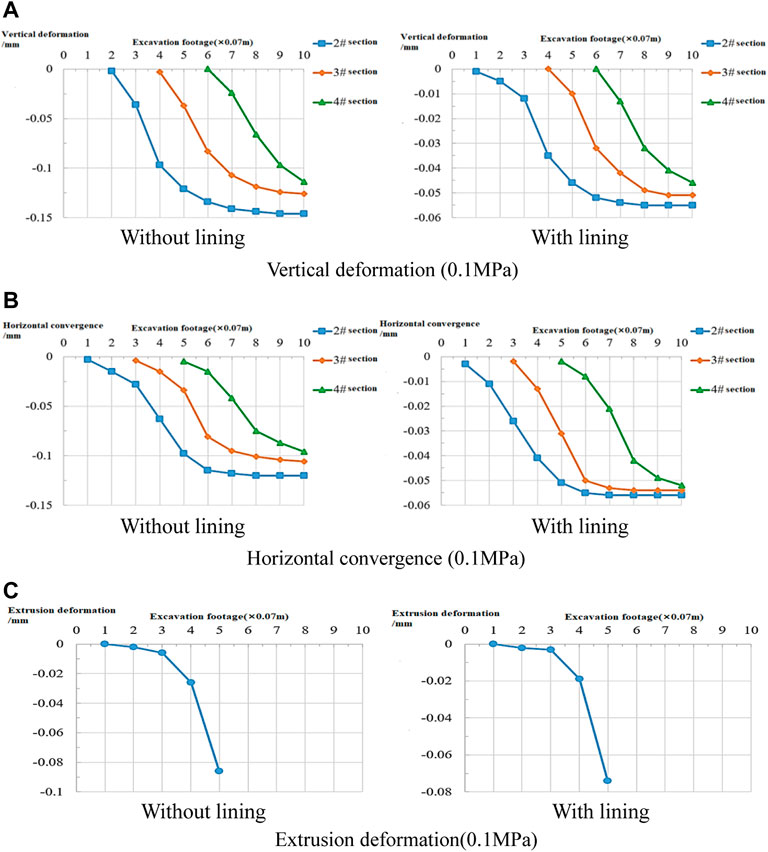
FIGURE 11. 0.1 MPa test results. (A) Vertical deformation (0.1 MPa); (B) horizontal convergence (0.1 MPa); (C) extrusion deformation (0.1 MPa).
Based on the results of this test, a tunnel with the same section should have such an “ultimate longitudinal bearing arch” so that even under a higher initial stress environment, the maximum range of the rock disturbance caused by tunnel excavation to the rock mass in front of the tunnel is also on the inner side of the “ultimate longitudinal bearing arch.” The “ultimate longitudinal bearing arch” is actually the maximum upper limit of deformation that can be borne. The existence of the “ultimate longitudinal bearing arch” prevents the advanced deformation from expanding to a wider range and effectively controls the expansion of the extrusion deformation of the core rock mass to the front. From this test, the “ultimate longitudinal bearing arch” of the tunnel should be approximately 1D in front of the tunnel face.
1) Analysis of deformation proportion of the surrounding rock in each part
It can be seen from Figure 12 that with an increase in the initial stress of the surrounding rock, the pre-convergence deformation of the surrounding rock has an evident increasing trend, and its law is evident. The ratio of the pre-convergence deformation value of the non-lining test arch crown to the final deformation value is between 16% and 28%, and with the increase of the initial stress, the proportion of the wall waist pre-convergence deformation value to the final deformation value is between 27% and 36%. The analysis shows that owing to the large transverse stress of the tunnel in this test, the final deformation of the vault and wall waist under different stress states is not different, but the proportion of the pre-convergence of the surrounding rock in the final deformation value is different by 8%–11%, leading to a larger proportion of advance deformation in the direction of the greater surrounding rock stress.
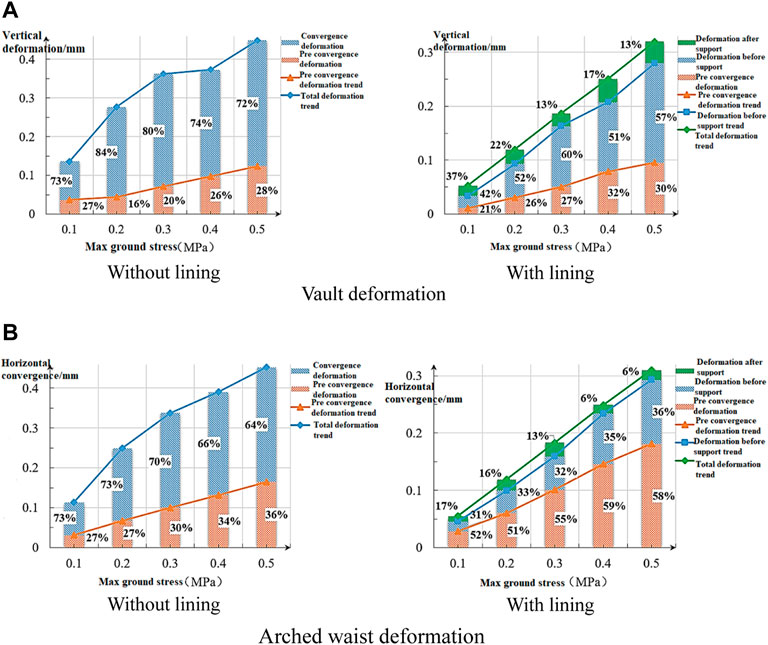
FIGURE 12. Deformation trend of the vault and arched waist under different stress states. (A) Vault deformation; (B) arched waist deformation.
The pre-convergence deformation of the arch crown with the lining is less than that without the lining. However, because the deformation of the surrounding rock is controlled by the lining, the proportion of the pre-convergence deformation in the final deformation value increases to 21%–32%. The pre-convergence deformation value of the wall waist is greater than that of the wall waist without the lining and accounts for 51%–59% of the final deformation value. This shows that after the deformation of the surrounding rock behind the face is controlled, the release of surrounding rock stress shifts to the unsupported section and front of the face, leading to the increase in the advanced deformation value of the surrounding rock.
In addition, the final convergence deformation of the surrounding rock of the tunnel with the lining is significantly smaller than that of the tunnel without the lining. After the lining, the convergence deformation of the vault only accounts for 13%–22% of the total deformation value, and the wall waist convergence deformation value only accounts for 6%–17% of the total deformation value. It can be seen that with the increase of the initial stress, the proportion of the convergence deformation value of the surrounding rock to the total deformation has a decreasing trend; this shows that the deformation rate of the surrounding rock is related to the stress of the stratum and that the deformation rate of the surrounding rock is evidently accelerated after the increase of initial stress. Therefore, the deformation of the surrounding rock under a high-stress state has already been completed before the lining with the same construction method. In practical engineering, tunnel support should be provided at a reasonable time, i.e., according to the different ground stress values.
2) Control of the surrounding rock deformation by the lining
It can be seen from Table 4 that the convergence deformation of the surrounding rock after the lining is well-controlled. The convergence deformation of the transverse arch waist with larger stress values decreases by 52.9%–68.1%, and that of the vertical vault with smaller stress values decreases by 29.2%–59.4%. It can be seen that the lining evidently controls the deformation of the surrounding rock, especially in the direction of large stress.
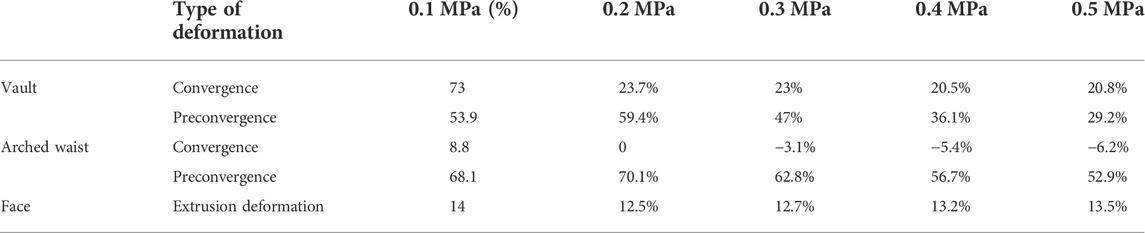
TABLE 4. Proportion of the reduced deformation value of the surrounding rock after lining.
With the increase of the initial stress, the proportion of the lining controlling the convergence deformation of the surrounding rock decreases; this is caused by the same construction method under different conditions and leads to a missed support opportunity. Accordingly, the timing of support construction should be strictly controlled in such projects. In this test, the pre-convergence deformation of the surrounding rock of the arch crown is reduced by 20.5%–23.7%, that of the wall waist is reduced by 6.2%–8.8%, and the extrusion deformation of the core rock mass is reduced by 12.5%–14%. After lining, the deformation of the surrounding rock in this section is controlled, and the rock mass tends to be stable, simultaneously, owing to the concentration of rock stress caused by excavation of the excavation site, the surrounding rock in the section without the lining and in a certain range in front of the tunnel is compressed longitudinally. The shear strength of the surrounding rock in each section of the tunnel in this section is larger than that in the test without the lining, so the advanced deformation is smaller than in the test without the lining test. Owing to the control of the longitudinal stress release in the direction of larger stress, the pre-convergence deformation of the surrounding rock (arch waist) in this direction increases.
This study considers the deformation law and deformation control of the rock mass in front of a tunnel in high-ground stress soft rock. The deformation characteristics of the core rock mass in front of the tunnel face and the surrounding rock mass around the tunnel are studied in detail by means of model tests, and the control range of the rock mass deformation in front of the tunnel is identified. The conclusions are as follows:
1) Loess and sand are used as the main aggregates, cement and gypsum are used as the cementing agents, and water is used for mixing. According to the orthogonal test, the physical and mechanical parameters of the similar materials of the grade V surrounding rock under the final ratio meet the requirements of the indoor model test under similar ratios and have the advantages of easy access to the basic materials, along with easy preparation, processing, and maintenance; moreover, these materials are economic and reasonable and harmless to the environment.
2) At a certain position in front of the tunnel, the core rock mass is compressed and compacted after being subjected to the stress concentration caused by tunnel excavation from the stratum, and a longitudinal bearing arch is formed at this position. This arch effectively controls the expansion of the extrusion deformation of the core rock mass to the front. The higher the stress state, the stronger the extrusion effect caused by the stress concentration; accordingly, it is inferred that there is an “ultimate longitudinal bearing arch” at a certain position in front of the tunnel face under the higher stress state, which prevents the extrusion deformation of the core rock mass of the tunnel with the same section from exceeding the scope of the bearing arch even under larger initial stress conditions. According to the analysis of the test, the “ultimate longitudinal bearing arch” of the tunnel should be formed at approximately 1D in front of the tunnel face.
3) The pre-convergence deformation of the lining test tunnel is smaller than that of the non-lining test tunnel, and the lining has a certain control effect on the advanced deformation of the tunnel. This is because in the lining test, the surrounding rock of the lining section tends to be stable after the lining construction, and owing to the stress concentration caused by the excavation, the surrounding rock in the surrounding rock section without the lining and the surrounding rock in front of the tunnel in a certain range are compressed longitudinally. This improves the shear strength of the surrounding rock of each section of the tunnel in this section and makes the pre-convergence deformation smaller than that of the test without the lining.
4) The deformation rate of the tunnel rock mass accelerated with an increase of the initial stress, and a reasonable time should be selected for the construction of tunnel support. Under a low-stress condition, the surrounding rock can bear a large part of the stress concentration caused by tunnel excavation by its strength, thereby making the stress release slow; however, after the initial stress increases, the deformation rate of the surrounding rock accelerates, so support should be provided as soon as possible. Therefore, a reasonable time should be chosen according to the different ground stress states.
The raw data supporting the conclusions of this article will be made available by the authors, without undue reservation.
All the authors contributed to this manuscript. Conceptualization and writing, ZF and ZZ; methodology, FX and ZH; investigation, XG and CM; resources, ZZ. All authors have read and agreed to the published version of the manuscript.
This work is funded by the National Science Foundation of China (Grant No. 51978424), S & T program of Hebei Province in China (Grant No: 22375416D), Hebei Natural Science Foundation Project (Grant No. E2022210040), and the Key Project of China Railway Construction Corporation Limited Science and Technology (Grant No:2019-A05).
The authors declare that the research was conducted in the absence of any commercial or financial relationships that could be construed as a potential conflict of interest.
All claims expressed in this article are solely those of the authors and do not necessarily represent those of their affiliated organizations, or those of the publisher, the editors, and the reviewers. Any product that may be evaluated in this article, or claim that may be made by its manufacturer, is not guaranteed or endorsed by the publisher.
A Kovacevic, M. S., Bacic, M., Gavin, K., and Stipanovic, I. (2021). Assessment of long-term deformation of a tunnel in soft rock by utilizing particle swarm optimized neural network. Tunn. Undergr. Space Technol. 110, 103838. doi:10.1016/j.tust.2021.103838
Chen, Z. Q., He, C., Wang, J., and Ma, C. C. (2021). Time-dependent squeezing deformation mechanism of tunnels in layered soft-rock stratum under high geo-stress. J. Mt. Sci. 18, 1371–1390. doi:10.1007/s11629-020-6356-0
Cheng, L., Liu, Y. R., Pan, Y. W., Yang, Q., and Lv, Z. (2018). Effective stress law for rock masses and its application in impoundment analysis based on deformation reinforcement theory. J. Cent. South Univ. 25, 218–229. doi:10.1007/s11771-018-3731-x
Hao, X. J., Zhang, Q., Sun, Z. W., Wang, S. H., Yang, K., Ren, B., et al. (2021). Effects of the major principal stress direction respect to the long axis of a tunnel on the tunnel stability: physical model tests and numerical simulation. Tunn. Undergr. Space Technol. 114, 103993. doi:10.1016/j.tust.2021.103993
Hu, X. D., Fang, T., Chen, J., Ren, H., and Guo, W. (2018). A large-scale physical model test on frozen status in freeze-sealing pipe roof method for tunnel construction. Tunn. Undergr. Space Technol. 72, 55–63. doi:10.1016/j.tust.2017.10.004
Liu, L. L., Li, Z., Liu, X. Y., and Li, Y. Y. (2019). Frost front research of a cold-region tunnel considering ventilation based on a physical model test. Tunn. Undergr. Space Technol. 77, 261–279. doi:10.1016/j.tust.2018.04.011
Ma, C. D., Xu, J. Q., Tan, G. S., Xie, W. B., and Lv, Z. H. (2021). Research on supporting method for high stressed soft rock roadway in gentle dipping strata of red shale. Minerals 11, 423. doi:10.3390/min11040423
Niu, H. S., Weng, X. L., Tian, C., and Wang, D. (2021). Model test and back analysis of shield tunnel load distribution in soft clay. Adv. Mater. Sci. Eng. 2021, 1–15. doi:10.1155/2021/9992348
Sengani, F. (2020). Characterisation of rock fracturing ahead of the preconditioned mining faces in a hard rock mining. Arab. J. Geosci. 13, 670. doi:10.1007/s12517-020-05720-0
Sun, X. M., Chen, F., Miao, C. Y., Song, P., Li, G., Zhao, C. W., et al. (2018). Physical modeling of deformation failure mechanism of surrounding rocks for the deep-buried tunnel in soft rock strata during the excavation. Tunn. Undergr. Space Technol. 74, 247–261. doi:10.1016/j.tust.2018.01.022
Xiang, Y. Z., Liu, H. L., Zhang, W. G., Chu, J., Zhou, D., and Xiao, Y. (2018). Application of transparent soil model test and DEM simulation in study of tunnel failure mechanism. Tunn. Undergr. Space Technol. 74, 178–184. doi:10.1016/j.tust.2018.01.020
Yang, F. J., Zhang, C. Q., Zhou, H., Liu, N., Zhang, Y., Azhar, M. U., et al. (2017). The long-term safety of a deeply buried soft rock tunnel lining under inside-to-outside seepage conditions. Tunn. Undergr. Space Technol. 67, 132–146. doi:10.1016/j.tust.2017.05.004
Yu, Y., Ling, X. Z., Tang, L., Han, X., Geng, L., and Wei, S. W. (2021). Preliminary identification of the failure mode of shallow tunnels in soil subjected to frost heave: Model test and numerical simulation. Transp. Geotech. 29, 100555. doi:10.1016/j.trgeo.2021.100555
Zhang, J. H., Zhang, L. Y., Wang, W. J., Zhang, D. B., and Zhang, B. (2020). Probabilistic analysis of three-dimensional tunnel face stability in soft rock masses using Hoek-Brown failure criterion. Int. J. Numer. Anal. Methods Geomech. 44, 1601–1616. doi:10.1002/nag.3085
Zhang, Z. X., Wang, S. F., Huang, X., and Rostami, J. (2019). Application of block theory for evaluating face stability under disc cutters loading of TBM, case study of a water-conveyance tunnel project. Tunn. Undergr. Space Technol. 90, 249–263. doi:10.1016/j.tust.2019.05.002
Keywords: similar materials, model test, soft rock, deformation law, different ground stresses
Citation: Zhu Z, Fang Z, Xu F, Han Z, Guo X and Ma C (2022) Model test study on the rock mass deformation law of a soft rock tunnel under different ground stresses. Front. Earth Sci. 10:962445. doi: 10.3389/feart.2022.962445
Received: 06 June 2022; Accepted: 20 July 2022;
Published: 22 August 2022.
Edited by:
Shuren Wang, Henan Polytechnic University, ChinaReviewed by:
Wanjun Ye, Xi’an University of Science and Technology, ChinaCopyright © 2022 Zhu, Fang, Xu, Han, Guo and Ma. This is an open-access article distributed under the terms of the Creative Commons Attribution License (CC BY). The use, distribution or reproduction in other forums is permitted, provided the original author(s) and the copyright owner(s) are credited and that the original publication in this journal is cited, in accordance with accepted academic practice. No use, distribution or reproduction is permitted which does not comply with these terms.
*Correspondence: Zhichun Fang, ZmFuZ3poaWNodW43NzdAMTI2LmNvbQ==
Disclaimer: All claims expressed in this article are solely those of the authors and do not necessarily represent those of their affiliated organizations, or those of the publisher, the editors and the reviewers. Any product that may be evaluated in this article or claim that may be made by its manufacturer is not guaranteed or endorsed by the publisher.
Research integrity at Frontiers
Learn more about the work of our research integrity team to safeguard the quality of each article we publish.