 Jianquan Ma1,2
 Juncheng Yang
 Shibo Li
- 1College of Geology and Environment, Xi’an University of Science and Technology, Xi’an, China
- 2Shaanxi Provincial Key Laboratory of Geological Support for Coal Green Exploitation, Xi’an, China
- 3Shaanxi 185 Coal Field Geology Co., Ltd., Yulin, China
The multi-level disturbance of underground and surface caused by coal mining activities intensifies the deterioration of the ecological environment in the mining area. Among them, the uneven settlement caused by coal mining is the most intuitive manifestation of surface environmental damage. The uneven settlement in the mining area has the characteristics of large settlement magnitude and severe deformation. Therefore, based on 15 Sentinel-1A image data, this paper uses three methods: SBAS InSAR, continuous D-InSAR and offset tracking technology to monitor the surface deformation of the mining area. The results show that the continuous D-InSAR technology SBAS-InSAR technology is applied to the small deformation in the edge area of the subsidence basin. The mining area with low gradient subsidence of SBAS-InSAR can obtain better performance than continuous D-InSAR technology. The offset tracking technique is used to monitor the large gradient deformation in the center of the subsidence basin. Therefore, this paper proposes to expand the quantitative analysis through the spatial coherence threshold and the accuracy and successful image elements of the interference fringe displacement. Combine the advantages of the three methods and overcome the shortcomings of each method, fuse the deformation information of the three methods, and obtain the deformation law of the whole surface subsidence. The results show that the mean absolute error (MAE1-1) of continuity D-InSAR is 0.92 m, the mean absolute error (MAE2-1) of SBAS-InSAR is 0.94 m, and the mean absolute error (MAE3-1) of Offset-tracking is 0.25 m. The results of this fusion method are in good agreement with the measured data, and the mean absolute error (MAE4-1) of vertical displacement is 7 cm. Therefore, the fusion method has advantages over individual methods and provides a new idea in monitoring the large gradient deformation of coal mining subsidence in mining areas.
Introduction
The intense coal mining has brought about a large number of ecological and environmental problems, especially in some areas with fragile native ecological environments. On top of that, the multi-level disturbance of both underground and surface by coal mining production activities has aggravated the deterioration of the ecological environment in mining areas (Du and Song, 2022; Li et al., 2022), while the uneven settlement caused by coal mining is regarded as the most intuitive manifestation of surface environmental damage (Hu Z. et al., 2014; He et al., 2016). Uneven subsidence causes also severe damage to both infrastructure and buildings and can endanger human life and property. It is interesting to notice that between 1949 and 2002, the total area of ground subsidence caused by coal mining only in China exceeded 700,000 ha, with consequent economic losses of more than 50 billion RMB equivalent to $7 billion (Yao et al., 2021). Therefore, it is quite important to explore a large-scale monitoring method for studying the surface deformation in mining areas with longer time series and a high degree of accuracy.
Nowadays, the traditional technical means of monitoring coal mine subsidence mainly use Global Navigation Satellite System (GNSS) measurements, as well as geodesy. The comparative advantage of these methods is that they can provide a high degree of accuracy, in terms of geographic location, and higher accuracy in monitoring single point deformation. However, their inherent limitations cannot be avoided. More specifically, they are (1) labor-intensive, time-consuming, and costly, while the maintenance of a good state of monitoring signs for a long time is difficult. (2) The investigation team must enter the monitored area, which significantly increased the difficulty and risk of the task. (3) The monitoring points are sparsely distributed and few in number, whereas the accuracy of the monitoring results is limited by the reasonableness of the deployment of the GNSS points. (4) They exhibit low spatial resolution. The mine area has a lot of vegetation and the terrain is undulating. Moreover, the field of view is limited, and the line-of-sight length of the level measurement limits the spatial resolution. (5) The employed traditional measurement technology means in the spatial deformation distribution induced a change in the measured pattern and the historical succession information process is difficult to effectively monitor large-scale regional (Ma et al., 2016).
With further improvements in remote sensing and image processing, the potential of remote sensing technology for Earth observation was explored. Along these lines, in 1969, Interferometric Synthetic Aperture Radar (InSAR) was initially applied to extract the digital elevation model (DEM) data (Rabus et al., 2003). The Differential Interferometric Synthetic Aperture Radar (D-InSAR) technique is an extension of the InSAR technology. In 1996, Carnec et al. (1996) captured the slow subsidence of the ground surface caused by underground coal resource mining by using the D-InSAR technology. The D-InSAR technique was first applied to monitor subsidence deformation due to coal mining and proved a feasible method to obtain the surface deformation. Compared with the traditional method, the D-InSAR approach has the advantages of all-weather, all-time, wide spatial coverage, as well as low labour intensity and cost. Due to the working characteristics of the D-InSAR technology, it has been widely applied to monitor various types of deformations including large-scale urban land deformation information (Qu et al., 2014; Xiong et al., 2021), seismic deformation (Békési et al., 2021; Li et al., 2021), landslide deformation (Liu et al., 2016; Bekaert et al., 2020), coal mining subsidence (Kim et al., 2021; Modeste et al., 2021), volcanic deformation (Wang et al., 2018; Di Traglia et al., 2021) building deformation displacement of significant nature (Bayik et al., 2021; Ruiz-Armenteros et al., 2021) and other fields.
In mining areas, surface deformation is usually characterized by a complex nonlinear behavior with large amounts of subsidence in a short period of time (Zhao et al., 2014). The accuracy of the conventional D-InSAR technique, which uses a single interferometric SAR pair to acquire surface deformation, is limited by several factors related to the spatial and temporal de-correlation, signal delay caused by atmospheric artifacts, and orbital or topographic errors (Liu et al., 2014). It is thus difficult to obtain valid measurements, which seriously affects the accuracy of the results. The application of the continuum D-InSAR technique has been widely proposed in the literature to monitor coal mining subsidence with rapid deformation (Przyłucka et al., 2015; Pawluszek-Filipiak and Borkowski, 2020; Chen et al., 2021). Interestingly, this method can acquire high precision surface deformation data in mine areas where no high gradient deformation has occurred. However, the atmospheric delay noise cannot be overcome. As a result, no reliable subsidence information can be obtained when the continuous D-InSAR method is used for long time series monitoring (Chen et al., 2020). In order to overcome the error factor caused by the atmospheric delay and the topographic phase of the D-InSAR method from obtaining more accurate subsidence data, various time series InSAR techniques have been proposed. Among them, the small baseline InSAR (SBAS-InSAR) technique (Berardino et al., 2002) is widely used for surface deformation monitoring applications. SBAS was developed from the traditional D-InSAR technique, where the least-squares (LS) and singular value decomposition (SVD) algorithms are used to decompose very long spatial baselines of SAR datasets into small baseline sets. The surface deformation information of highly coherent pixels was obtained based on multi-scene SAR images to characterize the time-series surface deformation. With the development of sophisticated algorithms such as coherent target point extraction-based algorithms and error elimination-based algorithms significant time series model improvements have been attained. The optimization and monitoring accuracy of SBAS has also improved accordingly (Ma et al., 2016). However, when the surface deformation was larger than the maximum measurable degree of in SAR, i.e., when the gradient of the displacement deviation exceeds half of the wavelength, confounding occurs during the phase deconvolution process, which prevents the correct deconvolution of the interferometric phase. This effect usually occurs in areas with large deformation gradients in the mining subsidence centre.
As was mentioned above, the InSAR technique has inherent limitations in estimating high-gradient deformation. The offset-tracking technique is used as a new monitoring method that is independent of the deformation gradients. It extracts deformation information of tilt range and flight direction from two SAR images in conjunction with intensity information by calculating the pixel offset at the same position (Shi et al., 2015). Due to the low resolution of the early SAR images, they were mainly applied to glacier movement (Strozzi et al., 2002), earthquake (Michel et al., 1999), and landslide (Shi et al., 2015) monitoring. As the resolution of the acquired SAR images increased, the technique was gradually applied to the monitoring of large gradient mine deformation (Yao et al., 2021).
For the Xuemiaotan mining area, the displacement rate of the working face mining subsidence deformation is changed dramatically, whereas the settlement magnitude is 3–4 m. As far as the traditional D-InSAR monitoring technology is concerned, long time baseline leads to the problems of decoherence and low accuracy. Under this perspective, the goal of this work is to employ the multi-temporal continuity D-InSAR technology, SBAS-InSAR technology, and offset-tracking technology data fusion. As a result, the formation of large gradient deformation monitoring in the centre of the subsidence basin was attained, to obtain the spatial distribution of the vertical deformation change law of the mining workface. The spatial distribution of the vertical deformation of the mining face was finally obtained.
Study area and datsets
Study area
The Xuemiaotan mine under investigation is located between the northeastern part of the urban area of Yulin City and the southwestern part of the Yushen Mining District in Yunlin City, Shaanxi Province. It possesses the following geographical coordinates: 109°42′00″ E - 109°48′33″E, 38°25′50″ N- 38°29′50″N, while the mine covers an area of about 33 km2. As is shown in Figure 1, the mine site is located in the border area between the Mu Us Desert and the Loess Plateau in the northern Shaanxi Province, whereas most of the surface is covered by loose sediments of the Quaternary System. In addition, the topography is relatively undulating and fragmented. The elevation of the mine area is generally high in the southeast and low in the northwest. Moreover, it is slightly higher in the middle and lower in the south and west, with elevations ranging from 1145 to 1250 m. The highest elevation of 1294.5 m is located in the southeast of the mine area and the lowest elevation of 1133.4 m is located in the west of the mine area, with a maximum height difference of 161.1 m. The regional geomorphology of the mine area is mainly wind-deposited sand, consisting of fixed sand, semi-fixed sand and flowing sand dunes, accounting for 85% of the total area, with a vegetation cover of 5–30%; the relative height difference is between 5 and 15 m. There are no buildings in the study area.
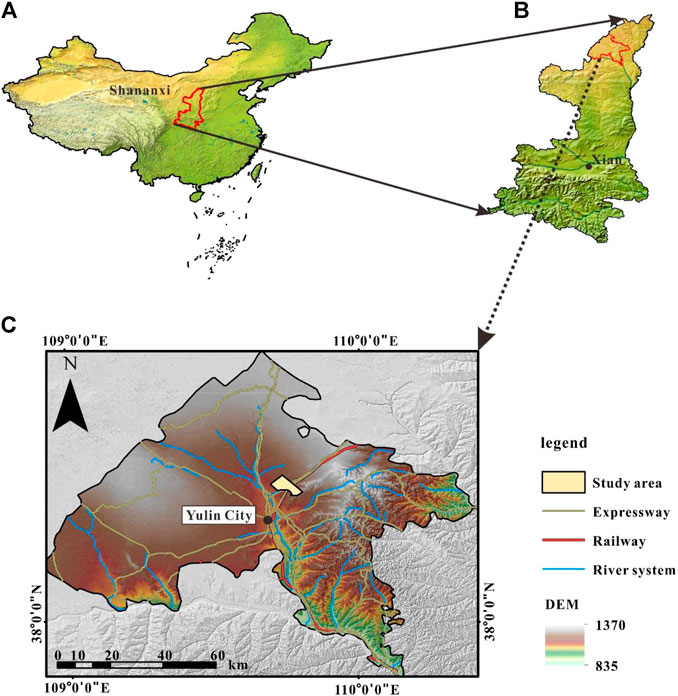
FIGURE 1. Location of the study area (A,B,C).
Xuemiaotan coal mine area is a typical near horizontal shallow buried coal mine, the study area is the mining face of mine 30302, the mining depth is 200 m, the average coal seam thickness is 6.4 m, the coal seam inclination angle is in 0°–1°, the average mining rate is about 5.5 m/day, and the coal seam roof management adopts the full collapse method.
Datasets
In this work, the 15-view SAR image data are Sentinel-1A TOPSAR images, which were provided by the amplitude European Space Agency (ESA), and these images were acquired between 6 February 2019, and 5 August 2019. The Sentinel-1A TOPSAR image operation mode was adopted as the Interferometric wide swath (IW) mode. The satellite revisits time is 12 days. The spatial resolution of the image was 2.33 m × 13.97 m, namely, the range (satellite line of sight (LOS)) × azimuth (along the satellite orbit). The image data cover range was between 103°28′E–111°55′E, 39°34′N–37°32′N, and can be completely covered by the mining area. The basic feature information of the SAR images is shown in Table 1.
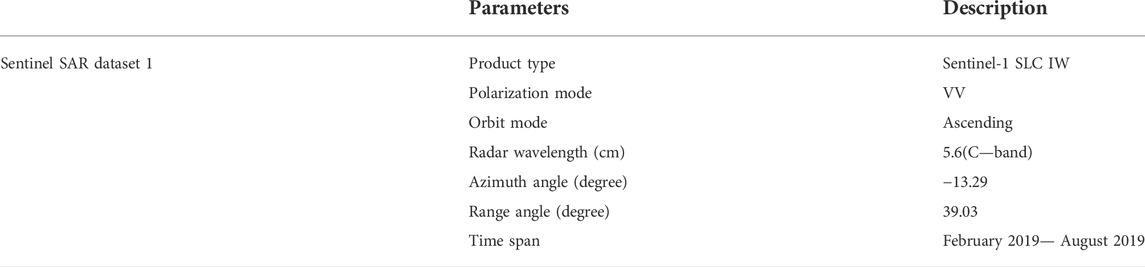
TABLE 1. Metadata about the data used in the presented study.
The external data include the DORIS Precision Orbit Data File (AUX _ POEORB), which was provided by the European Space Agency and the 3-arc-second (about 90 m spatial resolution) Space Shuttle Radar Topography Mission (SRTM) DEM data, which was provided by the National Aeronautics and Space Administration (NASA) and the measured GNSS leveling data at the 30302-working face of the mining area.
Method and data processing
The deformation of the Xuemiaotan Coal Mine was estimated through the analysis and fusion of multi-temporal continuous D-InSAR, SBAS-InSAR and Offset-tracking technology. For the cross-validation of the deformation results obtained by each method and the measured GNSS leveling results, the analysis method was good and bad. The Kriging interpolation method was also used to generate the deformation map of the mining area and compare it with the measured GNSS level. In this work, the interference software was SNAP, and the analysis software was ArcGIS. The technical route is depicted in Figure 2.

FIGURE 2. Schematic illustration of the Technology Roadmap.
Multi-temporal D-InSAR technology processing
The D-InSAR technique is regarded as interferometric processing of radar images from two views at different times in the same area. It is actually a technique to acquire surface deformation with the phase information of SAR-based complex images. The basic principle of the phase interference processing is to obtain an interference fringe map, excluding the terrain phase, flat earth phase, atmospheric phase and noise phase effects, which can be derived from the observation area deformation phase. Finally, the deformation phase information is converted into surface deformation. In the case of repeated orbit interferometry, the interference phase of two images can be expressed by the following formula (1).
Where
Many studies in the literature have demonstrated the effectiveness of the D-InSAR technique in monitoring the rapid displacement of the terrain over short periods of time (Corsa et al., 2022; Liu et al., 2022; Valerio et al., 2022). However, the inability to remove the atmospheric phase has led to a decrease in the accuracy of the D-InSAR monitoring process. Despite the influence of the atmospheric phase on the estimation results, the D-InSAR technique can provide reliable results. Therefore, this method has been effectively applied in this work. Nowadays, two multi-temporal D-InSAR methods exist, namely continuous D-InSAR and cumulative D-InSAR techniques. The cumulative D-InSAR technique is characterized by fixing the master image and selecting time-varying slave images for interference (e.g.,
As can be ascertained from Table 2, the time baseline for most of the interferometric pairs is 12 days, including 24 days for nine numbered pairs. Besides, the maximum spatial baseline is 81.839 m, which is much smaller than the critical value (±5153.507 m), and the Doppler mass difference value is −27.301, which is smaller than the critical value (±486.486) that suitable for phase interference.
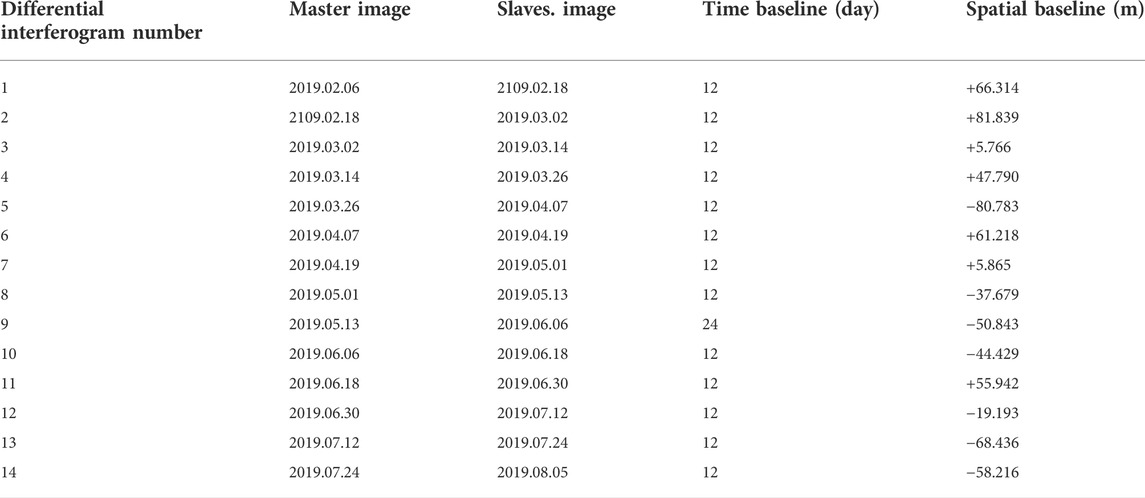
TABLE 2. Differential interferogram data key information.
Based on the time continuity of 15 different SAR images, the following were processed to obtain the surface deformation along the LOS direction: master-slave image registration, interferogram generation, leveling effect, interferogram filtering denoising, coherence coefficient calculation, phase unwrapping, orbit refining and re-leveling, geographic coding, and phase transformation deformation data. The Goldstein adaptive filtering method was chosen for the filtering process (Goldstein and Werner, 1998). The minimum cost flow (MCF) method was also used to perform the phase unwinding. We have to underline that the study of errors related to ionospheric delay was omitted due to the small size of the study area.
The LOS deformation variable was decomposed in three dimensions as is shown in formula (2) (Hu J. et al., 2014), where DLOS represents the LOS directional displacement, θ is the incidence angle of the radar signal, α stands for the heading angle, which is defined as the angle between the satellite flight direction and true north, DV denotes the LOS directional projection in the vertical direction displacement component, DN signifies the LOS directional projection in the north direction displacement component, and DE represents the LOS directional projection in the east direction displacement component. The single-track InSAR method was used in this test to ignore the horizontal displacement, namely formula (3) (Przyłucka et al., 2015; Ma et al., 2016). The LOS direction deformation projected to the vertical direction after geometric transformation.
SBAS-InSAR technology processing
The time-series InSAR technology was the first proposed method to overcome the limitations of D-InSAR technology, whole among the various time-series D-InSAR technologies, the SBAS-InSAR and PS-InSAR technologies are considered the most widely used technologies. Since the ground in the Xuemiaotan coal mine area is significantly affected by the original mining subsidence, the ground objects have almost no backscattering characteristics that can remain stable for a long time. Thus, the traditional PS-InSAR technique cannot obtain effective and stable scattering points. Moreover, the sparse vegetation cover in the study area has high coherence and good results for the short baseline SBAS-InSAR method. This study adopts the SBAS-InSAR technology. The basic principle of the SBAS-InSAR technology has been proposed in many reports in the literature (Pawluszek-Filipiak and Borkowski, 2020). Therefore, the principle of the SBAS-InSAR technique is not described in this work. Many studies have demonstrated the effective application of the SBAS-InSAR technique in monitoring surface displacement (Wang et al., 2022). 6 February 2019, was chosen as the master image (red dots Figure 3) and the rest as the Slaves image (black dots Figure 3) to align the primary image, which can generate n (n-1)/2 = 105 interferometric pairs according to the theoretical formula.
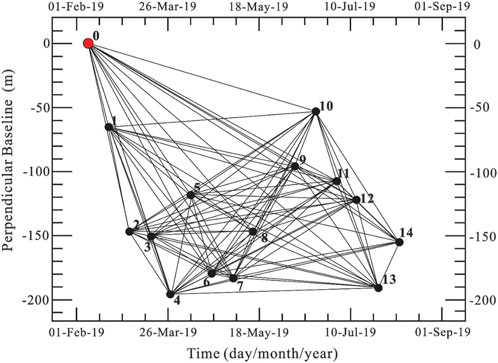
FIGURE 3. SBAS-InSAR connection diagram.
In order to further improve the data interference quality and ensure that the data minimize the spatial baseline to produce de-correlation, the spatial baseline threshold was set to 3% and the time baseline threshold was set to 100 days. Finally, 94 interferometric pairs with good coherence were generated, and the connection diagram is shown in Figure 3. In this work, the post-SBAS-InSAR was abbreviated as SBAS.
Considering that the magnitude of deformation in the study area is too large and the surface fragmentation is serious, difficulties arise for the phase unwrapping due to the large area of the low coherence factors, the most MCF method was used for phase unwrapping, and the threshold of unwrapping coherence was set to 0.35. By using the Goldstein filter to remove the coherent noise error caused by the system, the parameter window size was 64 × 64 pixels. The average displacement, the average displacement rate and the DEM correction were estimated by two inversion calculations. The velocity in the LOS direction was geometrically decomposed into vertical direction by formulas (2, 3).
Offset-tracking technology processing
By considering the limitations of the interferometric techniques in monitoring areas with high deformation gradient magnitude, the offset tracking technique was used to compensate for the monitoring of large deformation areas. More specifically, the underlying principle of the offset tracking technology was to estimate the satellite orbit offset and surface deformation offset by correlating various SAR images of two different time periods in a correlation window. Subsequently, the satellite orbit offset component was removed from the total offset through the precision orbit data file to obtain the surface deformation volume (Qu et al., 2012). The offset tracking techniques can usually be divided into two implementation methods: intensity tracking and coherence tracking. In this work, the study area was selected as a semi-arid sandy region, and the surface deformation was large by using the coherent offset-tracking technique, which will be out of decoherence to a certain extent. Therefore, the offset-tracking method based on the intensity of the SAR images was used to estimate the deformation in distance and azimuth directions.
By considering the resolution accuracy of the images, performing a multi-view image overlay will lead to error accumulation. For that reason, two views of images on 2019.02.06 (mining time) and 2019.08.05 (post-mining time) were selected. The basic parameters are shown in Table 3. The optimal parameter settings were established through several offset tracking experiments, while the intercorrelation window size was 128 × 128 pixels, the resampling was 4, the normalized cross-correlation (NCC) threshold was selected as 0.2, the window step was 1 × 1 about 10 m search window, and the maximum speed was set according to the wellfield mining data as 1 m/day.
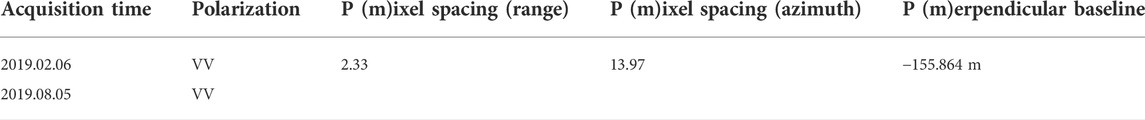
TABLE 3. Select the main information and basic parameters of the image.
Methods fusion parameter selection
The number of the raster image elements and the accuracy of the interferometric stripe displacement (2π period) of the decoupling results in the study area changes significantly for the continuous D-InSAR and SBAS-InSAR techniques at different coherence thresholds. As is shown in Figure 4, with the increase of the coherence threshold, the accuracy of the unwrapping results is increased with the inverse function, but the number of the unwrapped pixels is decreased. Based on the coherence and unwrapped pixel number curve, the optimal coherence thresholds (0.35) of the continuous D-InSAR and SBAS techniques were obtained at inflection points A and B, respectively. The extracted curves of the SBAS method under different correlation thresholds have the same trend as those of the D-InSAR approach. In the same coherence threshold, due to the failure of the SBAS unpacking, the number of grid pixels in the results was less than that of continuous D-InSAR. Continuous D-InSAR data were also applied in the failure area of the SBAS unpacking to reduce the large error brought by the fusion offset-tracking results.
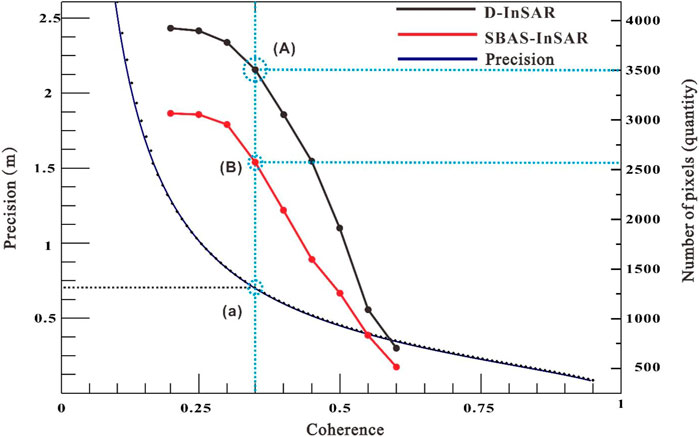
FIGURE 4. Analysis of interferometric stripe displacement accuracy and the number of image elements for successful phase decoupling under different coherence thresholds.
Based on the above analysis, the division of the fusion data boundaries in this work was usually based on the degree of coherence. The regions with coherence less than 0.35 were divided into large gradient deformation (offset-tracking), whereas the regions with coherence greater than 0.35 (continuous D-InSAR, SBAS) were divided into small gradient deformation regions.
Result and discussion
Continuous D-InSAR interferometry results
For the continuous D-InSAR interferometry, the master image was not fixed to the same image. 14 images were sequentially used as the master image, while the image imaged later was employed as the slave image. The time baseline was approximately the same as the satellite revisit period. The continuum D-InSAR acquisition process is shown in Figure 5 for the vertical time-series deformation map during mining from 6 February 2019, to 5 August 2019. It can be seen that the mining subsidence at the working face 30302 occurred between March and July, whereas the maximum subsidence of the D-InSAR results was 0.13 m.
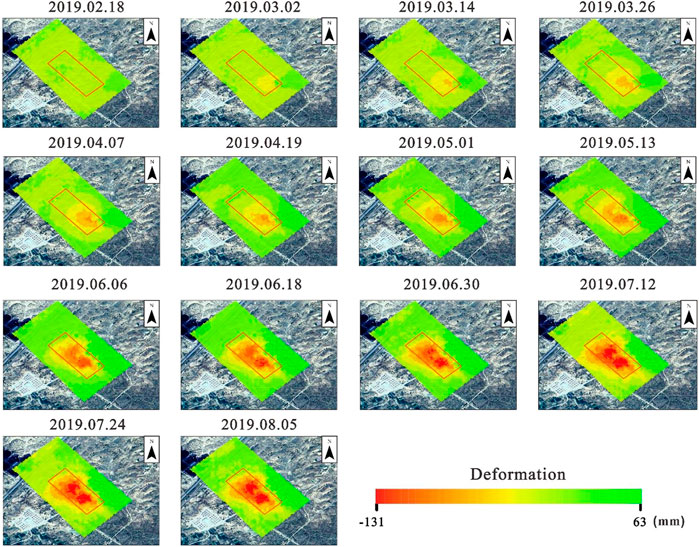
FIGURE 5. Time-series deformation field of the continuous D-InSAR30302 working face.
Figure 6 clearly shows that the surface of the working face 30302 in the mine area was obviously deformed and displaced from southeast to northwest direction, which was consistent with the actual working face mining direction. The deformation trend was also increased from the central area to the edge area from both sides. The monitoring results were only collected at the sinkhole boundary, and the maximum settlement of SBAS results was 0.024 m. However, due to the large deformation gradient of the working face and the temporal decoherence, a cavity appeared at the centre of the sinkhole ellipse in striking contrast with the continuous D-InSAR technique, which is able to obtain the residual deformation variables at the location of the cavity in SBAS.

FIGURE 6. Time-series deformation field of the SBSA-InSAR30302 working face.
Reliability assessment of interferometry
In order to further compare the difference between the SBAS and continuous D-InSAR results, ArcGIS was used to extract the same part of the point values of the two methods. As can be observed in Figure 7, the error frequency distribution was similar to the normal distribution and was mainly distributed near the value of 0.01 m. Obviously, the deviation of the results was mainly caused by the fact that D-InSAR does not remove the atmospheric phase.
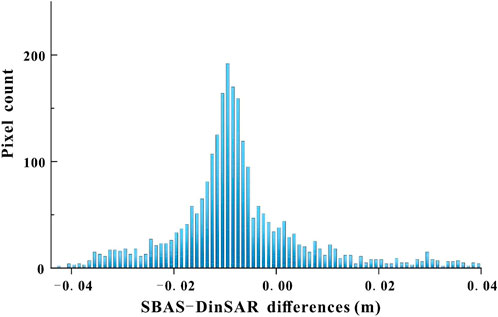
FIGURE 7. Histograms of the SBAS-InSAR and the continuous D-InSAR techniques.
Two profile lines were selected, namely Aa’, Bd’ and 38 GNSS observation points (P1—P17) on the working surface of 30302 to further compare the deformation trend of the SBAS and D-InSAR methods in the vertical direction.
Figures 8B,C show the dynamic cumulative deformation curves of some observation points and the advancing direction of the working face. The distribution of the recorded data can be ascribed to the fact that the coal seam is roughly close to the level. Interestingly, in the early period of observation in March 2019, the driving position of the working face was far from the strike observation line. Therefore, the surface of the strike observation line was negligibly affected by the underground mining activities, and the surface deformation displacement was small. When the tunneling time was close to May 2019, the ground to the observation line was affected by mining, and the settlement value was increased sharply. Finally, with the continuous advancement of the working face, the ground subsidence gradually weakened, and finally reached a basic stable state after a period.
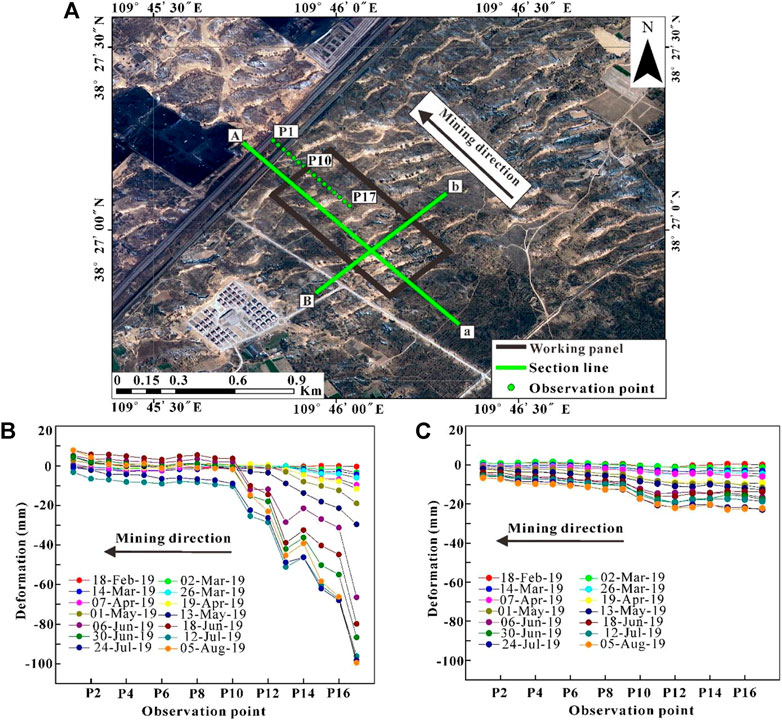
FIGURE 8. (A) GNSS points and profile lines Aa and Bd arranged along the strike and dip direction of the working face (B) Time series deformation map of the continuous D-InSAR trend observation point, (C) Time series deformation map of the SBAS-InSAR towards observation point.
Figures 9A,B display that the two interference measurement results are roughly consistent, and the overall trend is subsidence. Nevertheless, the SBAS method lacks monitoring results in the central area. Only the root means square error (RMSE) and the mean absolute error (MAE) methods were introduced to evaluate the same unpacking area of SBAS and continuous D-InSAR. For the Aa and bd profiles of RMSE the value of 2.85 mm, MAE: 1.06 mm, 16.6 mm, MAE: 6.5 mm were extracted, respectively. Hence, it can be argued that a small difference exists between the two results.
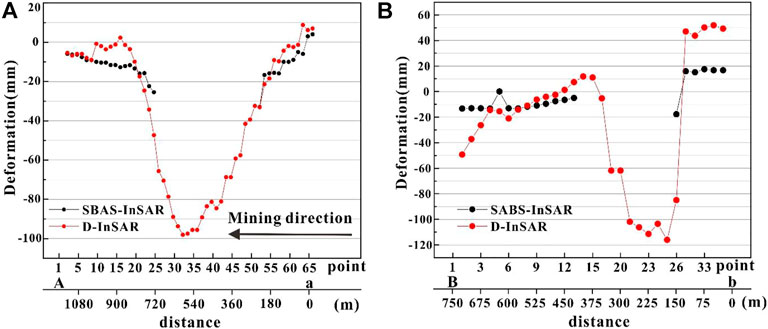
FIGURE 9. (A) SBAS vs. continuous D-InSAR for profile line Aa, (B) Comparison of SBAS and continuous D-InSAR in profile Bb.
The actual GNSS data were used, which were obtained on-site at the 30302-working face of the mine during the survey to verify the results of each interferometry. As can be ascertained from Figure 10A, the maximum deformation of the center area of the measured results was about 3 m. Figure 10B shows that the accuracy of the acquired SBAS monitoring results at the mining subsidence boundary (P1 to P8) was better than the continuous D-InSAR results. However, the continuous D-InSAR results at (P9 to P11) were better than the SBAS.
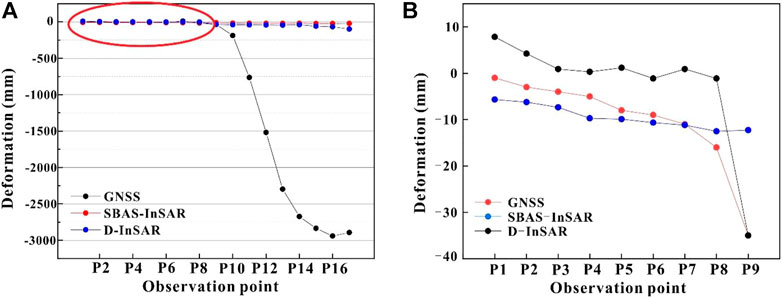
FIGURE 10. (A) Comparison of the GNSS results with the SBAS-InSAR and continuous D-InSAR results in the measured trend line (P1–P17), (B) Local enlargement at the red circle in (A).
The extracted SBAS results at the strike observation points (P1 to P17) were subsequently analysed in comparison with the measured GNSS shape variables, and the following results for the SBAS root mean square error (RMSE1-1) and mean absolute error (MAE1-1) were calculated, respectively: 1.52 and 0.94 m. In addition, P1 to P9 were analysed for error, RMSE1-2 was 5.2 mm and MAE1-2 was 3.7 mm, while at the observation points (P10 to P17) RMSE1-3: 1.52 m and MAE1-3: 0.93 m. Similarly, for the continuum D-InSAR method at the observation points (P1 to P17) the values of RMSE2-1: 1.5 m, and MAE2-1: 0.92 m were estimated, whereas at the observation points (P1 to P9) RMSE2-2: 6.1 mm, MAE2-2: 4.0 mm. Moreover, at the observation points P10 to P17, the values of RMSE2-3: 1.50 m, and MAE2-3: 0.92 m were calculated. It can be found that the SBAS method for the fine deformation monitoring at the edge of the working face has 1 mm RMSE error compared to the continuous D-InSAR, whereas the D-InSAR results were better than SBAS at the transition zone from the subsidence centre to the edge. The actual results of the two interferometric methods at the subsidence centre are far different.
Offset-tracking technology reliability assessment
Since the large deformation in the mine area occurred within 6 days, this data re-entry time was 12 days. For the InSAR technology (SBAS, D-InSAR) monitoring at the centre of the subsidence basin in the mining area, a large magnitude deformation was formed, which was beyond the interferometric processing monitoring capability. The measured results of the two interferometric methods have a large difference in magnitude compared to the GNSS approach at the centre of the subsidence basin. In order to solve the problem of the interval time between the above two scenes’ images, which was larger than the duration of large deformation and thus the subsidence centre area cannot be monitored, the application of the offset-tracking method was proposed. This approach was complementary to the interferometric techniques.
The LOS direction deformation was calculated by the registration of two SAR intensity images on 6 February 2019 and 5 August 2019, and it was decomposed into vertical component deformation. As is shown in Figure 11A, the whole area of the working face presented a subsidence deformation trend, while the maximum deformation of the deformation centre was about 3.6 m. Figure 11B shows that the trend of the method was similar to the measured GNSS results at the centre of the subsidence area, and the error was obvious at the subsidence boundary.
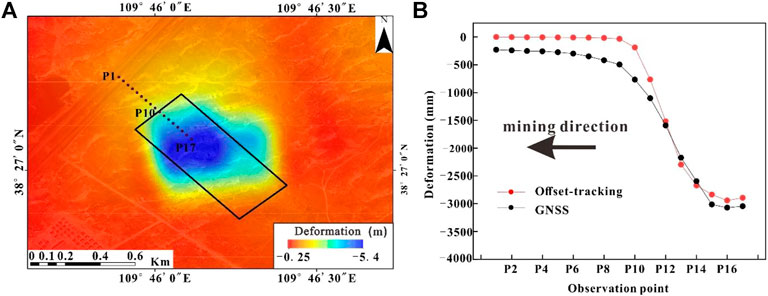
FIGURE 11. (A) Deformation field of the offset-tracking technology mining area (B) Comparison map of the GNSS method and offset-tracking deformation towards observation points.
In order to further verify the accuracy and feasibility of the proposed method, the offset tracking results of the direct observation line were compared with the GNSS results in the vertical direction. The root mean square error (RMSE3-1) and the mean absolute error (MAE3-1) of the observation lines P1 to P17 were 0.29 and 0.25 m, respectively. Among them, the root means square error (RMSE3-2) and the mean absolute error (MAE3-2) of the observation points (P10 to P17) in the GNSS sinkhole centre area were 0.12 and 0.08 m, respectively. Obviously, the offset-tracking technique was less accurate in monitoring micro deformation compared with the continuous D-InSAR and SBAS-InSAR techniques.
Offset-tracking, SBAS-InSAR, and continuity D-InSAR results fusion reliability evaluation
Due to the problems of the large deformation gradient and wrong unpacking in the SBAS method, the subsidence boundary and the centre of the subsidence basin appeared ' void '. The monitoring accuracy of the continuous D-InSAR method was better than the offset-tracking method since it compensates for the data at the ' void ' of the subsidence boundary. We have to underline that the maximum value cannot be obtained by the interference method when the interference processing and monitoring ability is beyond the deformation basin centre of the mining area.
Therefore, the SBAS technique was used to monitor the subsidence edge part, while the continuity D-InSAR technique compensates for the SBAS unwrapping error at the subsidence boundary that produces no results. Additionally, the offset-tracking technique was used to monitor the subsidence centre area, and finally, the data of the three methods were fused to obtain the complete deformation field of the study area. The results of the above-mentioned three methods were combined by applying the ArcGIS software tool raster image converted to points. Each point was located in the centre of mass of the raster pixels, which were then used for the implementation of the exponential semi-variance function model from the Kriging interpolation method. Continuous D-InSAR with offset-tracking points was also used only for the regions where no information was provided by the SBAS results.
In Figures 12A,B the comparison results between the measured data of the monitoring points along the working face and the continuous D-InSAR, SBAS-InSAR and the Offset-tracking combined monitoring are presented. More specifically, Figure 12B shows that the fusion curve on both sides of the edge was in better agreement with the measured results than in the centre area. Besides, it is obvious that the monitoring accuracy of the interference measurement is higher than that of the Offset-tracking. As can be observed from Figure 9B, in the direct observation line (P1 ∼ P17), the maximum absolute error of the variables in the vertical direction was 0.33 m (at P11), while the root mean square error (RMSE4-1) was 0.11 m and the average absolute error (MAE4-1) was 0.07 m.
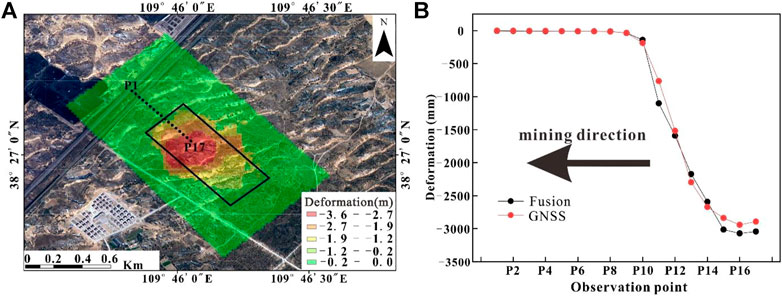
FIGURE 12. (A) Figure fusion of Offset-tracking and interferometric measurement results, (B) Measured observation point GNSS and vertical deformation after the fusion process.
Comparative evaluation of three methods
Although the subsidence area of the 30302-working face in Xuemiaotan Mine was monitored by the integration of Offset-tracking, SBAS-InSAR and D-InSAR techniques, each method has its own advantages and disadvantages. As far as the SBAS-InSAR technology is concerned, it cannot estimate the manifestation of large deformation in the central part of the subsidence area. However, its comparative advantage lies in the effective removal of some of the errors caused by the atmospheric phase delays (Liu et al., 2014). In contrast, the continuous D-InSAR method can capture the missing part produced by the failure of the SBAS-InSAR deformation boundary unwrapping, but the interferometric limitation in the subsidence centre region illuminates a large difference with the measured GNSS results. As can be seen from Figures 7B,C, the D-InSAR curve is consistent with the respective GNSS curve development trend. On top of that, since there no Sentinel-1A/B binary data in the study area, the re-entry time can only reach 12 days for one image. However, the short return period has also certain advantages for monitoring the subsidence caused by the rapid deformation of coal mining. The main limitation of the continuous D-InSAR is that atmospheric phase deformation is easily observed in the stable region, but the monitoring accuracy was much higher than the Offset-tracking technology.
The LOS direction offset value was obtained by the Offset-tracking technology by employing the image migration method. Nevertheless, the accuracy of this method is strongly dependent on the resolution of the acquired SAR images. According to the research, the accuracy of the Offset-tracking technology can reach 1/20–1/30-pixel size. Obviously, this method is suitable for monitoring areas with large scale and deformation magnitude. Therefore, the advantage of this method is complementary to the continuous D-InSAR technology that cannot monitor regions with poor coherence and large deformation. The IW mode resolution of the Sentinel-1 image was 2.33 m × 13.97 m, and the image accuracy can only reach the decimeter level. Obviously, by using high-resolution SAR images, the accuracy of this technique can be improved. In contrast, the technical disadvantage is that the millimeter-level monitoring cannot be achieved in the micro-deformation area. The high accuracy of DEM-based data is also accompanied by small errors in terrain phase removal. In this work, the accuracy of DEM–based data with 90 m spatial resolution was poor, and the selection of high-precision DEM data was beneficial to reduce the error. The results of the three methods were fused by the Kriging interpolation method. Compared with the error of the individual technical results, the results of the fusion method in this work (MAE, RMSE) are better than those of the individual methods.
Conclusion
For the problems of coal mine subsidence deformation and displacement changes, the traditional InSAR monitoring technology cannot effectively monitor the large gradient deformation of mining subsidence. In order to solve the limitations of traditional InSAR technology. This paper is based on the analysis of coherence threshold, interference fringe displacement accuracy, and number of unfolded image elements through several experiments. The method of fusing the continuity D-InSAR technique, SBAS-InSAR technique and offset-tracking technique is proposed. The fusion threshold is 0.35. The Kriging prediction model of ArcGIS software was applied to integrate the results of the three techniques. The spatial distribution change pattern of surface deformation in the study area. The results show that:
1. When using the continuous D-InSAR technique in mine surface subsidence monitoring, good performance can be obtained in mine areas with linear or low-gradient subsidence. However, the results of continuous D-InSAR do not meet the monitoring requirements due to the interference de-correlation caused by large deformation gradients in the mine area.
2. By alleviating a small part of the interference decoherence through a small baseline set and applying low-pass filtering to eliminate part of the influence of atmospheric artifacts, SBAS-InSAR can extract the surface small deformation information with higher accuracy compared to continuous D-InSAR.
3. In the same coherence threshold, the number of raster image elements that result from the SBAS phase unfolding failure is less compared to the continuum D-InSAR. In the settlement boundary area, the failure position of SBAS unpacking is given a null value, but the actual settlement here is micro deformation. The application of continuous D-InSAR data at the SBAS unpacking failure location can reduce the error of offset-tracking data carried into the fused data.
4. Offset-tracking technique obtains the corresponding deformation by calculating the pixel offset, which is suitable for large scale deformation monitoring and can compensate for the large deformation gradient area that cannot be obtained by continuous D-InSAR and SBAS-InSAR. The accuracy is lower in the small deformation monitoring, and its monitoring accuracy reaches image resolution 1/20 to 1/30. Usually, the monitoring accuracy is lower than SBAS-InSAR and D-InSAR techniques, and the Offset-tracking technique error dominates in the fusion. The optimal parameter settings require several trials in different study areas.
Combining interferometric techniques and Offset-tracking methods, the monitoring results are analyzed in terms of the mean absolute error with the level data. The results show that the accuracy of the proposed fusion method should not be less than 0.07 m. The monitoring results of this method are basically consistent with the general rule of mining subsidence, and provide a new idea for monitoring surface mining subsidence and geological environment management in mining areas.
Data availability statemnt
The original contributions presented in the study are included in the article/supplementary material, further inquiries can be directed to the corresponding author.
Author contributions
JM and JY were involved in the conception and design of the study. ZZ and HC provided data for the study. JY completed the experiments and wrote the first draft of the manuscript. SL wrote parts of the manuscript and revised and read the manuscript.
Funding
This research was funded by Research on “air-sky-ground” integrated geological environment monitoring and prediction technology in Yushen mining area (No. SMDZ-2020CX-8), the National Natural Science Foundation of China (No. 41907255, 41602359), the Natural Science Basic Research Plan in Shaanxi Province of China (No. 2017JQ4019) and Key Laboratory of the Northern Qinghai–Tibet Plateau Geological Processes and Mineral Resources (No. 2019-KY-01).
Conflicts of interest
Authors ZZ and HC were employed by the company Shaanxi 185 Coal Field Geology Co., Ltd
The remaining authors declare that the research was conducted in the absence of any commercial or financial relationships that could be construed as a potential conflict of interest.
Publisher’s note
All claims expressed in this article are solely those of the authors and do not necessarily represent those of their affiliated organizations, or those of the publisher, the editors and the reviewers. Any product that may be evaluated in this article, or claim that may be made by its manufacturer, is not guaranteed or endorsed by the publisher.
References
Bayik, C., Abdikan, S., and Arıkan, M. (2021). Long term displacement observation of the Atatürk Dam, Turkey by multi-temporal InSAR analysis. Acta Astronaut. 189, 483–491. doi:10.1016/j.actaastro.2021.09.022
Bekaert, D. P. S., Handwerger, A. L., Agram, P., and Kirschbaum, D. B. (2020). InSAR-based detection method for mapping and monitoring slow-moving landslides in remote regions with steep and mountainous terrain: An application to Nepal. Remote Sens. Environ. 249, 111983. doi:10.1016/j.rse.2020.111983
Békési, E., Fokker, P. A., Martins, J. E., Norini, G., and van Wees, J.-D. (2021). Source parameters of the 8 February 2016, Mw=4.2 Los Humeros earthquake by the inversion of InSAR-based ground deformation. Geothermics 94, 102133. doi:10.1016/j.geothermics.2021.102133
Berardino, P., Fornaro, G., Lanari, R., and Sansosti, E. (2002). A new algorithm for surface deformation monitoring based on small baseline differential SAR interferograms. IEEE Trans. Geosci. Remote Sens. 40, 2375–2383. doi:10.1109/TGRS.2002.803792
Carnec, C., Massonnet, D., and King, C. (1996). Two examples of the use of SAR interferometry on displacement fields of small spatial extent. Geophys. Res. Lett. 23, 3579–3582. doi:10.1029/96GL03042
Chen, D., Chen, H., Zhang, W., Cao, C., Zhu, K., Yuan, X., et al. (2020). Characteristics of the residual surface deformation of multiple abandoned mined-out areas based on a field investigation and SBAS-InSAR: A case study in jilin, China. Remote Sens. 12, 3752. doi:10.3390/rs12223752
Chen, Y., Yu, S., Tao, Q., Liu, G., Wang, L., Wang, F., et al. (2021). Accuracy verification and correction of D-InSAR and SBAS-InSAR in monitoring mining surface subsidence. Remote Sens. 13, 4365. doi:10.3390/rs13214365
Corsa, B., Barba-Sevilla, M., Tiampo, K., and Meertens, C. (2022). Integration of DInSAR time series and GNSS data for continuous volcanic deformation monitoring and eruption early warning applications. Remote Sens. 14, 784. doi:10.3390/rs14030784
Di Traglia, F., De Luca, C., Manzo, M., Nolesini, T., Casagli, N., Lanari, R., et al. (2021). Joint exploitation of space-borne and ground-based multitemporal InSAR measurements for volcano monitoring: The Stromboli volcano case study. Remote Sens. Environ. 260, 112441. doi:10.1016/j.rse.2021.112441
Du, H., and Song, D. (2022). Investigation of failure prediction of open-pit coal mine landslides containing complex geological structures using the inverse velocity method. Nat. Hazards 111, 2819–2854. doi:10.1007/s11069-021-05159-w
Goldstein, R. M., and Werner, C. L. (1998). Radar interferogram filtering for geophysical applications. Geophys. Res. Lett. 25, 4035–4038. doi:10.1029/1998GL900033
He, W., Xiang, M., Liu, H., Li, Y., and Peng, J. (2016). Ground subsidence and its environment problems in Yushenfu ming area. Coal Geol. Explor. 44, 131–135.
Hu, J., Li, Z. W., Ding, X. L., Zhu, J. J., Zhang, L., Sun, Q., et al. (2014b). Resolving three-dimensional surface displacements from InSAR measurements: A review. Earth. Sci. Rev. 133, 1–17. doi:10.1016/j.earscirev.2014.02.005
Hu, Z., Wang, X., and He, A. (2014a). Distribution characteristic and development rules of ground fissures due to coal mining in windy and sandy region. J. China Coal Soc. 39, 11–18. doi:10.13225/j.cnki.jccs.2013.1289
Kim, J., Lin, S., Singh, R. P., Lan, C., and Yun, H. (2021). Underground burning of Jharia coal mine (India) and associated surface deformation using InSAR data. Int. J. Appl. Earth Observation Geoinformation 103, 102524. doi:10.1016/j.jag.2021.102524
Lanari, R., Casu, F., Manzo, M., Zeni, G., Berardino, P., Manunta, M., et al. (2007). An overview of the small BAseline subset algorithm: a DInSAR technique for surface deformation analysis. Pure appl. geophys. 164, 637–661. doi:10.1007/s00024-007-0192-9
Li, Q., Song, D., Yuan, C., and Nie, W. (2022). An image recognition method for the deformation area of open-pit rock slopes under variable rainfall. Measurement 188, 110544. doi:10.1016/j.measurement.2021.110544
Li, Y., Jiang, W., Zhang, J., Li, B., Yan, R., Wang, X., et al. (2021). Sentinel-1 SAR-Based coseismic deformation monitoring service for rapid geodetic imaging of global earthquakes. Nat. Hazards Res. 1, 11–19. doi:10.1016/j.nhres.2020.12.001
Liu, G., Guo, H., Perski, Z., Fan, J., Bai, S., Yan, S., et al. (2016). Monitoring the slope movement of the Shuping landslide in the Three Gorges Reservoir of China, using X-band time series SAR interferometry. Adv. Space Res. 57, 2487–2495. doi:10.1016/j.asr.2016.03.043
Liu, J., Hu, J., Li, Z., Ma, Z., Shi, J., Xu, W., et al. (2022). Three-Dimensional surface displacements of the 8 january 2022 Mw6.7 menyuan earthquake, China from sentinel-1 and ALOS-2 SAR observations. Remote Sens. 14, 1404. doi:10.3390/rs14061404
Liu, Z.-g., Bian, Z.-f., Lei, S.-g., Liu, D.-l., and Sowter, A. (2014). Evaluation of PS-DInSAR technology for subsidence monitoring caused by repeated mining in mountainous area. Trans. Nonferrous Metals Soc. China 24, 3309–3315. doi:10.1016/S1003-6326(14)63471-3
Ma, C., Cheng, X., Yang, Y., Zhang, X., Guo, Z., Zou, Y., et al. (2016). Investigation on mining subsidence based on multi-temporal InSAR and time-series analysis of the small baseline subset—case study of working faces 22201-1/2 in bu’ertai mine, shendong coalfield, China. Remote Sens. 8, 951. doi:10.3390/rs8110951
Michel, R., Avouac, J.-P., and Taboury, J. (1999). Measuring ground displacements from SAR amplitude images: Application to the Landers Earthquake. Geophys. Res. Lett. 26, 875–878. doi:10.1029/1999GL900138
Modeste, G., Doubre, C., and Masson, F. (2021). Time evolution of mining-related residual subsidence monitored over a 24-year period using InSAR in southern Alsace, France. Int. J. Appl. Earth Observation Geoinformation 102, 102392. doi:10.1016/j.jag.2021.102392
Pawluszek-Filipiak, K., and Borkowski, A. (2020). Integration of DInSAR and SBAS techniques to determine mining-related deformations using sentinel-1 data: The case study of rydułtowy mine in Poland. Remote Sens. 12, 242. doi:10.3390/rs12020242
Przyłucka, M., Herrera, G., Graniczny, M., Colombo, D., and Béjar-Pizarro, M. (2015). Combination of conventional and advanced DInSAR to monitor very fast mining subsidence with TerraSAR-X data: Bytom city (Poland). Remote Sens. 7, 5300–5328. doi:10.3390/rs70505300
Qu, C., Shan, X., iu, L. Y., Zhang, G., Song, X., Zhang, G., et al. (2012). Ground surface ruptures and near-fault, large-scale displacements caused by the wenchuan Ms8.0 earthquake derived from pixel offset tracking on synthetic aperture radar images. Acta Geol. Sin. - Engl. Ed. 86, 510–519. doi:10.1111/j.1755-6724.2012.00678.x
Qu, F., Zhang, Q., Lu, Z., Zhao, C., Yang, C., Zhang, J., et al. (2014). Land subsidence and ground fissures in Xi'an, China 2005–2012 revealed by multi-band InSAR time-series analysis. Remote Sens. Environ. 155, 366–376. doi:10.1016/j.rse.2014.09.008
Rabus, B., Eineder, M., Roth, A., and Bamler, R. (2003). The shuttle radar topography mission—a new class of digital elevation models acquired by spaceborne radar. ISPRS J. Photogrammetry Remote Sens. 57, 241–262. doi:10.1016/S0924-2716(02)00124-7
Ruiz-Armenteros, A. M., Marchamalo-Sacrsitán, M., Bakoň, M., Lamas-Fernández, F., Delgado, J. M., Sánchez-Ballesteros, V., et al. (2021). Monitoring of an embankment dam in southern Spain based on Sentinel-1 Time-series InSAR. Procedia Comput. Sci. 181, 353–359. doi:10.1016/j.procs.2021.01.178
Shi, X., Zhang, L., Balz, T., and Liao, M. (2015). Landslide deformation monitoring using point-like target offset tracking with multi-mode high-resolution TerraSAR-X data. ISPRS J. Photogrammetry Remote Sens. 105, 128–140. doi:10.1016/j.isprsjprs.2015.03.017
Strozzi, T., Luckman, A., Murray, T., Wegmuller, U., and Werner, C. L. (2002). Glacier motion estimation using SAR offset-tracking procedures. IEEE Trans. Geosci. Remote Sens. 40, 2384–2391. doi:10.1109/TGRS.2002.805079
Valerio, E., De Luca, C., Lanari, R., Manzo, M., and Battaglia, M. (2022). The August 2019 piton de la Fournaise (La réunion island) eruption: Analysis of the multi-source deformation pattern detected through sentinel-1 DInSAR measurements. Remote Sens. (Basel). 14, 1762. doi:10.3390/rs14071762
Wang, H., Li, K., Zhang, J., Hong, L., and Chi, H. (2022). Monitoring and analysis of ground surface settlement in mining clusters by SBAS-InSAR technology. Sensors 22, 3711. doi:10.3390/s22103711
Wang, T., DeGrandpre, K., Lu, Z., and Freymueller, J. T. (2018). Complex surface deformation of Akutan volcano, Alaska revealed from InSAR time series. Int. J. Appl. Earth Observation Geoinformation 64, 171–180. doi:10.1016/j.jag.2017.09.001
Xiong, J., Xiao, R., and He, X. (2021). Land surface deformation in Nanchang, China 2018–2020 revealed by multi-temporal InSAR. Nat. Hazards Res. 1, 187–195. doi:10.1016/j.nhres.2021.10.003
Yang, Z., Li, Z., Zhu, J., Yi, H., Hu, J., Feng, G., et al. (2017). Deriving dynamic subsidence of coal mining areas using InSAR and logistic model. Remote Sens. 9, 125. doi:10.3390/rs9020125
Yao, J., Yao, X., Wu, Z., Liu, X., and Diraco, G. (2021). Research on surface deformation of ordos coal mining area by integrating multitemporal D-InSAR and offset tracking technology. J. Sensors 2021, 1–14. doi:10.1155/2021/6660922
Keywords: continuous D-InSAR, mining subsidence, SBAS, Offset-tracking, comparative analysis
Citation: Ma J, Yang J, Zhu Z, Cao H, Li S and Du X (2022) Decision-making fusion of InSAR technology and offset tracking to study the deformation of large gradients in mining areas-Xuemiaotan mine as an example. Front. Earth Sci. 10:962362. doi: 10.3389/feart.2022.962362
Received: 06 June 2022; Accepted: 08 July 2022;
Published: 17 August 2022.
Edited by:
Chong Xu, Ministry of Emergency Management, ChinaReviewed by:
Danqing Song, Tsinghua University, ChinaBo Zhao, Institute of Mountain Hazards and Environment (CAS), China
Fei Guo, China Three Gorges University, China
Copyright © 2022 Ma, Yang, Zhu, Cao, Li and Du. This is an open-access article distributed under the terms of the Creative Commons Attribution License (CC BY). The use, distribution or reproduction in other forums is permitted, provided the original author(s) and the copyright owner(s) are credited and that the original publication in this journal is cited, in accordance with accepted academic practice. No use, distribution or reproduction is permitted which does not comply with these terms.
*Correspondence: Shibo Li, bGlzaGlib0B4dXN0LmVkdS5jbg==