 Huiliang Wang
 Yujia Zhu
 Tianling Qin2
94% of researchers rate our articles as excellent or good
Learn more about the work of our research integrity team to safeguard the quality of each article we publish.
Find out more
ORIGINAL RESEARCH article
Front. Earth Sci., 05 September 2022
Sec. Hydrosphere
Volume 10 - 2022 | https://doi.org/10.3389/feart.2022.961871
This article is part of the Research TopicWater and Ecological System: Response, Management, and RestorationView all 15 articles
Studying the probability characteristics of meteorological drought transmission to hydrological drought can help alleviate drought and optimize the allocation of water resources. This study takes the Yiluo River as the research object, and Standardized Precipitation Index (SPI) and Standardized Streamflow Index (SSI) were used to represent meteorological and hydrological drought, respectively. First, the stability of the precipitation and stream flow sequence is tested by using the heuristic segmentation algorithm. The correlation between meteorological and hydrological watershed was analyzed using cross wavelet transform and lag correlation to study the transmission time of meteorological drought to hydrological drought. Second, the characteristics of drought such as drought duration, drought intensity, and drought intensity are discussed by using the run theory. Finally, the joint distribution of the SPI and SSI sequence is constructed using Copula function. From the perspective of conditional probability, the propagation probability and propagation threshold from different levels of meteorological drought to hydrological drought are calculated. A hydrological drought prediction model based on the SPI—P(SSI|SPI) relation curve is proposed. The model is also validated based on the historical data. The results show that the model is suitable for light and middle hydrological drought prediction.
Drought is one of the most widespread natural disasters that may cause persistent and adverse consequences for sustainable development (Lesk et al., 2016). It seriously endangers the development of economy and society and the stability of ecological environment. Large-scale droughts occur worldwide (Mishra and Singh, 2010). Also, the frequency of occurrence has increased significantly in recent years. Drought is usually defined as long-term no or little rain and water not being enough to meet the climatic phenomena of human survival and economic and social development (Sadeghipour and Dracup, 1985). In a certain river basin or area, evaporation demand is large and less precipitation, that is, water expenditure is greater than income; this state of long-term persistence will lead to the occurrence of drought. At present, the international drought types are generally divided into four categories, namely, meteorological drought, hydrological drought, agricultural drought, and social and economic drought. Meteorological drought refers to the long-term less precipitation phenomenon, and hydrological drought refers to the decrease of surface water, groundwater, or river stream flow (Zhu et al., 2019). From the perspective of water cycle, meteorological drought with precipitation as the main factor will occur first, and the occurrence of meteorological drought will propagate the water deficit signal to stream flow, groundwater, soil water, and other factors, thus leading to hydrological drought (Yuan et al., 2017). Therefore, the risk of meteorological drought is propagated to hydrological drought with water cycle after a certain lag time (Zhu et al., 2019). As an important link in water circulation, the propagation process of meteorological elements to hydrological elements is of great significance to study the propagation of meteorological drought to hydrological drought for the management of water resources and the forecast and early warning of drought (Van Loon et al., 2016).
Risk propagation between different types of drought mainly includes the propagation mechanism and process, propagation time, propagation threshold, and influencing factors. Previous studies have shown that the propagation threshold from meteorological to hydrological drought is a key feature of drought propagation and is important for drought prevention and mitigation (Lorenzo-Lacruz et al., 2013). At present, a large number of scholars have studied the propagation of meteorological drought to hydrological drought, most of which study the propagation time, threshold, and its influencing factors. At the time of drought propagation, there are many mature research results, including three characterization methods: run theory (Zhao et al., 2014), correlational analysis method (Barker et al., 2016), and nonlinear corresponding method (Lorenzo-Lacruz et al., 2013). In terms of propagation threshold, Guo et al. (2020) used Bayesian theory to study the duration and severity of meteorological drought in the three sub-basins from the meteorological basin of the Weihe River. Wu et al. applied the logarithm function to establish the response relationship model of hydrological drought to meteorological drought characteristics and obtained the critical conditions of meteorological drought evolution into hydrological drought. Gao et al. (2014)proposed the concept of climate threshold caused by drought and flood based on the study of precipitation disaster factors and crop disaster bearing body damage degree. Leasor, Quiring, and Svoboda (Lesk et al., 2016) used objective drought severity definition thresholds for improving drought monitoring (Leasor et al., 2020). Peters et al. (2003)used linear reservoir theory to study the spread of drought in groundwater. Sattar et al. (2019)analyzed the probability characteristics of the propagation of meteorological drought to hydrological drought in Korea using the Copula function and Bayesian theory. In terms of propagation influencing factors, Pandey and Ramasastri, (2001)believe that the corresponding propagation time depends on the local landscape conditions. Huang et al. (2017)used the Fu’s equation in the budyko hypothesis to study the relationship between propagation time and the actual evapotranspiration and El Niño-Southern Oscillation (ENSO) and the Atlantic Oscillation (AO). Hudgins research found that the Arctic Oscillation activity is closely related to the climate in the middle and high latitudes (Hudgins and Huang, 1996). Talaee et al. (2014)found that meteorological, agricultural, and hydrological droughts are closely related to climate indices such as El Southern Nino (ENSO) and Atlantic Oscillation (AO).
However, in the previous studies on drought transmission and prediction, more quantitative characteristics of drought events such as drought duration, intensity, and severity were adopted as variables, but the calculation of these features is often based on a complete drought event. That is to say, only after the end of a complete meteorological drought can the duration, intensity, and severity of the meteorological drought be obtained. But in actual circumstances, the process of a meteorological drought not yet being ended may have led to the occurrence of hydrological drought. In this case, it is difficult to describe the hydrological drought according to the characteristic amount of meteorological drought in a timely manner. As a result, it is unable to carry out hydrological drought caused by meteorological drought in a timely manner. Therefore, this study used the month-by-month SPI and SSI values as variables, which are relative in a timelier manner, such as the SPI value obtained in this month and the SSI value of the next month can be predicted. Also, as far as known, most of the scholars will focus on some aspect of drought transmission process or drought prediction, and this study is to combine the two on the basis of a drought prediction model so as to form a complete system to provide a new idea and inspiration for later research. At present, how to predict the occurrence of hydrological drought according to real-time monitored meteorological drought index value? This is an unclear problem in the spread of meteorological drought to hydrological drought. Therefore, the Standardized Precipitation Index (SPI) and the Standardized Streamflow Index (SSI) were used to characterize meteorological and hydrological droughts, respectively (Shukla and Wood, 2008). Directly using the drought index as the calculation condition and using the Copula function (Kolesarova et al., 2015), the conditional probability of different levels of hydrological drought under certain meteorological conditions is calculated, the propagation threshold of meteorological drought to hydrological drought is solved, and a theoretical basis for water resources management and early warning and control of drought is provided.
The main objectives of this study are ① to reveal the probability of hydrological drought of different levels after different levels of meteorological drought. ② Under certain probability conditions, the SPI-P(SSI|SPI) relationship curve is used to solve the propagation threshold of meteorological drought to different levels of hydrological drought. ③The hydrological drought early warning and forecast model based on the SPI-P(SSI|SPI) relationship curve is proposed and verified.
In the current environment of rapidly changing climate conditions and increasing human activities, meteorological and hydrological conditions may change. Bernaola-Galvan et al. (2001)proposed a heuristic segmentation algorithm (BG algorithm) in 2001, which can test the stationary status of the sequence, detect the mutation point, and divide the non-stationary sequence into several stationary sequences. The main ideas are as follows:
For the time series
where
The T sequence one-to-one corresponding to
where obtained from Monte Carlo simulations:
Set the critical value
If:
At this point, the X sequence is divided into two subsequences with certain differences in the mean, and then the abovementioned process is repeated for the newly obtained subsequence so that the cycle until the abovementioned conditions is no longer met. In addition, to ensure its validity, when the subsequence length is less than or equal to
The SPI was first proposed to describe the drought conditions in Colorado by McKee et al., in 1993. The SPI can be applied to monitor long-series precipitation and is widely used in drought-related research due to its advantages of multi-time scale calculation, simple computational methods, and easy access to required data (Kao and Govindaraju, 2010). The SPI was used to characterize meteorological drought. The general calculation method can be divided into two steps: calculating the Gamma distribution probability of precipitation in a certain period and normally standardizing the Gamma distribution probability. Considering the regional characteristics of precipitation, Gamma distribution, Generalized Extreme Value distribution, and Log-logistic distribution were used to fit the stream flow data, and the tests were selected according to the Akaike information criterion (AIC) and Bayesian information criterion (BIC) (Zhang et al., 2014). The division of the different drought grades is shown in Table 1 (Vicente-Serrano et al., 2012).
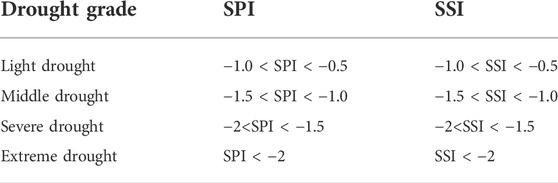
TABLE 1. Division of the different drought grades.
The standardized streamflow drought index (SSDI) is a drought index constructed by the calculation procedure of the analogy SPI (Niu et al., 2015). The variables calculated by the SPI were replaced by precipitation with stream flow, which includes all the advantages of SPI. In this study, the SSI was used to characterize hydrological drought. However, the distribution characteristics of stream flow sequence do not necessarily follow Gamma distribution well. Therefore, the Gamma distribution, Generalized Extreme Value distribution, and Log-logistic distribution were used to fit the stream flow data, and the test is performed according to the AIC and BIC. The calculation method is similar to that of the SPI, which is not repeated here.
Run theory was proposed by Yevjevivich in 1967 and has been widely used in the identification of drought events, which can identify the characteristics of drought events, such as drought onset time, end time, drought duration, and drought intensity. Specific theory and calculation methods can be used as reference (Wu et al., 2021).
Cross-wavelet transform (Paz and Mahler, 1993) was proposed by Hudgins et al. It is a new signal analysis technology based on continuous wavelet analysis technology and combining wavelet transform and cross-spectrum analysis, which can show the correlation of two time series in the time domain and frequency domain from the perspective of multiple time scales (Li et al., 2020).
Cross-wavelet transform can reflect the common high-energy region of two time series and the bit-phase relationship, which is used to analyze the correlation between the SPI and SSI.
The wavelet condensation spectrum can measure the close degree of local correlation between two time series in the time domain and frequency domain, revealing the dependence between two time series relative to frequency, and its changing characteristics in the time domain indicates the degree of linear correlation at different frequency scales and the change of coupled period signal over time, which reflect the main information of the mutual correlation structure in the time and frequency domain (Wang et al., 2020). It is defined as
where s is the scaling parameter,
The concept of Copula was first introduced by Sklar in 1959 when he answered M. Frechet’s question about the relationship between multidimensional distribution functions and low-dimensional edges. It is currently widely used in non-parametric measures to determine the dependence between random variables. Nelsen (2005)introduced and described the Copula function concretely. . Mishra and Singh (2011) (Sadeghipour and Dracup, 1985) introduced the application of Copula in drought. The edge distribution of the Copula function is very flexible. For the same Copula function, its edge distribution can be of different types, so the Copula function can construct various types of multivariate distribution, and its connection form is not limited by edge distribution, which is the main reason for choosing the Copula function to build the joint distribution of the SPI and SSI (Hao and Singh, 2015). The main ideas of solving the conditional probability by using Copula are as follows:
The abovementioned formula is a simple conditional probability calculation formula; X and Y are two random variables. When X and Y are not independent of each other, it will bring difficulties to calculate P (X,Y), but this problem can be solved by the Copula function.
The calculation problem of the joint distribution function F (X,Y) can be skipped by the abovementioned equation, but the abovementioned equation can only solve the conditional probability for a fixed value of X and Y. When X and Y are in a certain interval, the calculation method is as follows:
where C represents the Copula function and F(x) and F(y) are the distribution functions of random variables X and Y, respectively.
The Yiluo River is the largest tributary of the Yellow River below San menxia in China. There are two sources, namely, the Yi River and the Luo River. The main stream is 446.9 km in length, spanning Shanxi and Henan provinces. The basin covers about 18,900 square kilometers, and the control area of the export hydrological station is 18,563 square kilometers, accounting for about 98% of the whole basin, with an average annual stream flow of 3.2 billion cubic meters (Yue and Li, 2013).
The upper reach of the Yiluo River is a mountainous area with good vegetation and abundant water production; the middle and lower reaches are low hills and flat valleys, respectively, which are the main agricultural area.
The whole basin has a temperate monsoon climate, and the annual distribution of precipitation is uneven within the year. There are 60% of the precipitation concentrated in the flood season from July to October, which often causes large floods (Liu et al., 2013). But other seasons are often dry. Therefore, it is of great significance to study the drought characteristics and propagation process in this river basin. The basin overview is shown in Figure 1, in which HSG and LK are Heishiguan hydrological station and Lingkou hydrological station, respectively, and 57071, 57067, and 57077 are the three meteorological stations in the basin .
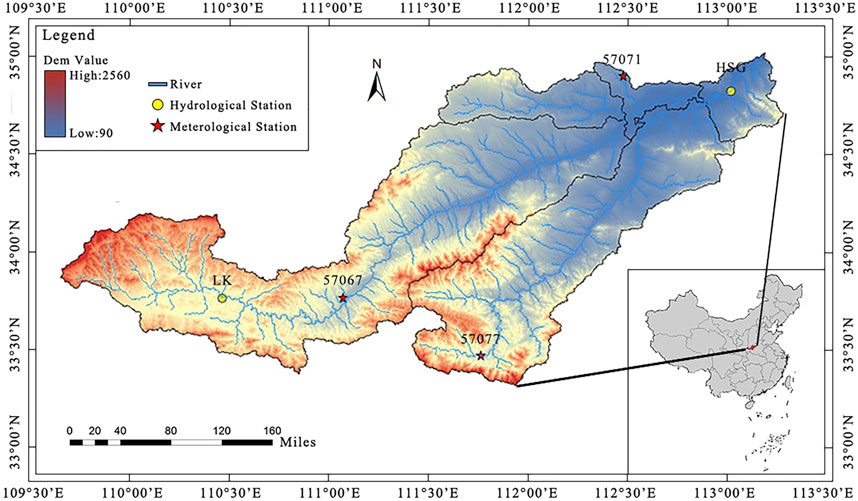
FIGURE 1. General situation of the Yiluo river basin and location of hydrological and meteorological stations.
Stream flow data used in this study: the monthly scale stream flow data of 1960–2020 are obtained from the Hydrologic Yearbook of China (Hydrologic data of the Yellow River Basin). Meteorological data: monthly scale precipitation data of three meteorological stations in 1960–2020, from China Meteorological Data Network: http://data.cma.cn/. The average precipitation in the river basin was calculated by the Tyson polygon method.
In this study, the BG segmentation algorithm was used to identify the rainfall and stream flow sequence, and L0 is the minimum segmentation scale, ensuring the validity of the statistics, generally not less than 25, P0 is the statistical significance critical value, if the maximum statistical significance value of a certain segment is greater than or equal to the value, then one can continue the segmentation; otherwise, the segmentation will not continue. The value of P0 generally ranges from 0.5 to 0.95, so the P0 and L0 were 0.95 and 25, respectively, to ensure statistical validity (Peng et al., 2017). The segmentation results are shown in Figure 2. For the precipitation sequence, as shown in Figure 2A, in the period of 732 months from January 1960 to December 2020, the mean value was maintained in a stable state, which shows that in the long series from 1960 to 2020, it remained in a stable range and can be used for the study of stationary conditions. For stream flow sequence, as shown in Figure 2B, several streams flow far beyond the mean value, but according to the segmentation results, they just exist as little mutation points, and almost all of them are near in April 1964. This is due to meteorological conditions in the Yiluo River basin. The annual precipitation is concentrated in the summer, resulting in high stream flow, but it was not segmented due to its short duration and does not reach the minimum segmentation scale criterion. The mutation in April 1964 lasted for a long time, so it was identified, which is also consistent with the diachronic data of the Yiluo River basin, which had the largest surface water resources in 1964. Considering that this mutation situation is relatively short compared to that of the long series and the mean stream flow value returns to normal after that, this mutation situation is not considered in this study and is studied according to the stationary state.
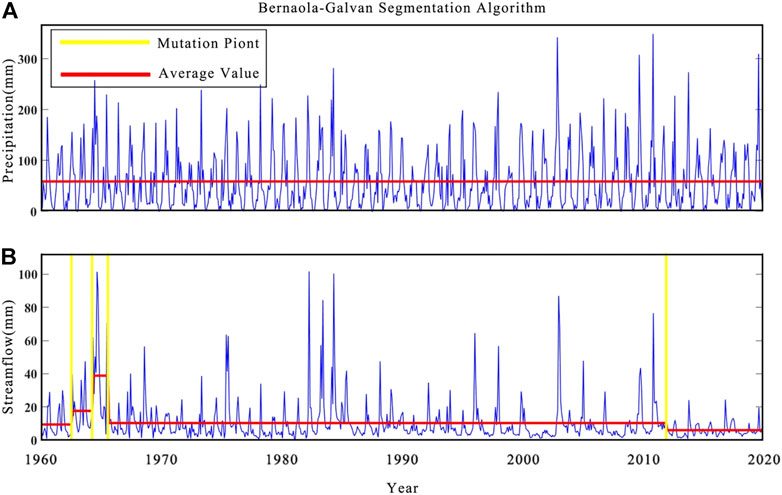
FIGURE 2. Identification results of mutation points in precipitation and streamflow sequences. (A) shows the mutation point of precipitation sequence. (B) shows the mutation point of streamflow sequence.
According to the multi-time scale characteristics of the SPI and SSI, this study calculated the SPI and SSI of 1, 2 ... 12-month scales,. According to the calculation method, the distribution function of precipitation and stream flow is fitted first. Gamma distribution, Generalized Extreme Value distribution, and Log-logic distribution are fitted to precipitation and stream flow . The AIC and BIC are used to evaluate the fitting effect, and the distribution function is optimized according to the evaluation results. The distribution fitting results are shown in Table 2:
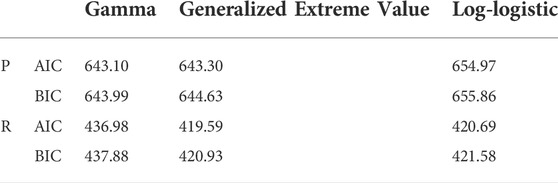
TABLE 2. Distribution function fitting effect evaluation.
According to the evaluation results of distribution fitting, the Gamma distribution is used for fitting the precipitation sequence, and the Generalized Extreme Value distribution is used for fitting the stream flow sequence. Then, the inverse operation of the normal distribution is performed to obtain the SPI and SSI sequences. The SPI on 1-, 3-, 6-, and 12-month scale and the SSI on 1-, 3-, 6-, and 12-month scale are as shown in Figure 3.
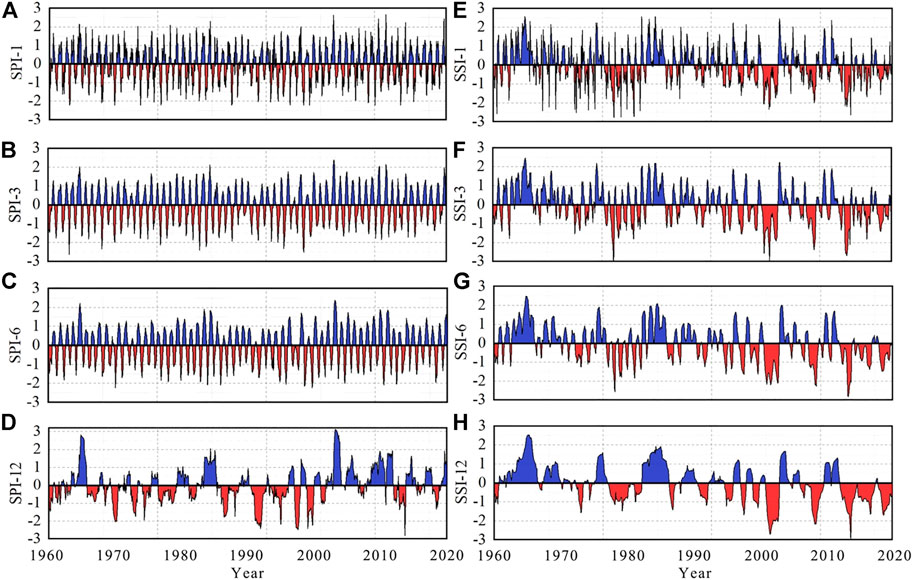
FIGURE 3. SPI and SSI values on different time scales (A), (B), (C), and (D) are the SPI on time scale of 1, 3, 6, and 12 months, respectively (E), (F), (G), and (H) are the SSI on time scale of 1, 3, 6, and 12 months, respectively.
As can be seen from the figure, the SPI and the SSI have different temporal oscillation frequencies on different time scales, and the number of drought events identified is different, and the drought duration is also different, showing different dynamic characteristics. Taking SPI as an example, specifically the SPI identified the most drought events on a short time scale of 1 month. The main drought events lasted for 1–2 months, showing frequent wet and dry alternations. The SPI on 3-month and 6-month medium time scales showed a certain seasonality to a certain extent, reflecting the cyclical variation characteristics of the climate in the Yiluo River Basin and the alternating cycles of dry and wet changes with the seasons. The SPI of the 12-month long time scales can reflect the long-term meteorological characteristics of the watershed and can clearly show the long-term drought or wet conditions of the watershed. The SSI sequence shows a similar situation to the SPI sequence.
In order to further reveal the link between meteorological drought and hydrological drought and to explore the validity of the SPI and SSI sequences, cross-wavelet analysis was used in this study. The results are shown in Figure 4. Figure 4A is the cross-wavelet power spectrum of the SPI and SSI, and Figure 4B is the cross-wavelet condensed spectrum of the SPI and SSI.
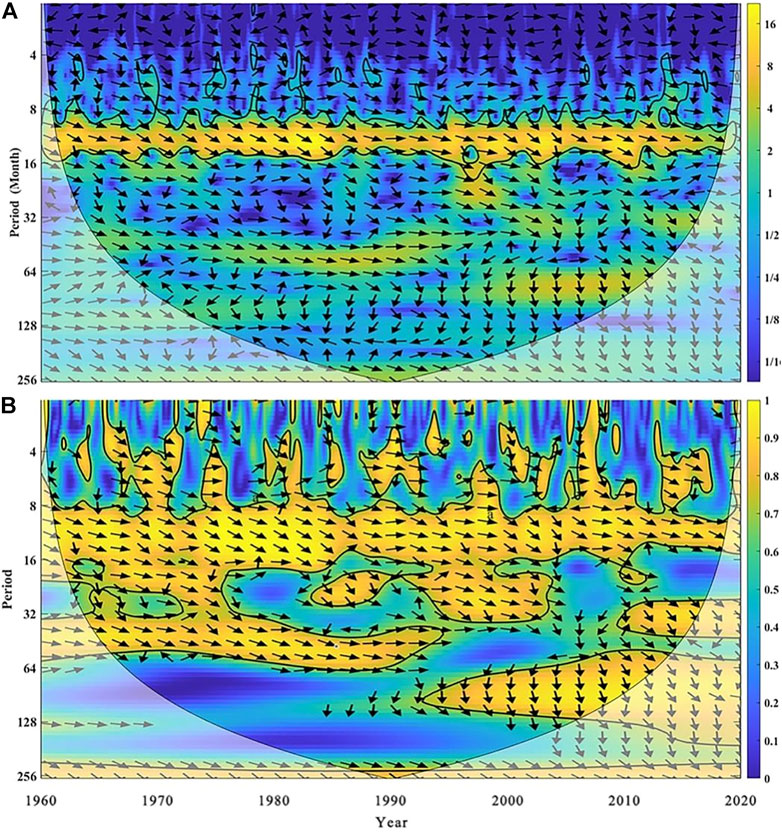
FIGURE 4. Cross-wavelet transform result (A) is Cross Wavelet Power Spectrum (B) is Cross Wavelet Condensed Spectrum.
The thick solid line area in the figure represents the test of the red noise standard spectrum under the condition of significance level α = 0.05, the arrow represents the phase relationship between the two, → represents the same phase between the impact factor and the stream flow, indicating that the two are positively correlated, ← indicates antiphase, indicating that the two are negatively correlated, ↓ indicates that the change of the impact factor precedes the change of stream flow by 90° (corresponding time is 3 months), and ↑ indicates that the change of the impact factor lags behind the change of stream flow by 90°. In order to avoid boundary effects and high-frequency wavelet false information, the area within the wavelet-influenced cone (thin arc in the figure) is the effective spectrum value (Sang, 2013). It can be seen from the figure that there is a high positive correlation between the SPI and SSI sequences on different time scales. The significance test basically runs through the entire area. The impact of the SPI on the SSI is mainly on the 8–16 month scale. The change of SPI ahead SSI stream flow varies with time, but it is basically between 30° and 90°, corresponding to 1–3 months. It reflects the propagation link between meteorological drought and hydrological drought, showing a good positive correlation, and more clearly reflects the detailed characteristics and resonance phase differences of the correlation between the two series in the time domain and frequency domain.
In this study, the run-length theory proposed by Yevjevich in 1967 was used to identify drought events and calculate related drought characteristics, including drought frequency, drought duration D, drought severity S, and drought intensity I (Montaseri et al., 2018). Among them, drought severity S is the accumulation of the drought index value within the drought duration D, and the drought intensity I is the ratio of S to D. In the process of drought identification, in order to prevent the interference of drought events with short duration and light severity, this study eliminated the drought events, that is, when the duration of a drought event is less than 1 month or its severity is greater than the threshold of drought index -0.5, the drought event was eliminated. At the same time, according to the times of meteorological drought and hydrological drought, this study calculates the propagation ratio R from meteorological drought to hydrological drought, which can measure the drought resistance of the basin (Guo et al., 2020).
where HD is the number of hydrological droughts and MD is the number of meteorological droughts.
The identification of meteorological and hydrological drought events at various levels is shown in Table 3. From the total number of drought events, the number of meteorological droughts is greater than that of hydrological droughts, indicating that meteorological droughts do not necessarily lead to hydrological droughts. Hydrological drought is a slow accumulation process, which is often caused by several meteorological droughts. The propagation ratio of meteorological drought to hydrological drought in the Yiluo River basin is 0.78, so the drought resistance is poor.
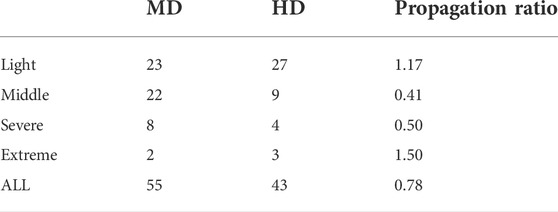
TABLE 3. Frequency and propagation ratio of meteorological and hydrological droughts in different grades.
Among the three drought characteristics: D, S, and I, any two of them can describe drought. Compared with drought duration and drought severity, the value of drought intensity can more comprehensively represent drought characteristics, and it is easier to produce abnormal values in the sequence of drought duration and drought severity. Therefore, this study selects drought intensity as the characteristic quantity to describe drought. In this study, the SPI and SSI on the scale of 1, 3, 6, and 12 months were used to identify drought events and calculate their characteristics. The statistical calculation results of drought intensity are shown in Figure 5. It can be seen from the figure that the intensity of meteorological drought is slightly stronger than that of hydrological drought, but drought intensity identified by the two time scales is roughly the same, basically between-1.0 and-1.25.
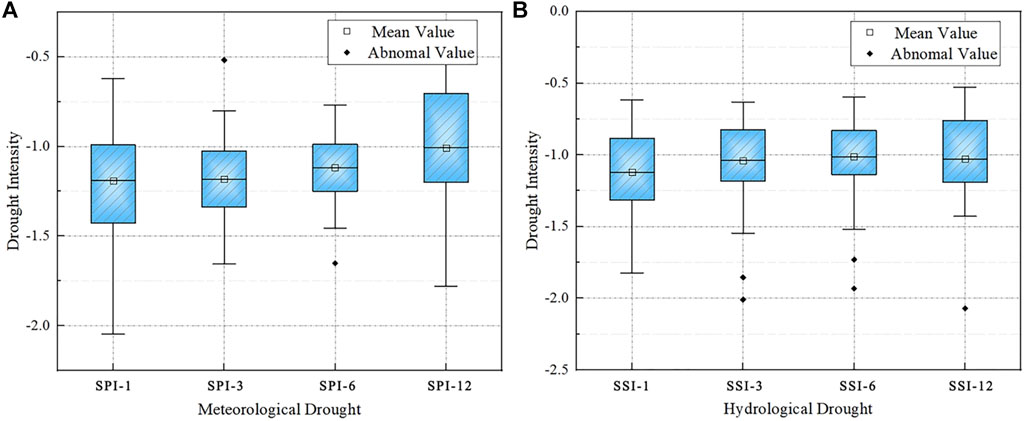
FIGURE 5. Intensity characteristic of (A) meteorological drought and (B) hydrological drought at different scales.
Drought often shows certain seasonal characteristics, as shown in Figure 6. Meteorological drought is concentrated in the winter, and almost no meteorological drought occurs in summer. Hydrological drought is relatively evenly distributed in spring and winter. Hydrological drought in spring may be caused by the delayed spread of meteorological drought in the winter of the previous year. The flood season in the Yiluo River basin is summer, and the stream flow is large, so hydrological drought occurs less.
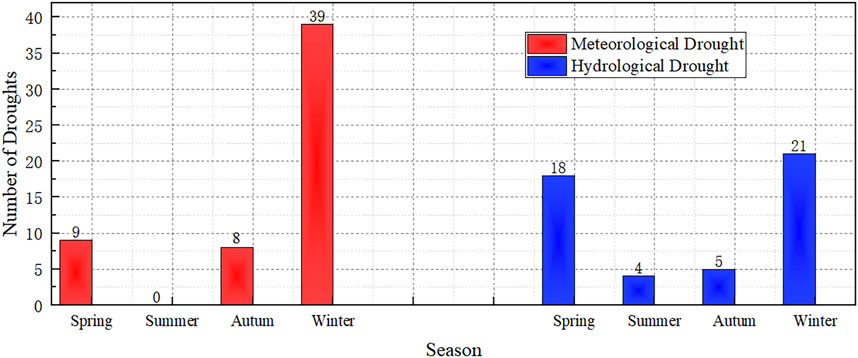
FIGURE 6. Meteorological and hydrological drought events in different seasons.
At present, for the concept of drought propagation time, the method of calculating the correlation coefficient between the SPI of multiple time scales and the SSI of 1-month time scale is adopted, and the SPI time scale corresponding to the maximum correlation coefficient is defined as drought propagation time (Ding et al., 2021). This study revealed the correlation between the SPI of 1–12 month scale and the SSI of 1–12 month scale as shown in Figure 7A. The results showed that the SPI in 2–4 months had the highest correlation with the SSI in 3 months, and the correlation coefficient was greater than 0.6.
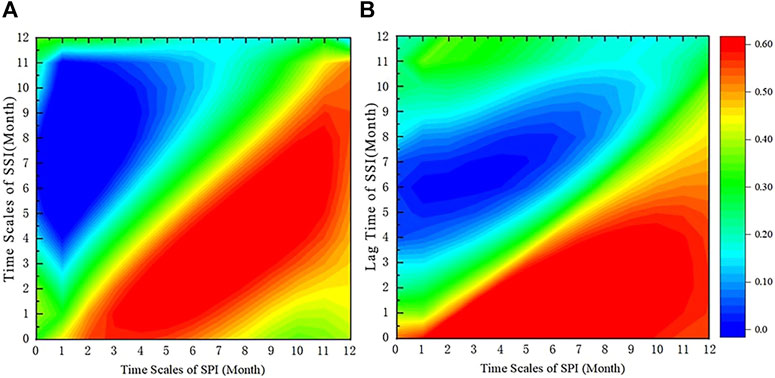
FIGURE 7. Correlation coefficient heatmap. (A) is the correlation between 1–12 month time scale SPI and 1–12 month time scale SSI. (B) is the correlation between 1–12 month time scale SPI and SSI with a lag time of 1–12 months.
We repeated the SSI sequence of 1 month for 1, 2, … 12 months and obtained the correlation between SSI delayed for a certain time and SPI of 1–12 months, as shown in Figure 7B. When the delay time is 2–4 months, the SPI corresponding to different time scales shows good correlation, with the correlation coefficient greater than 0.6. When the SPI calculation time scale is 3 months, the correlation coefficient with SSI delayed for 3 months is the highest.
In recent years, droughts have occurred and its effects are exacerbated by increased water demand and changes in hydrometeorological variables due to climate change. Various concepts have been applied to simulate drought, from simple methods to more complex models (Mishra and Singh, 2011). Therefore, it is very important to construct the drought model to study the drought transmission process and for drought prediction. Scholars at home and abroad have also studied this from different perspectives, and Schwarz et al. (2020)have constructed drought disaster, vulnerability, and risk models in different land-use situations. The model was also cross-validated using the US Drought Monitoring (USDM) (Schwarz et al., 2020). Shin et al. (2019) developed a probabilistic hydrological drought prediction method using a Bayesian network combining dynamic model prediction and drought transmission relationship to build a Bayesian network-based drought transmission drought prediction model, which is suitable for long-term hydrological drought prediction. Park et al. (2020) used the drought index based on satellite remote sensing data to build a short-term drought prediction model by convolving long and short-term memory and random forest method. Van Loon et al. (2012)studied the simulation effect of the large-scale hydrological model on the drought transmission process, and the results showed that there is still much room for improvement in the simulation of the semi-arid watershed model. This study is based on the conditional probability relationship between meteorological drought and hydrological drought and constructs the prediction model of hydrological drought based on the Standardized Precipitation Index (SPI) and the Standardized Runoff Index (SRI), which has low data requirements, simple model construction ideas, and is easy to understand and use. According to the foregoing study, the propagation time from meteorological drought to hydrological drought is 3 months, and considering that the correlation between the SPI and SSI in 3 months is the highest, this study uses the SPI and SSI sequences in 3 months as variables to construct edge distribution function, uses the Copula function to construct joint distribution, and calculates the propagation probability among meteorological and hydrological droughts of different grades based on conditional probability. In this study, Gauss, T, Gumbel, Clayton, Frank, and five Copula functions are selected to fit the edge distribution functions of the SPI and SSI. Also, the Euclidean distance (He et al., 2011) is calculated to evaluate the fitting effect. The optimizing Copula function according to evaluation results is shown in Table 4. The Cumbel–Copula function is selected as the joint distribution of the SPI and SSI.

TABLE 4. Evaluation of fitting effect of different Copula functions.
After constructing joint distribution, the interval conditional probability (Eq. (2)) is solved by using the Copula function with the SPI value as the known condition. The calculation results are shown in Figure 8, which reveals the probability of different grades of hydrological drought. For example, when light meteorological drought occurs, the probability of light hydrological drought is about 70%. These probability characteristics can provide theoretical basis for water resource managers to apply relevant measures to deal with hydrological drought when meteorological drought is monitored by the SPI.
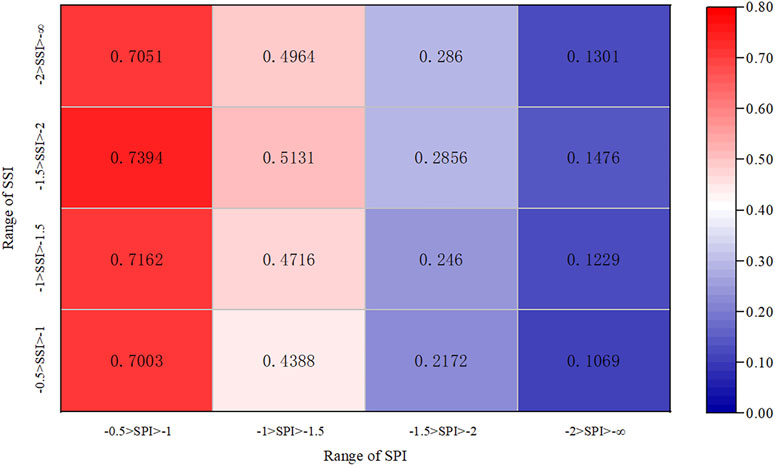
FIGURE 8. Propagation probability of meteorological drought of different grades to hydrological drought.
When the SPI value is known, how to predict hydrological drought? In this study, the values of SSI as −0.5, −1.0, −1.5, and −2.0 are given, then the points in the range of -30–10 at equal intervals as SPI values are selected, and the Copula function is used to calculate the conditional probability (Eq. 1) to obtain the relationship curve between the SPI and P(SSI|SPI), as shown in Figure 9. It can be inferred from this relationship curve that when the conditional probability value is 95%, the SPI threshold values of the propagation from meteorological drought to light, middle, severe, and extreme hydrological drought are, −7.7, −13.3, −20.8, and −29.7, respectively. According to the relationship curve between the SPI and P(SSI|SPI), combined with the monitored SPI value, we can obtain the probability of each grade of hydrological drought and further reveal the probability relationship between meteorological drought and hydrological drought. When the SPI value is abnormal, for example, if the SPI value of this month is low, the probability of occurrence of corresponding hydrological drought can be directly obtained. Combined with the propagation time from meteorological drought to hydrological drought, it provides a basis for timely decision-making on whether to take drought response measures.
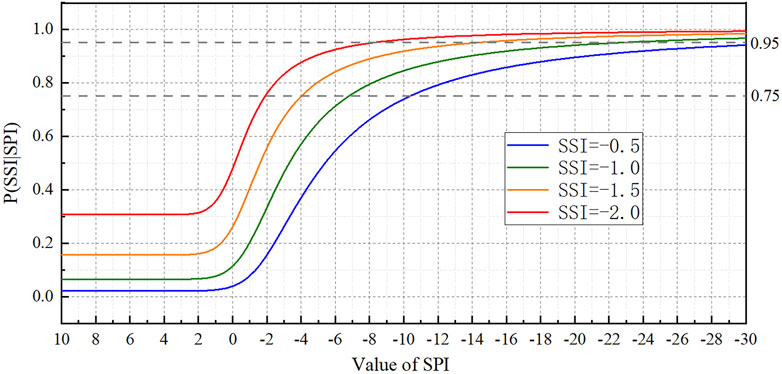
FIGURE 9. Probabilistic model of the relationship between meteorological and hydrological drought.
For the constructed model, the actual SPI sequence of 1, 3, 6, and 12 months is represented into the model formula for operation, and the SSI prediction sequence of 1, 3, 6, and 12 months is obtained. The calculation method is as follows:
On the basis of
where the Gumbel–Copula function is in the form of
where θ = 1.6902 is the parameter of the Copula function and FSSI and FSPI are the fitting distribution function of SSI and SPI, respectively.
where a and b are the parameters of the Gamma distribution function and x is the value of the SPI.
where µ, σ, and k are the location parameter, scale parameter, and shape parameter of the Generalized Extreme Value probability density function, respectively; x is the value of SSI.
Then, according to the known SPI sequence, the SSI can be solved back out by substituting the SPI in the formula, that is, the predicted value of the SSI sequence. The series of SSI-predicted values of different time scales were compared with the actual values as shown in Figure 10. As can be seen from the figure, the predicted SSI sequence is relatively stable, and the hydrological extreme value phenomenon is not obvious, but between-1–1, it is more consistent with the actual SSI sequence, and the overall trend of the predicted SSI and the actual SSI sequence is roughly the same, reflecting water deficit and surplus. These characteristics can be displayed more clearly at the calculated scale of 12 months.
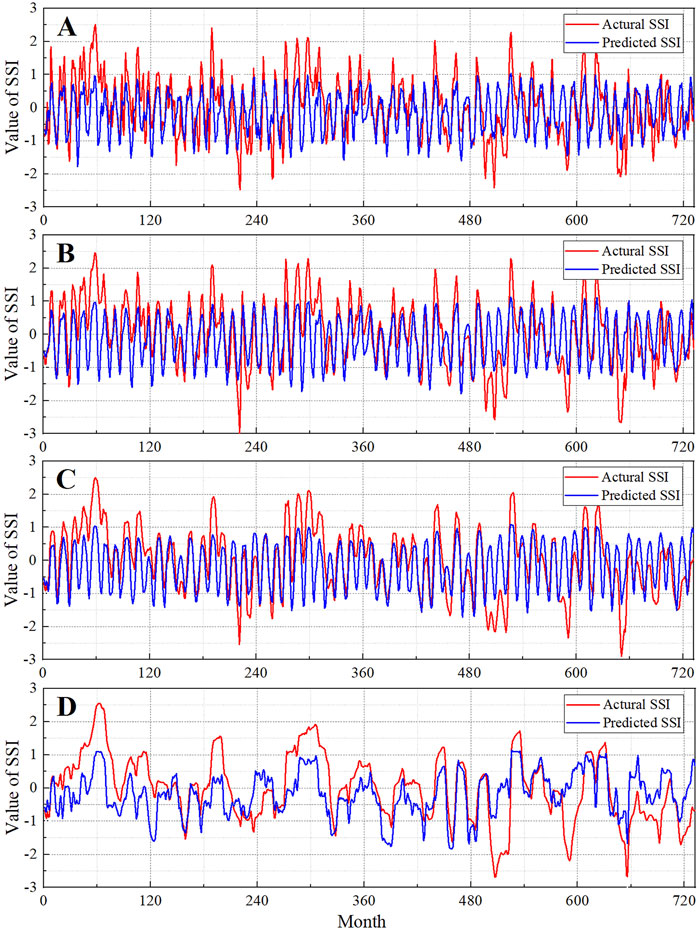
FIGURE 10. SSI sequence predicted values versus actual values(A), (B), (C), and (D) are calculated at a scale of 1, 3, 6, and12 months, respectively.
After obtaining the predicted SSI sequence, this study also tested the detection effect of the model for the specific drought events. The combination of observations and predictions can be divided into hit, drought observed and also predicted; false, drought predicted but not observed; and miss, drought observed but not predicted. The POD indicates the probability of observed droughts that are also correctly predicted: POD = H/(H + M); FAR represents the proportion of drought predicted but not confirmed observed: FAR = F/(H + F). The CSI combining POD and FAR shows the comprehensive capability of drought detection: CSI = H/(H + M + F) (Ma et al., 2015). The results given in Table 5 showed that they are consistent with the characteristics expressed by the SSI sequence, with better effect for detecting light drought events and relatively poor effect for predicting severe drought. Meanwhile, the detection rate of this model is still very high, but there is a certain false positive rate.

TABLE 5. Detection effect on specific drought events.
The stream flow data used in this study are the reduced stream flow data, so the influences of human activities such as reservoir construction, soil and water conservation measures, and irrigation water and industrial water are excluded in the research process. At present, due to the influence of a large number of human activities, climate change has intensified, and the meteorological conditions and the underlying surface conditions of the basin have changed greatly (Hao and Singh, 2015). Therefore, this study adopted the heuristic segmentation method (BG algorithm) to check the obtained precipitation and reduced stream flow series and found that the stability of the series is relatively good, so the basin can be regarded as a relatively natural basin for research. For the selection of drought index, due to the limitation of data conditions, the SPI is selected as the meteorological drought index, ignoring the influence of evapotranspiration, which can be improved in the following research; for example, the SPEI, a standardized precipitation evapotranspiration index considering potential evapotranspiration, is selected to characterize the meteorological drought characteristics. The cross-wavelet analysis used in this research is a new technology combining cross-spectrum analysis with wavelet transform, which can better reveal the relationship between two time series in time and frequency. In the process of studying drought characteristics, according to the calculation results of propagation ratios of different grades of drought, it is found that the propagation ratios of light drought and extreme drought are all greater than 1, which indicates that in the process of drought propagation, due to the characteristics of slow development and long duration of hydrological drought, it is not only affected by meteorological conditions but also seriously affected by human activities. In fact, the response of hydrological drought to meteorological drought is dependent on large-scale atmospheric circulation and the local underlying surface (Vicente-Serrano and López-Moreno, 2005). In fact, precipitation has the greatest influence on drought, but it is often a rapid and short-term process, and it has to go through a complicated process from precipitation to stream flow production, which should take into account the influence of the underlying surface factors of the basin. In addition, the seasonal characteristics of drought are very obvious, which is closely related to the climatic characteristics of the basin and the spatial and temporal distribution of precipitation. Meanwhile, the influence of evapotranspiration should also be considered. In previous studies, some scholars analyzed the influence of climatic phenomena such as El Nino Southern Oscillation and Arctic Oscillation on drought propagation, which is strongly related to the seasonal characteristics of drought, and this climatic phenomenon is closely related to evapotranspiration, which reveals the influence of basin evapotranspiration on drought propagation (Liu et al., 2020). For the study of drought propagation time, based on the correlation analysis of the multi-scale SPI and SSI sequences in the past, this study also analyzes the correlation between multi-scale SPI and lagging SSI sequences and determines the drought propagation time by comparing the two results. In addition, the correlation coefficient diagram shows certain linear characteristics. In this study, the best Copula function was selected to construct the joint distribution function between the SPI and SSI sequences, and based on conditional probability and interval conditional probability, the propagation probability and propagation threshold between meteorological and hydrological droughts of different grades were obtained. The idea of guiding water resource management and drought response according to the SPI-P(SSI|SPI) relation curve is put forward, and the probabilistic prediction model of hydrological drought is constructed, and it is verified by historical data. The model construction in this study adopts an innovative idea to construct the drought prediction model, directly starting from the drought index and combined with the quantitative drought transmission process. It is enlightening to the construction of a drought model based on the drought transmission process and provides a new idea. According to the results, this model has good timeliness for drought prediction, which is of great significance for drought control work. The validation results showed that the model is suitable for predicting mild and moderate hydrological drought and poor, severe, and extreme hydrological drought. There are three main reasons for this: First, in terms of influencing factors, the stream flow of hydrological drought has other influencing factors besides precipitation, such as the underlying surface conditions, human water intake, and drainage activities, and evaporation also promotes the occurrence of hydrological drought. These factors were not considered due to the limitation of data in this study; second, the drought transmission time, in this study, used more research before the correlation coefficient method, and the drought transmission time is a fixed value, but in fact, the drought transmission time cannot be fixed, such as in previous studies show temperature has a great influence on transmission time, in the later study, can be considered; third, in terms of specific drought events, in the long series of hydrological data research, the results show that drought events are mild and moderate, and severe and extreme drought events are relatively few, only a few times in 1960–2020, which led to the sample size of severe and extreme drought events, resulting in the fitting process of the model with poor accuracy, eventually leading to poor applicability of a severe and extreme drought model. However, the construction idea of this model can provide new direction and ideas for drought prediction research. For application in different watersheds, the calculation scale of the SPI can be adjusted according to the characteristics of watersheds. For example, the watershed with short drought propagation time can further refine the SPI sequence, taking weeks as the calculation time scale, while the watershed with long propagation time can appropriately expand the calculation scale of the SPI.
In this study, based on the calculation of conditional probability and interval conditional probability, the Copula function is used to put forward a probability model of meteorological drought spreading to hydrological drought, namely, the SPI-P (SSI | SPI) relationship curve. The probability of occurrence of hydrological drought at all levels can be obtained directly according to the real-time monitored SPI value, which improves the timeliness of drought forecasting and early warning. The main conclusions of this study are as follows:
1) Combining drought transmission and drought prediction, the construction of a new idea of drought prediction model is proposed.
2) Using the SPI-P(SSI|SPI) relationship curve, a drought prediction probability model based on the drought index is developed. After verification, it was found that the model has good ability to predict mild and moderate hydrological drought and still has room for improvement in predicting severe and extreme hydrological drought effect.
The drought prediction model constructed in this study can directly use the meteorological drought index to predict hydrological drought, which is easier to understand and apply. The model construction idea can provide new ideas and inspiration for relevant research and also has practical significance for the drought control work.
The datasets presented in this study can be found in online repositories. The names of the repository/repositories and accession number(s) can be found below: and http://data.cma.cn/ &.
HW: put forward provision and suggestions and modifications to the manuscript; YZ: data analysis, writing original draft, and discussion; QT: data collection and investigation; XZ: made drawings and tables.
This research was funded by the Key Research and Development Projects of China during the 14th Five Year Plan Period (2021YFC3000204), and the Major Scientific and Technological Projects of Henan Province, China (201300311400).
The authors declare that the research was conducted in the absence of any commercial or financial relationships that could be construed as a potential conflict of interest.
All claims expressed in this article are solely those of the authors and do not necessarily represent those of their affiliated organizations, or those of the publisher, the editors, and the reviewers. Any product that may be evaluated in this article, or claim that may be made by its manufacturer, is not guaranteed or endorsed by the publisher.
Barker, L. J., Hannaford, J., Chiverton, A., and Svensson, C. (20162016). From meteorological to hydrological drought using standardised indicators. Hydrol. Earth Syst. Sci. 20 (6), 2483–2505. doi:10.5194/hess-20-2483-2016
Bernaola-Galvan, P., Ivanov, P. C., Nunes Amaral, L. A., and Stanley, H. E. (2001). Scale invariance in the nonstationarity of human heart rate. Phys. Rev. Lett. 87 (16), 168105. doi:10.1103/physrevlett.87.168105
Ding, Y., Xu, J., Wang, X., Cai, H., Zhou, Z., Sun, Y., et al. (2021). Propagation of meteorological to hydrological drought for different climate regions in China. J. Environ. Manag., 111980. doi:10.1016/j.jenvman.2021.111980
Gao, C., Chen, S., Zhai, J., Zhang, Z., and Liu, Q. (20142014). On threshold of drought and flood disasters in Huaihe River basin [淮河流域旱涝灾害致灾气候阈值]. Adv. Water Sci. 25 (1), 36–44.
Guo, Y., Huang, S., Huang, Q., Leng, G., Fang, W., Wang, L., et al. (2020). Propagation thresholds of meteorological drought for triggering hydrological drought at various levels. Sci. Total Environ., 136502. doi:10.1016/j.scitotenv.2020.136502
Hao, Z., and Singh, V. P. (2015). Drought characterization from a multivariate perspective: A review. J. Hydrology 527, 668–678. doi:10.1016/j.jhydrol.2015.05.031
He, Y., Bardossy, A., and Zehe, E. (2011). A catchment classification scheme using local variance reduction method. J. Hydrology 411 (1-2), 140–154. doi:10.1016/j.jhydrol.2011.09.042
Huang, S., Li, P., Huang, Q., Leng, G., Hou, B., and Ma, L. (2017). The propagation from meteorological to hydrological drought and its potential influence factors. J. Hydrology 547, 184–195. doi:10.1016/j.jhydrol.2017.01.041
Hudgins, H., and Huang, J. (19961996). Bivariate wavelet analysis of Asia monsoon and ENSO. Adv. Atmos. Sci. 13 (3), 299–312. doi:10.1007/bf02656848
Kao, S-C., and Govindaraju, R. S. (2010). A copula-based joint deficit index for droughts. J. Hydrology 380 (1-2), 121–134. doi:10.1016/j.jhydrol.2009.10.029
Kolesarova, A., Mayor, G., and Mesiar, R. (2015). Quadratic constructions of copulas. Inf. Sci. 310, 69–76. doi:10.1016/j.ins.2015.03.016
Leasor, Z. T., Quiring, S. M., and Svoboda, M. D. (2020). Utilizing objective drought severity thresholds to improve drought monitoring. J. Appl. Meteorol. Climatol. 59 (3), 455–475. doi:10.1175/jamc-d-19-0217.1
Lesk, C., Rowhani, P., and Ramankutty, N. (2016). Influence of extreme weather disasters on global crop production. Nature 529 (7584), 84–87. +. English. doi:10.1038/nature16467
Li, Q., He, P., He, Y., Han, X., Zeng, T., Lu, G., et al. (2020). Investigation to the relation between meteorological drought and hydrological drought in the upper Shaying River Basin using wavelet analysis. Atmos. Res., 104743. doi:10.1016/j.atmosres.2019.104743
Liu, S., Shi, H., Niu, J., Chen, J., and Kuang, X. (2020). Assessing future socioeconomic drought events under a changing climate over the Pearl River basin in South China. J. Hydrology Regional Stud. 30, 100700. doi:10.1016/j.ejrh.2020.100700
Liu, X., Dai, X., Zhong, Y., Li, J., and Wang, P. (2013). Analysis of changes in the relationship between precipitation and streamflow in the Yiluo River, China. Theor. Appl. Climatol. 114 (1-2), 183–191. doi:10.1007/s00704-013-0833-0
Lorenzo-Lacruz, J., Vicente-Serrano, S. M., Gonzalez-Hidalgo, J. C., Lopez-Moreno, J. I., and Cortesi, N. (20132013). Hydrological drought response to meteorological drought in the Iberian Peninsula. Clim. Res. 58 (2), 117–131. doi:10.3354/cr01177
Ma, M., Ren, L., Singh, V. P., Tu, X., Jiang, S., and Liu, Y. (2015). Evaluation and application of the SPDI-JDI for droughts in Texas, USA. J. Hydrology 521, 34–45. doi:10.1016/j.jhydrol.2014.11.074
Mishra, A. K., and Singh, V. P. (2010). A review of drought concepts. J. Hydrology 391 (1-2), 202–216. doi:10.1016/j.jhydrol.2010.07.012
Mishra, A. K., and Singh, V. P. (2011). Drought modeling - a review. J. Hydrology 403 (1-2), 157–175. doi:10.1016/j.jhydrol.2011.03.049
Montaseri, M., Amirataee, B., and Rezaie, H. (2018). New approach in bivariate drought duration and severity analysis. J. Hydrology 559, 166–181. doi:10.1016/j.jhydrol.2018.02.018
Nelsen, R. B. (2005). “Copulas and quasi-copulas: An introduction to their properties and applications. 24th linz seminar on fuzzy set theory,” in Logical, algebraic, analytic, and probabilistic aspects of triangular norms (Linz, AUSTRIA, 391–413. Linzer Hochschulfonds SCCHESFL, Technol. Available from: <Go to ISI>://WOS:000230172000014.
Niu, J., Chen, J., and Sun, L. (2015). Exploration of drought evolution using numerical simulations over the Xijiang (West River) basin in South China. J. Hydrology 526, 68–77. doi:10.1016/j.jhydrol.2014.11.029
Pandey, R. P., and Ramasastri, K. S. (2001). Relationship between the common climatic parameters and average drought frequency. Hydrol. Process. 15 (6), 1019–1032. doi:10.1002/hyp.187
Park, S., Im, J., Han, D., and Rhee, J. (2020). Short-term forecasting of satellite-based drought indices using their temporal patterns and numerical model output. Remote Sens. 12 (21), 3499. doi:10.3390/rs12213499
Paz, J. P., and Mahler, G. (1993). Proposed test for temporal Bell inequalities. Phys. Rev. Lett. 71 (20), 3235–3239. doi:10.1103/physrevlett.71.3235
Peng, X., Zheng, W., Zhang, D., Liu, Y., Lu, D., and Lin, L. (2017). A novel probabilistic wind speed forecasting based on combination of the adaptive ensemble of on-line sequential ORELM (Outlier Robust Extreme Learning Machine) and TVMCF (time-varying mixture copula function). Energy Convers. Manag. 138, 587–602. doi:10.1016/j.enconman.2017.02.004
Peters, E., Torfs, P., van Lanen, H. A. J., and Bier, G. (2003). Propagation of drought through groundwater - a new approach using linear reservoir theory. Hydrol. Process. 17 (15), 3023–3040. doi:10.1002/hyp.1274
Sadeghipour, J., and Dracup, J. A. (19851985). Regional frequency-analysis of hydrologic multiyear droughts. J. Am. Water Resour. Assoc. 21 (3), 481–487. doi:10.1111/j.1752-1688.1985.tb00160.x
Sang, Y-F. (2013). A review on the applications of wavelet transform in hydrology time series analysis. Atmos. Res. 122, 8–15. doi:10.1016/j.atmosres.2012.11.003
Sattar, M. N., Lee, J-Y., Shin, J-Y., and Kim, T-W. (2019). Probabilistic characteristics of drought propagation from meteorological to hydrological drought in South Korea. Water Resour. manage. 33 (7), 2439–2452. doi:10.1007/s11269-019-02278-9
Schwarz, M., Landmann, T., Cornish, N., Wetzel, K-F., Siebert, S., and Franke, J. (2020). A spatially transferable drought hazard and drought risk modeling approach based on remote sensing data. Remote Sens. 12 (2), 237. doi:10.3390/rs12020237
Shin, J. Y., Kwon, H. H., Lee, J. H., and Kim, T. W. (2019). Probabilistic long‐term hydrological drought forecast using Bayesian networks and drought propagation. Meteorol. Appl. 27 (1). doi:10.1002/met.1827
Shukla, S., and Wood, A. W. (2008). Use of a standardized runoff index for characterizing hydrologic drought. Geophys. Res. Lett. (2), L02405. doi:10.1029/2007gl032487
Sun, W., and Cheng, B. (2008). Application of cross wavelet transformation to analysis on regional climate variations [交叉小波变换在区域气候分析中的应用]. J. Appl. Meteorolgical Sci. 19 (4), 479–487.
Talaee, P. H., Tabari, H., and Ardakani, S. S. (2014). Hydrological drought in the west of Iran and possible association with large-scale atmospheric circulation patterns. Hydrol. Process. 28 (3), 764–773. doi:10.1002/hyp.9586
Van Loon, A. F., Gleeson, T., Clark, J., Van Dijk, A. I. J. M., Stahl, K., Hannaford, J., et al. (2016). Drought in the anthropocene. Nat. Geosci. 9 (2), 89–91. doi:10.1038/ngeo2646
Van Loon, A. F., Van Huijgevoort, M. H. J., and Van Lanen, H. A. J. (2012). Evaluation of drought propagation in an ensemble mean of large-scale hydrological models. Hydrol. Earth Syst. Sci. 16 (11), 4057–4078. doi:10.5194/hess-16-4057-2012
Vicente-Serrano, S. M., Begueria, S., Lorenzo-Lacruz, J., Camarero, J. J., Lopez-Moreno, J. I., Azorin-Molina, C., et al. (2012). Performance of drought indices for ecological, agricultural, and hydrological applications. Earth Interact. 16, 1–27. doi:10.1175/2012ei000434.1
Vicente-Serrano, S. M., and López-Moreno, J. I. (2005). Hydrological response to different time scales of climatological drought: An evaluation of the standardized precipitation index in a mountainous mediterranean basin. Hydrol. Earth Syst. Sci. 9 (5), 523–533. doi:10.5194/hess-9-523-2005
Wang, F., Wang, Z., Yang, H., Di, D., Zhao, Y., Liang, Q., et al. (2020). Comprehensive evaluation of hydrological drought and its relationships with meteorological drought in the Yellow River basin, China. J. Hydrology 584, 124751. doi:10.1016/j.jhydrol.2020.124751
Wu, J., Chen, X., Yao, H., and Zhang, D. (2021). Multi-timescale assessment of propagation thresholds from meteorological to hydrological drought. Sci. Total Environ. 765, 144232. Declaration of competing interest The authors declare that they have no known competing financial interests or personal relationships that could have appeared to influence the work reported in this paper. doi:10.1016/j.scitotenv.2020.144232
Yuan, X., Zhang, M., Wang, L. Y., and Zhou, T. (2017). Understanding and seasonal forecasting of hydrological drought in the Anthropocene. Hydrol. Earth Syst. Sci. 21 (11), 5477–5492. doi:10.5194/hess-21-5477-2017
Yue, Y., and Li, Z. (2013). “Study on applications of neural network to flood forecasting in Yiluo River,” in Hydraulic engineering, 2012 sree conference) Sree Conference on Hydraulic Engineering and 2nd Sree Workshop on Environment and Safety Engineering, 2012 2013, Dec 21-22;Hong Kong, (PEOPLES R CHINA, 49–53. Soc Resources E, Engn.
Zhang, Y., Liu, K., Chen, Q., and Hu, X. (20142014). Bivariate probability distribution of meteorological drought characteristics in the aksu basin using copula [区域气象干旱特征多变量Copula分析以阿克苏河流域为例]. Sci. Geogr. Sin. 34 (12), 1480–1487.
Zhao, L., Lyu, A., Wu, J., Hayes, M., Tang, Z., He, B., et al. (2014). Impact of meteorological drought on streamflow drought in Jinghe River Basin of China. Chin. Geogr. Sci. 24 (6), 694–705. doi:10.1007/s11769-014-0726-x
Keywords: hydrological drought, meteorological drought, Copula function, conditional probability model, drought propagation
Citation: Wang H, Zhu Y, Qin T and Zhang X (2022) Study on the propagation probability characteristics and prediction model of meteorological drought to hydrological drought in basin based on copula function. Front. Earth Sci. 10:961871. doi: 10.3389/feart.2022.961871
Received: 07 June 2022; Accepted: 28 July 2022;
Published: 05 September 2022.
Edited by:
Celso Santos, Federal University of Paraíba, BrazilReviewed by:
Shengzhi Huang, Xi’an University of Technology, ChinaCopyright © 2022 Wang, Zhu, Qin and Zhang. This is an open-access article distributed under the terms of the Creative Commons Attribution License (CC BY). The use, distribution or reproduction in other forums is permitted, provided the original author(s) and the copyright owner(s) are credited and that the original publication in this journal is cited, in accordance with accepted academic practice. No use, distribution or reproduction is permitted which does not comply with these terms.
*Correspondence: Huiliang Wang, d2FuZ2h1aWxpYW5nQHp6dS5lZHUuY24=
Disclaimer: All claims expressed in this article are solely those of the authors and do not necessarily represent those of their affiliated organizations, or those of the publisher, the editors and the reviewers. Any product that may be evaluated in this article or claim that may be made by its manufacturer is not guaranteed or endorsed by the publisher.
Research integrity at Frontiers
Learn more about the work of our research integrity team to safeguard the quality of each article we publish.