 Xinxin Fang
 Hong Feng2
- 1China Coal Research Institute, Beijing, China
- 2China Coal Technology & Engineering Group Xi’an Institute, Xi’an, China
A geometric equation of borehole deformation under stress was deduced based on the basic theory of elasticity. Subsequently, we established the quantitative relationship between the in situ stress and geometrical parameters of borehole deformation. Furthermore, we proposed an in situ stress prediction model based on borehole deformation. Additionally, numerical simulations of borehole morphology in different lithologies under in situ stress were conducted to analyze the deformation effect. Logging parameters that are sensitive to the shear wave time difference, such as longitudinal wave time difference, density, and natural gamma radiation, were selected for training using an artificial neural network (ANN) to predict the shear wave time difference. The results demonstrated that 1) combining the theoretical derivation and numerical simulation, the borehole geometry under stress was quasi-elliptic, and 2) compared with the existing shear wave time difference curve, the predicted geometry by the ANN was consistent with the actual geometry. Consequently, compared with the tested data from acoustic emission, the overall error of the in situ stress predicted using the new method was less than 9.2%. Moreover, the accuracy of the coal seam was the highest, wherein the average errors of the maximum and minimum horizontal principal stresses were 2.01 and 2.56%, respectively, which confirms the feasibility of the proposed method.
1 Introduction
In situ stress is the natural stress existing in the stratum undisturbed by engineering, also known as the initial stress of rock mass or original rock stress. In situ stress analysis can intuitively reflect the variation law of in situ stress field in vertical and plane and provide basic information for drilling engineering and oil and gas reservoir development (Daniel and Christoph, 2016; Farshid et al., 2020; Zhang et al., 2021; Yang et al., 2022). It is an important reference for the selection of perforating and fracturing scale and parameters and prediction of sand production in production layers (Zou and Kaiser, 1990; Feng et al., 2019; Ju et al., 2020). In situ stress is the fundamental force that causes deformation and failure of mining and other underground engineering; in addition, its magnitude and direction have a great influence on the stability of the surrounding rock. Measurement of in situ stress is a necessary prerequisite for determining the mechanical properties of engineering rock mass, analyzing the stability of the surrounding rock, and implementing the scientific design of underground engineering excavation.
With the development of oil and gas theory, continuous exploration and development, unconventional resources, such as coalbed methane, shale oil, and gas, and tight oil and gas, show great potential under the existing technical conditions. China is rich in CBM resources, but the physical properties of coal seams are poor and the development is difficult. As fracturing is one of the key technologies to complete the effective production of CBM, the in situ stress distribution of reservoirs is a necessary parameter for the design of the fracturing process (Bell, 2006; Ju et al., 2017; Liu et al., 2021; Shi et al., 2021). In situ stress controls every link in the process of coalbed methane reservoir formation. It is the most important factor affecting the permeability of coal seam and also an important parameter that must be considered in the fracturing design and well pattern deployment of coalbed methane wells. Recently, with the increasing development of coalbed methane resources, it is extremely urgent to develop accurate and continuous in situ stress prediction methods for coalbed methane industry. However, compared with conventional natural gas, the study of in situ stress in the research and development of coalbed methane is relatively weak. It is of great practical significance to explore the distribution law and influencing factors of in situ stress in coalbed methane fields for coalbed methane exploration, development, and safe production.
In situ stress data can usually be obtained by testing, fracturing, or calculation. Test is the most direct means. Presently, more and more testing and calculation methods are available (Ishida and Saito, 1995; Cai et al., 2006; Hikweon and See, 2018). However, much difficulty exists, such as expensive cost, limited data acquisition, and the discontinuous profile of in situ stress. In situ stress measurement methods can be divided into three categories: 1) mechanical method based on the determination of strain and deformation in rock mass, such as stress recovery, stress relief, and hydraulic fracturing; 2) the geophysical method based on the measurement of acoustic emission, acoustic wave propagation law, resistivity, or other physical parameters in rock mass; and 3) determining the stress direction according to the information provided by the geological structure and underground rock mass failure. Presently, hydraulic fracturing and acoustic emission are widely used in petroleum and coal methane production (Atsushi et al., 2007; Wang and Zhang, 2018; Yang et al., 2021). The operation of hydraulic fracturing is simple and adaptable, whereas it is limited by the discontinuous data and expensive cost, and time-consuming nature. The acoustic emission method is a more accurate test method in the laboratory, which needs to rely on a large amount of core data, whereas it is limited by in situ stress data (Khair et al., 2013; Huffman et al., 2016). Therefore, considering the difficulty and cost of current methods, the author proposes an in situ stress prediction method based on the borehole deformation geometry and logging data to achieve continuous and accurate in situ stress prediction in the study area.
Borehole will be deformed to some extent by the action of stress. The geometry of the borehole after deformation reflects the stress characteristics of the borehole wall. Many studies have been carried out on borehole deformation under in situ stress. Kirsch (1898) proposed the Kirsch solution of rock mass stress and aperture deformation around the borehole, which laid the theoretical foundation of the in situ stress measurement method based on aperture deformation. Zoback et al. (1985) statistically analyzed the relationship between the borehole collapse pattern caused and in situ stress. Haison and Herrick (1985) conducted experimental research based on Zoback’s theory and proposed that borehole deformation is directly related to the stress state. Wang and Pan (1991) analyzed the borehole deformation under planar and three-dimensional stress states and derived the solution formula of displacement of borehole wall under two stress states. Peska and Zoback (1995) studied the effect of tensile strength of the surrounding rock on borehole deformation during drilling. Jaeger et al. (2009) derived the analytical solution of the displacement of the hole wall of a circular hole under far-field stress. According to Gough and Bell, the elliptical borehole is caused by shear fracture in the stress concentration zone near the borehole wall, with the long axis in the same direction as the minimum horizontal principal stress (Xu et al., 2016). The abovementioned scholars have studied the relationship between borehole displacement and in situ stress theoretically, but they have not studied the geometric morphology characteristics of borehole under stress and the prediction of in situ stress by borehole geometric morphology parameters after deformation.
Based on the analysis of the problems existed in the measurement of in situ stress, we deduced the geometric morphology equation of borehole under the action of stress theoretically and then confirmed that the shape of a borehole after deformation is quasi-elliptic. Subsequently, we established the in situ stress prediction model based on quasi-elliptic geometric parameters. Finally, we formed the in situ stress prediction method based on borehole deformation. Considering the lack of shear wave time difference (DTS), we selected the longitudinal wave time difference (DTC), density (DEN), and natural gamma (GR) that are sensitive to shear wave time difference and then established the prediction model of shear wave time difference (DTS) by training these sensitive logging parameters with an artificial neural network (ANN) to obtain the rock mechanics parameter model, namely, Young’s modulus (E) and Poisson’s ratio (
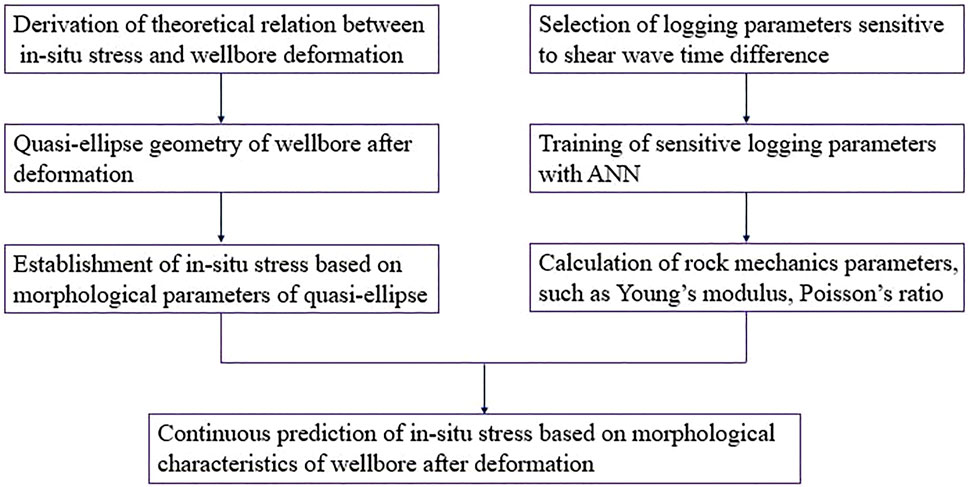
FIGURE 1. Continuous in situ stress prediction flow chart based on borehole deformation characteristics.
2 Geological setting
Qinshui Basin is located in the southeast of Shanxi Province, with a latitude of 35°–38° N and a longitude of
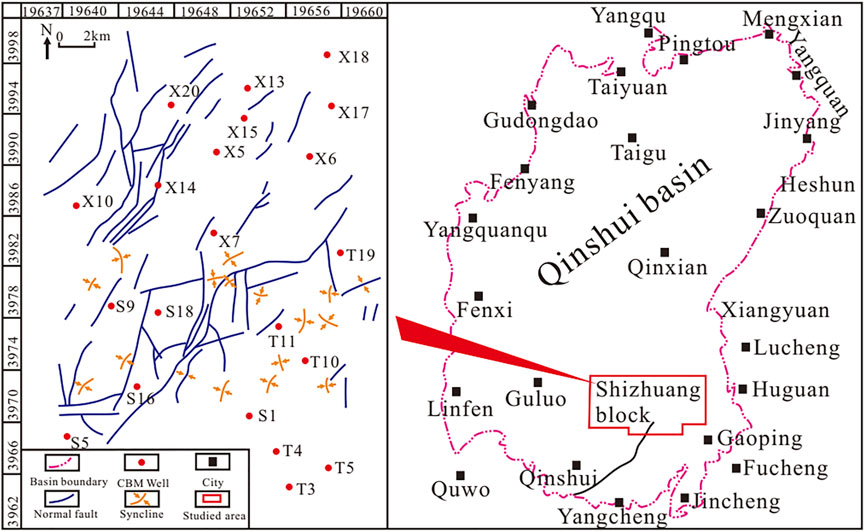
FIGURE 2. Structural topographic map of Qinshui Basin and the studied area.
3 Methods
3.1 Derivation of the theoretical relationship between in situ stress and borehole deformation
3.1.1 Borehole deformation under in situ stress
Figure 3 is a schematic diagram of the cross section of the borehole. A hole of a circular cross-section is drilled with radius r into the formation. The formation is assumed to be infinite and elastic, and the borehole is subjected to far-field stress. The stress is assumed to be positive in the direction of tension and negative in the direction of pressure, and the coordinate axes coincide with the direction of principal stress. In the X–Y coordinate system, the stress can be expressed as
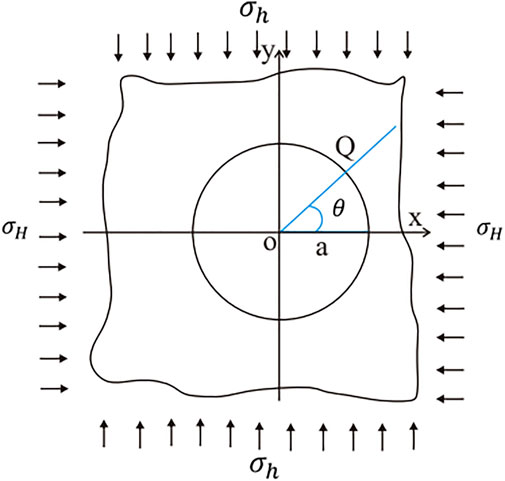
FIGURE 3. Schematic diagram of borehole displacement.
where
According to the theory of elasticity, the radial displacement Dr and tangential displacement Dt of any point Q in the well hole are
where E is Young’s modulus (GPa),
3.1.2 Quasi-elliptic structure of the borehole under in situ stress
Assuming that point Q is deformed to point
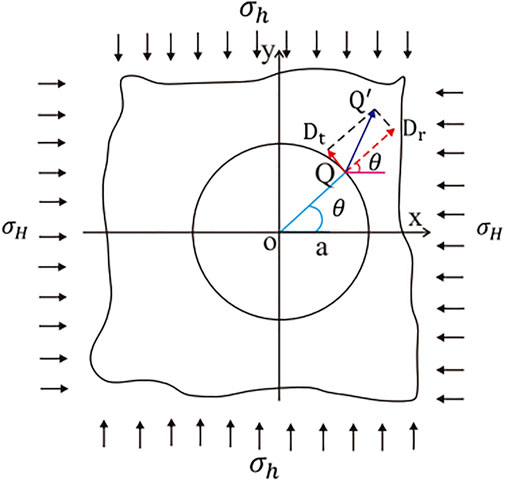
FIGURE 4. Changes at any point on the shaft wall.
Substituting Eq. 2 into Eq. 3, after simplification, we obtain
Let
Then, Eq. 4 can be expressed as
Equation 6 meets the following condition:
which is the standard ellipse equation. However, owing to the difference in the elastic modulus of rocks, A0 and B0 vary with the depth. Therefore, the geometric shape of the circular hole after deformation under the state of plane stress can be approximated as an ellipse, namely, quasi-elliptic structure. Theoretically, it is proven that the borehole morphological structure under stress is ellipse.
3.1.3 In situ stress prediction model based on quasi-elliptic borehole shape
Assuming that A and B are the lengths of major and minor semi-axes of quasi-ellipses, respectively, then when A0 > B0, namely, under tensile action, A=A0 and B=B0; when A0 < B0, namely, under compression, A=B0 and B=A0. We can solve
For the elliptic borehole, the direction of minimum horizontal principal stress is along the long axis of the ellipse. Dual caliper logs can be applied to determine the long and short axes of the ellipse (Figure 5). C13 corresponds to the long axis of the elliptical borehole. C24 corresponds to the short axis of the elliptic borehole.
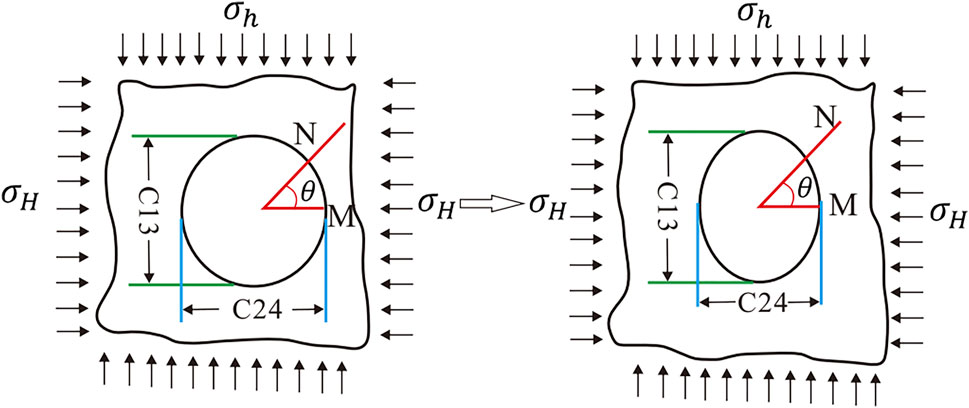
FIGURE 5. Diagram of the relation between long and short axes and diameters of the elliptic borehole.
Young’s modulus E and Poisson’s ratio
where DEN is the formation density, g/cm3; DTS is the shear wave time difference,
Density (DEN) and longitudinal wave time difference (DTC) are two parameters that can be obtained directly from conventional logging. Shear wave time difference (DTS) is not available in all wells. It is usually predicted with existing logging parameters. In this study, the artificial neural network is selected to train sensitive logging parameters to predict the shear wave time difference.
3.2 Prediction of shear wave time difference with artificial neural network
Artificial neural network (ANN) is a powerful tool applied in the computer field to deal with machine learning problems. It is widely applied in regression and classification issues (Husken et al., 2005; Deng et al., 2006; Lin et al., 2021; Fang et al., 2022). It consists of a large number of simple processing units called neurons and is developed by imitating the behavior of the human brain. Same as the human brain, the neural network collects information from the environment by “learning process”, forms a network structure of artificial neurons with hierarchical and connection relationship, and then simulates the signal transmission between neurons by a mathematical expression, thereby establishing a nonlinear equation with input and output relationship as well as being visualized by the network, which is called the ANN. Generally speaking, the ANN can fit any nonlinear function through reasonable network structure configuration; thus, it is also applied to dispose nonlinear systems or black box models with a more complex internal expression (Lv et al., 2017; Behzad et al., 2019; Zhang et al., 2020).
3.2.1 Artificial neural network structure
The artificial neural network selected in this study is a multi-layer feedforward artificial neural network. Its structure is shown in Figure 6.
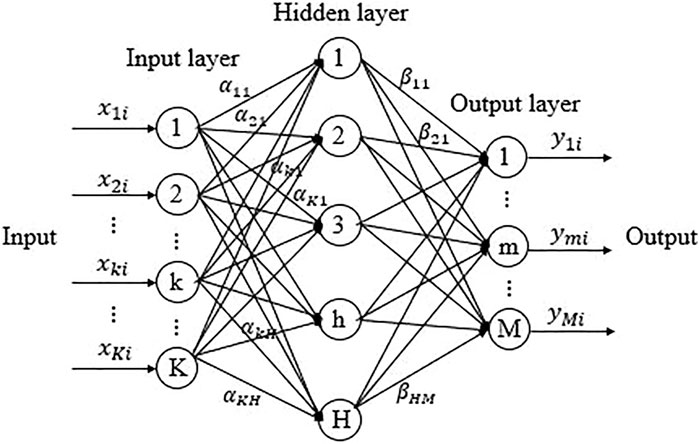
FIGURE 6. Multilayer feedforward neural network architecture.
The relationship between the input and output of the neural network above is shown in the following equation:
where ymi is the output of the mth neuron in the output layer for the ith training sample,
Shear wave time difference prediction based on the artificial neural network is completed by selecting the logging parameters sensitive to the shear wave time difference as samples for learning and training and then gradually correcting the weight of each connection, namely, the weighted sum of the bias vector, thereby making the output of the network gradually approach the inherent true value.
3.2.2 Prediction of shear wave time difference based on the artificial neural network
The prediction process of the shear wave time difference based on the ANN is shown in Figure 7, which mainly consists of an input layer, a hidden layer, and an output layer. The input layer performs outlier processing and normalization (normalization can improve the speed and accuracy of neural network training) for logging parameters that have certain correlation with s-wave logging data. Its normalization formula is
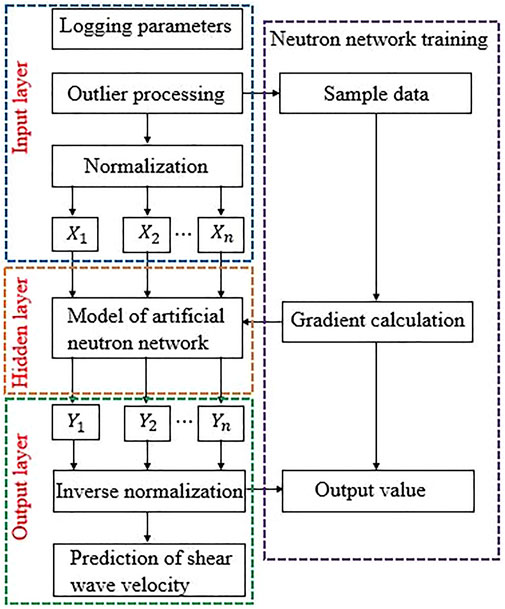
FIGURE 7. Prediction process of the shear wave time difference with the ANN.
where Xmin and Xmax are the minimum and maximum values of Xi, respectively. First, the processed data are input to the hidden layer. Then, the hidden layer receives the data and calculates with the neural network model. Subsequently, the calculated results are transmitted to the output layer. After that, the output layer receives the calculated results and conducts inverse normalization processing. Finally, the prediction of shear wave time differences is received.
In this study, three wells with complete logging data and shear wave time difference data were selected for analysis. It was found that a certain relationship between the shear wave time difference (DTS) and longitudinal wave time difference (DTC), natural gamma (GR), and density (DEN) existed with intersection analysis, as shown in Figure 8. Therefore, DTC, GR, and DEN were selected as the input of the training network of the shear wave time difference. Gradually, the weights of their connections were corrected. Subsequently, the relationship between them and the shear wave time difference trained with the neural network was approximated. Thereby, the predicted shear wave time difference approximating the real value is regarded as the output. Figure 9 shows the comparison between the predicted DTS and the measured ones in the training well. It can be seen that the predicted DTS is in line with the actual shear wave time difference, testifying that the prediction results are reliable.
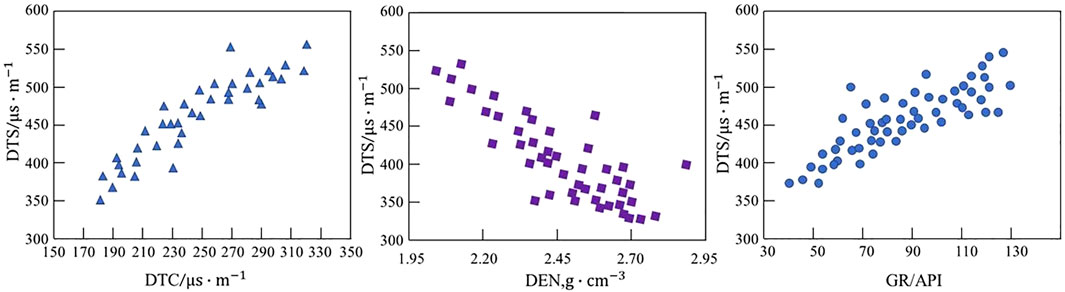
FIGURE 8. Cross plot of logging parameters and s-wave time difference (DTS).
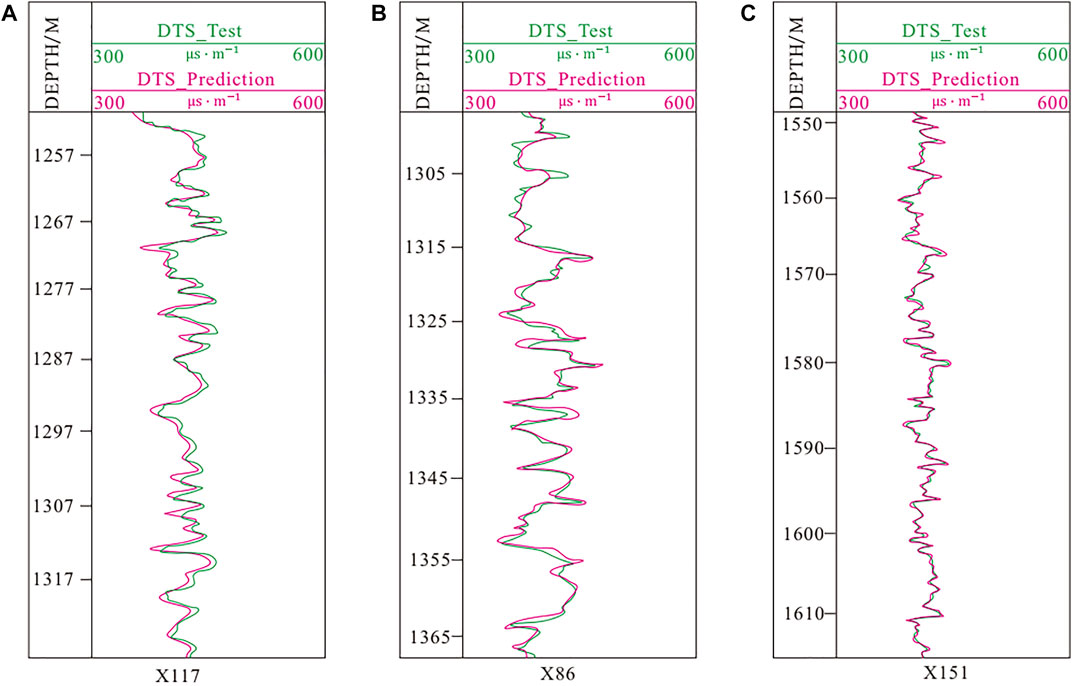
FIGURE 9. Comparison between the measured shear wave time difference and prediction in different wells.
3.3 Numerical simulation of borehole morphology under stress
The formation around the borehole is highly sensitive to stress, resulting in the borehole morphology being changed under stress. In the process of numerical simulation, it is assumed that the stratum around the hole is isotropic and homogeneous; in addition, under the action of uniform horizontal in situ stress, the studied issue is simplified as the plane strain ones. The geometric size of the model is designed as a square of 0.2 m × 0.2 m, with the aperture of hole 0.015 m (Figure 10). The rock physical parameters of the strata are shown in Table 1.

FIGURE 10. Grid structure of numerical simulation.
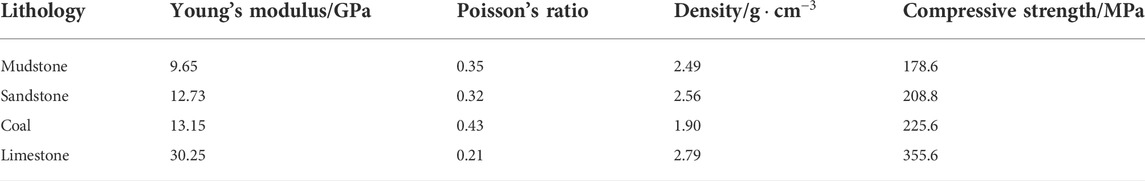
TABLE 1. Setting of petrophysical parameters.
Mudstone, sandstone, coal, and limestone were selected in the numerical simulation. The maximum and minimum horizontal principal stress was set according to the compressive strength four types of rocks. It can be seen from Figure 11, within the scope of the compressive strength, the geometric morphology of the borehole under the maximum and minimum horizontal principal stress is an ellipse shape. The direction of the maximum horizontal principal stress is parallel with the short axis of the ellipse, which is consistent with the theoretical derivation. Affected by the influence of in situ stress, the deformation degree of the borehole wall of mudstone is larger than that of other lithologies; in addition, the deformation extent of limestone is the least. Therefore, it is further indicated that the maximum and minimum horizontal principal stresses can be predicted according to pore morphology characteristics.
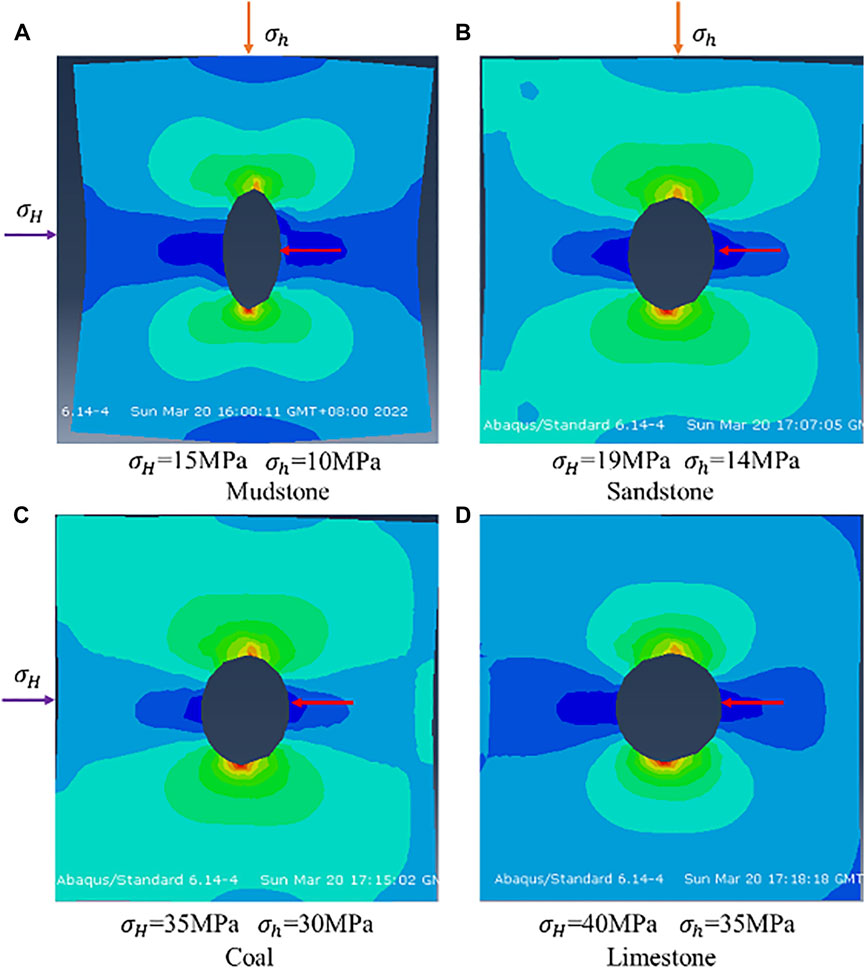
FIGURE 11. Numerical simulation of the borehole morphology of different lithologies under in situ stress.
4 Results
4.1 Comparison of prediction and test
The method proposed in this study is applied to the S16 well to obtain the continuous profile of the maximum and minimum in situ stress in a single well (Figure 12). According to this profile (Figure 12), the maximum and minimum horizontal principal stress shows an increasing trend with depth; in addition, the maximum horizontal principal stress is greater than the minimum horizontal principal stress. The mean values of the maximum horizontal principal stress of mudstone, fine sandstone, gritstone, coal, and limestone are 21.8, 25.0, 26.3, 33.9, and 40.7 MPa, respectively. The mean values of the minimum horizontal principal stresses corresponding to these five lithologies are 18.1, 23.1, 23.9, 30.2, and 34.1 MPa, respectively. Based on the statistics on the azimuth of the long axis of the ellipse, it is exhibited that the azimuth of the long axis of the ellipse is 302°–319°; thus, the direction of the maximum principal stress is approximately N300E (Table 2).
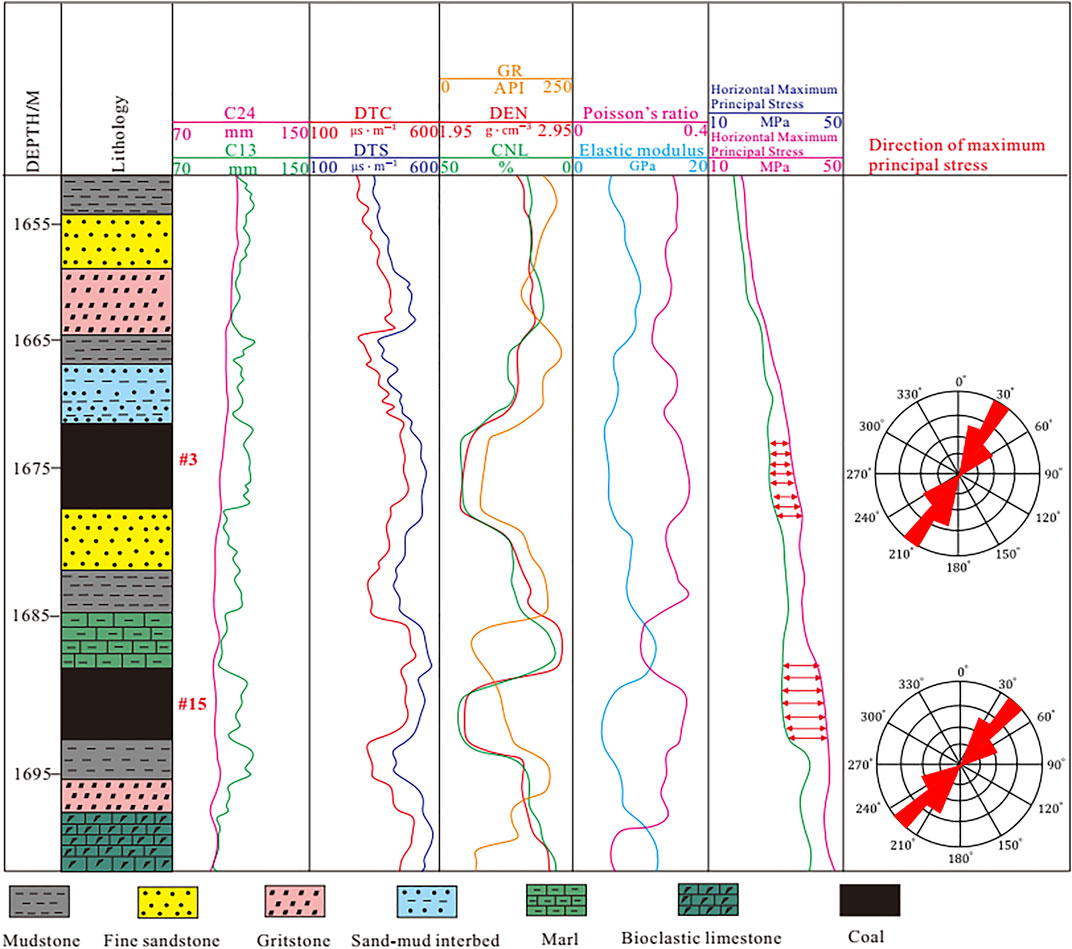
FIGURE 12. In situ stress prediction profile of well S16.

TABLE 2. Direction of the long axis of ellipse and maximum principal stress.
By comparing the in situ stress predicted by the new method with acoustic emission data in the laboratory (Table 3), it can be found that the average error of the maximum horizontal principal stress is 6.1% and the average error of the minimum horizontal principal stress is 7.0%. The average error of the maximum horizontal principal stress predicted by the new method is greater than that of the minimum horizontal principal stress. In addition, the error of different lithologies is also different. The prediction errors of the maximum horizontal principal stress of mudstone, fine sandstone, gritstone, coal, and limestone are 5.82, 3.89, 3.27, 2.01, and 2.52%, respectively. The prediction errors of the minimum horizontal principal stress of these five lithologies are 8.36, 3.99, 2.53, 2.56, and 3.19%, respectively. The prediction error of the maximum and minimum horizontal principal stress of coal in five lithologies is the smallest. Generally, the average error of the new method is lower than 9.2%, which can meet the demand of production.
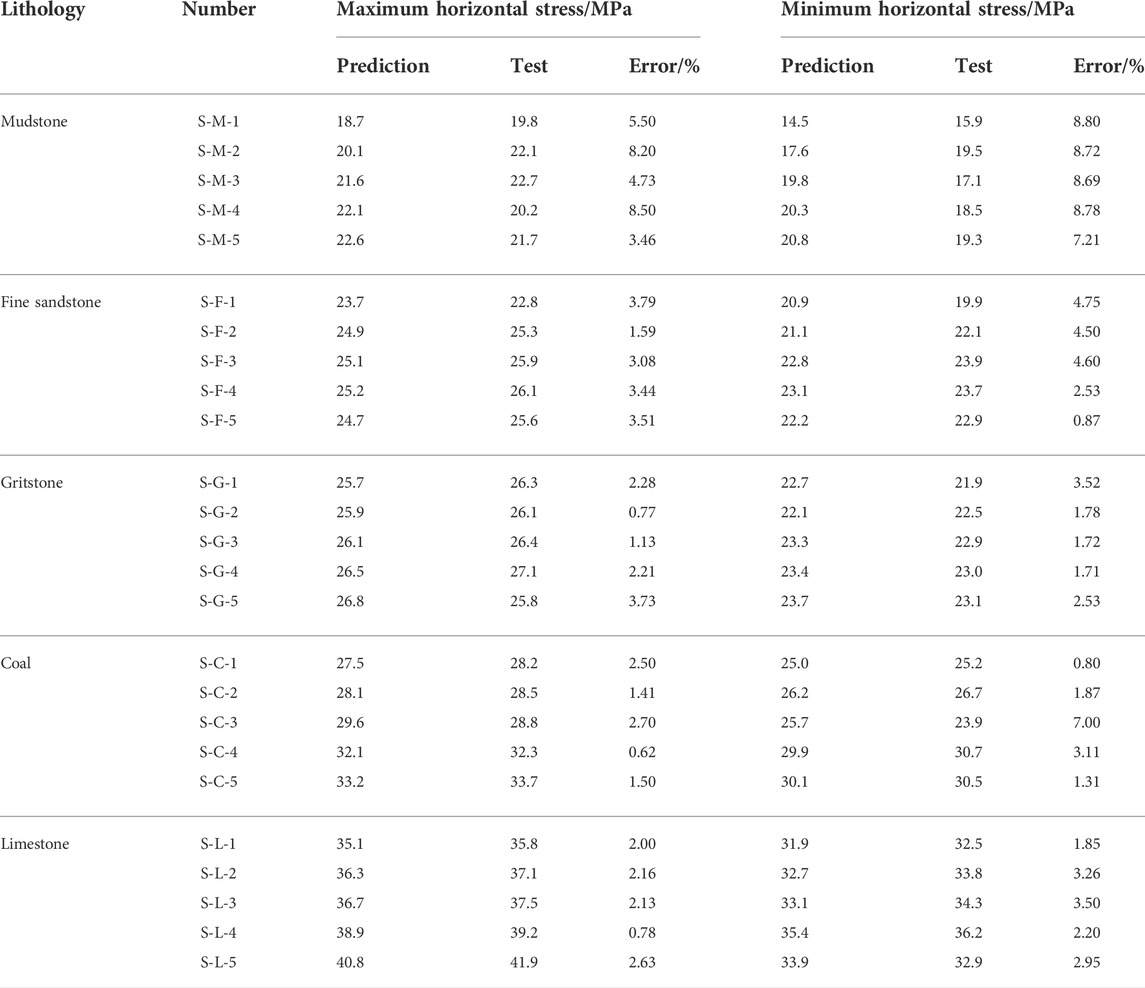
TABLE 3. Contrast between prediction by the new method and test by acoustic emission.
4.2 Distribution of maximum horizontal principal stress and differential stress
The new method was applied to predict the in situ stress of the coal seam in 15 wells of the study area. The plane distribution of the in situ stress and difference of horizontal principal stress (
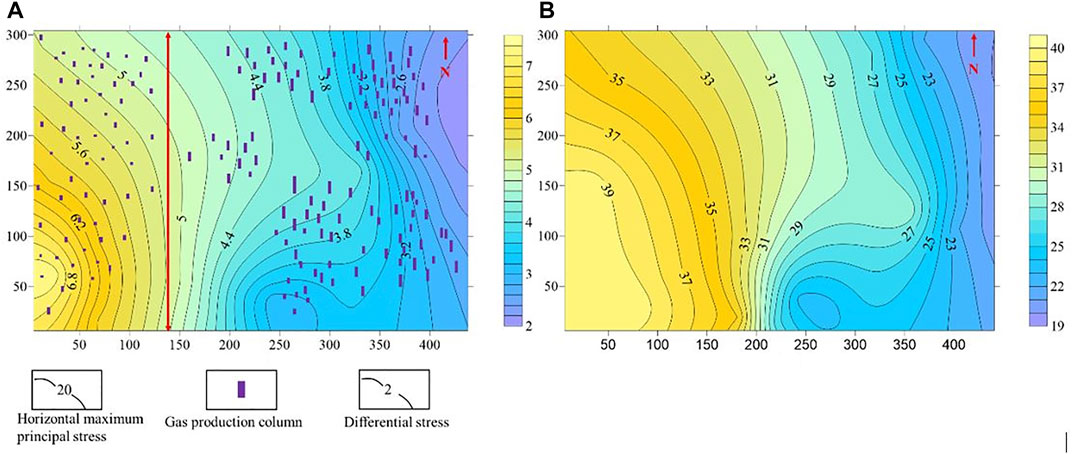
FIGURE 13. Distribution of the maximum horizontal principal stress, horizontal principal stress difference (
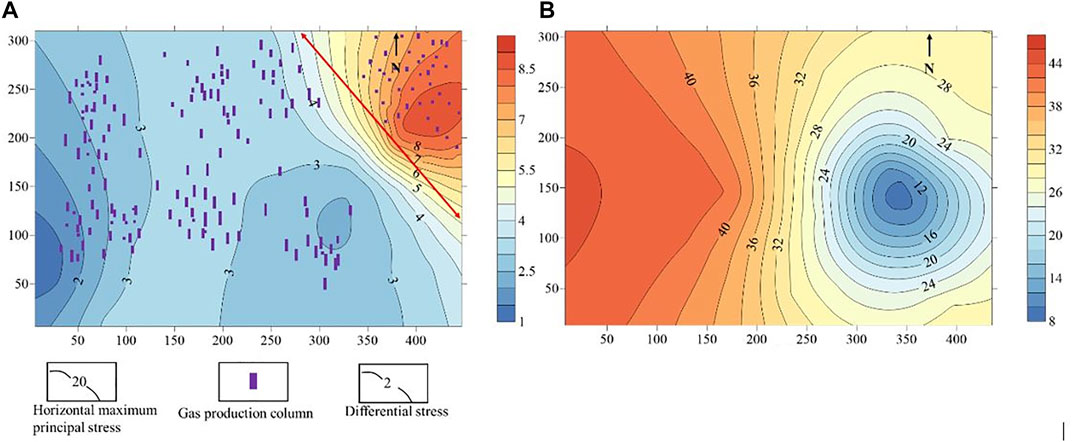
FIGURE 14. Distribution of the maximum horizontal principal stress, horizontal principal stress difference (
5 Discussion
5.1 Analysis of applicability of the new method
Generally, without the interference of external factors, the three-dimensional in situ stress in the crust is in the equilibrium state. When the formation is drilled, the in situ stress around the borehole will be changed rapidly, breaking the original in situ stress balance and then redistributing. Owing to the existence of horizontal differential stress in the formation, the stress concentration in the borehole wall leads to deformation of the borehole. Theoretical derivation shows that the geometric morphology equation of borehole deformation under stress is an elliptic equation, namely, the borehole shape under stress is ellipse. Thus, the quasi-elliptic shape structure of the deformation of the shaft wall under in situ stress is applied to calculate the in situ stress. Numerical simulation shows that the borehole shape of different types of rocks tends to be a quasi-elliptic shape structure under the in situ stress, which is consistent with theoretical deduction. The direction of the maximum horizontal principal stress is parallel to the short axis of ellipse, while the direction of the minimum horizontal principal stress is parallel to the long axis of the ellipse.
For the same lithology, the degree of borehole ellipticity depends on the maximum and minimum horizontal principal stress
The softer the stratum is, the more elliptical the borehole shape structure becomes under the action of stress. Therefore, the elliptical shape of mudstone under the action of stress is the most prominent among the five types of rocks: mudstone, fine sandstone, gritstone, coal, and limestone. The measurement of borehole diameter is conducted by the formation dip angle and four-wall borehole diameter logging instrument. The downhole measuring device consists of four measuring arms, 1–3 and 2–4, which are perpendicular to each other, located in the same plane and in close contact with the borehole wall. When the logging cable is raised from the bottom of the hole, the device rotates at a rate in the hole, with C13 corresponding to the long axis of the elliptical hole and C24 corresponding to the short axis of the elliptical hole. Consequently, the borehole shape structure can be measured to predict the formation stress.
The method proposed in this study is applied to coal measure strata in Qinshui Basin, which are mainly composed of mudstone, fine sandstone, gritstone, coal, and limestone. By comparing the in situ stress predicted by the new method with the ones measured by the acoustic emission method, it is revealed that the overall error is less than 9%, which meets the actual needs of the production. Among these five lithologies, the accuracy of the maximum and minimum horizontal principal stress of coal is the highest, with an error of 2.01 and 2.56%, respectively, followed by fine sandstone, gritstone, and limestone, and the accuracy of the maximum and minimum horizontal principal stress of mudstone is the lowest. Although the borehole structure of mudstone is more elliptic under stress, mudstone easily expands with low strength when exposed to water. Hence, the instrument will meet much difficulty in the process of pushing in the mudstone, resulting in measurement errors. As mudstones are softer, some of the elliptic deformation of mudstone is owing to hydration expansion rather than stress, which increases the prediction error. Compared with fine sandstone, gritstone, and limestone, the hardness of coal is relatively soft and its strength is relatively low; in addition, its swelling effect is not obvious when it is exposed to water. However, the deformation of the coal seam borehole is mainly due to the in situ stress. Consequently, more accurate in situ stress data can be achieved by measuring the borehole shape structure of the coal seam. Due to the large hardness of limestone is very large, although the hydration expansion effect is very weak, the limestone borehole will have obvious deformation caused by the in situ stress in the deeper strata with great in situ stress. Therefore, the prediction method of in situ stress based on the borehole deformation proposed in this study is applicable for deep coal measure strata.
5.2 Sensitivity analysis of coal seam permeability to in situ stress
Permeability of the coal seam is sensitive to in situ stress. It can be seen from Figure 15C that the permeability and maximum principal stress of the coal seam decrease exponentially. The in situ stress of the coal seam usually increases with the depth. Affected by the in situ stress, the opening of pore fissure is difficult and the connectivity is adversely affected, thereby decreasing the permeability, which is not conducive to the production of coalbed methane, resulting in reduction of gas production.
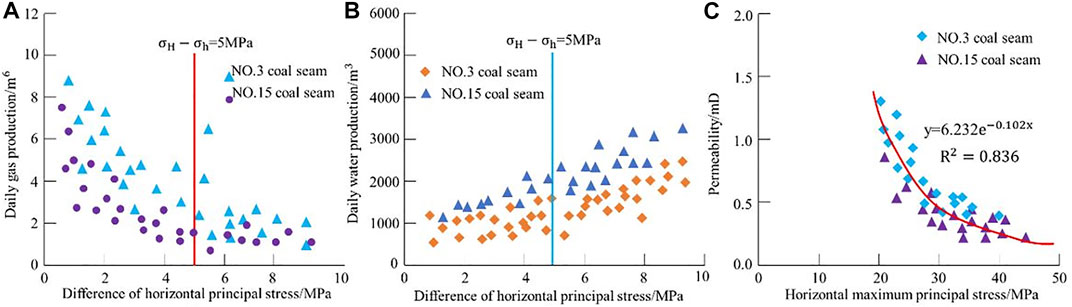
FIGURE 15. Relationship between the horizontal principal stress and daily gas volume, daily water volume, and permeability.
Owing to the difference of regional in situ stress, the permeability difference between the No. 3 coal seam and No. 15 coal seam in the study area is obvious. The horizontal principal stress of the No. 15 coal seam is generally greater than that of the No. 3 coal seam; correspondingly, the corresponding permeability of the No. 15 coal seam is less than that of the No. 3 coal seam. The higher the permeability, the more favorable the gas flow. According to Figure15A, it can be illustrated that the daily gas flow of the No. 3 coal seam is greater than that of the No. 15 coal seam. The high in situ stress makes the pore structure of the No. 15 coal seam worse, which is a factor causing the low daily gas flow of the No. 15 coal seam.
Permeability affects the productivity of CBM of a single well. The correlation analysis between the horizontal principal stress difference (
6 Conclusion
1) Based on the theory of elasticity, this study deduces the geometric morphology equation of a borehole under the action of in situ stress. We verified that the borehole shape under in situ stress is a quasi-elliptic structure through numerical simulation and evaluated the feasibility of the method of predicting in situ stress with quasi-elliptic geometric parameters.
2) The DTS was sensitive to the DTC, GR, and DEN logging parameters. Based on the sensitive logging parameters, the predicted DTS with a multi-layer feedforward ANN is significantly in line with the measured values, which provides accurate rock mechanical parameters for in situ stress prediction.
3) The comparison between the in situ stress prediction of the coal measure strata by the new method and the acoustic emission test shows that the average error of the maximum and minimum horizontal principal stresses predicted by the new method is less than 9.2%, which meets the production demand. Compared with the prediction results of mudstone, fine sandstone, gritstone, and limestone, the new prediction method achieved the smallest average error in the coal seam, whose value was 2.15%.
4) The gas production of CBM wells in the study area is highly correlated with the distribution law of in situ stress. The maximum horizontal principal stress and horizontal principal stress difference were inversely proportional to the daily gas production. When the horizontal principal stress difference was less than 5 MPa, the daily gas production was more than 1,000 m3; otherwise, it was less than 1,000 m3. The No. 3 coal seam presents a high-yield gas area west of the study area, while the No. 15 coal seam presents a high-yield gas area east of the study area.
Data availability statement
The raw data supporting the conclusions of this article will be made available by the authors, without undue reservation.
Author contributions
XF completed the conception, design of structure, writing, revision, acquisition and analysis of data. HF completed the revision of some figures and improvements of language and actual application. YW completed the revision of theory and numerical simulation and the final approval of the version to be published. TF completed the revision of method and update of data.
Funding
Funding was supported by the National Natural Science Fund of China (51974332), the Key Basic Research Program of Natural Science of Shannxi Province [2022JZ-16], and the Key Top-level Design Program of the Major Project of Science and Technology Innovation and Entrepreneurship Foundation of Tiandi Technology Co., Ltd. [2020-TD-ZD003].
Acknowledgments
I acknowledge the suggestion of my co-authors.
Conflict of interest
The authors declare that the research was conducted in the absence of any commercial or financial relationships that could be construed as a potential conflict of interest.
Publisher’s note
All claims expressed in this article are solely those of the authors and do not necessarily represent those of their affiliated organizations, or those of the publisher, the editors, and the reviewers. Any product that may be evaluated in this article, or claim that may be made by its manufacturer, is not guaranteed or endorsed by the publisher.
References
Atsushi, M., Tsuneo, Y., Hiroshi, I., and Matsumoto, S. (2007). In-situ stress measurement by the stress relief technique using a multi-component borehole instrument. Earth Planets Space 59, 133–139. doi:10.1186/bf03352686
Behzad, M., Hossein, I., and Memarian, H. (2019). Shear wave velocity prediction using Elman artificial neural network. Carbonates Evaporites 34, 1281–1291. doi:10.1007/s13146-017-0406-x
Bell, J. S. (2006). In-situ stress and coal bed methane potential in Western Canada. Bull. Can. Pet. Geol. 54, 197–220. doi:10.2113/gscpgbull.54.3.197
Cai, M. F., Chen, C. Z., and Peng, H. (2006). In-situ stress measurement by hydraulic fracturing technique in deep position Wanfu coal mine. Chin. J. Rock Mech. Eng. 25, 1069–1074.
Daniel, G., and Christoph, B. (2016). In-situ stress measurement and prediction of stresses and strain during casting of steel. Metallurgical Mater. Trans. 6, 1–19. doi:10.1007/s11661-015-3184-x
Deng, G. T., Ma, N. J., and Jia, M. K. (2006). Application of artificial neural network in identifying lithology of roadway strata. J. Min. Saf. Eng. 23, 182–188.
Fang, X. X., Feng, H., and Wang, H. (2022). Study on intelligent prediction method of rock drillability based on Bayesian lithology classification and optimized BP neural network. Petroleum Sci. Technol. 40, 2141–2162. doi:10.1080/10916466.2022.2036759
Farshid, M., Mohammad, A. R., and Hamed, G. M. (2020). Prediction of in situ stresses, mud window and overpressure zone using well logs in South Pars field. J. Pet. Explor. Prod. Technol. 10, 1869–1879. doi:10.1007/s13202-020-00890-9
Feng, J. W., Shang, L., Li, X. Z., and Luo, P. (2019). 3D numerical simulation of heterogeneous in situ stress field in low-permeability reservoirs. Pet. Sci. 16, 939–955. doi:10.1007/s12182-019-00360-w
Fu, X. L., Dai, J. S., and Zhang, D. D. (2017). Prediction of fractures of seam No.3 in northern Shizhuang Qinshui basin. Coal Geol. Exploration 1, 56–63.
Haison, B. C., and Herrick, C. G. (1985). “In-situ stress evaluation from borehole breakouts: experimental studies,” in 26th US symposium on rock mechanics, Rapid City, CD, 1985, 1207–1218.
Hikweon, L., and See, H. O. (2018). Estimation of in situ stresses with hydro-fracturing tests and a statistical method. Rock Mech. Rock Eng. 51, 779–799. doi:10.1007/s00603-017-1349-1
Huffman, K. A., Saffer, D. M., and Dugan, B. (2016). In situ stress magnitude and rock strength in the nankai accretionary complex: a novel approach using paired constraints from downhole data in two wells. Earth Planets Space 68, 123–132. doi:10.1186/s40623-016-0491-4
Husken, M., Jin, Y., and Sendhoff, B. (2005). Structure optimization of neural networks for evolutionary design optimization. Soft Comput. 9, 21–28. doi:10.1007/s00500-003-0330-y
Ishida, T., and Saito, T. (1995). Observation of core discing and in situ stress measurements; stress criteria causing core discing. Rock Mech. Rock Eng. 28, 167–182. doi:10.1007/bf01020150
Jaeger, C. J., Neville, G. W. C., and Robert, Z. R. (2009). Fundamentals of rock mechanics. UK: John Wiley & Sons.
Ju, W., Niu, X. B., Feng, S. B., You, Y., Xu, K., Wang, G., et al. (2020). Predicting the present-day in situ stress distribution within the Yanchang formation Chang 7 shale oil reservoir of Ordos Basin, central China. Pet. Sci. 17, 912–924. doi:10.1007/s12182-020-00448-8
Ju, W., Shen, J., Qin, Y., Meng, S., Li, C., Li, G., et al. (2017). In-situ stress distribution and coalbed methane reservoir permeability in the Linxing area, eastern Ordos Basin, China. Front. Earth Sci. 12, 545–554. doi:10.1007/s11707-017-0676-6
Khair, D., Cooke, M., and Hand, M. (2013). The effect of present day in situ stresses and paleo-stresses on locating sweet spots in unconventional reservoirs, a case study from Moomba-Big Lake fields Cooper Basin South Australia. J. Petroleum Explor. Dev. 3, 207–221. doi:10.1007/s13202-013-0082-x
Kirsch, G. (1898). Die theorie der elastizitat und die bedürfnisseder festigkeitslehre, 42. UK: Veit Ver Deut Ing, 797–807.
Lin, L., Wang, J., and Liu, X. J. (2021). Prediction for permeability of tight reservoir based on artificial neural network. Well Logging Technol. 45, 179–183. doi:10.16489/j.issn.1004-1338.2021.02.012
Liu, B., Huang, W. H., and Ao, W. H. (2014). Adsorption capacity of high-rank coal and its influencing factors: taking shizhuang block of Qinshui basin as an example. J. Xi’an Shiyou Univ. Nat. Sci. Ed. 29, 31–41.
Liu, S. S., Peng, G. X., and Yin, G. M. (2021). A study on the in-situ stress conditions at the Kailuan mining area in China and their influence on coal mine water inrush. Arab. J. Geosci. 14, 2057–2066. doi:10.1007/s12517-021-08276-9
Lv, J., Xie, R. C., and Zhou, W. (2017). Application of LM-BP neural network in simulation of shear wave velocity of shale formation. J. China Univ. Pet. 41, 75–83. doi:10.3969/j.issn.1673-5005.2017.03.009
Peska, P., and Zoback, M. D. (1995). Compressive and tensile failure of inclined wellbores and determination of in-situ stress and rock strength. J. Geophys. Res. 100, 12791–12811. doi:10.1029/95jb00319
Shi, X. H., Zhang, J. X., and Li, Q. G. (2021). Characteristics of in situ stress field in the Huainan mining area, China and its control factors. Environ. Earth Sci. 80, 682–700. doi:10.1007/s12665-021-09991-y
Wang, C. L., and Zhang, X. D. (2018). Distribution rule of the in-situ stress state and its influence on the permeability of a coal reservoir in the southern Qinshui Basin, China. Arab. J. Geosci. 11, 586–595. doi:10.1007/s12517-018-3938-z
Wang, J., Kang, Y. S., and Jiang, B. Y. (2017). Difference of CBM development conditions in Shouyang and Shizhuang blocks, Qinshui basin. Coal Geol. Exploration 4, 57–62.
Wang, L. J., and Pan, L. Z. (1991). Crustal stress measurements and their application in engineering. Beijing: Geological Publishing House, 1–31.
Wu, H., Zhao, M., Zhuo, Q., Lu, X., Wang, L., Li, W., et al. (2020). The effect of salt on the evolution of a subsalt sandstone reservoir in the Kuqa foreland basin, Western China. Carbonates Evaporites 35, 72–12. doi:10.1007/s13146-020-00604-6
Xu, L. Q., Shi, M. C., and Meng, Y. F. (2016). Analysis on the stress distribution of elliptic borehole in gas drilling. Drilling Production Technol. 39, 43–47.
Yang, B. B., He, M. M., Zhang, Z. Q., Zhu, J., and Chen, Y. (2022). A new criterion of strain rock burst in consideration of the plastic zone of tunnel surrounding rock. Rock Mech. Rock Eng. 55, 1777–1789. doi:10.1007/s00603-021-02725-3
Yang, D. H., Ning, Z. X., Li, Y. M., Lv, Z., and Qiao, Y. (2021). In-situ stress measurement and analysis of the stress accumulation levels in coal mines in the northern Ordos Basin, China. Int. J. Coal Sci. Technol. 8, 1316–1335. doi:10.1007/s40789-021-00407-7
Zhang, H., Ju, W., Xu, K., Huang, P., Zhong, Y., Liu, X., et al. (2021). Present-day in situ stress prediction in bozi 3 deep sandstone reservoir, kuqa depression: implications for gas development. Arab. J. Geosci. 14, 1434–1444. doi:10.1007/s12517-021-07847-0
Zhang, Y., Zhong, H. R., Wu, Z. Y., Zhou, H., and Ma, Q. Y. (2020). Improvement of petrophysical workflow for shear wave velocity prediction based on machine learning methods for complex carbonate reservoirs. J. Pet. Sci. Eng. 192, 107234. doi:10.1016/j.petrol.2020.107234
Zoback, M. D., Moos, D., Mastin, L., and Anderson, R. N. (1985). Well bore breakouts and in situ stress. J. Geophys. Res. 90, 5523–5530. doi:10.1029/jb090ib07p05523
Keywords: in situ stress, borehole deformation, ANN, coal measure stratum, Qinshui Basin
Citation: Fang X, Feng H, Wang Y and Fan T (2022) Prediction method and distribution characteristics of in situ stress based on borehole deformation—A case study of coal measure stratum in Shizhuang block, Qinshui Basin. Front. Earth Sci. 10:961311. doi: 10.3389/feart.2022.961311
Received: 04 June 2022; Accepted: 18 July 2022;
Published: 17 August 2022.
Edited by:
Maxim Lebedev, Curtin University, Perth, AustraliaReviewed by:
Xiangxin Liu, North China University of Science and Technology, ChinaHemin Yuan, China University of Geosciences, China
Copyright © 2022 Fang, Feng, Wang and Fan. This is an open-access article distributed under the terms of the Creative Commons Attribution License (CC BY). The use, distribution or reproduction in other forums is permitted, provided the original author(s) and the copyright owner(s) are credited and that the original publication in this journal is cited, in accordance with accepted academic practice. No use, distribution or reproduction is permitted which does not comply with these terms.
*Correspondence: Xinxin Fang, ZngxNTgyNzU3MzEwOUAxNjMuY29t