 Jiuhe Bu
 Shuiling Zhang
 Xuesong Wang3
 Chunhui Li
 Xuan Wang
94% of researchers rate our articles as excellent or good
Learn more about the work of our research integrity team to safeguard the quality of each article we publish.
Find out more
ORIGINAL RESEARCH article
Front. Earth Sci., 12 January 2023
Sec. Hydrosphere
Volume 10 - 2022 | https://doi.org/10.3389/feart.2022.961299
This article is part of the Research TopicWater and Ecological System: Response, Management, and RestorationView all 15 articles
Economic development and large amounts of industrial production have led to environmental deterioration. The assessment and prediction of water environment capacity (WEC) are crucial supports for water quality target management. Therefore, this study aims to improve WEC via changes in the industrial structure and to analyze the economic changes. For this purpose, the economic efficiency (EE), water use efficiency (WUE), and water treatment efficiency (WTE) are estimated by the EE–SBM (slack-based measure)–DEA (data envelopment analysis) model. Based on the proposed model, the industry is divided into three types: green enterprises, yellow enterprises, and red enterprises. Yellow enterprises and red enterprises are the major supervision subjects, and the spatial distribution of different environmental risks is identified. The WECs of the main canals are analyzed based on dynamic changes in the industrial structure by integrating the 0-D and MIKE11 models. The results showed that after adjusting the industrial structure, the maximum added values of the WEC of chemical oxygen demand (COD), total nitrogen (TN), ammonia nitrogen (NH3–N), and total phosphorus (TP) are 1,744.66 t/a, 536.14 t/a, 24.81 t/a, and 4.16 t/a, respectively. The results show that the canals (R40, R41, R20, R19, and R17) are overloaded with pollutants and indicate that TN is included as a water environment quality assessment target. Furthermore, after the optimization of the industrial structure, the loss of industrial output value is 174.44 million yuan, and the added value of the environmental economy is 232.12 million yuan. The findings provide important technical support for achieving industrial upgrading and sustainable development.
Since the 21st century, rapid population growth, economic development, and urbanization have led to the deterioration of the water environment of the Taihu Lake, which is associated with a dense canal network (Zhang et al., 2018; Wang J. et al., 2019; 2021b; Ni et al., 2019). Changzhou city is located in the northwestern Taihu Lake, which is an important part of the Taihu Basin. Meanwhile, Changzhou city has been experiencing a poor-quality water environment crisis from non-point and point pollution sources (Li et al., 2018),where point source pollution presents significant challenges (Schmidt et al., 2020).
The water environmental capacity (WEC) has been widely used to control water pollution (Kim et al., 2012; Fakhraei et al., 2014; Yang et al., 2015; Wang Q. et al., 2019), and the key factors that affect the WEC are the amount of pollutant discharge and spatial emissions of pollutants (Guan et al., 2016; Huang and Tong, 2019). Previous studies have shown that point sources were the key influencing factor for the WEC in Changzhou city. Therefore, the actual WEC was improved considering the industrial pollutant problem. The issue of how to harmonize the industrial economy, water use, and environment must be resolved. To address this issue, many studies had focused on the assessment of industrial water use efficiency and water treatment efficiency (Frija et al., 2009; Carvalho et al., 2012; Asghar et al., 2018; Rahman et al., 2019). For instance, Liu et al. (2020) estimated industrial water use and wastewater efficiency to adjust industrial structures by a data envelopment analysis (DEA) model. Wang et al. (2015) presented an approach to assess water use efficiency (WUE) and pollutant reduction potential based on the DEA model. An et al. (2019) investigated the environmental efficiency in the Xiangjiang River Basin based on a slack-based measure (SBM) model. Yang et al. (2020) calculated the environmental treatment, sewage treatment, and water supply efficiency to improve the water quality with the SBM–DEA model in the eastern area of China.
Based on the aforementioned analysis, the DEA model became popular in the water environment. Additionally, the DEA and SBM models have been used to assess water use and water treatment efficiency (WTE). As a type of black box model, the DEA method had an advantage in that it ignored the mechanism relationship between input and output parameters, and its disadvantage was that the solving difficulty and calculation time of the model increased sharply with the expansion of the sample size (Wang et al., 2021c). Therefore, the SBM–DEA model was adopted to simulate multiple inputs and outputs of WUE and WTE stages to correct DEA deviations.
It should be noted that few studies had considered the economic efficiency (EE), water use, and water treatment efficiency with pollutants. As a result, EE, WUE, and WTE were considered simultaneously to optimize the industrial structure and improve the WEC in the article. Meanwhile, the construction of the EE model (output value efficiency) was based on the scale of medium-sized enterprises. The results of the efficiency of all enterprises in the study area were applied to improve the industrial structure, thereby increasing the actual WEC.
In general, the calculation models of WEC were divided into three types: 0-D, 1-D, and 2-D models (Liu et al., 2012; Yan et al., 2019a). However, the three models were used as calculation methods of WEC rather than prediction methods. Therefore, the 0-D model should be coupled with the water quality simulation model to calculate and predict the WEC based on limited observed data in the paper. The MIKE11 model was widely applied to river quality simulation (Keupers and Willems, 2017; Bu et al., 2020). In this article, MIKE11 was selected as the water quality simulation model. Meanwhile, to calculate EE, researchers usually applied the alternative engineering method of pollutants to estimate their abatement costs. Consequently, an alternative engineering method was used to analyze the impact of industrial structure optimization on the economy in the study area.
By reason of the foregoing, the objectives of this study were to evaluate the WUE, WTE, and EE of industries based on coupling the EE and SBM–DEA models to optimize the industrial structure and to analyze the impact on the water environment and economy. In addition, (1) the efficiency evaluation approach was introduced to the coupled EE and SBM–DEA models, (2) the dynamic prediction model of the WEC was established by integrating the 0-D and MIKE11 models, and (3) the economic value was analyzed based on optimization of the industrial structure in Changzhou city.
In this article, we presented the EE–SBM–DEA model for measuring the output value efficiency (OVE), WUE, and WTE of regional industrial systems. Then, the industry was divided into three types: red industry, yellow industry, and green industry. Management measures were implemented based on different types of industries. Furthermore, we integrated the MIKE11 and 0-D models to create a dynamic assessment and prediction model for the WEC. The calculation results of the EE–SBM–DEA model were input into the MIKE11 and 0-D models. Finally, the WEC of the canal caused by the change in the industrial type was evaluated and simulated in Changzhou city. Meanwhile, the economic benefits after the optimization of the industrial structure were evaluated. The flow is depicted in Figure 1.
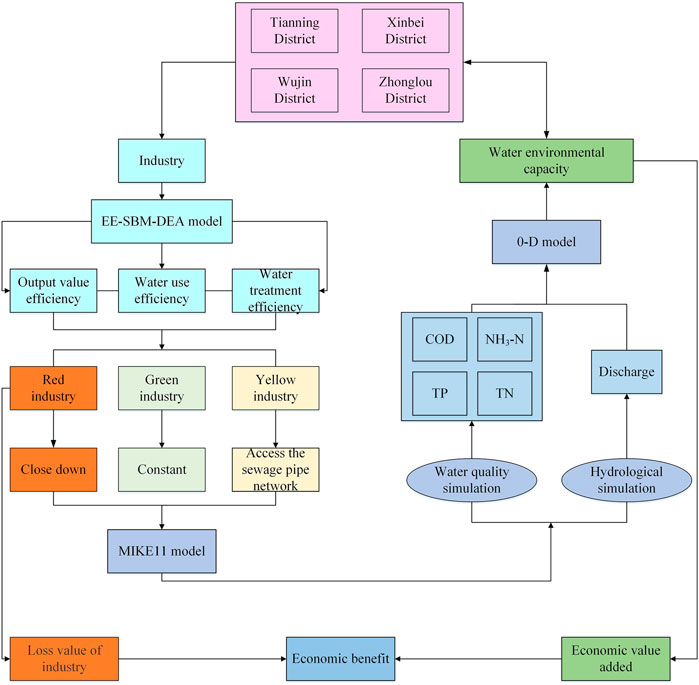
FIGURE 1. Flow chart of water environmental capacity optimization and economic benefit. The EE–SBM–DEA model is used to classify firms into three types, after different industrial types are treated with different methods, the water environmental capacity of the canal are calculated by the MIKE11 and 0-D model, then the economic benefits are obtained by water environmental capacity and industrial types.
This study area is Changzhou city (31.15°–32.07°N and 119.13°–120.20°E), which is located in the southern Jiangsu Province of China (Figure 2). The city is situated in the Yangtze Delta region, with a total area of 4,375 km2, and it contains Liyang and Jintan counties and urban districts, including the Wujin, Xinbei, Tianning, and Zhonglou urban districts. This study takes the urban area as the research area (Figure 2). Changzhou city belongs to the northern subtropical monsoon area and has a mild climate and an average annual temperature of 17.4°C. The annual precipitation in wet years reaches 1,243.8 mm. The rainy season is from May to September. The precipitation in the flood season reaches 870.3 mm. The spatial distribution of precipitation does not present considerable variations. The terrain is slightly higher in the southwest and lower in the northeast. The topography is a plain with many rivers, most of which are plain river network areas, and these rivers are canals in cities and are heavily influenced by humans.
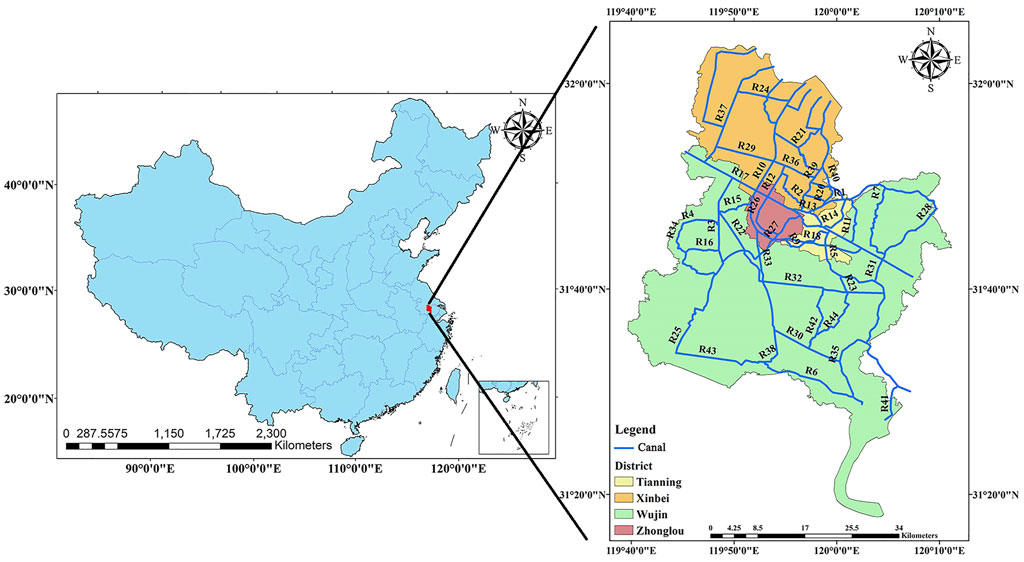
FIGURE 2. Location of geographic space of canals in Changzhou city.
The EE, SBM, and DEA methods were used to construct an industrial classification model that identifies industries with a greater impact on the economy and the environment through the analysis of OVE, WUE, and WTE.
The DEA model was applied to evaluate the relative effectiveness of different departments (Bian et al., 2014; Wang M. et al., 2021). The traditional DEA model did not consider the intermediate process from input to output, while the network DEA model examined the impact of input to output on efficiency (Gidion et al., 2019). Therefore, the network DEA model was used to measure the efficiency of each link in the industry. The utilization rate of water resources in the industrial production stage was the basis for measuring pollutant emissions. Therefore, the evaluation of industrial WUE was a prerequisite for analyzing the impact of the industry on the water environment (Hu et al., 2018). In summary, the impact of industrial water and sewage treatment on the water environment of the canal network was taken into consideration, and the efficiency calculation of the network DEA model was divided into two stages (Figure 3). The first stage was the industrial water use, and the second stage was the sewage treatment. Among them, the amount of industrial wastewater discharge was the connecting variable of the two stages because it was the output of the first stage and the input of the second stage (Table 1).
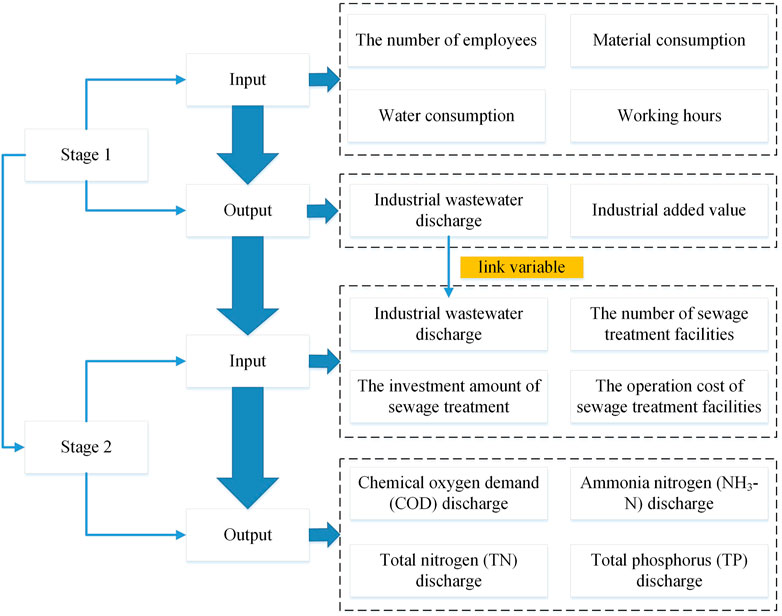
FIGURE 3. Diagram of the SBM–DEA model process.
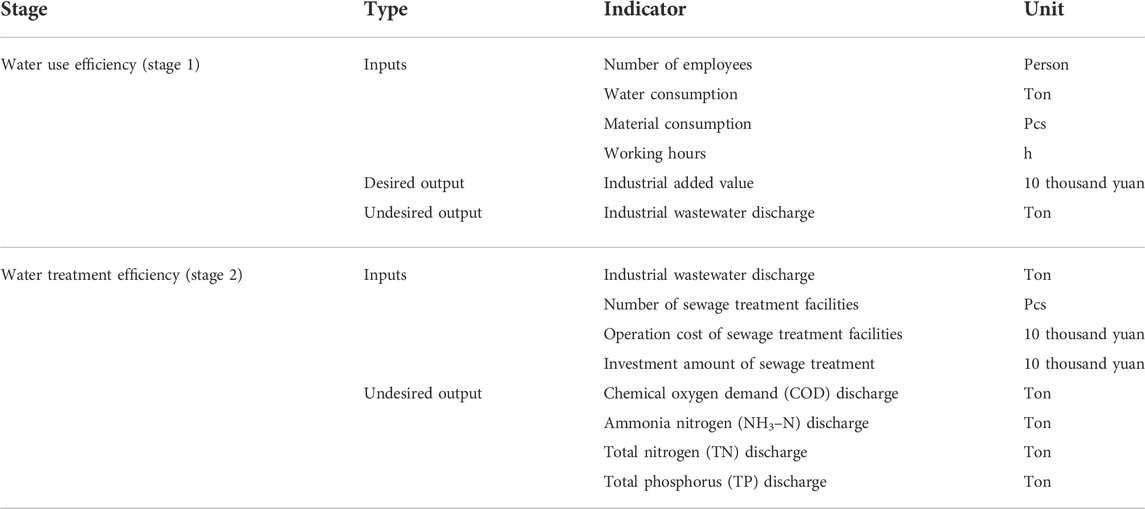
TABLE 1. Input and output indicators of the SBM–DEA model.
In addition, the conventional network DEA model had radial and slack problems, and the radial network DEA model would overestimate the efficiency of each stage with redundant inputs or insufficient output. Therefore, to overcome the shortcomings of the traditional DEA model, the slack variable SBM was introduced (Tone and Tsutsui, 2014).
It should be noted that for enterprises, some indicators were expected to be improved, and some indicators were needed to be reduced. For these reduced indicators, Koopmans (1951) first proposed the concept of undesired output. In data envelopment analysis, pollutants (wastewater) were usually called undesired outputs, while the outputs that can bring competitive advantages to enterprises were called desired outputs (industrial output value, profit, etc.). In addition, there were three kinds of methods to deal with undesired output problems, which were data conversion function, curve measure evaluation method, and distance function method (Chung et al., 1997; Chen et al., 2021). In this article, the directional distance function method was adopted in the SBM–DEA model, and both radial and relaxation problems were solved. The DEA model was selected using MaxDEA8.0 software, and then input, desired output, and undesired output parameters were set using MaxDEA8.0 software.
In the SBM–DEA model, the water resource utilization efficiency of n decision-making units DMUj (j=1...,n) and k nodes (k=1...,k) was considered. If mk and rk are the number of input and output variables at node k, respectively, then the relationship between node k and the node h is (k, h) and the number of connection variables is L. If the input variable, output variable, and connection variable are
where
The SBM model is introduced, and DMUo (o=1... n) can be written as follows:
where
At the same time, a free link was chosen as the constraint condition of the connection variable, and it was believed that link activities were freely determined while maintaining the continuity between input and output.
where
Based on the calculation of the EE–SBM–DEA model, enterprises were divided into three types (as shown in Table 2). Among them, HHH and LHH were green enterprises and did not need to be improved; HLH, HHL, LLH, LHL, and HLL were yellow enterprises and needed to be rectified; and LLL was a red enterprise and it was recommended to shut down.
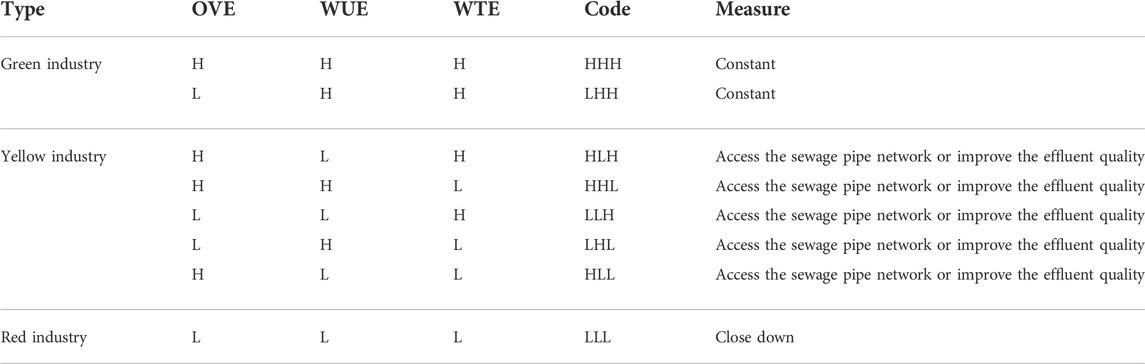
TABLE 2. Industrial type and regulatory measures.
Note: When the evaluation efficiency is 1, then the index is H; when the evaluation efficiency is less than 1, then the index is L.
By classifying industries and implementing corresponding measures for different types of enterprises (Table 2), the impact of industrial adjustment on the WEC of the canal network in the study area could be analyzed. The MIKE11 and EE–SBM–DEA models were used to simulate changes in canal water quality and hydrodynamics before and after industrial adjustment, and the impact of enterprise classification on the water environment capacity of the canal network was evaluated. The MIKE11 model can be used to obtain the future variation values of flow and pollutant concentration in different sections of the canal. The 0-D model was one of the important methods to calculate WEC. In this paper, the MIKE11 model was used to obtain the flow and pollutant concentration of the main section of the canal in the study area. Then, the flow and pollutant concentration were used as input parameters of the 0-D model to obtain the WEC of the canal. The specific description of MIKE11 and 0-D models was as follows:
The MIKE11 model was used to simulate changes in hydrology and water environmental capacity. Therefore, in this study, it was selected to simulate the environmental quality of canals. Meanwhile, the MIKE11 model included HD (Eq. 8) and AD modules (Eq. 9). The equation is as follows:
where
A total of 44 canals (Supplementary Appendix SA) were constructed in the MIKE11 model of the urban districts of Changzhou city (Figure 2).
The attenuation coefficient reflected the effect of hydrological changes on pollutants. A reasonable attenuation coefficient was vital to guarantee the accuracy of the model. COD, NH3–N, TP, and TN were selected as the simulated pollutants in this study, and the attenuation coefficients, K, were 0.18, 0.16, 0.02, and 0.16/d without floodgate scenarios, respectively.
The 0-D model was selected as the WEC calculation model. The dilution capacity Ed and self-purification capacity Es were included in two parts.
The dilution capacity formula is as follows:
where Ed is the dilution capacity, kg/d; S is the water quality standard, mg/L; Cb is the canal background concentration, mg/L; and Qr is the canal discharge, m3/s.
The self-purification capacity formula is as follows:
where Es is the self-purification capacity, kg/d; S is the water quality standard, mg/L; Qt is the sum of river and wastewater flows, m3/s; L is the length of the river, m; k is the comprehensive attenuation coefficient, 1/d; and v is the river velocity, m/s.
The water environment comprehensive capacity formula is as follows:
An alternative engineering method was used to calculate economic value, and the calculation formula is as follows:
where
Furthermore, the unit treatment costs of different pollutant types were obtained from sewage treatment plant in Changzhou city (Table 3).

TABLE 3. Unit treatment cost of different pollutants in Changzhou city.
Industrial data were collected from the Changzhou Statistical Yearbook and Changzhou Research Academy of Environmental Sciences (2016). Historical discharge and canal level data were acquired through the Changzhou Hydrological Bureau. Water quality data were obtained from the water quality monitoring stations (2016).
To ensure the unity of industrial wastewater and canal flow units in the MIKE11 model, the unit of industrial wastewater discharge was switched from m3/d to m3/s. The calculation time duration was set as 366 days (2016) to reduce the model error, the calibration time was from May to July, and the remaining time was the verification time in 2016.
In this study, the relative error (RE) was used to evaluate the accuracy of the model (Eq. 14). According to the simulation results of the MIKE11 model, the RE was obtained. The results of the RE indicated that the model was reliable (Feng et al., 2016).
where yo is the observed value, and ys the is simulated value.
The hydrological simulation sites were Buyiqiao, Caoqiao, Jiuli, Henglin, and Wujingang stations. The average discharge and error of each site in 2016 are shown in Figure 4. In the hydrologic simulation, the relative error was smaller than 0.16.
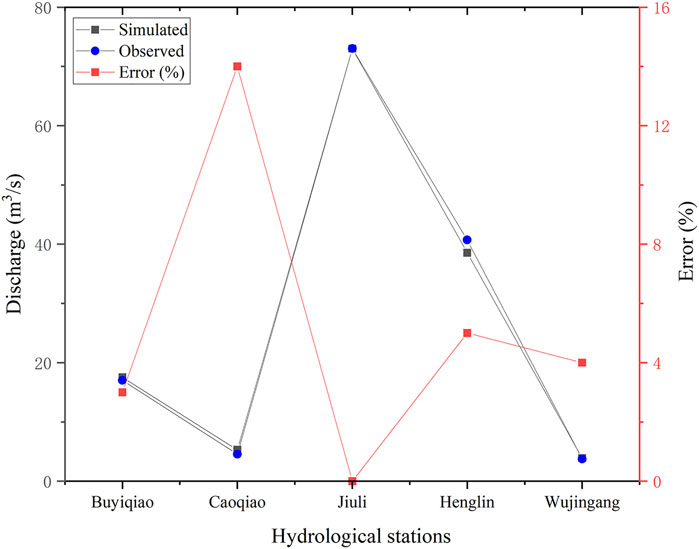
FIGURE 4. Canal discharge simulation and error analysis.
The water quality concentrations of major canals were simulated (COD, NH3–N, TN, and TP). The average value and error of the canal water quality concentration in 2016 are shown in Figure 5. In the COD, NH3–N, TN, and TP simulations, the maximum average relative errors were 0.08, 0.06, 0.11, and 0.03, respectively.
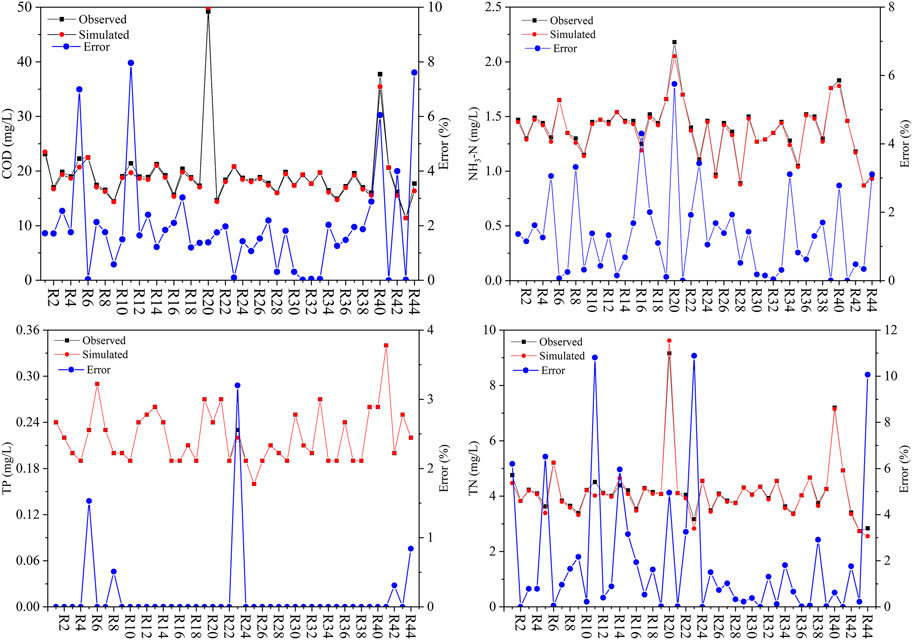
FIGURE 5. Water quality concentration simulation and error analysis of canal.
The aforementioned analysis showed the relative error between the observed and simulated values of hydrology and pollutant concentrations (COD, NH3–N, TN, and TP), and the results indicated that the model was acceptable for further modeling work.
This study takes the urban area of Changzhou as the research object. The area is divided into four administrative districts, namely, Tianning, Wujin, Xinbei, and Zhonglou districts. Then, the EE–SBM–DEA model was used to classify the industries in each district to obtain the type of each enterprise. Based on the SBM–DEA model, the relevant efficiency statistics results were obtained (Supplementary Appendix SA). In this study, preliminary data had been analyzed and outliers had been removed. Furthermore, the input and output variables were analyzed by Pearson correlation. As shown in Supplementary Table SA3 (Supplementary Appendix SA), EM (the number of employees) and MC (material consumption) in the input indicators were poorly correlated with other input and output indicators, and the output index was strongly correlated with other indexes. Overall, input and output indicators can be used in DEA models, and the sample size included a total of 627 enterprises in the four districts (Tianning, Xinbei, Zhonglou, and Wujin districts); moreover, each enterprise represented a DMU, and the input and output indicators are shown in Table 1. At the same time, the enterprises were divided into six major departments, namely, paint manufacturing, other manufacturing, chemicals, textiles, metal processing, and other industries. Therefore, the DMUs were consistent with the department of the enterprise.
Figure 6A shows that the economic scale of most of the enterprises in Tianning District exceeded 20 million RMB, which was medium-sized and accounts for 60.69%. The average output value efficiency was 0.76, indicating that the enterprises below the medium scale had the potential to reach the medium scale.
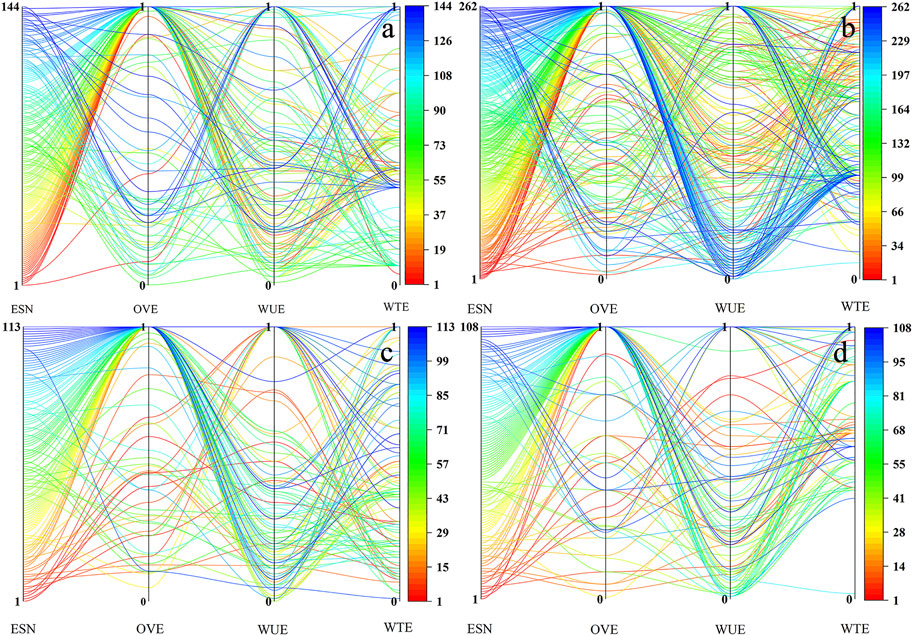
FIGURE 6. Analysis of the industrial output value efficiency, water use efficiency, and water treatment efficiency in Tianning (A), Wujin (B), Xinbei (C), and Zhonglou districts (D). It is important to note that each line represents an enterprise. ESN = enterprise serial number, OVE = output value efficiency, WUE = water use efficiency, and WTE = water treatment efficiency. The enterprise codes are shown in Supplementary Appendix SA. The ordinate of ESN is the serial numbers of all enterprises, and detailed information about the enterprise serial numbers is displayed in the Supplementary Appendix SA. The ordinate of OVE, WUE, and WTE are the display of the efficiency statistical results calculated by the EE–SBM–DEA model.
The WUE results of various enterprises in Tianning District showed that most enterprises had low WUE, resulting in more wastewater. The average water efficiency (0.51) also proved that the water efficiency of enterprises was low. Among the 144 enterprises, only 25.82% met the water efficiency. Among them, enterprise serial numbers 11, 33, 37, 39, 42, 59, 61, 70, 105, 106, 109, and 118 had the lowest water efficiency and should be considered. The WTE of various enterprises in Tianning District showed that the high concentration of pollutants in wastewater had increased the pressure on the water environment. The WTE was only 0.44, and the proportion of enterprises meeting the water treatment efficiency was only 7.64%. The companies with the lowest water treatment efficiency accounted for 18.05%, and the enterprise serial numbers were 2, 54, 65, 70, 72, 73, 74, 75, 76, 77, 78, 79, 80, 81, 82, 83, 84, 86, 88, 90, 94, 96, 98, 101, 103, and 104. The environmental protection department should focus on inspection of the sewage treatment of these enterprises. Meanwhile, the low WTE indicated that Tianning District had great potential for environmental improvement.
The aforementioned results showed that most enterprises in Tianning District had adopted an extensive economic development mode with environmental destruction. In the future, industrial development should be pursued with equal emphasis on the economy and environment. Figure 7A shows that the proportion of green enterprises was 18.06%, the proportion of red enterprises was 15.97%, and the proportion of yellow enterprises was 65.97%, which also verified that Tianning District had a high water environment improvement potential.
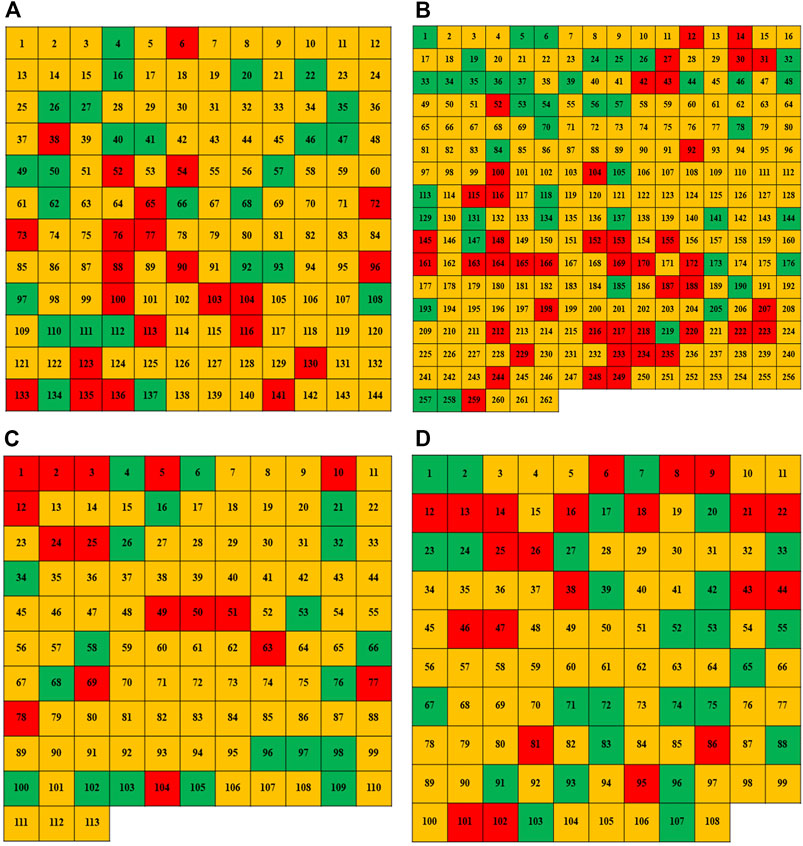
FIGURE 7. Results of enterprise classification in Tianning (A), Wujin (B), Xinbei (C), and Zhonglou districts (D). Colors in the squares represent the type of enterprise calculated by the EE–SBM–DEA model, the numbers in the squares are the serial numbers of all enterprises (Supplementary Appendix SA for the meaning of numerical serial number). Additionally, green indicates green enterprises, yellow indicates yellow enterprises, and red indicates red enterprises.
Figure 6B shows that the proportion of medium-sized and above-scale output value enterprises in Wujin District was 59.54% and the average OVE was 0.78, indicating that Wujin District enterprises have better economic benefits. The average WUE of all enterprises in Wujin District was 0.54, indicating that enterprises have low water efficiency. Among them, 22.13% of enterprises met the WUE and 18.32% of enterprises had extremely low water use efficiency, indicating that enterprises in Wujin District waste more water resources, and the government should focus on enterprises with extremely low WUE. The average WTE of the enterprises was 0.58, but only 6.11% of the enterprises met the WTE, whereas 0.76% of the enterprises were extremely low WTE, indicating that the WTE of enterprises in Wujin District was concentrated in the medium level. The shape of the WUE in Figure 6B was more divergent than that of the WTE, which also proved that Wujin District had better control of the pollutant concentration in the wastewater discharge of enterprises. Figure 7B shows that green companies accounted for 16.41%, red companies accounted for 17.18%, and yellow companies accounted for 66.41%. In the process of industrial regulation, the government should focus on red enterprises and improve the efficiency of yellow enterprises to ease the pressure on the water environment in Wujin District.
Figure 6C shows that the proportion of output value enterprises above the medium scale was 61.06%, and the average OVE was 0.78, indicating that the economic effects of enterprises in Xinbei District were better. The average water use efficiency of all enterprises was 0.42, of which the proportion of enterprises meeting the water efficiency was 20.35%. The proportion of enterprises with extremely low water efficiency was 16.81, indicating that the water efficiency level of enterprises in Xinbei District was low. The enterprise serial numbers were 18, 20, 23, 29, 33, 39, 42, 43, 44, 45, 47, 81, 90, 91, 93, 94, 99, 104, and 107. The WUE of most enterprises was below the average value (0.42), which also proved that the enterprises in Xinbei District waste serious water resources and should increase the water-saving investments. The average WTE of all enterprises in Xinbei District was 0.47, and the proportion of enterprises meeting the WTE was only 8.85%. Companies with extremely low WTE accounted for 8.85%. The specific enterprise serial numbers were 1, 7, 12, 15, 28, 56, 59, 71, 83, and 104, indicating that most companies in Xinbei District had medium WTE. The WTE showed that the water treatment efficiency of enterprises was concentrated between 0 and 1, but relatively scattered, indicating that the WTE of enterprises was quite varied. Figure 7C shows that green companies accounted for 17.70%, red companies accounted for 14.16%, and yellow companies accounted for 68.14%. These findings show that industrial adjustments will help ease the pressure on the water environment of Xinbei District.
Figure 6D shows that the proportion of enterprises with medium-sized and above-scale output value in Zhonglou District was 62.04%, and the average OVE was 0.78, indicating that enterprises in Zhonglou District had better economic benefits. The average water use efficiency of enterprises in Zhonglou District was 0.39, the proportion of enterprises meeting WUE was 18.52%, and the proportion of enterprises with extremely low water use efficiency was 26.85%, indicating that enterprises in Zhonglou District had extremely low water efficiency. In Figure 6D, the WUE of most companies was below the average, indicating that companies waste water more seriously. The average WTE in Zhonglou District was 0.71, and the proportion of enterprises meeting the WTE was 9.26%. Companies with extremely low water treatment efficiency accounted for 0.93%, and the specific company serial number was 82. These findings showed that the WTE of enterprises in Zhonglou District was higher, which effectively reduces the concentration of pollutants in discharged wastewater. Figure 6D verifies that the WTE of most companies was above average. The enterprise classification results of Figure 7D show that green companies account for 25%, red companies account for 20.37%, and yellow companies account for 54.63%. The aforementioned results showed that the lower WUE of enterprises in Zhonglou District was the main factor for more pollutant emissions. Therefore, the government should guide enterprises to enhance the efficiency of water circulation, pay attention to the pollution discharge of red enterprises, and ease the pressure on the water environment in Zhonglou District.
In summary, this article analyzed the OVE, WUE, and WTE of the four districts of Tianning, Wujin, Xinbei, and Zhonglou in Changzhou city, and enterprises in each district were divided into three types. The results showed that the OVE of these four study areas was high and the proportion of medium-sized enterprises was more than 60%. The WUE of enterprises in Zhonglou District was significantly lower than that of the other three research areas, although the WTE in Zhonglou District was higher, indicating that enterprises in Zhonglou District paid more attention to sewage treatment. The WUE and WTE of Tianning District and Xinbei District were relatively divergent, indicating that the administrative department may not impose strict restrictions on the enterprise’s water use and pollutant concentration. The classification of enterprises showed that industrial regulation had great potential for improving the WEC of canal networks.
This paper classified the enterprises in the study area based on the EE–SBM–DEA model. Then, MIKE11 and the 0-D models were used to calculate the WEC of the canal (COD, NH3–N, TP, and TN). Figure 8A shows that the COD of canals R40 and R20 exceeded the carrying capacity before the regulation, while R40 could have a COD load of 397.25 t/y after regulation, which indicated that industrial regulation increased the COD capacity of R40 by 1,110.04 t/y. The COD capacity of canal R17 was the largest at 14,839.97 t/y before regulation and 15,444.49 t/y after regulation. Industrial regulation presented the largest increase in the COD capacity of R39 reaching 1,744.66 t/y. However, the COD capacity of R16 only increased slightly by 4.26 t/y.
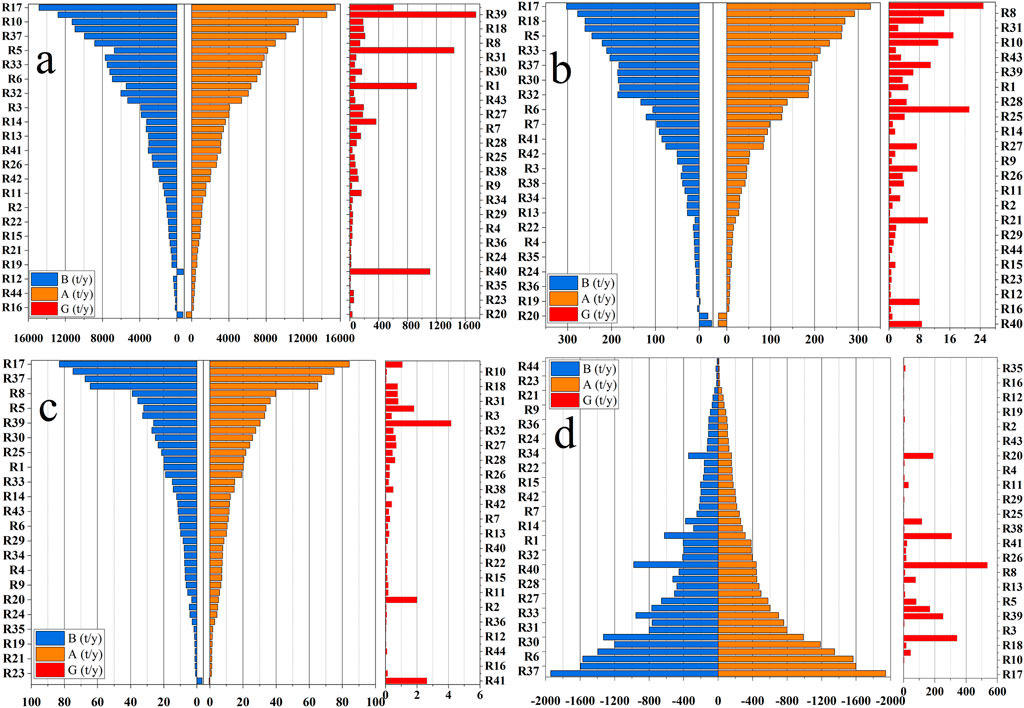
FIGURE 8. Water environmental capacity of COD (A), NH3–N (B), TP (C), and TN (D) in the canal network of the study area. B = WEC before industry adjustment, A = WEC after industry adjustment, and G = WEC growth value. The ordinate of this figure is the canal in the study area, and the horizontal axis represents the total amount of pollutants the canal can carry.
Figure 8B shows that the NH3–N of R40, R20, and R19 exceeded the carrying capacity before regulation, while only R19 met the NH3–N load of 6 t/y after industrial regulation. Therefore, the focus should be on R40 and R20. Among the canal network water systems, the capacity of NH3–N in R17 was the largest, with 302.74 t/y before regulation and an increase of 24.81 t/y after regulation. Industrial regulation had led to the smallest improvement in the NH3–N capacity of R13, which was only 0.27 t/y.
Figure 8C shows that only canal R41 exceeded the TP-carrying capacity, and the TP load of this canal still exceeded 0.49 t/y after regulation. R17 had the largest TP-carrying load at 80.07 t/y before industrial regulation and 84.14 t/y after regulation. The canal with the largest increase in TP environmental capacity after industrial regulation was R39, with an added value of 4.16 t/y.
Figure 8D shows that the TN load of the canal network in the study area was overloaded. Meanwhile, the overload capacity of R17 had reached 1,942.21 t/y, and it was increased by 0.9 t/y after industrial regulation. Thus, the TN emissions in the canal network must be addressed. After industrial regulation, the maximum increased in TN-carrying capacity of R40 was 536.14 t/y, with a growth rate of 54.73%; and the canal with the smallest increase was R17 at only 0.15 t/y.
In summary, the water environment capacity of the canal network had been improved through the classification and regulation of industries in the study area. Among them, the improvement effect of COD and TN was more evident. However, the improvement effect of NH3–N and TP was not notable, which showed that the concentrations of COD and TN in the wastewater of the enterprise were relatively high. In addition, the carrying capacity of COD, NH3–N, and TP of canal R17 was the largest. The main reason may be that R17 was the canal with the largest flow and length in the study area, which increased the water environment capacity of the canal. The carrying capacity of the water environment of canal R40 was weak, and the carrying capacity had increased greatly after industrial regulation. The main reason may be that there were more yellow and red companies around the canal, which caused greater pollution, and the improvement effect after regulation was more evident. The TN overload in the study area was more serious, the main reason may be that the TN in the study area was not set as a goal by the bureaucracy, which led to a high TN concentration in the canal network. Therefore, industrial regulation can effectively increase the water environmental capacity of canals. In addition, to improve the TN-carrying load of the canal network, TN should be included in performance assessments by the government.
Figure 9 shows the added economic value of different canals in the study area after the optimization of the industrial structure. According to the formula of economic value, the added economic value was positively correlated with the added value of water environmental capacity. Therefore, the growth of water environmental capacity of COD/NH3–N/TP/TN was consistent with the growth of economic value of canals. Table 4 shows that the improvement in water environment quality increased the economic value of 232.12 million yuan. Due to the optimization of the industrial structure, red enterprises were shut down. Therefore, a certain economic loss was caused. After calculation, the economic loss value was 174.44 million yuan. Although the optimization of the industrial structure caused a certain economic loss, the improvement in environmental quality brought by it not only made up for the economic loss, but also created a certain surplus, reaching 57.68 million yuan.
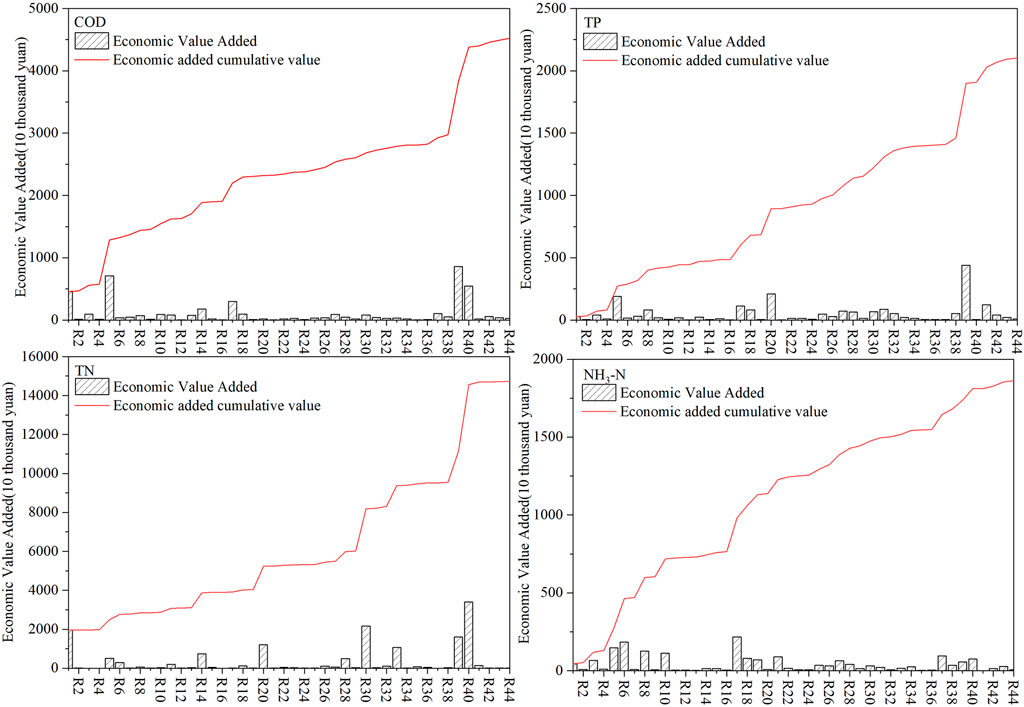
FIGURE 9. Economic value added of different canals in the study area.

TABLE 4. Economic value of optimization of the industrial structure.
The spatial distribution of industrials showed that Tianning and Zhonglou districts had higher industrial density (Figure 10), and canals in areas with higher industrial density were more likely to be polluted (Dsikowitzky et al., 2017; Rodgers et al., 2020). Meanwhile, among the all industrial types, yellow and red industries were the center of attention. We also found that canals with large fluctuations in WEC were consistent with the industrial spatial distribution (yellow and red industries) (Figures 10, 11), and the pollutant discharge types of enterprises could be identified through the analysis of canal pollution. For example, enterprises around R39 had contributed more to the concentration of COD and TP, followed by TN. The enterprises surrounding R5 had a greater contribution to the concentration of COD, NH3–N, and TP. The type of enterprise that had the greatest impact on R6 was the yellow enterprise, and the NH3–N emissions of the enterprise were higher. The enterprise around R33 had relatively high TN emissions, while COD, TP, and NH3–N emissions were relatively low. Therefore, the EE–SBM–DEA model could be used to identify areas at risk of pollution. These areas could be monitored, and the water environmental capacity of each canal was analyzed to identify the major pollution types of different enterprises. Pollution monitoring could be carried out in the process of monitoring the pollution of enterprises, saving a lot of manpower and financial costs. In short, the model identified different risk levels of enterprises and regions, which was beneficial to improve management efficiency.
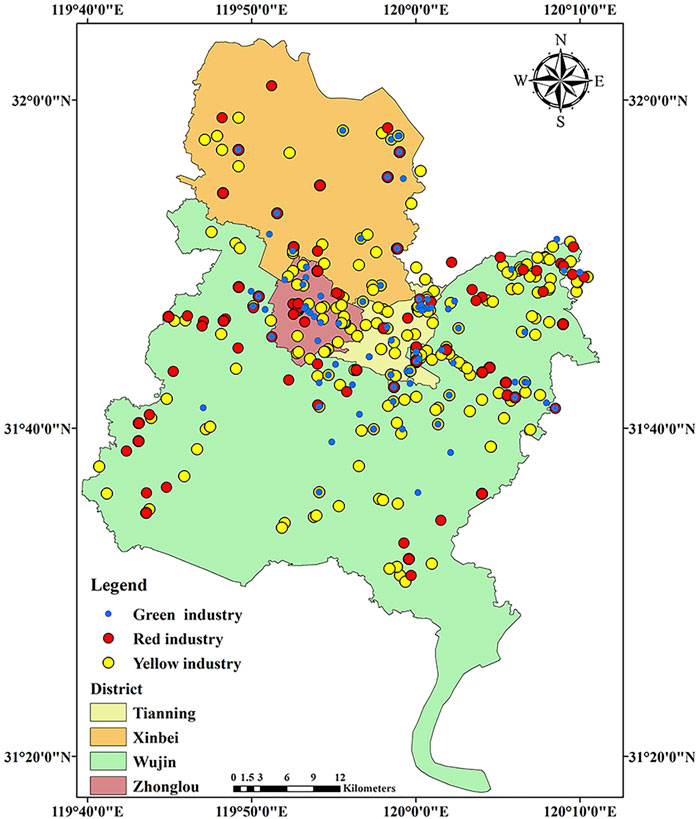
FIGURE 10. Spatial distribution of different industrial types.
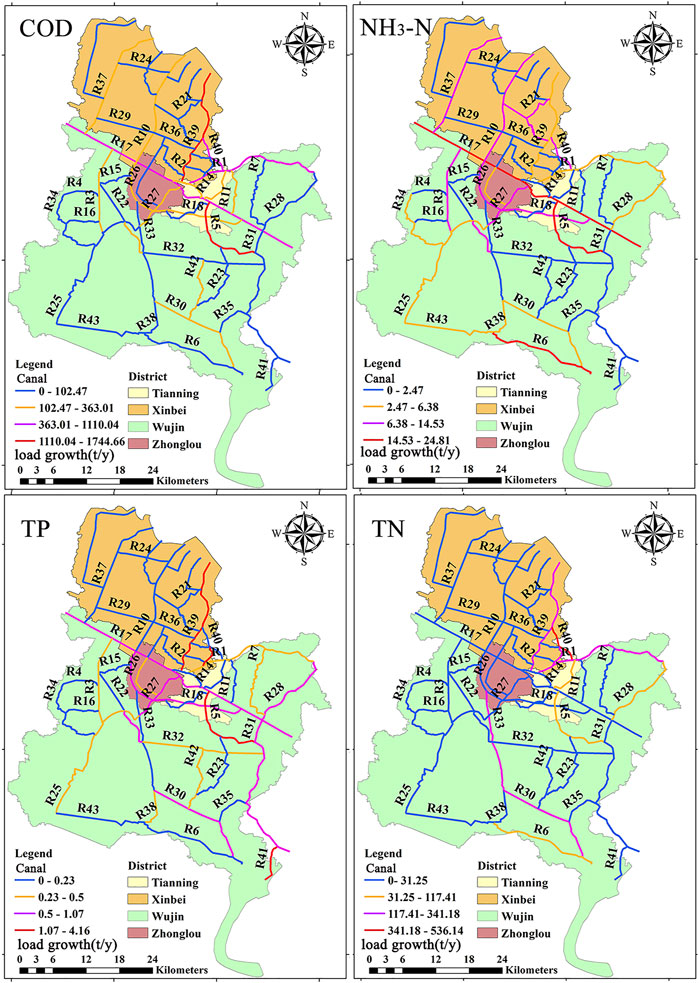
FIGURE 11. Water environmental capacity fluctuation of different canals.
In addition, Wang et al. (2018) found that the water quality policies forced many small, heavily polluting firms to shut down, but it was non-effective in reducing the COD concentration. We also found the same problem: although the density of red enterprises around R4 was relatively high, it did not contribute much to improve canal pollution when they were closed. It may be that the contribution of point sources to the canal network was far less than that of non-point sources or internal sources. Correlational research studies showed that non-point and endogenous pollution sources had contributed more to canal network pollution in the Taihu Lake (Wang M. et al., 2019; Yan et al., 2019b; Luo et al., 2019; Xu et al., 2020). Therefore, non-point source and endogenous pollution management measures were considered to improve the canal water environment. For instance, the sediment dredging was conducted for decreasing the pollution load (Chen et al., 2020). Constructed wetland technology and low-impact development technology were also widely applied for the malodorous canal (Pereira Souza et al., 2019; Bu et al., 2020; Lu et al., 2020; Tuttolomondo et al., 2020). Moreover, the identified high-risk areas were also key areas where non-point source and internal source control measures were considered.
The development of enterprises had brought greater pressure to the urban water environment, and enterprises were classified as green enterprises, yellow enterprises, and red enterprises by constructing the EE–SBM–DEA model in this study. Furthermore, the temporal and spatial dynamic simulation model of the WEC was constructed, changes in the WEC of canals were analyzed based on enterprise regulation, and the economic valuation model was used to evaluate the economic benefits of water environment improvement. The related conclusion was drawn as follows:
(1) The calculation results of enterprise efficiency were used to classify the enterprises in the study area and took corresponding control measures. The results of the enterprise efficiency calculation in Tianning, Wujin, Xinbei, and Zhonglou districts showed that red companies accounted for 65.97%, 66.41%, 68.14%, and 54.63%, respectively.
(2) The results showed that the loads of COD and TN increased by industrial regulation and reached their highest values of 1744.66 t/y and 536.14 t/y, respectively. However, the improvement in NH3–N and TP loads was not evident, and the highest values reached 24.81 t/y and 4.16 t/y, respectively. In addition, canals R40, R41, R20, R19, and R17 were partially overloaded with pollutants and should be considered.
(3) The result of research showed that industrial structure optimization could effectively improve water environment quality and generate economic value. After the optimization of the industrial structure, the economic loss value was 174.44 million yuan. However, environmental improvements had brought economic benefits up to 57.68 million yuan.
In conclusion, this research provided technical support for industrial management policies and water environment improvement. It was recommended that TN should be included as a water environment quality assessment target to improve the concentration of TN in the canal network. Changzhou city must make full use of the advantages of technology, manpower, and capital to accelerate the optimization and upgrading of the industrial structure. Among them, technological progress and innovation will be an important support to reduce the emission of pollutants for economic development.
The original contributions presented in the study are included in the article/Supplementary Material; further inquiries can be directed to the corresponding author.
JB and CL: Conceived and designed the research; Xue W and XX: Software and validation; Xua W, QL, and XiW: Supervision; JB and SZ: Analyzed the data and writing—original draft preparation, reviewing and editing. All authors have read and agreed to the published version of the manuscript.
This research was funded by the National Natural Science Foundation of China (52070023), the Foundation of Basic Science (Natural Science) research in Jiangsu Province (22KJB570008), and the Wuxi University Research Start-up Fund for Introduced Talents (550222020, 550221041).
The authors would like to extend special thanks to the editor and the reviewers for their valuable comments in greatly improving the quality of this research.
The authors declare that the research was conducted in the absence of any commercial or financial relationships that could be construed as a potential conflict of interest.
All claims expressed in this article are solely those of the authors and do not necessarily represent those of their affiliated organizations, or those of the publisher, the editors, and the reviewers. Any product that may be evaluated in this article, or claim that may be made by its manufacturer, is not guaranteed or endorsed by the publisher.
The Supplementary Material for this article can be found online at: https://www.frontiersin.org/articles/10.3389/feart.2022.961299/full#supplementary-material
An, Q., Wu, Q., Li, J., Xiong, B., and Chen, X. (2019). Environmental efficiency evaluation for Xiangjiang River basin cities based on an improved SBM model and Global Malmquist index. Energy Econ. 81, 95–103. doi:10.1016/j.eneco.2019.03.022
Asghar, S., Sasaki, N., Jourdain, D., and Tsusaka, T. (2018). Levels of technical, allocative, and groundwater use efficiency and the factors affecting the allocative efficiency of wheat farmers in Pakistan. Sustainability 10, 1619. doi:10.3390/su10051619
Bian, Y., Yan, S., and Xu, H. (2014). Efficiency evaluation for regional urban water use and wastewater decontamination systems in China: A DEA approach. Resour. Conservation Recycl. 83, 15–23. doi:10.1016/j.resconrec.2013.11.010
Bu, J., Peng, C., Li, C., Wang, X., Zhang, Y., Yang, Z., et al. (2020). A method for determining reasonable water area ratio based on flood risk and cost-effectiveness in Rainy City. Environ. Earth Sci. 79, 450. doi:10.1007/s12665-020-09201-1
Carvalho, P., Marques, R. C., and Berg, S. (2012). A meta-regression analysis of benchmarking studies on water utilities market structure. Util. Policy 21, 40–49. doi:10.1016/j.jup.2011.12.005
Chen, C., Kong, M., Wang, Y.-Y., Shen, Q.-S., Zhong, J.-C., and Fan, C.-X. (2020). Dredging method effects on sediment resuspension and nutrient release across the sediment-water interface in Lake Taihu, China. Environ. Sci. Pollut. Res. 27, 25861–25869. doi:10.1007/s11356-019-06192-w
Chen, C., Liu, H., Tang, L., and Ren, J. (2021). A range adjusted measure of super-efficiency in integer-valued data envelopment analysis with undesirable outputs. J. Syst. Sci. Inf. 9, 378–398. doi:10.21078/jssi-2021-378-21
Chung, Y. H., Färe, R., and Grosskopf, S. (1997). Productivity and undesirable outputs: A directional distance function approach. J. Environ. Manag. 51, 229–240. doi:10.1006/jema.1997.0146
Dsikowitzky, L., Hagemann, L., DwiyitnoAriyani, F., Irianto, H. E., and Schwarzbauer, J. (2017). Complex organic pollutant mixtures originating from industrial and municipal emissions in surface waters of the megacity jakarta—An example of a water pollution problem in emerging economies. Environ. Sci. Pollut. Res. 24, 27539–27552. doi:10.1007/s11356-017-0164-2
Fakhraei, H., Driscoll, C. T., Selvendiran, P., DePinto, J. V., Bloomfield, J., Quinn, S., et al. (2014). Development of a total maximum daily load (TMDL) for acid-impaired lakes in the Adirondack region of New York. Atmos. Environ. 95, 277–287. doi:10.1016/j.atmosenv.2014.06.039
Feng, L., Sun, X., and Zhu, X. (2016). Impact of floodgates operation on water environment using one-dimensional modelling system in river network of Wuxi city, China. Ecol. Eng. 91, 173–182. doi:10.1016/j.ecoleng.2016.02.042
Frija, A., Chebil, A., Speelman, S., Buysse, J., and Van Huylenbroeck, G. (2009). Water use and technical efficiencies in horticultural greenhouses in Tunisia. Agric. Water Manag. 96, 1509–1516. doi:10.1016/j.agwat.2009.05.006
Gidion, D. K., Hong, J., Adams, M. Z. A., and Khoveyni, M. (2019). Network DEA models for assessing urban water utility efficiency. Util. Policy 57, 48–58. doi:10.1016/j.jup.2019.02.001
Guan, X., Liu, W., and Chen, M. (2016). Study on the ecological compensation standard for river basin water environment based on total pollutants control. Ecol. Indic. 69, 446–452. doi:10.1016/j.ecolind.2016.05.011
Hu, Z., Yan, S., Yao, L., and Moudi, M. (2018). Efficiency evaluation with feedback for regional water use and wastewater treatment. J. Hydrology 562, 703–711. doi:10.1016/j.jhydrol.2018.05.032
Huang, Z., Tong, , and Tong, T. (2019). Water environmental capacity calculation and allocation of the Taihu lake basin in Jiangsu Province based on control unit. Int. J. Environ. Res. Public Health 16, 3774. doi:10.3390/ijerph16193774
Keupers, I., and Willems, P. (2017). Development and testing of a fast conceptual river water quality model. Water Res. 113, 62–71. doi:10.1016/j.watres.2017.01.054
Kim, J., Engel, B. A., Park, Y. S., Theller, L., Chaubey, I., Kong, D. S., et al. (2012). Development of Web-based Load Duration Curve system for analysis of total maximum daily load and water quality characteristics in a waterbody. J. Environ. Manag. 97, 46–55. doi:10.1016/j.jenvman.2011.11.012
Koopmans, A. (1951). Cytogenetic studies on Solanum tuberosum L. And some of its relatives: Avec un résumé en français. Genetica 25, 193–337. doi:10.1007/bf01784832
Li, Z., Dong, M., Wong, T., Wang, J., Kumar, A., and Singh, R. (2018). Objectives and indexes for implementation of sponge cities—a case study of Changzhou city, China. Water 10, 623. doi:10.3390/w10050623
Liu, K., Yang, G., and Yang, D. (2020). Investigating industrial water-use efficiency in mainland China: An improved SBM-DEA model. J. Environ. Manag. 270, 110859. doi:10.1016/j.jenvman.2020.110859
Liu, R. M., Sun, C. C., Han, Z. X., Chen, L., Huang, Q., Chen, Y. X., et al. (2012). Water environmental capacity calculation based on uncertainty analysis: A case study in the baixi watershed area, China. Procedia Environ. Sci. 13, 1728–1738. doi:10.1016/j.proenv.2012.01.166
Lu, J., Guo, Z., Kang, Y., Fan, J., and Zhang, J. (2020). Recent advances in the enhanced nitrogen removal by oxygen-increasing technology in constructed wetlands. Ecotoxicol. Environ. Saf. 205, 111330. doi:10.1016/j.ecoenv.2020.111330
Luo, X., Li, Y., Wu, Q., Wei, Z., Li, Q., Wei, L., et al. (2019). Characteristics of internal ammonium loading from long-term polluted sediments by rural domestic wastewater. Int. J. Environ. Res. Public Health 16, 4657. doi:10.3390/ijerph16234657
Ni, L., Gu, G., Rong, S., Hu, L., Wang, P., Li, S., et al. (2019). Effects of cyanobacteria decomposition on the remobilization and ecological risk of heavy metals in Taihu Lake. Environ. Sci. Pollut. Res. 26, 35860–35870. doi:10.1007/s11356-019-06649-y
Pereira Souza, F., Leite Costa, M. E., and Koide, S. (2019). Hydrological modelling and evaluation of detention ponds to improve urban drainage system and water quality. Water 11, 1547. doi:10.3390/w11081547
Rahman, M. T., Nielsen, R., Khan, M. A., and Asmild, M. (2019). Efficiency and production environmental heterogeneity in aquaculture: A meta-frontier DEA approach. Aquaculture 509, 140–148. doi:10.1016/j.aquaculture.2019.05.002
Rodgers, K., McLellan, I., Peshkur, T., Williams, R., Tonner, R., Knapp, C. W., et al. (2020). The legacy of industrial pollution in estuarine sediments: Spatial and temporal variability implications for ecosystem stress. Environ. Geochem. Health 42, 1057–1068. doi:10.1007/s10653-019-00316-4
Schmidt, C., Kumar, R., Yang, S., and Büttner, O. (2020). Microplastic particle emission from wastewater treatment plant effluents into river networks in Germany: Loads, spatial patterns of concentrations and potential toxicity. Sci. Total Environ. 737, 139544. doi:10.1016/j.scitotenv.2020.139544
Tone, K., and Tsutsui, M. (2014). Dynamic DEA with network structure: A slacks-based measure approach. Omega 42, 124–131. doi:10.1016/j.omega.2013.04.002
Tuttolomondo, T., Virga, G., Licata, M., Leto, C., and La Bella, S. (2020). Constructed wetlands as sustainable technology for the treatment and reuse of the first-flush stormwater in agriculture—a case study in sicily (Italy). Water 12, 2542. doi:10.3390/w12092542
Wang, C., Wu, J., and Zhang, B. (2018). Environmental regulation, emissions and productivity: Evidence from Chinese COD-emitting manufacturers. J. Environ. Econ. Manag. 92, 54–73. doi:10.1016/j.jeem.2018.08.004
Wang, J., Fu, Z., Qiao, H., and Liu, F. (2019a). Assessment of eutrophication and water quality in the estuarine area of Lake Wuli, Lake Taihu, China. Sci. Total Environ. 650, 1392–1402. doi:10.1016/j.scitotenv.2018.09.137
Wang, M., Huang, Y., and Li, D. (2021a). Assessing the performance of industrial water resource utilization systems in China based on a two-stage DEA approach with game cross efficiency. J. Clean. Prod. 312, 127722. doi:10.1016/j.jclepro.2021.127722
Wang, M., Xu, X., Wu, Z., Zhang, X., Sun, P., Wen, Y., et al. (2019b). Seasonal pattern of nutrient limitation in a eutrophic lake and quantitative analysis of the impacts from internal nutrient cycling. Environ. Sci. Technol. 53, 13675–13686. doi:10.1021/acs.est.9b04266
Wang, Q., Liu, R., Men, C., Guo, L., and Miao, Y. (2019c). Temporal-spatial analysis of water environmental capacity based on the couple of SWAT model and differential evolution algorithm. J. Hydrology 569, 155–166. doi:10.1016/j.jhydrol.2018.12.003
Wang, S., Chen, S., Zhang, H., and Song, M. (2021b). The model of early warning for China’s marine ecology-economy symbiosis security. Mar. Policy 128, 104476. doi:10.1016/j.marpol.2021.104476
Wang, S., Lei, L., and Xing, L. (2021c). Urban circular economy performance evaluation: A novel fully fuzzy data envelopment analysis with large datasets. J. Clean. Prod. 324, 129214. doi:10.1016/j.jclepro.2021.129214
Wang, Y., Bian, Y., and Xu, H. (2015). Water use efficiency and related pollutants’ abatement costs of regional industrial systems in China: A slacks-based measure approach. J. Clean. Prod. 101, 301–310. doi:10.1016/j.jclepro.2015.03.092
Xu, Y., Su, B., Wang, H., He, J., and Yang, Y. (2020). Analysis of the water balance and the nitrogen and phosphorus runoff pollution of a paddy field in situ in the Taihu Lake basin. Paddy Water Environ. 18, 385–398. doi:10.1007/s10333-020-00789-5
Yan, R., Gao, Y., Li, L., and Gao, J. (2019a). Estimation of water environmental capacity and pollution load reduction for urban lakeside of Lake Taihu, eastern China. Ecol. Eng. 139, 105587. doi:10.1016/j.ecoleng.2019.105587
Yan, R., Li, L., and Gao, J. (2019b). Framework for quantifying rural NPS pollution of a humid lowland catchment in Taihu Basin, Eastern China. Sci. Total Environ. 688, 983–993. doi:10.1016/j.scitotenv.2019.06.114
Yang, J., Lei, K., Khu, S., Meng, W., and Qiao, F. (2015). Assessment of water environmental carrying capacity for sustainable development using a coupled system dynamics approach applied to the Tieling of the Liao River Basin, China. Environ. Earth Sci. 73, 5173–5183. doi:10.1007/s12665-015-4230-0
Yang, J., Liu, X., Ying, L., Chen, X., and Li, M. (2020). Correlation analysis of environmental treatment, sewage treatment and water supply efficiency in China. Sci. Total Environ. 708, 135128. doi:10.1016/j.scitotenv.2019.135128
Keywords: water environment capacity, MIKE11, EE–SBM–DEA, industrial structure, sustainable development
Citation: Bu J, Zhang S, Wang X, Li C, Wang X, Liu Q, Xu X and Wang X (2023) Study on the influence of industrial structure optimization on water environment and economy: A case study of Changzhou city. Front. Earth Sci. 10:961299. doi: 10.3389/feart.2022.961299
Received: 06 June 2022; Accepted: 31 October 2022;
Published: 12 January 2023.
Edited by:
Wouter Buytaert, Imperial College London, United KingdomReviewed by:
Shuhong Wang, Shandong University of Finance and Economics, ChinaCopyright © 2023 Bu, Zhang, Wang, Li, Wang, Liu, Xu and Wang. This is an open-access article distributed under the terms of the Creative Commons Attribution License (CC BY). The use, distribution or reproduction in other forums is permitted, provided the original author(s) and the copyright owner(s) are credited and that the original publication in this journal is cited, in accordance with accepted academic practice. No use, distribution or reproduction is permitted which does not comply with these terms.
*Correspondence: Chunhui Li, Q2h1bmh1aWxpQGJudS5lZHUuY24=
Disclaimer: All claims expressed in this article are solely those of the authors and do not necessarily represent those of their affiliated organizations, or those of the publisher, the editors and the reviewers. Any product that may be evaluated in this article or claim that may be made by its manufacturer is not guaranteed or endorsed by the publisher.
Research integrity at Frontiers
Learn more about the work of our research integrity team to safeguard the quality of each article we publish.