 Qing Guo
 Mancang Dong3
95% of researchers rate our articles as excellent or good
Learn more about the work of our research integrity team to safeguard the quality of each article we publish.
Find out more
ORIGINAL RESEARCH article
Front. Earth Sci. , 08 August 2022
Sec. Structural Geology and Tectonics
Volume 10 - 2022 | https://doi.org/10.3389/feart.2022.959796
This article is part of the Research Topic Quantitative Characterization and Engineering Application of Pores and Fractures of Different Scales in Unconventional Reservoirs – Volume II View all 39 articles
Quantitatively characterizing the micro-scale heterogeneity of pore throats in tight sandstone reservoirs is the key to accurately describing the influence of pore structures on fluid occurrence characteristics. In this study, taking the Chang 6 Member of the Yanchang Formation in the Huaqing area of the Ordos Basin as an example, the pore-throat heterogeneity of tight sandstone reservoirs and its influence on the fluid occurrence state have been systematically studied using cast thin section, scanning electron microscope, X-ray diffraction, constant velocity mercury intrusion, and nuclear magnetic resonance tests. The main types of pores developed in the target layer were intergranular pores, followed by feldspar dissolution pores. The radius distribution of the intergranular pores is between 5.0 and 210 μm, with an average value of 50.27 μm. In addition, the pore combination types with the best petrophysical properties are the intergranular pore type, the intergranular-dissolution pore type, and the dissolution-intergranular pore type; the average permeability and porosity are 0.62 mD, 0.40 mD, 0.44 mD, and 12.0, 12.3, 12.3%, respectively. The target sandstones contain four typical T2 relaxation time types. The large-pore-fine-throat combination reservoir has the best petrophysical properties. The larger the pore-throat uniformity value, the more uniform the pore-throat radius, and the greater the reservoir permeability. Therefore, the uniformity of throat development controls the seepage capacity of the tight reservoirs. The movable fluid saturation of different pore types has obvious differences. The movable fluid saturations at the 0.1 and 0.5 μm pore diameters of the macro-pore-fine-throat and macro-pore-micro-throat reservoirs both show an obvious inflection point, and the movable water saturation is higher with a larger throat radius.
Tight oil reservoirs refer to oil layers such as sandstones and carbonate rocks with an overburden matrix permeability less than 0.2 mD or an air permeability less than 2 mD (Zou et al., 2012; Anovitz et al., 2013; Anovitz and Cole., 2015; Lai et al., 2018a; Cao et al., 2020). Tight sandstone reservoirs have the characteristics of small pore-throat size, strong heterogeneity, and complex pore structures (Lai and Wang., 2015; Cai, 2020; Hong et al., 2020; Bukar et al., 2021). The occurrence states and the final recoverability of oil and gas in tight reservoirs are the most concerning issues in the exploration and production of oil and gas (Gier et al., 2008; Desbois et al., 2011; Chen et al., 2014; Ghanizadeh et al., 2015; Lai et al., 2018b).
Reservoir heterogeneity is the inhomogeneous changes of the internal properties of reservoirs caused by the influence of depositional environment, diagenesis, and tectonic action during the deposition and burial processes (Kwak et al., 2017; Meng et al., 2017; Li et al., 2019; Hower and Groppo., 2021; Huang et al., 2021). Obviously, the sorting coefficients of pores and throats cannot accurately reflect the heterogeneity of the microscopic pore structures of tight sandstone reservoirs. In fact, in the reservoir storage of tight sandstone reservoirs, there are certain differences in the distribution of pore throats in different pore-throat intervals (Ma, 2005; Jiang et al., 2017; Pang et al., 2019; Liu et al., 2020; Kang, 2021). Therefore, quantitatively characterizing the micro-scale heterogeneity of pore-throats in tight sandstone reservoirs is the key to accurately describing the influence of pore structures on fluid occurrence characteristics (Lei et al., 2012; Sun et al., 2014; Li et al., 2019; Luo et al., 2019; Ren et al., 2019; Liu J et al., 2022). Pore-throat heterogeneity has a significant effect on tight reservoir permeability. The configuration of pores and roars determines the path of fluid flow and the resistance they need to overcome, which ultimately affects fluid flowability or reservoir permeability. Permeability is a core factor in determining reservoir productivity (Sun et al., 2014; Luo et al., 2019; Ren et al., 2019).
At present, the main problem in the efficient development of the Chang 6 Member of Yanchang Formation in the Ordos Basin is that the influence mechanism of microscopic pore structures on oil productivity is not clear. In this study, taking the Chang 6 Member of the Yanchang Formation in the Huaqing area of the Ordos Basin as an example, the pore-throat heterogeneity of tight sandstone reservoirs and its influence on the fluid occurrence state have been systematically studied using cast thin section, scanning electron microscope, X-ray diffraction, constant velocity mercury intrusion, and nuclear magnetic resonance tests. This study can provide scientific guidance for the scientific formulation of tight oil reservoir recovery programs.
The study area is located in the Huaqing area of the Ordos Basin (Figure 1). The area is adjacent to the Changguan Temple in the north, the Resettlement Farm in the south, Yuancheng city in the west and Majiabian city in the east, with an area of about 6,150 km2. Its tectonic location is located in the southern part of the Yishan Slope. The target layer is the Chang 6 Member of the Upper Triassic Yanchang Formation, and it belongs to the delta front facies deposits.
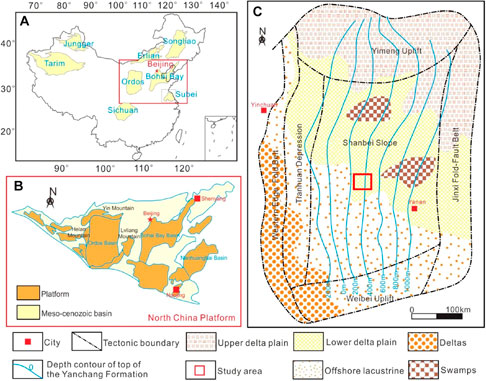
FIGURE 1. Location of the study area (modified after Liu Y et al., 2022). (A) The study area is located in the Ordos Basin of the North China Plate; (B) The distribution of sedimentary basins in the North China Plate; (C) The study area is located in the central part of the Ordos Basin.
Constant-rate mercury intrusion technology can provide detailed information on pore structures by monitoring the pressure fluctuations during mercury injection. Constant-rate mercury intrusion can measure the number of throats during the experiments; it has overcome the shortcomings of conventional mercury intrusion. In this study, the mercury was injected into the core at a low injection rate (0.00005 ml/min). During the mercury injection process, the pressure drops and rises periodically, and the experiment ends when the pressure reaches 900 psi (6.2055 MPa).
An ASPE-730 constant-speed mercury intrusion device was used to conduct the constant-speed mercury intrusion experiments. The specific steps taken in the experiments are as follows:
(1) First, drilling a standard core with a diameter of 2.5 cm from a full-diameter core, then drying it at an experimental temperature of 23°C.
(2) Then, measuring the porosity of the standard core after drying via the gas measurement method.
(3) Using the gas measurement method to measure the permeability of the standard core after drying.
(4) Selecting representative standard cores for constant-rate mercury intrusion experiments.
(5) Evacuating the rock samples and immersing them in the mercury solution.
(6) Adjusting the experimental temperature to 25°C, the humidity to 65–75%, and the mercury injection rate to 0.000001 ml/s∼1 ml/min. The contact angle was 140° and the surface tension was 485 dyne/cm. Real-time monitoring and automated data acquisition were output through computer systems.
The interior of the reservoir is saturated with three-phase fluids of oil, gas, and water. The occurrence states of these fluids in the reservoir can be divided into two categories: one is bound fluid state; the other is free fluid state. When the fluid-contained rock sample is in a static magnetic field, the hydrogen nuclei contained in the fluid are easily polarized by the magnetic field. NMR technology uses the inverse relationship between the hydrogen nuclear relaxation rate and the pore size of the reservoir rock to study the pore structures of rocks, and to determine the movable fluid saturation and the occurrence states of fluids of the reservoir. When the pore radius of the rock is too small, the fluid in it cannot flow due to the large capillary force and the specific surface binding effect. NMR experiments were used to determine the occurrence characteristics of movable fluids and the distribution of pore throats based on the T2 spectral relaxation time and different spectral peak characteristics. The calculation relationship between the movable fluid porosity (Φm, %), the movable fluid saturation (Sm, %), and the water-measured porosity (Φ, %) is: Φm=Sm×Φ/100.
A Magnet 2000 instrument was used to perform NMR T2 measurements at a constant temperature of 20°C. The specific experimental steps are as follows:
(1) Selecting a representative standard core with a diameter of 2.5 cm.
(2) Drying the standard core.
(3) Measuring the porosity and air permeability of the samples.
(4) Saturating the samples with the simulated formation water (total salinity is 25,000 mg/L).
(5) Calculating the porosity of cores using the difference between the wet weight and the dry weight.
(6) Performing nuclear magnetic resonance T2 measurements on the standard core saturated with simulated formation water.
According to the observation results of cast thin sections, the sandstones of the Chang 6 oil layer group in this area have the characteristics of “low quartz and high feldspar content.” The main lithologies of the Chang 6 Member include feldspar sandstone and lithic feldspar sandstone. The quartz content ranges from 28 to 30%, the feldspar content ranges from 34 to 40%, and the debris content ranges from 10 to 12% (Figure 2). The debris components are mainly composed of metamorphic rocks with a content of 5.5–7.5%, followed by the sedimentary rocks, with a content of 2.5–3.2%, and the igneous rocks, with a relatively small content of 1.2–2.5%. In addition, there are detrital minerals such as mica and chlorite.
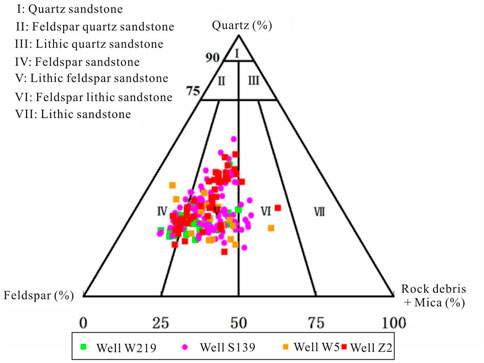
FIGURE 2. Classification of sandstone lithology of the Chang 6 Member in the study area.
According to the results of the cast thin sections of the rock samples, the maximum particle size distribution of the Chang 6 reservoir sandstone in the study area is 0.10–0.90 mm, and the main particle size is 0.01–0.50 mm. The cements of the Chang 6 sandstone mainly include hydromica, chlorite, iron calcite, iron dolomite, calcite, and siliceous components.
The porosity of the Chang 6 reservoir in the study area is between 8 and 20.9%, the main interval is between 8 and 12%, and the average porosity is 11.6%; the permeability is between 0.08 and 17.49 mD, the main interval is between 0.1 and 0.5 mD, and the average permeability is 0.355 mD. Therefore, the Chang 6 Member belongs to the low-porosity-ultra-low-porosity, low-permeability-ultra-low permeability reservoir.
It can be seen from Figure 3 that the correlation between the porosity and permeability of the samples satisfies the quadratic polynomial relationship, and the correlation coefficient is 0.808.
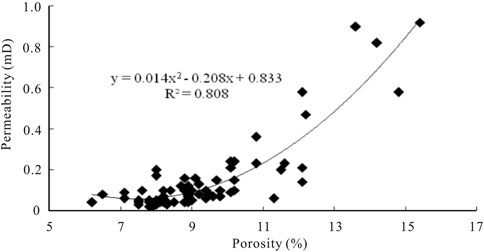
FIGURE 3. Relationship between porosity and permeability of the samples in the target layer.
The main types of pores developed in the Chang 6 reservoir in the study area are intergranular pores, intergranular dissolution pores, feldspar dissolution pores, debris dissolution pores, and intercrystalline pores, among which intergranular pores and feldspar dissolution pores are the main ones.
Residual intergranular pores refer to the remaining part of the initial intergranular pores during deposition and filled with cements (Figures 4A,B). These pores are further subdivided into compacted intergranular pores, interstitial intergranular pores, and dissolution intergranular pores according to the degree of filling, dissolution, and compaction. The shapes of these pores are mostly polygonal, triangular, and irregular (Li and Zhang., 2011; Li et al., 2017). The samples mainly developed cement-type and dissolution-type intergranular pores. These pores generally exist between framework minerals, and the surface of the pores are often coated with chlorite, while secondary quartz is occasionally to be seen; the other kind of pores exists between the framework minerals and clay minerals, which are the products of clay minerals under compression and bending, and the pores are mostly triangular or meniscus. The absolute content of the intergranular pores is between 0.2 and 12.0%, with an average value of 3.81% and a relative average content of 71.06%. Statistics show that the radii of different types of pores vary greatly, and the pore radii of the target layer are mainly between 5.0 and 210 μm, with an average value of 50.27 μm. Intergranular pores are the main oil and gas storage space in the target layer.
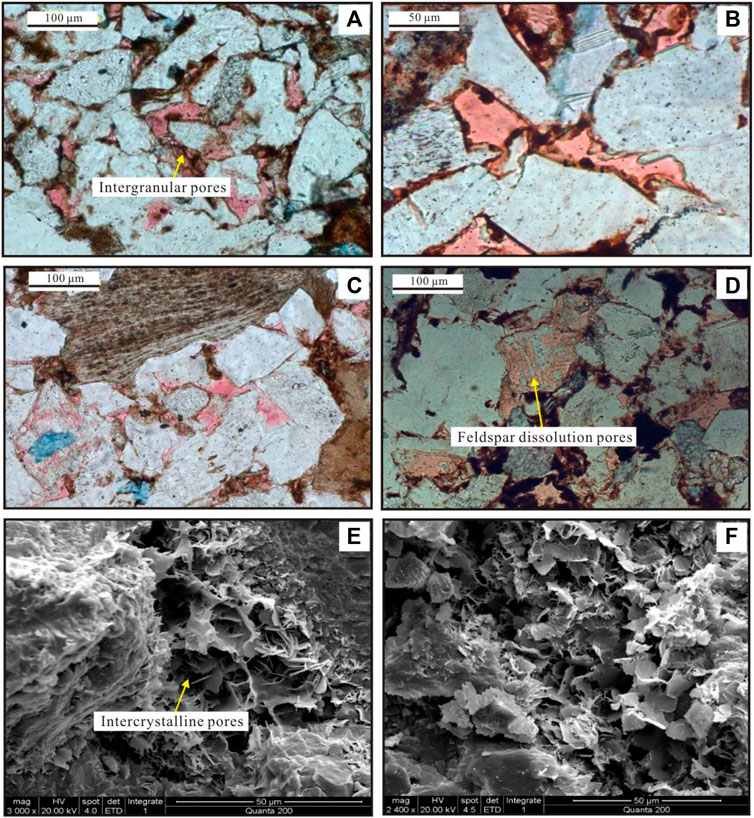
FIGURE 4. Development characteristics of different types of pores in the target layer. (A) Intergranular pores, Well H259, 2,191.00 m; (B) Intergranular pores, Well H470, 2,140.8 m; (C) Feldspar dissolution pores, Well H408, 1,960.95 m; (D) Feldspar dissolution pores, Well H284, 2,181.95 m; I Illite and chlorite intercrystalline pores, Well H156, 2,084.28 m; (F) Illite and chlorite intercrystalline pores, Well H72, 2,069.00 m.
The dissolution pores developed in the target layer are mainly feldspar dissolution pores, followed by the debris dissolution pores and the cement dissolution pores. Feldspar dissolution pores are the most important type of dissolution pores. It undergoes selective grain boundary and intragranular dissolution along the soluble part and cleavage of feldspar grains, and presents various pore morphologies, such as cleavage dissolution, mold dissolution, and irregular grain boundary dissolution (Figures 4C,D). The dissolution pores and intergranular pores of feldspar particles can be connected together to form super-large pores, and the pore sizes vary widely (15–200 µm). The absolute content of feldspar dissolution pores is between 0.1 and 2.0%, with an average content of 0.65%.
Intercrystalline micro-pores are also an important type of pore, which includes primary and secondary cement intercrystalline micro-pores (Luo et al., 2018; Mirzaei-Paiaman and Ghanbarian., 2021). It can be seen that the radius of such pores is generally less than 5 μm under the scanning electron microscope (Figures 4E,F). The primary intercrystalline micro-pores in the samples are mainly cleavage intercrystalline micro-pores of mica. The intercrystalline pores of framework minerals are generally formed by the dissolution of feldspar minerals. The intercrystalline micro-pores mainly include authigenic chlorite, illite, and micro-pores between secondary quartz. Statistics show that the absolute content of the intergranular micro-pores is between 0.01 and 0.6%, with an average value of 0.12%.
The final statistical results show that the pore combination types with the best petrophysical properties are the intergranular pore type, the intergranular-dissolution pore type, and the dissolution-intergranular pore type; their average permeability and porosity are 0.62 mD, 0.40 mD, 0.44 mD, and 12.0, 12.3, 12.3%, respectively. The micro-pore type has a small average pore size, low surface porosity, and the lowest seepage capacity.
In this experiment, 13.895 ms was taken as the limit value of T2 relaxation time of movable and bound fluids. Movable fluid saturation is the percentage of the amplitude of each point, with T2 relaxation time greater than 13.895 ms on the T2 spectrum. Conversely, the bound fluid saturation is the percentage of the amplitudes of the points where the T2 relaxation time is less than 13.895 ms on the T2 spectrum.
In order to achieve the comparative analysis of samples with different pore-throat matching relationships and different permeability levels, the screening of experimental samples has comprehensively considered the results of casting thin sections, scanning electron microscopy, and petrophysical property tests. On the basis of fully considering the characteristics of sedimentation and diagenesis, four groups of samples with different permeability levels were selected, respectively. Furthermore, in each group, one sample was selected for comparison of the microscopic pore structures.
The target sandstones contain four typical T2 spectral relaxation time types (Figure 5):
(1) Bimodal type (the left peak is lower than right peak). For the first type, the H208 rock sample in Figure 5A is taken as an example, and its T2 spectral distribution is bimodal type. The areas on both sides of the 13.895 ms time limit are basically equal, the movable fluid saturation is 45.55%, and the irreducible water saturation is 54.45%. It shows that the movable fluid saturation is slightly larger than the irreducible water saturation.
(2) Asymmetric unimodal type. The T2 spectrum distribution of the H470 rock sample showed an asymmetric single peak type (Figure 5B). Its single peak is almost on the left side of the time limit of 13.895 ms, the movable fluid saturation is 11.37%, and the irreducible water saturation is 88.63%. This means that there are few movable fluids and a lot of bound water inside the rock;
(3) Bimodal type (the left peak higher than right peak). The T2 spectrum distribution of the H518 rock sample is bimodal (Figure 5C). The area on the left side of the time limit of 13.895 ms is much larger than the area on the right side. The movable fluid saturation is 29.04%, and the irreducible water saturation is 70.96%. This means that the movable fluid saturation is less than the irreducible water saturation;
(4) Narrow single peak type. The T2 spectrum of the H141 rock sample is a narrow single peak type (Figure 5D). The single-peak body is to the left of the 13.895 ms time limit. The movable fluid saturation is 9.09%, and the irreducible water saturation is 90.91%.
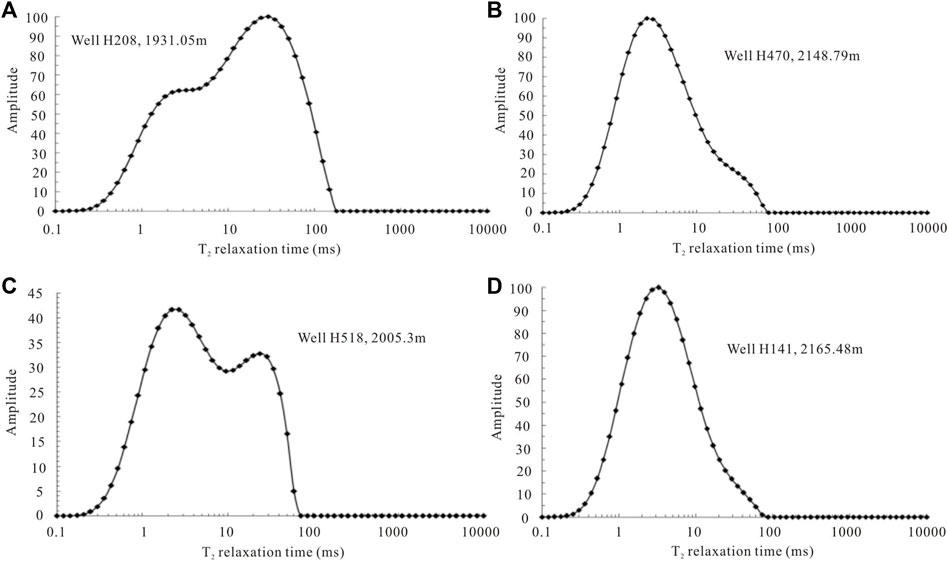
FIGURE 5. Distribution characteristics of different types of T2 relaxation times. (A) Well H208, 1931.05 m; (B) Well H470, 2148.79 m; (C) Well H518, 2005.3 m; (D) Well H141, 2165.48 m.
This study shows that the T2 spectral cutoff value of the low-permeability movable fluid is low, that the movable fluid saturation in the pores is low, and that the movable fluid saturation value and the movable fluid porosity value fluctuate greatly.
The pore-throat characteristic parameters of the capillary pressure curves of 28 samples were statistically analyzed, and the correlations between each pore-throat characteristic parameter and reservoir porosity and permeability were analyzed. The results show that the permeability has a good correlation with the displacement pressure and the maximum pore-throat radius, and the correlation coefficients are both 0.56 (Figures 6A,B). Moreover, the correlation between the porosity and the maximum mercury inflow saturation is also good, and it has a correlation coefficient of 0.51 (Figure 6C). However, the petrophysical parameters have poor or no correlation with other pore-throat characteristic parameters.
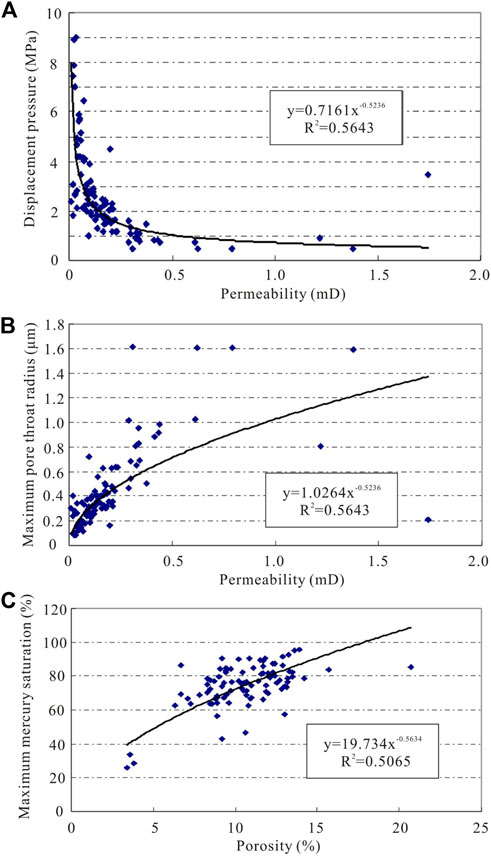
FIGURE 6. Relationship between petrophysical property parameters and pore structure parameters. (A) Relationship between displacement pressure and permeability; (B) Relationship between maximum pore-throat radius and permeability; (C) Relationship between maximum mercury saturation and porosity.
Reservoir heterogeneity is the inhomogeneous change of internal properties caused by the influence of depositional environment, diagenesis, and tectonic action (Sebacher et al., 2017; Wang A. et al., 2018; Malatesta et al., 2018; Lan et al., 2021; Yang et al., 2021). Under the guidance of information entropy theory, this study takes different types of pore-throat assemblages and classifications as the starting point to construct a quantitative characterization model of pore-throat micro-scale heterogeneity in tight oil reservoirs.
(1) First, under the guidance of the information entropy theory, the information entropy of different pore and throat distributions is calculated using the MATLAB programming language:
where zi is the percentage of the ith pore radius and throat radius, which is obtained from the frequency spectrum of the pore radius and throat radius distribution. When the travel frequency of different pores and throat sizes is the same, i.e. when z1=I...=zn=1/N, the entropy value reaches the maximum value of lnN, indicating that the size distribution of pores and throats has reached a uniform state.
In the same way, the information entropy can be used to analyze the relative uniformity of the size distribution of pore radii and throat radii within the interval of different pore radii and throat radii.
(2) In practical applications, there are differences in the size distribution characteristics of pores and throats of different types of pore-throat combination reservoirs (Meng et al., 2017; Huang et al., 2021). Therefore, the uniformity M (the ratio of the actual entropy value to the maximum entropy value) of the size distribution of pore radius and throat radius is introduced to characterize the uniformity of the size distribution of pores and throats in different types of pore-throat combination reservoirs, namely:
The greater the uniformity, the more uniform the distribution of the parameter.
(3) In order to use the information entropy to determine the weight of pores and throats, and to solve the joint uniformity of pores and throats, the degree of dispersion of pores and throats is calculated first (Sebacher et al., 2017; Malatesta et al., 2018). Generally, the degree of dispersion of the jth index (pores, throats) depends on Mj:
The more dispersed the value of the jth index (pores, throats), the higher the importance of the jth index (pores, throats). Among all n indexes (pores, throats), the weight of the jth index (pores, throats) can be determined using Eq. 4.
where j=1,2.
(4) Combining the uniformity information entropy of pores and throats, the generated joint uniformity information entropy I is:
Based on steps (3) and (4), combined with steps (1) and (2), the uniformity of pore radius and throat radius of six rock samples from the Chang 6 reservoir in the study area is obtained. The results are shown in Table 1.
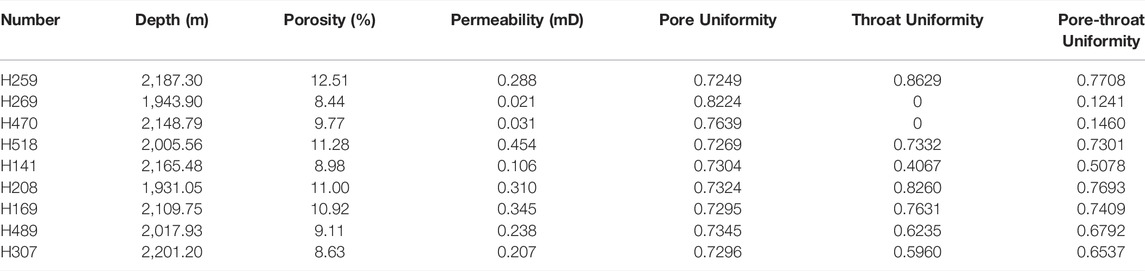
TABLE 1. Pore-throat uniformity of reservoirs with different types of pore-throat combinations.
It can be seen from Table 1 that, for the reservoirs with macro-pore-micro-throat combination (rock samples H269, H470, and H141), the information entropy of the combined pore-throat uniformity ranges from 0.1240 to 0.0.5078, with an average value of 0.2593. For reservoirs with macro-pore-micro-throat combination (rock samples H518 and H259), the information entropy of the combined pore-throat uniformity ranges from 0.7301 to 0.0.7708, with an average value of 0.0.7504. The information entropy of the pore-throat uniformity of the H208 rock sample is 0.7693. The above results show that the pore-throat distribution of the reservoir with the macro-pore-fine-throat combination is the best, followed by the macro-pore-micro-throat combination, and the reservoir with the macro-pore-micro-throat combination has the worst pore-throat uniformity. This shows that the microscopic heterogeneity of the Chang 6 reservoir in the study area is mainly controlled by the uniformity of throat distribution.
The study found that the smaller the permeability of the sample, the more concentrated the distribution of the contribution of the throat to the rock permeability, and the larger the contribution peaks. With the gradual increase of rock permeability, the distribution interval of throats becomes wider, the number of large throats increases, and the contribution of small throats to permeability decreases significantly. Then, the contribution of the large throats to the rock permeability increases, and the throat radius corresponds to the contribution peaks moves to the side of large throats. For example, the throat radii corresponding to the contribution peaks of the two samples of H208 and H518 are 1.1 and 0.6 μm, respectively. At this time, the number of large throats that mainly contribute to the rock permeability increases, and the peak value of the contribution decreases significantly. The fundamental reason for the poor petrophysical properties (especially permeability) of the low-permeability tight sandstones lies in the large proportion of small throats.
Statistics show that the H208 sample with a large-pore-fine-throat reservoir (permeability >0.3 mD, low permeability) has a peak throat radius of 1.1 μm, and the cumulative contribution to the rock permeability is 60.19%. For the H259 sample with macro-pore-micro-throat (permeability of 0.3 mD<K<0.1 mD, ultra-low permeability), the cumulative contribution of the permeability corresponding to the peak throat radius of 0.4 μm is 87.6%. In addition, the cumulative contribution of the permeability corresponding to the peak throat radius of 0.2 μm for the H141 sample with macro-pore-micro-throat (permeability K<0.1 mD) is 96.39%, and the main peak is in the micro-throat grade range.
It can be seen from Figure 7 that the relationship between the permeability and uniformity of pore-throats is better than that of porosity. This is because permeability is the most direct factor determining the pore structures of tight reservoirs, while porosity is an indirect factor.
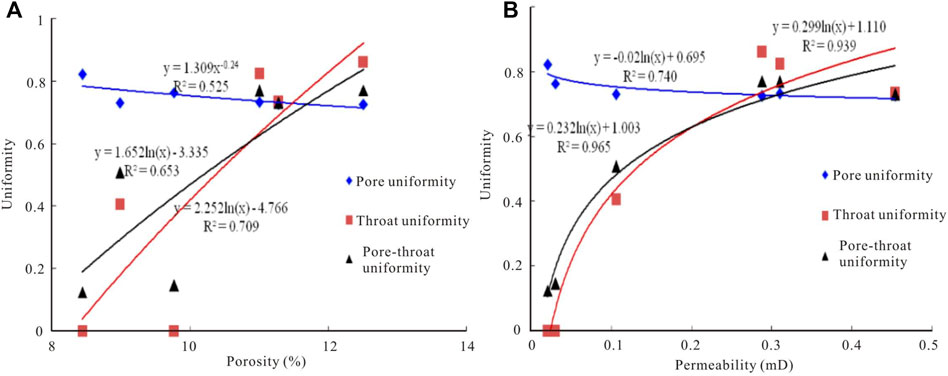
FIGURE 7. Relationship between reservoir physical parameters and uniformity of pores and throats. (A) Relationship between porosity and uniformity; (B) Relationship between permeability and uniformity.
The pore uniformity is negatively correlated with the porosity, and the correlation coefficient R2 is 0.525. This shows that the larger the value of the pore uniformity, the more uniform the development degree of pores, but the reservoir porosity will decrease; the throat uniformity is positively correlated with porosity, and the correlation coefficient R2 is 0.653, indicating that the larger the throat uniformity value, the more uniform the development degree of throats, and the greater the reservoir porosity; in addition, the pore-throat uniformity is positively correlated with porosity, and the correlation coefficient R2 is 0.709, indicating that the larger the pore-throat uniformity value, the more uniform the pore-throat boundary, and the greater the reservoir porosity (Rezaee et al., 2012; Mahmud et al., 2020; Mohammed et al., 2021).
The comparative results show that the uniformity of the throat development controls the effectiveness of the reservoir space (Shanley and Cluff., 2015; Xi et al., 2016; Qiao et al., 2020; Qie et al., 2021). The pore uniformity is negatively correlated with permeability, and the correlation coefficient R2 is 0.749, indicating that the larger the pore uniformity value, the more uniform the pores, but the reservoir permeability will decrease; the throat uniformity is positively correlated with porosity, and the correlation coefficient R2 is 0.939, indicating that the larger the throat uniformity value, the more uniform the throats, and the greater the reservoir permeability; the pore-throat uniformity is positively correlated with rock permeability, and the correlation coefficient R2 is 0.978, indicating that the larger the pore-throat uniformity value, the more uniform the pore-throat radius, and the greater the reservoir permeability. Therefore, the uniformity of throat development controls the seepage capacity of the reservoir (Zhao et al., 2015; Saein and Riahi., 2017; Yin et al., 2018; Santosh and Feng., 2020; Zhang et al., 2020).
It can be seen from Figure 8 that the throat radius between 2.5 and 4.0 μm is only developed in the macro-pore-micro-throat combination type reservoir (H518 rock sample), but the contribution to permeability is relatively small (only 16.61%). This shows that the throats of 2.5–4.0 μm are less developed in this type of reservoir, thus it has little effect on the seepage capacity of the reservoir. When the throat radius is between 1.0 and 2.5 μm, the reservoirs of the large-pore-fine-throat (H208 rock sample) and the large-pore-micro-throat combination (H259, H518 rock samples) are uniformly developed. However, the reservoirs with macro-pore-micro-throat combination do not develop such kind of throats. The distribution of the uniformity (0.9917) and the permeability contribution (73.26%) of the throats of the large-pore-fine throat (rock sample H208) in this interval are better than those of the large-pore-micro-throat combination (rock samples H259 and H518). This shows that the throats of the 1.0–2.5 μm interval control the seepage capacity of the large-pore-fine-throat combination reservoirs. However, its effect on the seepage capacity of the reservoir with large pores and fine throats (the average permeability contribution is 34.02%) is relatively small. When the throat radius is between 0.5 and 1.0 μm, the reservoirs of the large-pore-fine-throat (H208 rock sample) and the large-pore-micro-throat combination (H259, H518 rock samples) are uniformly developed. However, reservoirs with macro-pore-micro-throat combination do not develop such kind of throats. The average value of throat uniformity (0.9718) and the average value of permeability contribution (41.455%) in the large-pore-micro-throat combination (rock samples H259 and H518) in this interval are better than those of the macro-pore-fine-throat (H208 rock sample). This shows that the throat radius of 0.5–1.0 μm can control the seepage capacity of the reservoir with the macro-pore-micro-throat combination better than the reservoir of the macro-pore-fine-throat combination (the uniformity of throat is 0.5931, and the permeability contribution is 26.73%). When the throat radius is between 0.1 and 0.5 μm, all kinds of reservoirs develop such throats. Among them, the throat uniformity (0.9308) of the large pores and fine throats (H208 rock sample) in this interval is better than that of other reservoirs. However, in terms of contribution to the seepage capacity of the reservoir, this type of throat is the most developed in the macro-pore-micro-throat reservoir, and the permeability contribution value (100%) is the largest. The second is the reservoir with macro-pore-micro-throat combination (the average permeability contribution is 11.13%). However, in the reservoir with large-pore-fine-throat combination, this type of throat contributes the least to the seepage capacity of the reservoir (the contribution value of permeability is 0.001%).

FIGURE 8. Relationship between uniformity at different scales and permeability contribution of throats.
Statistical results show that, when the throat radius is greater than 0.1 μm, the corresponding movable fluid percentages in the macro-pore-fine-throat, macro-pore-micro-/fine-throat, and macro-pore-micro-throat reservoirs are 45.55%, 24.45%, and 7.54%, respectively. When the throat radius is in the range of 0.1–0.5 μm, the corresponding movable fluid saturations of the macro-pore-fine-throat, macro-pore-micro-/fine-throat, and macro-pore-micro-throat reservoirs are 34.19, 24.11%, and 7.02%, respectively. When the throat radius is in the range of 0.5–1.0 μm, the corresponding movable fluid saturations of the macro-pore-fine-throat, macro-pore-micro-/fine-throat, and macro-pore-micro-throat reservoirs are 8.24, 0.34, and 0.43%, respectively. When the throat radius is greater than 1.0 μm, the corresponding movable fluid saturations of the macro-pore-fine-throat, macro-pore-micro-/fine-throat, and macro-pore-micro-throat reservoirs are 3.12%, 0, and 0.09%, respectively.
The movable fluids of different pore types have obvious differences (Wang L. et al., 2018; Shi et al., 2019; Yin and Wu, 2020; Zhou et al., 2021). Among them, the macro-pore-fine-throat reservoirs have the highest movable fluid saturation, followed by the macro-pore-micro-/fine-throat reservoirs, while the macro-pore-micro-throat reservoirs have the lowest movable fluid saturation. The macro-pore-fine-throat and macro-pore-micro/-fine-throat types show obvious inflection points at 0.1 and 0.5 μm, and the larger the throat radius, the higher the movable water saturation (Figure 9).
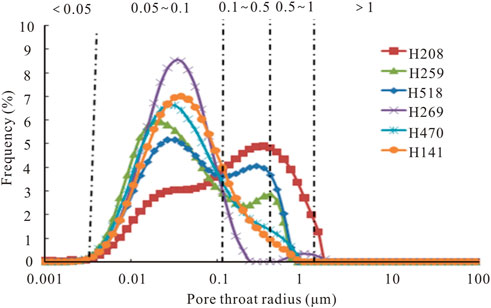
FIGURE 9. Distribution frequencies of the pore-throat radius of the samples.
It can also be seen from Figure 8 that the crude oil in the pore throat corresponding to the pore-throat radius >1.0 μm is preferentially produced and the remaining oil is less. However, most of the crude oil in the pore throats within the pore-throat radius of 0.1–1.0 μm is recovered. The distribution of the residual fluid is closely related to its existing pore structures (Zhang et al., 2019; Yoshida and Santosh., 2020; Wang et al., 2021; Xue et al., 2021). The distribution of the T2 spectrum is different, and the remaining fluid volume and the states are different. Large-pore-fine-throat reservoirs have developed intergranular and dissolution pores, with large effective pore space and high residual movable fluid content. However, the remaining movable fluid is the least in the macro-pore-micro-throat type reservoirs.
It can be seen from Figure 10 that with the increase of core permeability, the movable oil saturation increases. The change trend of the movable oil controlled by different pore-throat radius is different. When the pore-throat radius is between 0.1 and 0.5 μm and with the peak point of permeability (0.03 and 0.3 mD) as the boundary, there is a good correspondence between the permeability and the change of movable oil saturation. Especially when the permeability is less than 0.10 mD and greater than 0.3 mD, the movable oil first increases and then decreases with the permeability and pore development degree. When the pore-throat radius is between 0.5 and 1.0 μm, the movable oil saturation first increases and then decreases with the permeability and pore development degree. When the permeability is greater than 0.3 mD and the intergranular and dissolution pores are relatively developed, the movable oil saturation tends to be opposite, with the development degree of pores due to the small throat radius. When the pore-throat radius is greater than 1.0 μm, the combination types of intergranular and dissolution pores develop, and the permeability boundary is 0.3 mD, but the movable oil changes little with the permeability and the degree of pore development. The above analysis shows that the change trend of movable oil is the largest in the range of pore-throat radius of 0.1–0.5 μm; however, when the permeability is larger and the intergranular pores are developed, the movable oil saturation shows a decreasing trend and fluctuates greatly (Zhang et al., 2006; Zhao et al., 2017; Zhong, 2017).
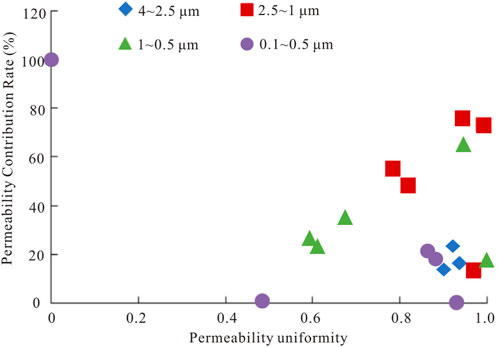
FIGURE 10. Relationship between pore-throat heterogeneity at different scales and movable fluid saturation.
The relationship between pore-throat uniformity and movable fluid saturation at different scales is shown in Figure 11. It can be seen from Figure 11 that there is a good exponential relationship between the pore-throat heterogeneity of different scales and the movable fluid saturation in the macro-pore-fine-throat, macro-pore-micro-/fine-throat, and macro-pore-micro-throat reservoirs. In the pore-throat range of 0.1–0.5 μm, 0.5–1.0 μm, and greater than 1.0 μm, the greater the uniformity of the pore throat, the greater the saturation of the movable fluids. Intergranular and dissolution pores are mainly developed in the pore-throat interval larger than 1.0 μm, and the relationship between pore-throat uniformity and movable fluid saturation is the best, followed by the 0.1–0.5 μm pore-throat interval. This is mainly because only a small amount of intergranular and dissolution pores are retained in this pore-throat interval, and intercrystalline and micro-pores are mainly developed (Zou et al., 2012; Zhu et al., 2013). In the pore-throat range of 0.5–1.0 μm, the relationship between the pore-throat uniformity and the movable fluid saturation is the worst. This is mainly due to the development of intergranular and dissolution pores, as well as intercrystalline pores and micro-pores.
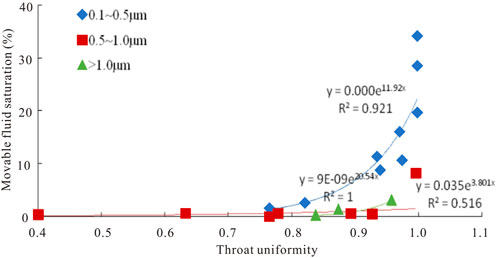
FIGURE 11. Relationship between throat heterogeneity at different scales and movable fluid saturation.
(1) The main types of pores developed in the target layer are intergranular pores, followed by feldspar dissolution pores. The radius distribution of the intergranular pores is between 5.0 and 210 μm, with an average value of 50.27 μm. In addition, the pore combination types with the best petrophysical properties are the intergranular pore type, the intergranular-dissolution pore type, and the dissolution-intergranular pore type; their average permeability is 0.62 mD, 0.40 mD, 0.44 mD, and their average porosity is 12.0, 12.3, 12.3%, respectively.
(2) The target sandstones contain four typical T2 relaxation time types. The large-pore-fine-throat combination reservoir has the best petrophysical properties. The larger the pore-throat uniformity value, the more uniform the pore-throat radius, and the greater the reservoir permeability. Therefore, the uniformity of throat development controls the seepage capacity of the tight reservoirs.
(3) The movable fluid saturation of different pore types has obvious differences. The movable fluid saturations at the 0.1 and 0.5 μm pore diameters of the macro-pore-fine-throat and macro-pore-micro-throat reservoirs both show an obvious inflection point, and the movable water saturation is higher with a larger throat radius.
The original contributions presented in the study are included in the article/Supplementary Material; further inquiries can be directed to the corresponding author.
The first author (QG) is responsible for the technical idea and the remaining authors (MD, HM, and JJ) are responsible for the experimental part of this study.
This research was supported by the Opening Foundation of State Key Laboratory of Continental Dynamics, Northwest University, “Quantitative characterization and evaluation of micro nano pore structure of tight reservoir based on multifractal theory (No. 21LCD05)” and Doctoral Research Fund of Lanzhou City University, “Study on micro pore structure and seepage mechanism of unconventional tight reservoir in Ordos Basin (No. LZCU-BS2021-01).”
MD was employed by the Fuxian Oil Production Plant, Yanchang Petroleum (Group).Ltd., HM was employed by the Oil Production Plant, Changqing Oilfield Company, and JJ was employed by the Oil Production Plant, Changqing Oilfield Company.
The remaining authors declare that the research was conducted in the absence of any commercial or financial relationships that could be construed as a potential conflict of interest.
All claims expressed in this article are solely those of the authors and do not necessarily represent those of their affiliated organizations, or those of the publisher, the editors and the reviewers. Any product that may be evaluated in this article, or claim that may be made by its manufacturer, is not guaranteed or endorsed by the publisher.
Anovitz, L. M., and Cole, D. R. (2015). 4. Characterization and Analysis of Porosity and Pore Structures. Rev. Mineral. Geochem. 80 (1), 61–164. doi:10.1515/9781501502071-004
Anovitz, L. M., Cole, D. R., Rother, G., Allard, L. F., Jackson, A. J., and Littrell, K. C. (2013). Diagenetic Changes in Macro- to Nano-Scale Porosity in the St. Peter Sandstone: an (Ultra) Small Angle Neutron Scattering and Backscattered Electron Imaging Analysis. Geochimica Cosmochimica Acta 102, 280–305. doi:10.1016/j.gca.2012.07.035
Bukar, M., Worden, R. H., Bukar, S., and Shell, P. (2021). Diagenesis and its Controls on Reservoir Quality of the Tambar Oil Field, Norwegian North Sea. Energy Geosci. 2 (1), 10–31. doi:10.1016/j.engeos.2020.07.002
Cai, M. F. (2020). Key Theories and Technologies for Surrounding Rock Stability and Ground Control in Deep Mining. J. Min. Strata Control. Eng. 2 (3), 033037. doi:10.13532/j.jmsce.cn10-1638/td.20200506.001
Cao, L., Yao, Y., Cui, C., and Sun, Q. (2020). Characteristics of In-Situ Stress and its Controls on Coalbed Methane Development in the Southeastern Qinshui Basin, North China. Energy Geosci. 1 (1–2), 69–80. doi:10.1016/j.engeos.2020.05.003
Chen, D., Pang, X., Xiong, L., Wang, L., and Xie, M. (2014). Porosity Evolution in Tight Gas Sands of the Upper Triassic Xujiahe Formation, Western Sichuan Basin, China. Rev. Mex. Ciencias Geol. 31, 361–375.
Desbois, G., Urai, J. L., Kukla, P. A., Konstanty, J., and Baerle, C. (2011). High-resolution 3D Fabric and Porosity Model in a Tight Gas Sandstone Reservoir: A New Approach to Investigate Microstructures from Mm- to Nm-Scale Combining Argon Beam Cross-Sectioning and SEM Imaging. J. Petroleum Sci. Eng. 78, 243–257. doi:10.1016/j.petrol.2011.06.004
Ghanizadeh, A., Clarkson, C. R., Aquino, S., Ardakani, O. H., and Sanei, H. (2015). Petrophysical and Geomechanical Characteristics of Canadian Tight Oil and Liquid-Rich Gas Reservoirs: I. Pore Network and Permeability Characterization. Fuel 153, 664–681. doi:10.1016/j.fuel.2015.03.020
Gier, S., Worden, R. H., Johns, W. D., and Kurzweil, H. (2008). Diagenesis and Reservoir Quality of Miocene Sandstones in the Vienna Basin, Austria. Mar. Petroleum Geol. 25 (8), 681–695. doi:10.1016/j.marpetgeo.2008.06.001
Hong, D., Cao, J., Wu, T., Dang, S., Hu, W., and Yao, S. (2020). Authigenic Clay Minerals an Calcite Dissolution Influence Reservoir Quality in Tight Sandstones: Insights from the Central Junggar Basin, NW China. Energy Geosci. 1 (1–2), 8–19. doi:10.1016/j.engeos.2020.03.001
Hower, J. C., and Groppo, J. G. (2021). Rare Earth-Bearing Particles in Fly Ash Carbons: Examples from the Combustion of Eastern Kentucky Coals. Energy Geosci. 2 (2), 90–98. doi:10.1016/j.engeos.2020.09.003
Huang, F. R., Yan, S. X., Wang, X. L., Jiang, P. C., and Zhan, S. B. (2021). Experimental Study on Infrared Radiation Characteristics of Gneiss under Uniaxial Compression. J. Min. Strata Control. Eng. 3 (1), 013011. doi:10.13532/j.jmsce.cn10-1638/td.20200730.001
Jiang, T., Zhang, J., and Wu, H. (2017). Effects of Fractures on the Well Production in a Coalbed Methane Reservoir. Arab. J. Geosci. 10 (22), 494. doi:10.1007/s12517-017-3283-7
Kang, H. P. (2021). Temporal Scale Analysis on Coal Mining and Strata Control Technologies. J. Min. Strata Control. Eng. 3 (1), 013538. doi:10.13532/j.jmsce.cn10-1638/td.20200814.001
Kwak, D., Han, S., Han, J., Wang, J., Lee, J., and Lee, Y. (2018). An Experimental Study on the Pore Characteristics Alteration of Carbonate during Waterflooding. J. Petroleum Sci. Eng. 161, 349–358. doi:10.1016/j.petrol.2017.11.051
Lai, J., and Wang, G. (2015). Fractal Analysis of Tight Gas Sandstones Using High-Pressure Mercury Intrusion Techniques. J. Nat. Gas Sci. Eng. 24, 185–196. doi:10.1016/j.jngse.2015.03.027
Lai, J., Wang, G., Wang, S., Cao, J., Li, M., Pang, X., et al. (2018b). Review of Diagenetic Facies in Tight Sandstones: Diagenesis, Diagenetic Minerals, and Prediction via Well Logs. Earth-Science Rev. 185, 234–258. doi:10.1016/j.earscirev.2018.06.009
Lai, J., Wang, G., Wang, Z., Chen, J., Pang, X., Wang, S., et al. (2018a). A Review on Pore Structure Characterization in Tight Sandstones. Earth-Science Rev. 177, 436–457. doi:10.1016/j.earscirev.2017.12.003
Lan, S. R., Song, D. Z., Li, Z. L., and Liu, Y. (2021). Experimental Study on Acoustic Emission Characteristics of Fault Slip Process Based on Damage Factor. J. Min. Strata Control Eng. 3 (3), 023038. doi:10.13532/j.jmsce.cn10-1638/td.20210510.002
Lei, T., Bikash, K. S., and Michael, S. (2012). Estimation of Horizontal Stress Magnitudes and Stress Coefficients of Velocities Using Borehole Sonic Data. Geophysics 77 (3), 181–196. doi:10.1190/geo2011-0277.1
Li, G., Qin, Y., Shen, J., Wu, M., Li, C., Wei, K., et al. (2019). Geochemical Characteristics of Tight Sandstone Gas and Hydrocarbon Charging History of Linxing Area in Ordos Basin, China. J. Petroleum Sci. Eng. 177, 198–207. doi:10.1016/j.petrol.2019.02.023
Li, H., and Zhang, J. (2011). Elastic Moduli of Dry Rocks Containing Spheroidal Pores Based on Differential Effective Medium Theory. J. Appl. Geophys. 75, 671–678. doi:10.1016/j.jappgeo.2011.09.012
Li, Z., Wu, S., Xia, D., Zhang, X., and Huang, M. (2017). Diagenetic Alterations and Reservoir Heterogeneity within the Depositional Facies: a Case Study from Distributary-Channel Belt Sandstone of Upper Triassic Yanchang Formation Reservoirs (Ordos Basin, China). Mar. Petroleum Geol. 86, 950–971. doi:10.1016/j.marpetgeo.2017.07.002
Liu, J., Zhang, G., Bai, J., Ding, W., Yang, H., and Liu, Y. (2022). Quantitative Prediction of the Drilling Azimuth of Horizontal Wells in Fractured Tight Sandstone Based on Reservoir Geomechanics in the Ordos Basin, Central China. Mar. Petroleum Geol. 136, 105439. doi:10.1016/j.marpetgeo.2021.105439
Liu Y, Y., Chen, L., Tang, Y., Zhang, X., and Qiu, Z. (2022). Synthesis and Characterization of Nano-SiO2@octadecylbisimidazoline Quaternary Ammonium Salt Used as Acidizing Corrosion Inhibitor. Rev. Adv. Mater. Sci. 61 (1), 186–194. doi:10.1515/rams-2022-0006
Liu, Y., Gao, M., and Zhao, H. (2020). Detection of Overlying Rock Structure and Identification of Key Stratum by Drilling and Logging Technology. J. Min. Strata Control Eng. 2 (2), 81–89. doi:10.13532/j.jmsce.cn10-1638/td.2020.02.004
Luo, Y., Huang, H., Jakobsen, M., Yang, Y., Zhang, J., and Cai, Y. (2019). Prediction of Porosity and Gas Saturation for Deep-Buried Sandstone Reservoirs from Seismic Data Using an Improved Rock-Physics Model. Acta Geophys. 67, 557–575. doi:10.1007/s11600-019-00274-6
Luo, Y., Huang, H., Yang, Y., Hao, Y., Zhang, S., and Li, Q. (2018). Integrated Prediction of Deepwater Gas Reservoirs Using Bayesian Seismic Inversion and Fluid Mobility Attribute in the South China Sea. J. Nat. Gas Sci. Eng. 59, 56–66. doi:10.1016/j.jngse.2018.08.019
Mahmud, H. B., Bin Muhammad Hisham, M. H., Mahmud, W. M., Leong, V. H., and Shafiq, M. U. (2020). Petrophysical Interpretations of Subsurface Stratigraphic Correlations, Baram Delta, Sarawak, Malaysia. Energy Geosci. 1 (3–4), 100–114. doi:10.1016/j.engeos.2020.04.005
Malatesta, C., Federico, L., Crispini, L., and Capponi, G. (2018). Fluid-controlled Deformation in Blueschist-Facies Conditions: Plastic vs Brittle Behaviour in a Brecciated Mylonite (Voltri Massif, Western Alps, Italy). Geol. Mag. 155 (2), 335–355. doi:10.1017/s0016756816001163
Meng, Q., Hooker, J., and Cartwright, J. (2017). Lithological Control on Fracture Cementation in the Keuper Marl (Triassic), North Somerset, UK. Geol. Mag. 154, 1–15. doi:10.1017/s001675681700070x
Mirzaei-Paiaman, A., and Ghanbarian, B. (2021). A New Methodology for Grouping and Averaging Capillary Pressure Curves for Reservoir Models. Energy Geosci. 2 (1), 52–62. doi:10.1016/j.engeos.2020.09.001
Pang, Y.-M., Guo, X.-W., Han, Z.-Z., Zhang, X.-H., Zhu, X.-Q., Hou, F.-H., et al. (2019). Mesozoic-Cenozoic Denudation and Thermal History in the Central Uplift of the South Yellow Sea Basin and the Implications for Hydrocarbon Systems: Constraints from the CSDP-2 Borehole. Mar. Petroleum Geol. 99, 355–369. doi:10.1016/j.marpetgeo.2018.10.027
Qiao, J., Zeng, J., Jiang, S., and Wang, Y. (2020). Impacts of Sedimentology and Diagenesis on Pore Structure and Reservoir Quality in Tight Oil Sandstone Reservoirs: Implications for Macroscopic and Microscopic Heterogeneities. Mar. Petroleum Geol. 111, 279–300. doi:10.1016/j.marpetgeo.2019.08.008
Qie, L., Shi, Y. N., and Liu, J. S. (2021). Experimental Study on Grouting Diffusion of Gangue Solid Filling Bulk Materials. J. Min. Strata Control Eng. 3 (2), 023011. doi:10.13532/j.jmsce.cn10-1638/td.20201111.001
Ren, D., Zhou, D., Liu, D., Dong, F., Ma, S., and Huang, H. (2019). Formation Mechanism of the Upper Triassic Yanchang Formation Tight Sandstone Reservoir in Ordos Basin-Take Chang 6 Reservoir in Jiyuan Oil Field as an Example. J. Petroleum Sci. Eng. 178, 497–505. doi:10.1016/j.petrol.2019.03.021
Rezaee, R., Saeedi, A., and Clennell, B. (2012). Tight Gas Sands Permeability Estimation from Mercury Injection Capillary Pressure and Nuclear Magnetic Resonance Data. J. Petroleum Sci. Eng. 88-89, 92–99. doi:10.1016/j.petrol.2011.12.014
Saein, A., and Riahi, Z. (2017). Controls on Fracture Distribution in Cretaceous Sedimentary Rocks from the Isfahan Region, Iran. Geol. Mag. 154, 1–13. doi:10.1017/s0016756817000346
Santosh, M., and Feng, Z. Q. (2020). New Horizons in Energy Geoscience. Energy Geosci. 1 (1–2), A1. doi:10.1016/j.engeos.2020.05.005
Sebacher, B., Hanea, R., and Stordal, A. S. (2017). An Adaptive Pluri-Gaussian Simulation Model for Geological Uncertainty Quantification. J. Petroleum Sci. Eng. 158, 494–508. doi:10.1016/j.petrol.2017.08.038
Shanley, K. W., and Cluff, R. M. (2015). The Evolution of Pore-Scale Fluid-Saturation in Low-Permeability Sandstone Reservoirs. Bulletin 99, 1957–1990. doi:10.1306/03041411168
Shi, B., Chang, X., Yin, W., Li, Y., and Mao, L. (2019). Quantitative Evaluation Model for Tight Sandstone Reservoirs Based on Statistical Methods - A Case Study of the Triassic Chang 8 Tight Sandstones, Zhenjing Area, Ordos Basin, China. J. Petroleum Sci. Eng. 173, 601–616. doi:10.1016/j.petrol.2018.10.035
Sun, W., Li, Y. F., Fu, J. W., and Li, T. Y. (2014). Review of Fracture Identification with Well Logs and Seismic Data. Prog. Geophys. 29 (3), 1231–1242. doi:10.6038/pg20140332
Wang, A., Zhong, D., Zhu, H., Guo, L., Li, Z., Jiang, Y., et al. (2018a). Depositional and Diagenetic Controls on the Reservoir Quality of Upper Triassic Chang-7 Tight Oil Sandstones, Southwestern Ordos Basin, China. Geosci. J. 23 (3), 471–488. doi:10.1007/s12303-018-0042-z
Wang, D. L., Hao, B. Y., and Liang, X. M. (2021). Slurry Diffusion of Singlefracture Based on Fluid-Solid Coupling. J. Min. Strata Control. Eng. 3 (1), 013038. doi:10.13532/j.jmsce.cn10-1638/td.20200429.001
Wang, L., Zhao, N., Sima, L., Meng, F., and Guo, Y. (2018b). Pore Structure Characterization of the Tight Reservoir: Systematic Integration of Mercury Injection and Nuclear Magnetic Resonance. Energy fuels. 32 (7), 7471–7484. doi:10.1021/acs.energyfuels.8b01369
Xi, K., Cao, Y., Haile, B. G., Zhu, R., Jahren, J., Bjørlykke, K., et al. (2016). How Does the Pore-Throat Size Control the Reservoir Quality and Oiliness of Tight Sandstones? the Case of the Lower Cretaceous Quantou Formation in the Southern Songliao Basin, China. Mar. Petroleum Geol. 76, 1–15. doi:10.1016/j.marpetgeo.2016.05.001
Xue, F., Liu, X. X., and Wang, T. Z. (2021). Research on Anchoring Effect of Jointed Rock Mass Based on 3D Printing and Digital Speckle Technology. J. Min. Strata Control Eng. 3 (2), 023013. doi:10.13532/j.jmsce.cn10-1638/td.20201020.001
Yang, J. X., Luo, M. K., Zhang, X. W., Huang, N., and Hou, S. J. (2021). Mechanical Properties and Fatigue Damage Evolution of Granite under Cyclic Loading and Unloading Conditions. J. Min. Strata Control Eng. 3 (3), 033016. doi:10.13532/j.jmsce.cn10-1638/td.20210510.001
Yin, S., Lv, D., and Ding, W. (2018). New Method for Assessing Microfracture Stress Sensitivity in Tight Sandstone Reservoirs Based on Acoustic Experiments. Int. J. Geomechanics 18 (4), 1–11. doi:10.1061/(ASCE)GM.1943-5622.0001100
Yin, S., and Wu, Z. (2020). Geomechanical Simulation of Low-Order Fracture of Tight Sandstone. Mar. Petroleum Geol. 117, 1–10. doi:10.1016/j.marpetgeo.2020.104359
Yoshida, M., and Santosh, M. (2020). Energetics of the Solid Earth: An Integrated Perspective. Energy Geosci. 1 (1–2), 28–35. doi:10.1016/j.engeos.2020.04.001
Zhang, B., Shen, B., and Zhang, J. (2020). Experimental Study of Edge-Opened Cracks Propagation in Rock-like Materials. J. Min. Strata Control Eng. 2 (3), 033035. doi:10.13532/j.jmsce.cn10-1638/td.20200313.001
Zhang, J., Ju, Y., and Zhang, Q. (2019). Low Ecological Environment Damage Technology and Method in Coal Mines. J. Min. Strata Control Eng. 1 (1), 013515. doi:10.13532/j.jmsce.cn10-1638/td.2019.02.005
Zhang, T., Switzer, P., and Journel, A. (2006). Filter-Based Classification of Training Image Patterns for Spatial Simulation. Math. Geol. 38 (1), 63–80. doi:10.1007/s11004-005-9004-x
Zhao, H., Ning, Z., Wang, Q., Zhang, R., Zhao, T., Niu, T., et al. (2015). Petrophysical Characterization of Tight Oil Reservoirs Using Pressure-Controlled Porosimetry Combined with Rate-Controlled Porosimetry. Fuel 154, 233–242. doi:10.1016/j.fuel.2015.03.085
Zhao, J. L., Liu, J. J., Zhang, Q. H., and Qu, X. R. (2017). Overview of Geophysical Exploration Methods and Technical of Tight Sandstone Gas Reservoirs. Prog. Geophys. 32 (2), 840–848. doi:10.6038/pg20170253
Zhong, D. (2017). Micro-petrology, Pore Throat Characteristics and Genetic Mechanism of Tight Oil Reservoirs – A Case from the 6th and 7th Members of Triassic Yanchang Formation in the Ordos Basin. Oil Gas Geol. 38 (1), 49–61. doi:10.11743/ogg20170106
Zhou, N., Lu, S., Wang, M., Huang, W., Xiao, D., Jiao, C., et al. (2021). Limits and Grading Evaluation Criteria of Tight Oil Reservoirs in Typical Continental Basins of China. Petroleum Explor. Dev. 48 (5), 1089–1100. doi:10.1016/S1876-3804(21)60093-9
Zhu, R., Bai, B., Cui, J., Wang, T., Niu, L., and Li, T. (2013). Research Advances of Microstructure in Unconventional Tight Oil and Gas Reservoirs. J. Palaeogeogr. 15, 615–623.
Keywords: pore-throat heterogeneity, tight oil sandstone, fluid occurrence state, physical properties, permeability
Citation: Guo Q, Dong M, Mao H and Ju J (2022) Micro-Scale Pore-Throat Heterogeneity of Tight Oil Sandstone Reservoirs and Its Influence on Fluid Occurrence State. Front. Earth Sci. 10:959796. doi: 10.3389/feart.2022.959796
Received: 02 June 2022; Accepted: 15 June 2022;
Published: 08 August 2022.
Edited by:
Wenlong Ding, China University of Geosciences, ChinaReviewed by:
Xiaowei Lv, Chengdu University of Technology, ChinaCopyright © 2022 Guo, Dong, Mao and Ju. This is an open-access article distributed under the terms of the Creative Commons Attribution License (CC BY). The use, distribution or reproduction in other forums is permitted, provided the original author(s) and the copyright owner(s) are credited and that the original publication in this journal is cited, in accordance with accepted academic practice. No use, distribution or reproduction is permitted which does not comply with these terms.
*Correspondence: Qing Guo, cWluZ2d1bzEzM0AxMjYuY29t
Disclaimer: All claims expressed in this article are solely those of the authors and do not necessarily represent those of their affiliated organizations, or those of the publisher, the editors and the reviewers. Any product that may be evaluated in this article or claim that may be made by its manufacturer is not guaranteed or endorsed by the publisher.
Research integrity at Frontiers
Learn more about the work of our research integrity team to safeguard the quality of each article we publish.