 Rong Fang1
 Shumin Chen
 Mingsen Zhou
 Yilun Chen
- 1School of Atmospheric Sciences, Sun Yat-sen University, and Southern Marine Science and Engineering Guangdong Laboratory (Zhuhai), Zhuhai, China
- 2Guangzhou Institute of Tropical and Marine Meteorology, China Meteorological Administration (CMA), Guangzhou, China
Forecasting typhoon features over a few upcoming months is necessary for planning disaster prevention and predicting the drought/flood situation. However, the current methods are more suitable for forecasting the interannual to interdecadal variation trends or demanding huge computing resources and are unsuitable for the operation of short-term climate forecasts. In order to devise other effective approaches, the correlation between the Oceanic Niño Index (ONI) in January and the frequency of severe typhoons (STYs) during 1959–2018 was analyzed for the two scenarios when the ONI trend during the previous year was higher and lower than zero. The reason for this classification is that the air‒sea conditions were different when the oceanic phenomena developed toward an El Niño or La Niña phase during the previous year, and the results of these trends affect the subsequent features of atmospheric dynamic factors favorable for TC development (relative vorticity and vertical velocity). The extreme anomalies under both the increasing and decreasing tendencies of ONI in January typically retrained the growth of STYs, as the subsequent decreasing ocean heat anomaly of the previous year was accompanied by a negative vorticity anomaly and downward vertical velocity anomaly in the lower atmosphere and vice versa. Results from the forecast test show that the accuracy of the new approach was acceptable and somewhat higher than that of the current methods. Thus, these results can assist in developing a practical approach for typhoon forecasts.
1 Introduction
In addition to the conventional forecast for the track and intensity of an active typhoon, short-term climate forecasts for typhoon frequency, intensity, and other parameters in the upcoming months are also necessary. The demand for this short-term climate forecasting is more pressing in the Western North Pacific (WNP), where >30% of global typhoons occur (Landsea, 2000). The short-term climate forecast for typhoons assists in planning disaster prevention and mitigation in advance while predicting the drought and flood situation during the next few months because typhoon precipitation accounts for 45% of the local annual rainfall in some places (Jiang and Zipser, 2010). However, the current accuracy of this short-term climate forecast still needs improvement. Supplementary Table S1 lists the number of tropical cyclones (TCs) forecasted by the China Meteorological Administration during the last few years, and only the TC number in 2021 was correctly forecasted. The reason is that many of the current methods are generally unsuitable for the operational use of this short-term climate forecast because they are more suitable for forecasting interannual to interdecadal variation trends or demand huge computing resources.
Although the current climate models cannot distinguish the detailed structure of typhoons (i.e., the eye, eyewall, and outer rainband), other methods can assist in estimating the evolution of future typhoons based on forecast data from climate models. There are three main types of estimation methods. The first type involves the calculation of a certain index based on the air‒sea variables in the climate modes, that is, the genesis potential index (Walsh et al., 2013) and power dissipation index (Villarini and Vecchi, 2017). However, these indexes do not yield specific information such as typhoon frequency and intensity and can only serve as a reference for interannual to interdecadal evolution trends. The second type consists of forecasting typhoons by downscaling climate models (Emanuel, 2021). However, this method type is unsuitable for operational forecast because it demands huge computing resources as it needs to integrate multiple climate models. The gap between the results from different climate models is large and somewhat unacceptable, which was solved by the third type, that is, to identify the TC frequency through some criteria using a state-of-the-art climate model (Takaya et al., 2021). However, this type still demands huge computing resources. Thus, alternative methods need to be developed for short-term climate forecasts for typhoons.
One of the effective approaches is to forecast typhoon activity in the future period through objective statistical judgment according to actual air‒sea signals, which require negligible computing resources. One of the useful signals may be the El Niño/Southern Oscillation (ENSO), which significantly influences typhoon activity in the WNP (Chan, 2000; Chang et al., 2019; Zhao et al., 2020). ENSO directly controls the heat distribution in the underlying surface (Jin et al., 2014; Guo and Tan, 2018) and adjusts the atmospheric conditions (Chand et al., 2017; Zhao and Wang, 2019; Song et al., 2021), such as relative humidity, vorticity, vertical shear, and low-level convergence (Zhang et al., 2015; Choi et al., 2019; Song et al., 2019; Feng et al., 2020). During El Niño, sea surface temperatures (SST) in the equatorial Eastern Pacific are abnormally warm. Moreover, air‒sea coupling effects move the subtropical high southward and weaken the convective activity in the Western Pacific, causing the equatorial convergence zone to be inactive, which are all detrimental to typhoon activity (He et al., 1999; Xiao et al., 2010). Thus, ENSO is the main source of short-term climate typhoon activity forecasts (Patricola et al., 2018).
Nonetheless, typhoon activity cannot be forecasted directly by ENSO intensity. In fact, during 1961–2019, the overall direct correlation between the typhoon frequency in the WNP and the SST anomaly during the typhoon season was only −0.14 (Song et al., 2022). The reason lies in the diverse effects of ENSO on typhoons (Shi et al., 2019; Guo and Tan, 2021). Super El Niño events tend to have shorter durations, and as they decay, ocean heat flows westward, shifting typhoon activity westward (Guo and Tan, 2018). Thus, as maximum SST anomalies migrate from west to east across the tropical Pacific, the frequency of typhoons in the WNP decreases (Song et al., 2020). In addition, stronger positive SST anomalies in the East Indian Ocean and the Western Pacific due to La Niña events that resulted from an El Niño during the previous year limit typhoon genesis relative to La Niña events that developed from neutral years or weak La Niña events; this results from weakened summer monsoons (Ha and Zhong, 2013). Thus, one cannot determine the typhoon frequency solely according to the Oceanic Niño Index (ONI) value because typhoon frequency is affected by the combination of both the oceanic heat content controlled by ENSO and atmospheric dynamic factors.
In fact, the air‒sea conditions were different when the oceanic phenomena developed toward El Niño or La Niña phases during the previous year, defined as El Niño-like and La Niña-like categories and detailed in Section 2. In addition, the results of these trends very likely affect the subsequent features of atmospheric dynamic factors favorable for TC development (relative vorticity and vertical velocity). Thus, in this study, we analyzed SST anomalies and low-level atmospheric circulation to evaluate their influence on typhoon activity by dividing the 60 years during 1959–2018 into two categories based on the oceanic phenomena which developed toward an El Niño or La Niña phase (i.e., the ONI trend during the last year period). This approach intuitively showed different tendencies of typhoon frequency recorded in the best-track database of the China Meteorological Administration under the different evolutionary trends of the SST anomaly in the previous year.
2 Methods
2.1 Correlation analysis for ENSO and typhoons
The 60-year period during 1958–2018 was firstly divided into two categories, El Niño-like and La Niña-like, based on whether the ONI trend during the previous year was higher or lower than zero. Here, the ONI is the running 3-month mean SST anomaly for the Niño 3.4 region (i.e., 5°N–5°S, 120°W–170°W), which is the de facto standard that the National Oceanic and Atmospheric Administration implements for identifying El Niño and La Niña events in the tropical Pacific (Sohn et al., 2016). When the difference between the ONI value in the current January and that in the last February was >0, it was considered an El Niño developing trend and, thus, classified as El Niño-like; when the difference between the ONI value in the current January and that in the last February was <0, it was considered a La Niña developing trend and, thus, classified as La Niña-like. Secondly, as the wintertime peak of El Niño often occurs in January (Boucharel et al., 2016), the correlation coefficients between ONI in January and the numbers of typhoons were calculated, respectively, for these two categories. Furthermore, the El Niño-like and La Niña-like were further sub-classified based on the ONI value in January of the current year. We classified ONI < 0, 0 ≤ ONI < 1, and ONI ≥ 1 in the El Niño-like category as “EN-weak,” “EN-moderate,” and “EN-strong,” respectively, and ONI ≥ 0, −1 < ONI < 0, and ONI ≤ −1 in the La Niña-like category as “LN-weak,” “LN-moderate,” and “LN-strong,” respectively. Here, EN-weak means that the ONI value was very small (<0) and the La Niña feature remained significant, although the oceanic phenomena had a tendency to develop into El Niño. The situation of ONI > 0 as LN-weak was similar. The features of SST spatial patterns of these categories are shown in Supplementary Figures S2, S3.
2.2 Analysis of typhoon characteristics
2.2.1 Definition of different typhoon categories
In this study, typhoons were divided into distinct categories based on their intensities, that is, the maxima wind speed near the typhoon center, according to the best-track database from the Shanghai Typhoon Institute of the China Meteorological Administration. Herein, a tropical storm was defined by a maximum wind speed exceeding 17.2 m/s, a typhoon was defined by a maximum wind speed >32.7 m/s, and a STY was defined by a wind speed >41.5 m/s.
2.2.2 Mean path of STYs
The mean paths consisted of a series of points with a fixed latitude difference of 0.5°. The longitude of the point at a certain latitude of STYs during each category was estimated by averaging the longitudes of positions of all the STYs whose latitude was within a certain fixed latitude area (±0.25°N). Meanwhile, the certain latitude with less than 3 STYs points was set to empty so that the mean path was somewhat more representative.
2.2.3 Analysis period for large-scale variables
For analysis in the atmosphere, because circulation is highly seasonal, we selected the period with the most evident differences in typhoon frequency for synthetic analysis (Supplementary Figure S4), which is June‒December. Herein, large-scale variables were obtained from the European Centre for Medium-Range Weather Forecasts.
3 Results
3.1 ENSO peaks and STYs
El Niño or La Niña maxima in January typically restrained the growth of severe typhoons (STYs) (maxima winds >41.5 m/s), whereas their minima promoted the subsequent STYs. The ONI in January was highly correlated to the number of STYs in the WNP during that year when dividing the ONI events into the El Niño-like (positive ONI trend in the previous year) and La Niña-like (negative ONI trend in the previous year) categories (Figure 1). For the 34 years of the El Niño-like category, the correlation coefficient was −0.355 (Figure 1A), and for the 26 years of the La Niña-like category, it was 0.549 (Figure 1B). Both correlations satisfied the 95% confidence level. In comparison, the correlation between them was not evident without this classification method. Additionally, correlations between the numbers of tropical storms (maxima winds >17.2 m/s) and typhoons (maxima winds >32.7 m/s) and the ONI in January were similar; however, these values were not as high as those of the STYs (Supplementary Figure S1).
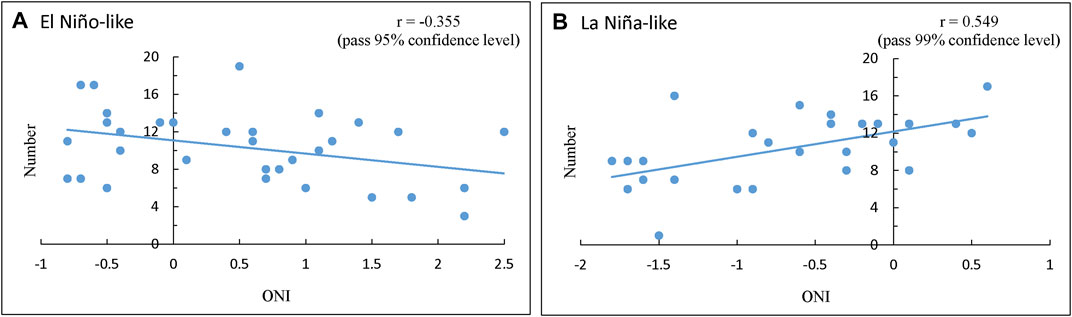
FIGURE 1. ONI in January and the number of STYs in the entire year. Solid lines represent the linear regression of the scatter. (A) El Niño-like years. (B) La Niña-like years.
3.2 Air‒sea conditions
The El Niño-like category was further classified into “EN-weak,” “EN-moderate,” and “EN-strong” classes; likewise, the La Niña-like category was classified into “LN-weak,” “LN-moderate,” and “LN-strong” classes, based on the ONI during January (detailed in Methods and Supplementary Table S2). Figure 2 shows that, during the EN-weak and LN-weak years, the SST anomalies from the previous years were relatively weak in January. Moreover, in the remainder of these years, the ONI trends continued and the SST anomaly increased. These classes were most conducive to STY activity, averaging 12 STYs per year. In contrast, in the EN-strong and LN-strong years, the SST anomaly maxima in January restrained subsequent STY activity, which averaged 8 STYs per year. Supplementary Figures S2, S3 show the specific SST trend distributions in detail. Through comparative analysis of different classes of SST anomalies, Supplementary Figures S5A, S5B show that the classes favorable to STY activity had lower SST in the WNP. This was consistent with the positive mean ONI in the tropical Pacific during EN-weak and LN-weak years (Figure 2), indicating that STY activity was not directly related to the ONI. Features of the upper 80 m averaged oceanic potential temperature (Supplementary Figures S5C, S5D), mid-level specific humidity, and the maximum potential intensity were also similar to those of SST (Supplementary Figure S6). It is worth noting that the relationships between the numbers of STYs and the mean genesis positions, the duration until intensification as STYs (Supplementary Figure S7), and the prevailing tracks (Supplementary Figure S8) in different categories were unclear because their features in El Niño-like and La Niña-like categories were not similar, and this warrants future analysis.
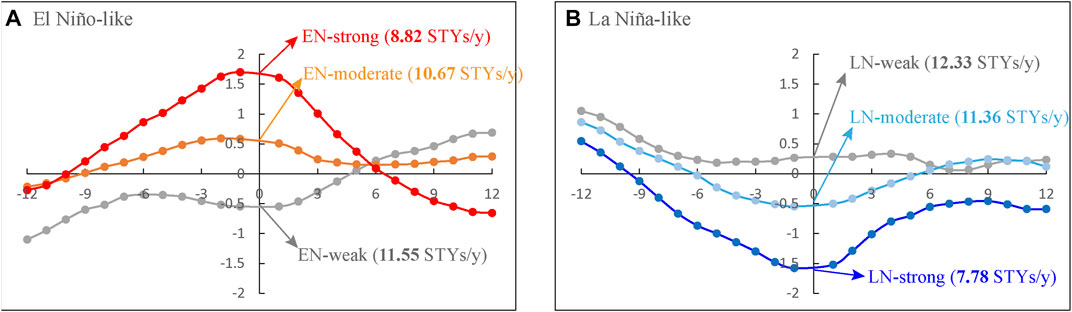
FIGURE 2. ONI curves for the previous and current years and the number of STYs corresponding to the current year. (A) Curves for the “EN-weak,” “EN-moderate,” and “EN-strong” divisions of the El Niño-like category. (B) Curves for the “LN-weak,” “LN-moderate,” and “LN-strong” divisions of the La Niña-like category.
As the genesis and development of typhoons are closely related to low-level disturbances (Ta-Huu and Sato, 2019), low-level vorticity is the most crucial factor affecting typhoon intensity (Wu et al., 2020). Figures 3, 4 show the differences in atmospheric disturbances between classes that were conducive and detrimental to STY activity during June‒September and October‒December, respectively. The paths of intensification stages of STYs corresponded to the positive relative vorticity anomaly region and the upward vertical velocity anomaly at the height of 850 hPa. Especially during October‒December in the La Niña-like category (Figures 4B,D), the narrowness and fineness of the relative vorticity anomaly and the extension of ascending disturbance matched well with the northwestern extension of the path of STY. Most regions along the mean paths pass the 90% confidence level. Combined with the negative difference in SST in the areas of the typhoon paths (Supplementary Figure S5), these positive low-level disturbances may have originated from a sinking anticyclone on the northeast and southwest sides of this area (Liu et al., 2019). In contrast, in the EN-strong and LN-strong classes, after the peak of El Niño or La Niña during the previous year, the subsequent SST backflow resulted in higher SST over the North Pacific and Southeast Asia relative to that in the Western Pacific and restrained STY activity.
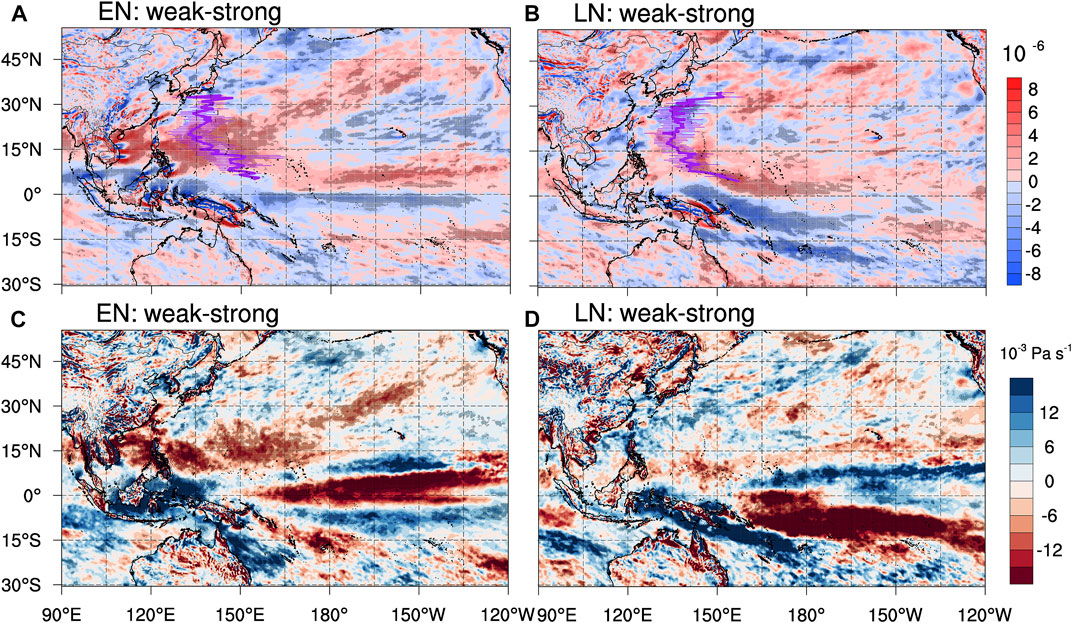
FIGURE 3. Circulation distributions, averaged during June‒September, at the height of 850 hPa. (A) Shading shows the environmental relative vorticity difference between the EN-weak class and the EN-strong class. The thick purple lines show the mean STY path during intensification for the two classes, and the thin purple lines show ± half the standard deviation. (C) The vertical velocity difference between the EN-weak class and the EN-strong class (the red hue shows ascending disturbance) (B,D) is the same as that in (A,C), respectively, but for the LN-weak and LN-strong classes, respectively. Dots indicate areas of >90% confidence level in Student’s t-test.
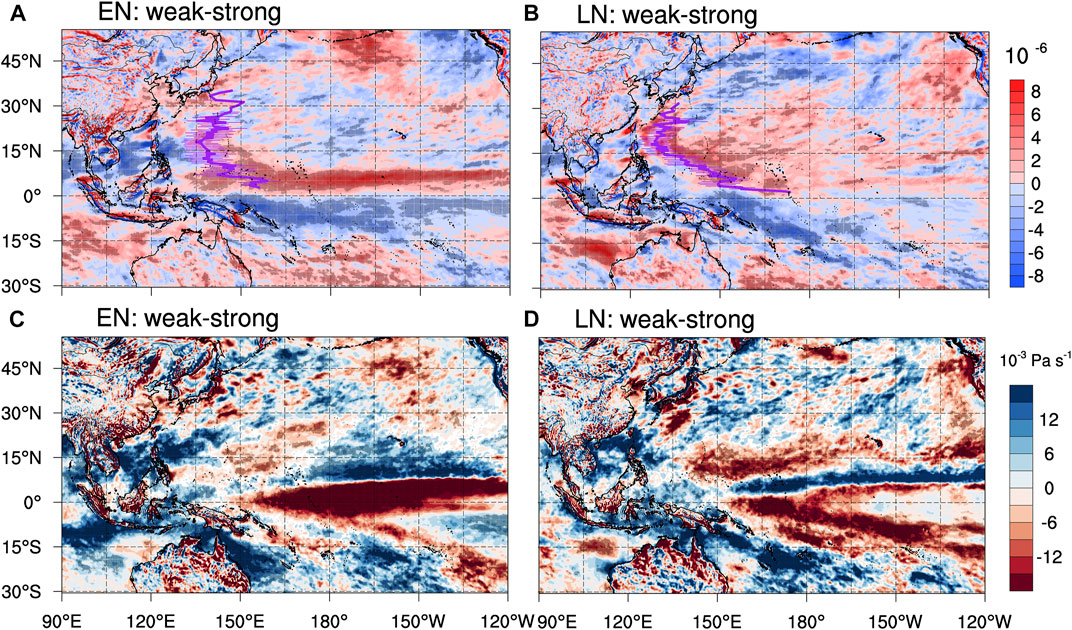
FIGURE 4. Circulation distributions, averaged during October‒December, at the height of 850 hPa. (A) Shading shows the environmental relative vorticity difference between the EN-weak class and the EN-strong class. The thick purple lines show the mean STY path during intensification for the two classes, and the thin purple lines show ± half of the standard deviation. (C) The vertical velocity difference between the EN-weak class and the EN-strong class (the red hue shows ascending disturbance) (B,D) is the same as that in (A,C), respectively, but for the LN-weak and LN-strong classes, respectively. Dots indicate areas of >90% confidence level in Student’s t-test.
4 Discussion: Forecasting annual STY frequency
After classifying according to the SST anomaly trends in the previous year, we attempted to forecast the annual range of STY frequency in the WNP directly using the ONI in January, with the minimum (
where
The forecast accuracy was acceptable and somewhat higher than the current forecast, with ∼50% and ∼70% for El Niño-like and La Niña-like categories, respectively. This represents valuable initial progress in developing a new effective approach to the short-term climate forecast for typhoons, although the forecast ranges of STY numbers were larger than those of the China Meteorological Administration (Supplementary Table S1). However, detailed analysis is also required for specific years. For instance, 2016 belongs to the EN-strong class. According to the regression equation, 8 STYs were predicted to have occurred that year; however, 12 STYs were recorded. Observations and numerical models showed that after strong El Niño events in 2015–2016, the tertiary distribution of SST in the Indian Ocean, the equatorial East Pacific, and the North Pacific enhanced convergence in the center of the WNP, resulting in large-scale ascending motion, notably increasing typhoon activity during the summer of 2016 (Wang et al., 2019).
Data availability statement
Publicly available datasets were analyzed in this study. This data can be found here: https://ggweather.com/enso/oni.htm http://tcdata.typhoon.org.cn/zjljsjj_zlhq.html http://apdrc.soest.hawaii.edu/datadoc/ecmwf_oras5_1x1.php https://cds.climate.copernicus.eu/cdsapp#!/dataset/reanalysis-era5-pressure-levels-monthly-means?tab=overview.
Author contributions
RF and MZ analyzed the data and drafted the article. SC designed the study and revised the article. WL finalized data acquisition and revised the article. AZ and YC revised the article.
Funding
This study was supported by the Guangdong Major Project of Basic and Applied Basic Research (Grant no. 2020B0301030004), Guangzhou Science and Technology Planning Project (Grant no. 201903010036), China Postdoctoral Science Foundation (Grant no. 2020M683021), and National Natural Science Foundation of China (Grants nos. 42075004, 41875021, and 41830533).
Acknowledgments
We cordially thank Editage for providing English language editorial assistance.
Conflict of interest
The authors declare that the research was conducted in the absence of any commercial or financial relationships that could be construed as a potential conflict of interest.
Publisher’s note
All claims expressed in this article are solely those of the authors and do not necessarily represent those of their affiliated organizations or those of the publisher, the editors, and the reviewers. Any product that may be evaluated in this article, or claim that may be made by its manufacturer, is not guaranteed or endorsed by the publisher.
Supplementary material
The Supplementary Material for this article can be found online at: https://www.frontiersin.org/articles/10.3389/feart.2022.957840/full#supplementary-material
References
Boucharel, J., Jin, F. F., Lin, I. I., Huang, H. C., and England, M. H. (2016). Different controls of tropical cyclone activity in the eastern pacific for two types of El Niño. Geophys. Res. Lett. 43 (4), 1679–1686. doi:10.1002/2016GL067728
Chan, J. C. L. (2000). Tropical cyclone activity over the western North pacific associated with El Niño and La Niña events. J. Clim. 13, 2960–2972. doi:10.1175/1520-0442(2000)013<2960:TCAOTW>2.0.CO;2
Chand, S. S., Tory, K. J., Hua, Y., and Walsh, K. J. E. (2017). Projected increase in El Nino-driven tropical cyclone frequency in the pacific. Nat. Clim. Chang. 7, 123–127. doi:10.1038/nclimate3181
Chang, Y. L. K., Miyazawa, Y., and Behera, S. (2019). Role of climate variability in the potential predictability of tropical cyclone formation in tropical and subtropical western North Pacific Ocean. Sci. Rep. 9, 19827. doi:10.1038/s41598-019-56243-y
Choi, Y. M., Ha, K.-J., and Jin, F.-F. (2019). Seasonality and El Niño diversity in the relationship between ENSO and Western North pacific tropical cyclone activity. J. Clim. 32, 8021–8045. doi:10.1175/JCLI-D-18-0736.1
Emanuel, K. (2021). Response of global tropical cyclone activity to increasing CO2: Results from downscaling CMIP6 models. J. Clim. 34, 57–70. doi:10.1175/JCLI-D-20-0367.1
Feng, X., Klingaman, N. P., Hodges, K. I., and Guo, Y.-P. (2020). Western North pacific tropical cyclones in the met office global seasonal forecast system: Performance and ENSO teleconnections. J. Clim. 33, 10489–10504. doi:10.1175/JCLI-D-20-0255.1
Guo, Y. P., and Tan, Z. M. (2021). Influence of different ENSO types on tropical cyclone rapid intensification over the Western North Pacific. JGR. Atmos. 126, 1–16. doi:10.1029/2020JD033059
Guo, Y. P., and Tan, Z. M. (2018). Westward migration of tropical cyclone rapid-intensification over the Northwestern Pacific during short duration El Niño. Nat. Commun. 9, 1507. doi:10.1038/s41467-018-03945-y
Ha, Y., and Zhong, Z. (2013). Contrast of tropical cyclone frequency in the western North Pacific between two types of La Nina events. Sci. China Earth Sci. 56, 397–407. doi:10.1007/s11430-012-4475-3
He, M., Song, W. L., and Chen, X. F. (1999). Typhoon activity in the northwest pacific in relation with El Niño and La Niña events. J. Trop. Meteorol. 5, 153–162.
Jiang, H., and Zipser, E. J. (2010). Contribution of tropical cyclones to the global precipitation from eight seasons of TRMM data: Regional, seasonal, and interannual variations. J. Clim. 23, 1526–1543. doi:10.1175/2009JCLI3303.1
Jin, F.-F., Boucharel, J., and Lin, I.-I. (2014). Eastern Pacific tropical cyclones intensified by El Niño delivery of subsurface ocean heat. Nature 516, 82–85. doi:10.1038/nature13958
Landsea, C. W. (2000). in Climate variability of tropical cyclones: Past, present and future Storms. Editors R. A. Pielke, and R. A. Pielke (New York: Routledge), 1, 220–241.
Liu, Y., Huang, P., and Chen, G. (2019). Impacts of the combined modes of the tropical Indo Pacific sea surface temperature anomalies on the tropical cyclone genesis over the western North Pacific. Int. J. Climatol. 39, 2108–2119. doi:10.1002/joc.5938
Patricola, C. M., Camargo, S. J., Klotzbach, P. J., Saravanan, R., and Chang, P. (2018). The influence of ENSO flavors on Western North Pacific tropical cyclone activity. J. Clim. 31, 5395–5416. doi:10.1175/JCLI-D-17-0678.1
Shi, D., Ge, X., Peng, M., and Li, T. (2019). Characterization of tropical cyclone rapid intensification under two types of El Niño events in the Western North Pacific. Int. J. Climatol. 40, 2359–2372. doi:10.1002/joc.6338
Sohn, S. J., Tam, C. Y., and Jeong, H. I. (2016). How do the strength and type of ENSO affect SST predictability in coupled models. Sci. Rep. 6, 33790. doi:10.1038/srep33790
Song, J. J., Klotzbach, P. J., and Duan, Y. H. (2020). Differences in Western North Pacific tropical cyclone activity among three El Niño phases. J. Clim. 33, 7983–8002. doi:10.1175/JCLI-D-20-0162.1
Song, J. J., Klotzbach, P. J., and Duan, Y. H. (2021). Relationship between spring tropical cyclone frequency over the western North Pacific and El Niño Southern oscillation. Int. J. Climatol. 41, E509–E516. doi:10.1002/joc.6703
Song, J. J., Klotzbach, P. J., and Duan, Y. H. (2022). Statistical linkage between coastal El niño–southern oscillation and tropical cyclone formation over the western North pacific. Atmos. Sci. Lett. 23, 1–10. doi:10.1002/asl.1071
Song, W., Tang, S., and Wang, X. (2019). Relationship between Pacific Ocean warming and tropical cyclone activity over the western North Pacific. Stoch. Environ. Res. Risk Assess. 33, 31–45. doi:10.1007/s00477-018-1640-z
Ta-Huu, C., and Sato, T. (2019). Effect of ENSO phase on the contribution of environmental variables to tropical cyclone genesis in the western North Pacific. Int. J. Climatol. 39, 2461–2473. doi:10.1002/joc.5966
Takaya, Y., Kosaka, Y., Watanabe, M., and Maeda, S. (2021). Skilful predictions of the Asian summer monsoon one year ahead. Nat. Commun. 12, 2094. doi:10.1038/s41467-021-22299-6
Villarini, G., and Vecchi, G. A. (2017). Projected increases in North Atlantic tropical cyclone intensity from CMIP5 models. J. Clim. 26, 3231–3240. doi:10.1175/JCLI-D-12-00441.1
Walsh, K., Lavender, S., Scoccimarro, E., and Murakami, H. (2013). Resolution dependence of tropical cyclone formation in CMIP3 and finer resolution models. Clim. Dyn. 40, 585–599. doi:10.1007/s00382-012-1298-z
Wang, C., Wu, L. G., Zhao, H. K., Cao, J., and Tian, W. (2019). Is there a quiescent typhoon season over the western North Pacific following a strong El Niño event? Int. J. Climatol. 39, 61–73. doi:10.1002/joc.5782
Wu, Y. S., Chen, S. M., Li, W. B., Fang, R., and Liu, H. Y. (2020). Relative vorticity is the major environmental factor controlling tropical cyclone intensification over the Western North Pacific. Atmos. Res. 237, 104874. doi:10.1016/j.atmosres.2020.104874
Xiao, Z., Liang, H., and Chongyin, L. I. (2010). Relationship between the number of summer typhoons engendered over the northwest Pacific and South China Sea and main climatic conditions in the preceding winter and spring. Acta Meteorol. Sinica 24 (1), 441–451.
Zhang, W., Leung, Y., and Fraedrich, K. (2015). Different El nino types and intense typhoons in the Western North pacific. Clim. Dyn. 44, 2965–2977. doi:10.1007/s00382-014-2446-4
Zhao, H., Klotzbach, Phil. J., and Chen, S. (2020). Dominant influence of ENSO-like and global sea surface temperature patterns on changes in prevailing boreal summer tropical cyclone tracks over the Western North Pacific. J. Clim. 33, 9551–9565. doi:10.1175/JCLI-D-19-0774.1
Keywords: severe typhoon, typhoon frequency, short-term climate forecast, El Niño and La Niña, atmospheric disturbances
Citation: Fang R, Chen S, Li W, Zhou M, Zhang A and Chen Y (2022) Extreme anomalies under El Niño and La Niña developing tendencies restrain subsequent severe typhoons in the western North Pacific. Front. Earth Sci. 10:957840. doi: 10.3389/feart.2022.957840
Received: 31 May 2022; Accepted: 30 June 2022;
Published: 15 August 2022.
Edited by:
Haishan Chen, Nanjing University of Information Science and Technology, ChinaReviewed by:
Yipeng Guo, Nanjing University, ChinaHaikun Zhao, Nanjing University of Information Science and Technology, China
Copyright © 2022 Fang, Chen, Li, Zhou, Zhang and Chen. This is an open-access article distributed under the terms of the Creative Commons Attribution License (CC BY). The use, distribution or reproduction in other forums is permitted, provided the original author(s) and the copyright owner(s) are credited and that the original publication in this journal is cited, in accordance with accepted academic practice. No use, distribution or reproduction is permitted which does not comply with these terms.
*Correspondence: Shumin Chen, Y2hlbnNodW1pbkBzbWwtemh1aGFpLmNu; Weibiao Li, ZWVzbHdiQG1haWwuc3lzdS5lZHUuY24=