 Yudan Wang
 Xianfeng Liu
 Jing Li
 Yida Wang1
- 1School of Geography and Tourism, Shaanxi Normal University, Xi’an, China
- 2College of Geomatics, Xi’an University of Science and Technology, Xi’an, China
Land use pattern optimization is an effective approach for sustaining soil conservation service (SCS) under the influence of climate change and anthropogenic activities across the Loess Plateau of China. However, current studies establish ecological protection scenarios (EPSs) for land-use optimization based on the transfer matrix of EPS alone, which ignores the important role of scientific intervention by human beings on land-use patterns. To fill this knowledge gap, the Wuding River watershed was employed as the research object, and land use under three EPSs was simulated according to the transfer matrix, dry-wet zoning, slope, and soil and water loss zoning. The quantity of SCS and its spatial flow and benefit under different climate scenarios were then simulated and compared with those under natural development scenarios (NDSs). SCS was found to decrease due to the expansion of urban areas and agriculture under the NDSs and increase under the EPSs relative to the NDSs. In addition, under the EPSs, SCS restricted to dry-wet zoning exhibited no significant advantage over those without additional constraints. However, when complex constraints, such as dry-wet zoning, slope, and soil and water loss zoning, were combined, SCS was significantly improved in areas with large topographic fluctuations. Further, compared with that in 2000–2020, the benefit of SCS in future scenarios displayed an increasing trend in the direction of the mainstream. Owing to the cumulative benefit, when the spatial flow of the SCS upstream decreases with urban expansion, the benefit for the downstream area, which is provided by land-use optimization, will decrease. Overall, our findings provide a framework for land use optimization by incorporating ecosystem service flow, ultimately facilitating land management, ecological restoration, and soil erosion prevention.
1 Introduction
Soil erosion is one of the biggest ecological environmental problems globally and will eventually threaten human survival (Guo et al., 2021). Climate change and human activities are key factors driving changes in soil erosion, with land use and vegetation cover as the most direct manifestations of human activities on the land surface (Xiao et al., 2021). Climate and land-use changes affect the provision of ecosystem services and the sustainable development of society (Bryan et al., 2018; Fu et al., 2020). Soil conservation service (SCS) is the ability of natural ecology to prevent soil and water loss and retain sediments. Accordingly, SCS is an important part of regulation services and an important guarantee for soil health, vegetation carbon fixation, and water purification. It plays a key role in the realization of sustainable development goals (Yin et al., 2022). Research on SCS is closely related to soil erosion; however, exploring land-use optimization from the perspective of the spatial flow of the SCS can be significant for controlling soil erosion.
Many previous studies have considered the difference between potential and actual erosion as the amount of soil conservation based on the Revised Universal Soil Loss Equation (RUSLE) (Sun et al., 2014; Wang et al., 2018). However, slope erosion was mainly considered in this model, and channel erosion, gravity erosion, and gully erosion were not included (Geneletti, 2013). The sediment transport ratio was added to the RUSLE model to complement sediment interception (Liu and Zhao, 2019). This approach is used in the InVEST model, which has been employed in many studies to calculate SCS (Rao et al., 2013; Kang et al., 2017; Wang et al., 2019); however, other sources of sediment are not considered in this model. Further, research on SCS tends to ignore the openness of the system (Chen et al., 2020), and only a few studies have simulated SCS flow.
Ecosystem service flows can be divided into in situ, omnidirectional, and directional service flows based on the spatial relationship between service generation and benefit realization (Fisher et al., 2009; Xiao et al., 2016). According to supply and demand mobility, ecosystem service flows can be divided into supply mobile service flows and consumption mobile service flows (Li, 2014). For SCS, the control of soil loss in the upper reaches of the ecosystem can provide erosion control services in the lower reaches, which is a directional service flow naturally transported along the soil erosion-transport-deposition pathway (Zhao et al., 2018). The Dinf model and Service Path Attribution Networks model can well simulate the spatial flow paths of SCS (Wang, 2019; Zheng et al., 2021). However, some studies have simulated service increases in terms of sediment reduction when simulating the flow of SCS (Liang, 2019), which leads to a conceptual conflict between the harm of sediment and SCS.
The type, structure, and spatial pattern of land use affect the processes of erosion and sediment yield (Wang et al., 2005; Yang and Qin, 2010; Yu et al., 2011; Zhang et al., 2017). The effects of the type and pattern of land use on soil erosion can be simulated and predicted by setting different land-use scenarios (Zhu, 2017; Wang et al., 2020; Feng et al., 2018). However, the design of these scenarios usually relies on a transfer matrix, which does not consider the impact of strong scientific management on land use layout or only considers the spatial distribution of land-use types in extreme scenarios, which ignores the realizability of land-use change. Climate change is also a major factor that affects soil conservation. The impact of climate change on soil erosion has long been noted (Bryan and Albritton 1943). An increase in temperature will affect rainfall, rainfall intensity, and spatiotemporal distribution pattern, which will directly affect the amount of soil erosion. Climate scenarios are developed from simple hypothetical scenarios to more realistic scenarios, providing support for the study of climate-induced soil erosion (Li and Fang, 2016). The Representative Concentration Pathways (RCPs) mentioned in the Fifth International Coupled Model Comparison Program were used to study soil conservation. Climate-induced changes in precipitation could offset the soil and water conservation promoted by vegetation growth (Liu et al., 2021). Moreover, the variation trend of SCS under different emission scenarios was consistent with the change rule of rainfall and temperature, and the maximum increase was observed under high-emission scenarios (Feng et al., 2020). The combined scenarios of different Shared Socioeconomic Paths (SSPs) and different RCPs proposed in the Coupled Model Inter-comparison Project Phase 6 (CMIP6) provide a more reasonable assessment of climate change consequences (O’ Neill et al., 2017; Tong et al., 2020) and support the simulation and prediction of SCS under future climate scenarios.
The Loess Plateau of China is one of the most severely eroded areas on Earth; however, its regional ecology has been restored since the return of farmland to forest projects in 1999. With the intensely eroded area declining, the lightly eroded area will be further expanded, and the ecosystem will still be fragile (Xin et al., 2012; Fu et al., 2017). As an important factor affecting land use, land-use planning can optimize land resource allocation and improve the ecological environment (Ouyang et al., 2016). The Wuding River watershed is located in the transition zone between the Loess Plateau and Mu Us Sandy Land. Heavy rain occurs in the summer and is accompanied by severe soil erosion, causing a volatile and fragile ecological environment. Accordingly, we used the SCS of the Wuding River watershed as the research object, simulated the quantity of SCS, and evaluated the spatial flow, which is a directional service flow based on the soil erosion-transport-deposition pathway, to reveal the spatial flow mechanism of the SCS. Three ecological protection scenarios (EPSs) were simulated to explore how the scientific planning of land use patterns can help better cope with future climate change.
2 Data and methods
2.1 Study area
The Wuding River watershed is located in the middle of the Loess Plateau, spanning Shaanxi Province and the Inner Mongolia Autonomous Region. This watershed originates from the northern foot of Baiyu Mountain in Shaanxi Province at an altitude of 566–1824 m and is generally high in the Northwest and low in the Southeast. The basin is located at the junction of semi-humid and semi-arid regions with a temperate continental monsoon climate, which synchronizes the precipitation and high-temperature seasons in this region. Rainfall mainly occurs in summer and autumn, and loess soil is loose and easily eroded by precipitation, which are important factors affecting soil erosion in the Wuding River watershed. The northwest part of the watershed is a windy-sandy area with sparse vegetation and severe wind erosion. In contrast, the Southeast part, which is the main source of sediment, is a loess hilly-gully area with frequent human activities, mainly agricultural land, and a high reclamation index. Owing to harsh natural conditions and intense human activities, the soil erosion rate is highest in the Loess Plateau region, accounting for 14.3% of the annual sediment transport in the lower reaches of the Yellow River. Serious soil erosion and a fragile ecological environment have become key factors restricting the sustainable development of the economy and society in the Wuding River watershed (Figure 1).
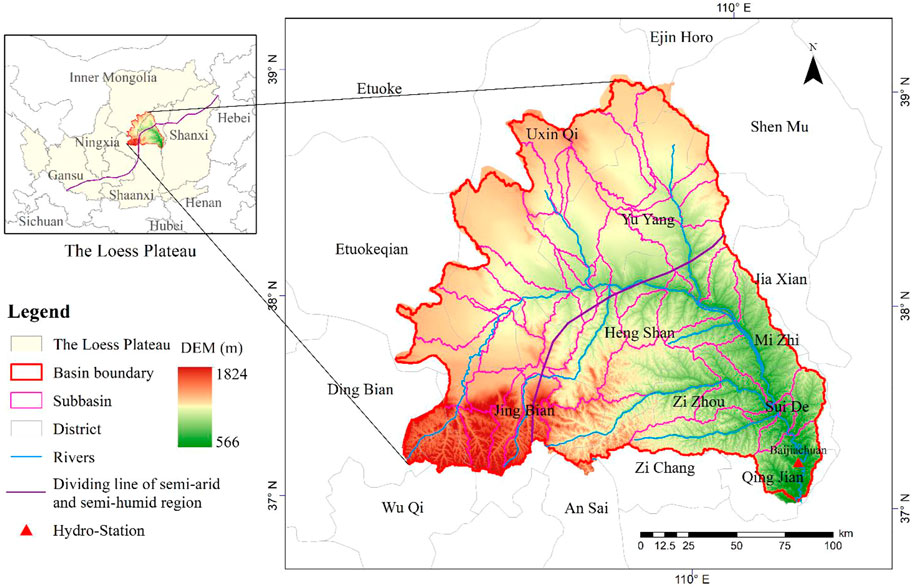
FIGURE 1. Geographic location (left) of the Wuding River watershed in the Loess Plateau and its administrative divisions and watershed subdivisions (right).
2.2 Data sources
The research datasets include digital elevation models, land use, soil, hydrological, and meteorological data. DEM data with a resolution of 30 m was downloaded from the Japan Aerospace Exploration Agency. Land use data were downloaded from the Resource and Environment Science and Data Center. Soil data were obtained from the Harmonized World Soil Database. Hydrological data were downloaded from the Yellow River Conservancy Commission. Meteorological data included historical climate data downloaded from the China Meteorological Administration and future climate data used two climate scenarios of CMIP6 from the NASA Center for Climate Simulation, Shared Socioeconomic Path (SSP) 245 and SSP585. The SSP245 is the updated RCP4.5 scenario; that is, the radiative forcing will stabilize at 4.5 W/m2 in 2,100. And SSP585 is the updated RCP8.5 scenario, that is, the anthropogenic radiative forcing in 2,100 is high at 8.5 W/m2 (Jiang et al., 2020). Details regarding the collected data are presented in Table 1.
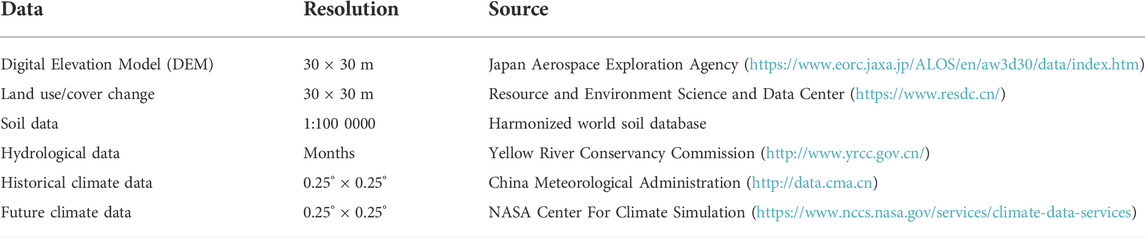
TABLE 1. Detailed information of the datasets.
2.3 Methodology
2.3.1 Soil conservation service simulation
The soil and water assessment tool (SWAT) model, developed by the United States Department of Agriculture, is used to simulate water quality and quantity at a watershed scale and quantitatively analyze and predict the impact of land use and land management on water quality and quantity (Chen et al., 2022). According to the landform, geomorphology, climate, and water system characteristics of the Wuding River watershed, the minimum area threshold of the sub-basin was set at 40,000 hm2, and the Wuding River watershed was divided into 45 sub-basins (Figure 1 and Supplementary Figure S1). The hydrological response unit analysis was carried out based on land use type, soil data, and terrain slope. Further, the daily scale meteorological database was input, automatically constructed, and simulated by the model according to the characteristics of the watershed.
2.3.1.1 Soil erosion simulation
The SWAT model can be used to simulate various geographical processes within a basin. SCS was the main focus of this study, and sediment yield was obtained using the SWAT model. Therefore, in the algorithm part, the soil erosion simulation algorithm of the SWAT model was considered a key aspect.
The SWAT model uses the modified universal soil loss equation (MUSLE) to calculate sediment quantity; the equation (Eq. 1) is as follows:
where SEDa represents the amount of soil erosion; Qsurf represents the surface runoff per hour; qpeak represents the peak flood flow per second; Ahru is the area of the hydrological response unit; and K, C, P, LS, and CFRG represent the soil erodibility, surface vegetation cover, soil conservation measure, slope length and steepness, and coarse debris factors, respectively.
2.3.1.2 Calibration and validation
The SWAT-CUP is a program for the calibration of SWAT models. The program could be used to perform calibration, validation, sensitivity analysis, and uncertainty analysis. According to the principle of “runoff first, sediment later,” the runoff from 2008 to 2013 and the sediments from 2008 to 2018 were calibrated and verified using SWAT–CUP based on monthly data from the Baijiachuan hydrological station. The parameters used are shown in Supplementary Table S1. The correlation coefficient (R2) and Nash–Sutcliffe efficiency (NS) were used to evaluate the applicability of the results. When R2 > 0.6 and NS > 0.5, the simulation results were considered to be available. For runoff, when 2008–2010 was the calibration period, the results were as follows: R2 = 0.7 and NS = 0.64; however, when 2011–2013 was the validation period, the results were as follows: R2 = 0.78 and NS = 0.7, as shown in Figure 2. For sediments, when 2008–2013 was the calibration period, the results were as follows: R2 = 0.67 and NS = 0.51; when 2014–2018 was the validation period, the results were as follows: R2 = 0.74 and NS = 0.72, as shown in Figure 3.
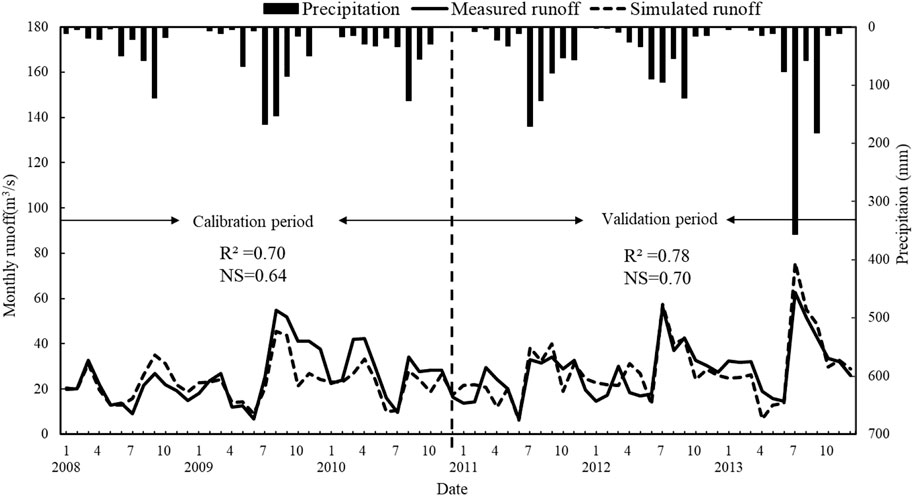
FIGURE 2. Monthly runoff during the calibration period (2008–2010) and validation period (2011–2013).
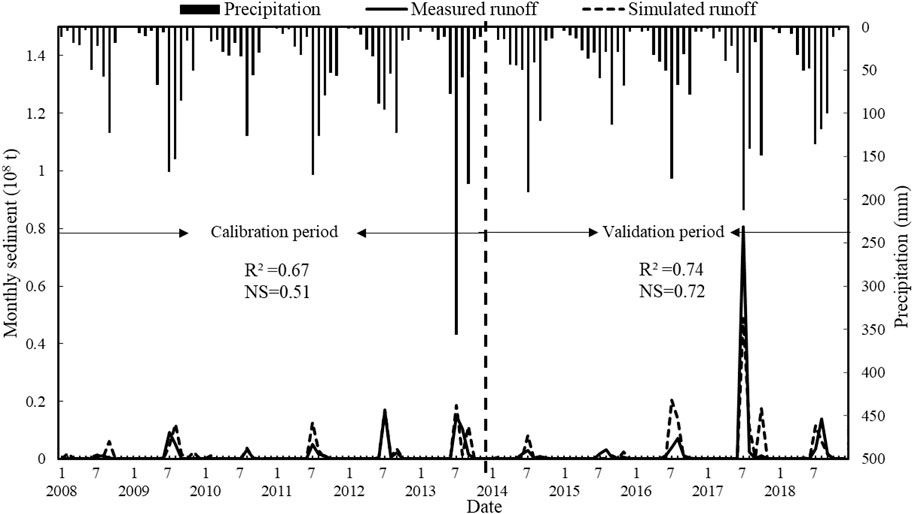
FIGURE 3. Monthly sediment during the calibration period (2008–2013) and validation period (2014–2018).
2.3.1.3 Soil conservation service simulation
The SCS can be quantified by the difference between potential soil erosion and actual soil erosion, which represents the control ability of existing vegetation cover and management measures to soil erosion without vegetation cover and management measures. Expressed by Eq. 2.
where As, SEDp, and SEDa refer to soil conservation service, potential soil erosion, and actual soil erosion, respectively. The SWAT model can directly simulate actual soil erosion but cannot directly result in the potential soil erosion. Therefore, the C and P factors in the source code of the SWAT model were modified to one to simulate erosion under the assumption that these is no vegetation cover and soil conservation measures to obtain the potential soil erosion.
2.3.2 Spatial flow model
The ecosystem service flow refers to the spatial transmission process from supply area to benefit area (Syrbe and Walz, 2012). Most studies on ecosystem service flow are based on the perspective of supply and demand matching, and the amount of flow depends on human demand (Liu et al., 2017). However, compared with other ecosystem services, SCS is special. It is a directional service flow that depends on the soil erosion—transport-deposition pathway, and its spatial flow path is naturally transmitted along with the terrain and is not directly affected by the balance of supply and demand (Zheng, 2021; Wang et al., 2022). Therefore, this paper will focus on the supply and flow of SCS. Herein, the Dinf model was used to simulate the spatial flow path and quantify the flow and benefits.
2.3.2.1 Flow path model
The Dinf algorithm, which is a multiflow model proposed by Tarboton (1997), was used to simulate the flow path of the SCS. In a 3-pixel × 3-pixel window, the Dinf algorithm takes the cell to be calculated as the center and diagonally divides the surrounding eight cells (the diagonal direction of the central cell) every 45°. The maximum slope in the triangle formed by the central grid cell and the eight surrounding cells is the slope of the grid cell, and the slope direction of the triangle is the flow direction, which flows through the direction of the water flow to determine the two downstream grid cells (Figure 4).
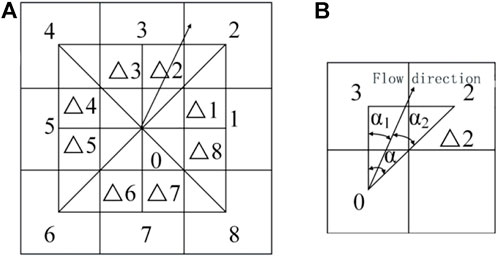
FIGURE 4. The Dinf algorithm: (A) triangle number of the Dinf algorithm and (B) flow direction and two downstream grid cells.
2.3.2.2 Quantity of flow and benefit
The quantity of the spatial flow can be expressed using Eq. 3
where Fa is the amount of spatial flow in sub-basin a, As represents the soil conservation service within a time step, surlag signifies the hysteresis coefficient of the surface runoff, and tconc represents the concentration time. The expression
The benefit of SCS in sub-basin b is the sum of the total flow of the connected upstream sub-basins and the flow of sub-basin b, which can be expressed by Eq. 4
where Yb, ∑Fa, and Fb refer to the quantity of the flow in sub-basin b, cumulative amount of the flow of SCS in all upstream sub-basins connected to sub-basin b, and the flow in sub-basin b, respectively.
2.3.3 Scenario design
The FLUS model is a land-use simulation model combining a cellular automata model and an artificial neural network algorithm that can simulate the spatial pattern of land use according to the future demand of land use (Xun et al., 2018). The FLUS model uses an artificial neural network algorithm to obtain the suitability probability of various land use types within the research scope from the first-stage land use data and various driving factors, including human activities and natural effects, and then obtains the distribution map of the future land use by combining it with the future land use demand (Liang et al., 2018). In this study, the FLUS model was used to construct the land use of natural development scenarios (NDSs) and three different EPSs in 2030 and 2050. The three EPSs were compared with NDSs to analyze the impact of different land-use patterns under ecological protection planning on SCS.
1) NDSs: Based on the land use/land cover change from 2000 to 2020, the NDSs of the Wuding River watershed in 2030 and 2050 were simulated and predicted according to the current development pattern and transfer matrix of land-use change under NDS (Table 2).
2) EPSs: First, the ecological protection scenario (EPS) of the transfer matrix of land-use change (Table 3) was used to predict the area of various land-use types in 2030 and 2050. The research object of this paper is SCS, so in the EPSs, suitable distribution areas are mainly planned for forest land, grassland, and agricultural land, and land use types without constraints are directly simulated in the FLUS model according to the transfer matrix of land-use change. Finally, under the condition that the area of various land-use types remains unchanged, the following three EPSs were constructed according to the suitable distribution zones constrained (Table4) by slope, dry-wet zone, and soil and water loss zone (Supplementary Figure S2).
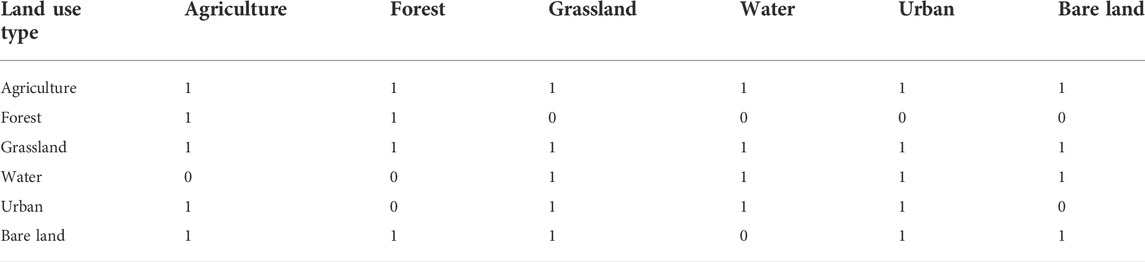
TABLE 2. Transfer matrix of land-use change under NDS.
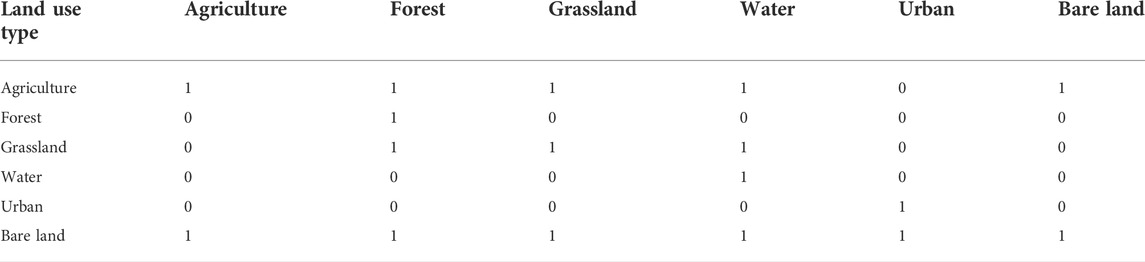
TABLE 3. Transfer matrix of land-use change under EPS.
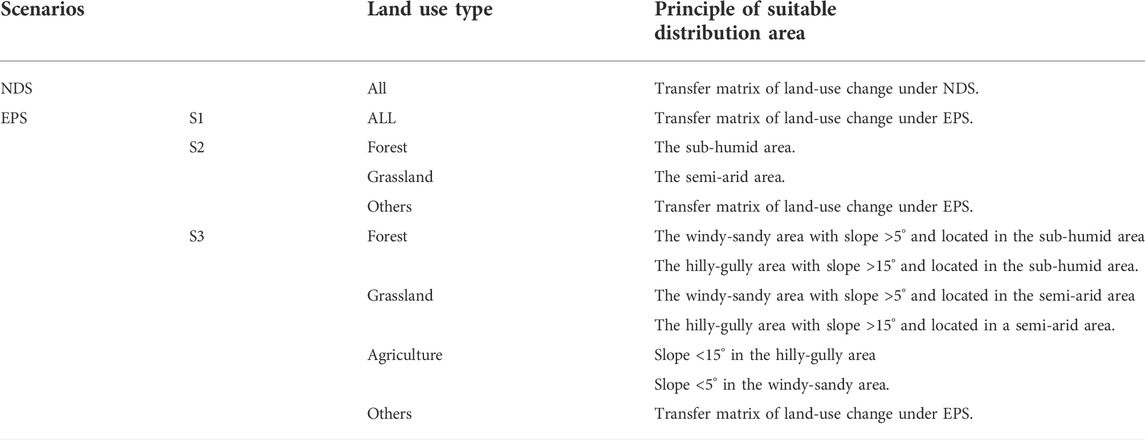
TABLE 4. Principle of suitable distribution area for different scenarios.
Scenario 1 (S1): Without additional constraints, the spatial distribution of land-use types in 2030 and 2050 can be predicted according to the land-use change transfer matrix of EPS alone.
Scenario 2 (S2): According to Gao et al. (2016), the semi-humid and humid regions are suitable for forestland growth, while the semi-arid and arid regions are suitable for grassland growth. Therefore, when the existing forest and grassland are kept as immobile as possible, S2 regards the sub-humid area as the priority development area of forest and the semi-arid area as the priority development area of grassland to predict the land use types under EPSs in 2030 and 2050.
Scenario 3 (S3): The National Development and Reform Commission of China (Ndrc, 2010) divides the Loess Plateau into six soil and water loss zones according to natural conditions, comprehensive control measures, and administrative boundaries. The soil and water loss zoning itself is inseparable from natural conditions such as slope and precipitation, which have a guiding significance in ecological protection planning. However, owing to the impact of the classification accuracy, the Wuding River watershed, with a small area, can only be divided into two soil and water loss zones: the hilly-gully region and the windy-sandy region. Therefore, we used the DEM data to generate a slope map, and combined it with dry-wet zoning and soil and water loss zones, then designed S3. The principles for setting suitable distribution areas in S3 are as follows: 1) suitable distribution areas for forestland: the existing forestland; the windy-sandy area with a slope greater than 5° and located in the sub-humid area; and the hilly-gully area with a slope of more than 15° and located in the sub-humid area; 2) suitable distribution areas for grassland: the existing grassland; the windy-sandy area with a slope greater than 5° and located in the semi-arid area; the hilly-gully area with a slope of more than 15° and located in a semi-arid area; and 3) suitable distribution area for agriculture: slope less than 15° in the hilly-gully area and less than 5° in the windy-sandy area.
3 Results
3.1 Land use simulation based on different scenarios
The area changes for each land-use type under the NDSs and EPSs are shown in Table 5. The NDSs continued the land use change rule from 2000 to 2020. Compared to those in 2030, the areas of agriculture, water, and urban land will increase by 8.01%, 19.86%, and 58.01%, respectively, in 2050, while the areas of forest, grassland, and bare land will decrease by 8.79%, 6.66%, and 6.27%, respectively. In EPSs, compared with those in 2030, forest, grassland, water, and urban land will increase by 2050, while the area of agriculture and bare land will decrease. Although the rate of increase in urban land under EPS was higher than that under NDS, its area was less than that under NDS. The urban land area under EPS is expected to be 35% lower than that under NDS by 2030 and 30% lower by 2050.
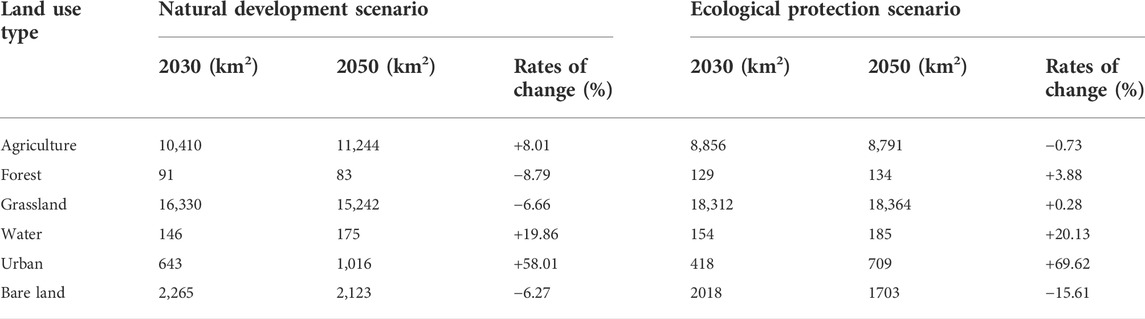
TABLE 5. Areas and rates of change of land-use types under different scenarios in 2050 compared to 2030.
The spatial distribution of land-use types under the NDSs and EPSs is shown in Figure 5. Compared with 2030, the distribution of urban and agricultural under the NDSs will be more intensive by 2050. Under EPSs, owing to the influence of different design and planning methods, although the area of each land-use type is the same, their spatial distribution is different. S1 was only affected by the suitability probability and transfer matrix of ecological protection, while S2 was mainly influenced by whether it was a semi-arid or sub-humid region. Therefore, an increase in grassland and agriculture mainly occurred in the Northwest, while an increase in forest occurred in the Southeast; however, as the forest area was less, the distribution of land-use types in the Southeast was relatively stable. In S3, the restriction conditions were more complex and related to slope, dry-wet zoning, and soil and water loss zoning. Further, the changes in various land-use types were relatively scattered. Compared with that in the NDSs, except for the significant increase in urban areas, the utilization rate of bare land obviously increased under the EPSs. Further, bare land that is mainly distributed in the Northwest was transformed into grassland and other land-use types.
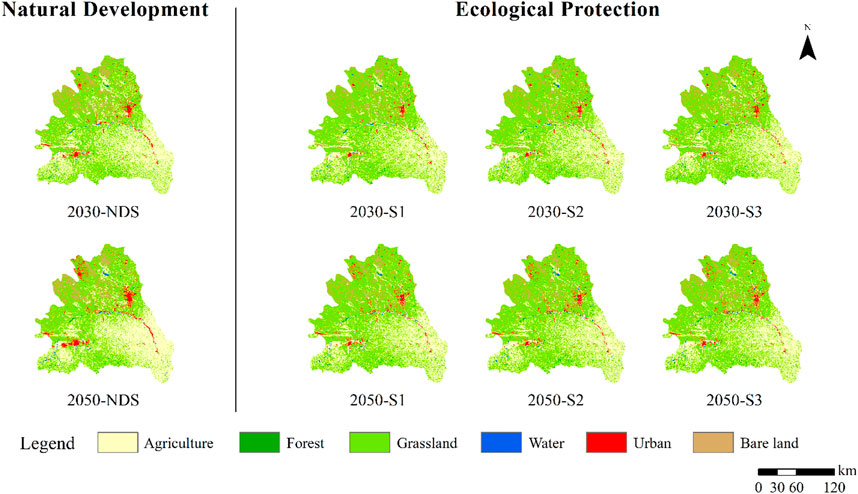
FIGURE 5. Land-use type for different scenarios in 2030 and 2050.
3.2 Soil conservation service and its spatial flow from 2000 to 2020
The monthly SCS and precipitation in the Wuding River watershed from 2000 to 2020 are shown in Figure 6. The SCS of the Wuding River watershed showed an upward fluctuation trend, and precipitation, which is strongly consistent with the SCS, was generally characterized by a rising trend. Heavy rain is the main form of precipitation on the Loess Plateau and is an important factor affecting soil erosion (Bai et al., 2021). SCS in August 2001, July 2013, and July 2017 exceeded 2.5 × 10⁸ t, with values of 2.92 × 10⁸ t, 2.85 × 10⁸ t, and 3.14 × 10⁸ t, respectively. Accordingly, the monthly total precipitation in these 3 months had high values of 213, 209, and 180 mm, respectively. The SCS in the Wuding River watershed had a strong correlation with precipitation, which further indicated that precipitation was the decisive factor affecting SCS in the Wuding River watershed.
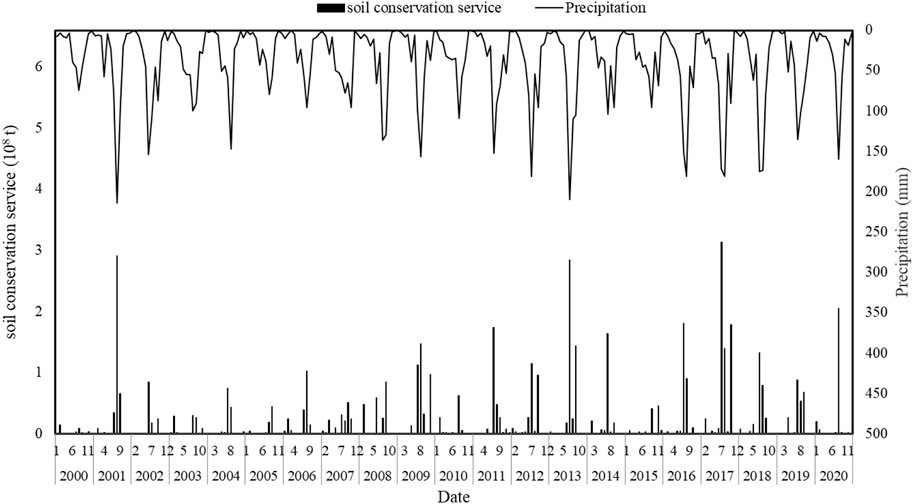
FIGURE 6. Monthly SCS and precipitation from 2000 to 2020.
To study the spatial distribution of SCS in the Wuding River watershed, 2000, 2005, 2010, 2015, and 2020 were selected to draw the spatial distribution map, as shown in Figure 7. Overall, the SCS showed obvious spatial differentiation, with a low distribution in the northwest and a high distribution in the southeast. During the study period, the SCS in the middle and upper reaches of the Wuding River watershed was lower than 500 t/km2. In these areas, the terrain is flat and precipitation is scarce. And grassland is the main land use type, with low erosion potential and stable soil conservation. In the middle and lower reaches of the Wuding River watershed, the SCS displayed an obvious upward trend. In these regions, agriculture was the main land-use type and precipitation was large, leading to large potential and actual erosion.
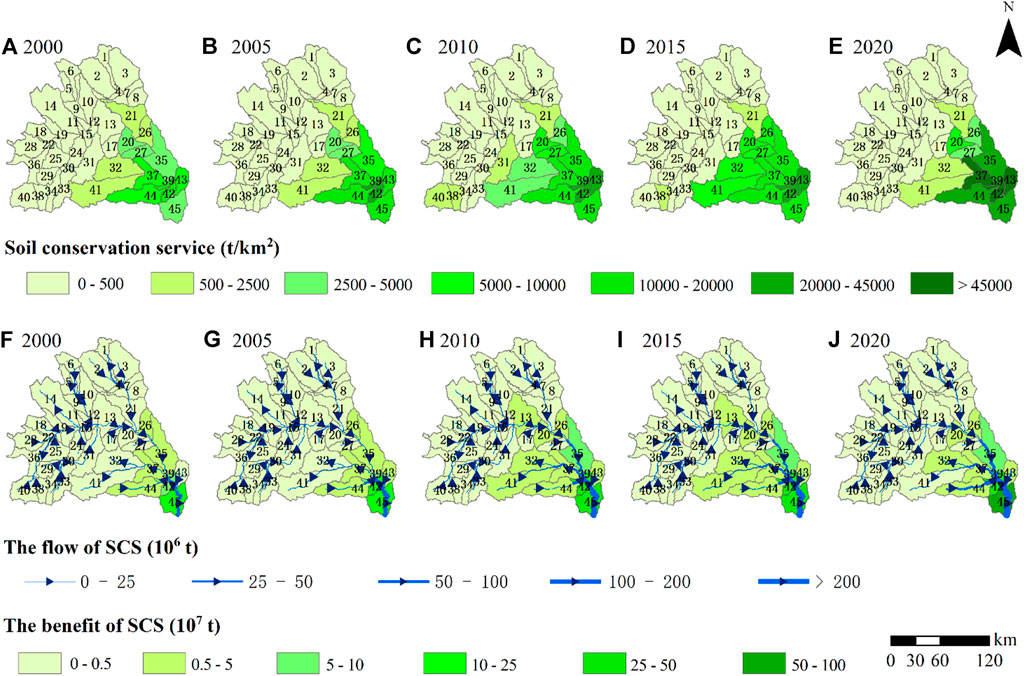
FIGURE 7. Soil conservation service (A–E) and its spatial flow (F–J).
The flow and benefits of the SCS from 2000 to 2020 are shown in Figure 7. The arrow in the figure depicts the flow points to the flow path in each sub-basin of the Wuding River watershed, and the thickness of the symbol indicates the quantity of flow. The flow path of the SCS was highly consistent with the river network, and the total variation tendency of flow is to rise in fluctuation, especially in the downstream area in 2020. As the measures for returning farmland to forest and grassland were implemented in the Loess Plateau from 2000, the sediment retention capacity has improved and sediment yield has been reduced, thereby leading to a gradual increase in the SCS provided by the ecosystem.
The benefit of each sub-basin includes the total amount of SCS in the sub-basin and its connected upstream sub-basins. Therefore, sub-basins 3, 21, and 45 were selected for comparison. Sub-basin 3 is the marginal sub-basin of the Wuding River watershed and is unconnected to the upstream. The benefit of this sub-basin is its own flow of SCS, with an average annual benefit of 6.75 × 10⁴ t during the study period. Sub-basin 21 is connected to six sub-basins (sub-basins 1, 2, 3, 4, 7, and 8), and its benefit is the sum of its SCS value and the benefit generated by these six sub-basins. The annual benefit of sub-basin 21 was 3.98 × 10⁶ t. As the outlet of the Wuding River watershed, the final annual benefit of sub-basin 45 was 8.44 × 10⁸ t after the accumulation of the benefits in sub-basins 1–44.
3.3 Changes in soil conservation service under different ecological protection scenarios compared with those under natural development scenarios
To investigate the differences in SCS under different EPSs and their changes relative to those under NDSs, the changes were obtained by subtracting the SCS under the three EPSs in 2030 and 2050 from those under NDSs (Figure 8).
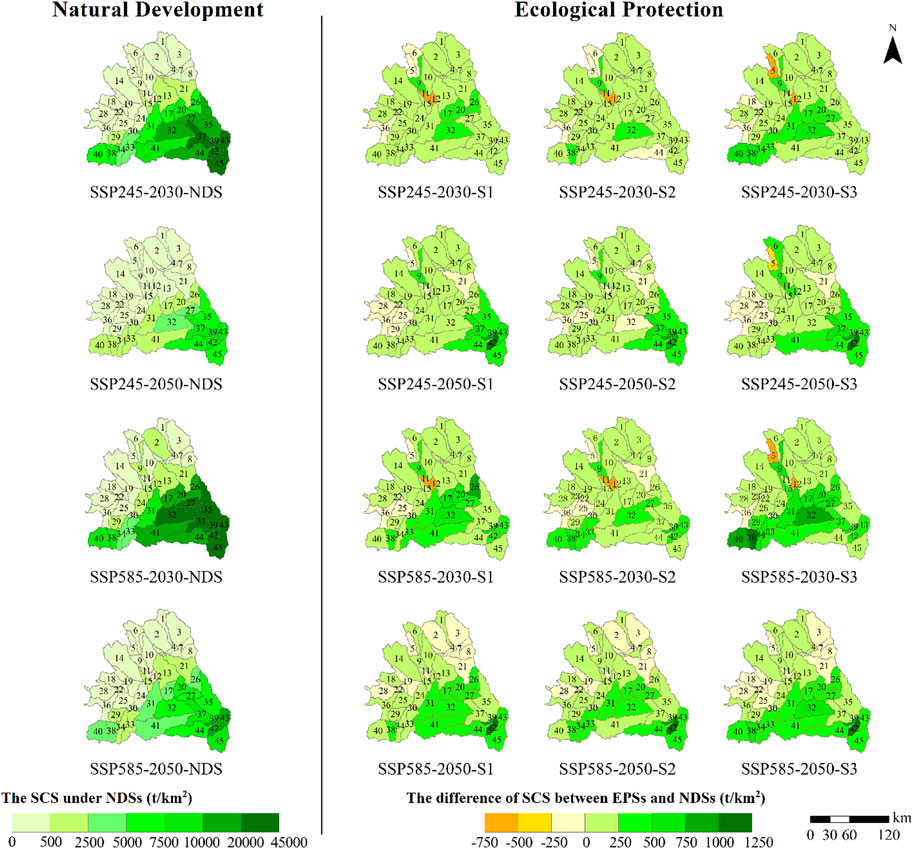
FIGURE 8. Soil conservation service under different scenarios.
Under the NDSs, the SCS under the SSP585 scenario was higher than that under the SSP245 scenario, and the increased areas were mainly distributed in the southeast. In contrast, the SCS was relatively stable in the northwest, where most of the SCS was lower than 500 t/km2. Such a finding indicates that as the radiative forcing of the scenario increases, precipitation will increase, which leads to an increase in SCS. However, owing to the increase in urban and agricultural areas, the SCS of NDSs in 2050 shows a decreasing trend compared with that of 2030 under both future climate models.
Under the two future climate models, the EPSs had more SCS than NDSs. SSP245-2030-S1, SSP245-2030-S2, and SSP245-2030-S3 were 7.43%, 5.37%, and 10.84% more than SSP245-2030-NDS, respectively. SSP245-2050-S1, SSP245-2050-S2, and SSP245-2050-S3 were 7.42%, 6.36%, and 7.94% more than SSP245-2050-NDS, respectively. SSP585-2030-S1, SSP585-2030-S2 and SSP585-2030-S3 were 2.13%, 1.50%, and 3.03% more than SSP585-2030-NDS, respectively. SSP585-2050-S1, SSP585-2050-S2, and SSP585-2050-S3 were 5.50%, 4.90%, and 6.71% more than SSP585-2050-NDS, respectively. As shown in Figure 8, only a few sub-basins had less SCS relative to the NDSs, which was due to rapid urban development, such as sub-basins 5, 11, and 12 in 2030 the original bare land was mainly converted into urban land. However, under the EPSs, the urban expansion rate of these sub-basins was relatively low and bare land was not fully utilized. Accordingly, the amount of soil conservation in these sub-basins was more than 500 t/km2 lower than that under the NDSs. As land-use efficiency increases, soil conservation in these sub-basins will increase by 2050.
The advantages of the three EPSs were mainly reflected in the Southwestern and Southeastern regions. S2 considers semi-arid regions or semi-humid regions, and the advantages of this planning method are not obvious compared with those of S1. In contrast, S3 considers not only dry-wet zoning but also soil and water loss zoning and slope limitation, which can significantly improve the SCS. Notably, the advantages of S3 continue to increase in the Southwest and Southeast regions. Planning land use patterns by considering soil and water loss zoning and slope can improve the SCS in areas where topography highly fluctuates and is affected by precipitation. In contrast, in the Northwest, the terrain is flat, precipitation is relatively low, and the SCS is relatively stable. Therefore, the advantages of EPSs in these areas are unclear.
3.4 Changes in the flow and benefit of soil conservation service under different ecological protection scenarios compared with those under natural development scenarios
Compared with that in 2000–2020, the flow and benefit of SCS in the future show a new characteristic; except for maintaining the distribution characteristic of more in the east and less in the West, the flow and benefit in the sub-basins where the tributary is located are larger than those in the branches and increase along the trunk (Figure 9).
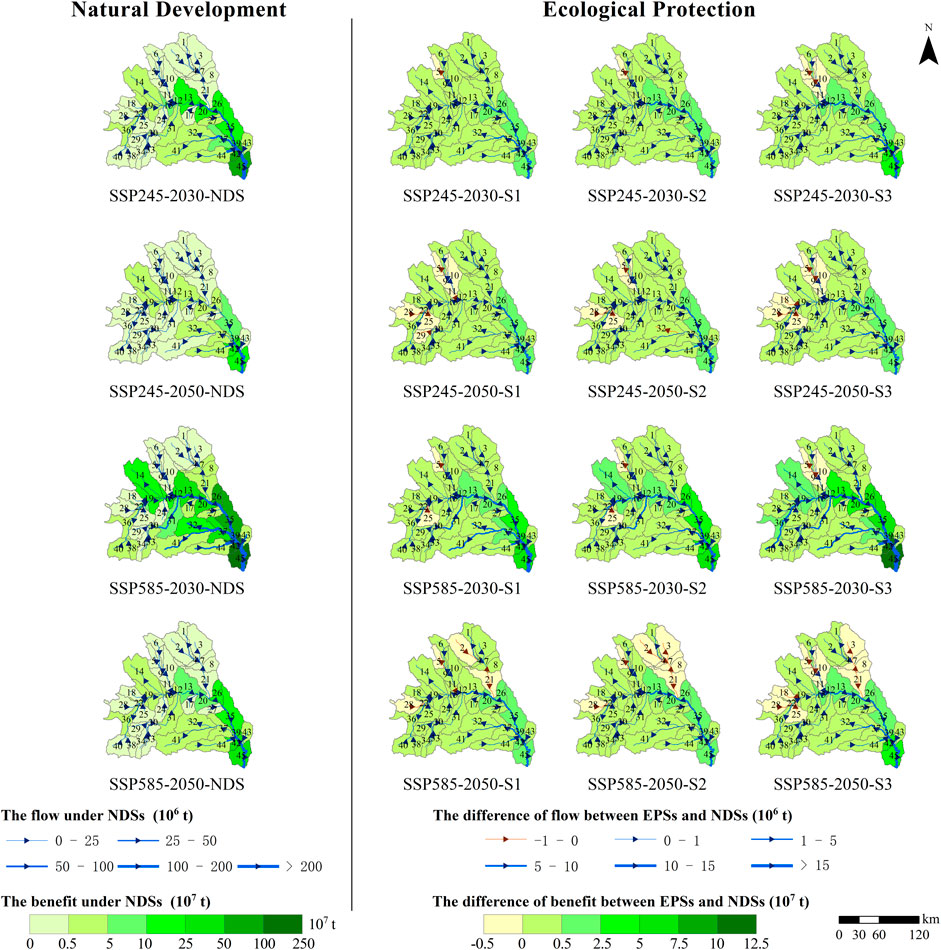
FIGURE 9. The flow and benefit of SCS under different scenarios.
Compared with that in SSP245, the flow and benefit markedly increase under SSP585, and the increased area is mainly the sub-basins where the trunk of the flow is located. This increasing trend is obvious for both NDSs and EPSs and indicates that the rate of increase of potential soil erosion is higher than that of actual soil erosion with the increase in precipitation. Moreover, in semi-humid and semi-arid regions, precipitation has an obvious stress effect on vegetation growth, which provides more soil conservation.
Under the two future climate models, compared with the NDSs, the EPSs have more vegetation and less bare land. Accordingly, the amount of flow and benefits susceptible to topography are mainly increased in space, and the areas with more increase are mainly the sub-basins of the trunk of the Southeast. Only a few sub-basins on the western edge of the watershed have reduced flow and benefits compared with those under NDSs. In addition, in 2030, compared with S1 and S2, S3 has no obvious advantage in the Western region, and some sub-basins have lower discharge and benefit than S1 and S2. Nonetheless, S3 has obvious advantages in the middle and east of the Wuding River watershed. However, by 2050, S3 has no obvious advantages in space compared with S1 and S2 under the two climate models. These results indicate that with urban expansion in the upper reaches of the river basin, land-use intensity increases and the spatial flow of SCS decreases. Further, as land use intensity in the upstream region increases, the amount of benefit in the downstream region decreases due to cumulative benefit.
4 Discussion
4.1 Impact of land use and climate change on soil conservation service
Rainfall intensity and slope are important factors influencing soil erosion (Yu and Bi, 2013). Therefore, S2 was designed from the perspective that the Wuding River watershed is the junction of the semi-arid and semi-humid regions to explore the ecological benefits of planning suitable distribution areas of grassland and forestland according to the equal precipitation line. However, the difference between S2 and S1 was unobvious, indicating that in a small watershed, there is no obvious advantage in the use of precipitation for land use planning in each sub-basin. We used the slope map and combined it with dry-wet zoning and soil and water loss zones, then designed S3. And this study proved that S3 has the largest ecological benefit among the three EPSs, particularly in the Southeast. The southeast of the Wuding River watershed is dominated by the loess hilly-gully region, with large terrain ups, downs, and ravines. Wang (2007) concluded that in the Wuding River watershed, the sediment content of rivers in the loess hilly-gully regions is markedly higher than that in the windy-sandy region. Scientific land use planning can obtain more significant ecological benefits in the Southeast region, where the terrain is fluctuant.
Compared with that in SSP245, soil conservation will increase under the SSP585 climate scenario, which is consistent with the conclusions of Bai (2021). Rainfall intensity is an important factor affecting the erosion ability of slope runoff (Shi et al., 2012). Under the future climate model, precipitation in the Wuding River watershed will increase, which will result in increasing soil conservation. Of note, the ecological benefits of the S3 scenario do not have obvious advantages compared with those of S1 and S2 in the SSP585 scenario. Therefore, in addition to planning land use according to local conditions in the complex environment of the Wuding River Basin, engineering prevention and control measures should be implemented to cope with the negative impact of increasing extreme climate events caused by the accelerated climate change process.
Soil conservation in some few sub-basins tended to decrease under the three EPSs compared with that under the NDSs. Under the NDSs, the former bare land was mainly converted into urban land, whereas under the EPSs, the urban expansion rate of these sub-basins was low, and the bare land was not fully utilized. As land use increases, soil conservation in these sub-basins is expected to increase by 2050. Therefore, bare land is still the focus of soil erosion control in the future, and the planning and utilization of bare land should be prioritized (Fang, 2021).
4.2 Implications for prevention and management policies of soil erosion
Ecosystem service flow explores the process of spatial flow from supply areas to benefit areas (Wang and Zhou, 2019), which is key to the transformation of services for human well-being. Studying ecosystem service flow enables the protection of ecosystem services and the prevention of factors that adversely affect the formation and development of ecosystem services. The ecosystem conserves soil through vegetation roots and reduces soil erosion by precipitation and runoff through interception, absorption, and infiltration, thereby reducing sediment. Soil erosion control has multiple benefits at local and regional scales (Fu et al., 2015). In this process, the spatial flow is unaffected by the balance of supply and demand in the sub-basins, which is the biggest difference between the spatial flow of SCS and other ecosystem services. This transmission process has a cumulative effect (Zheng, 2021; Wang et al., 2022). We visualized this cumulative effect in terms of benefits and found that as upstream cities expand, they provide less benefit to downstream cities, which may affect the sustainable development of the entire watershed.
Studies on the spatial flow of ecosystem services can obtain deep information that static studies cannot obtain. For example, the SCS (Figure 8) has more sub-basins, where the amount under the EPSs is lower than that under NDSs, than the benefit of SCS (Figure 9). And this indicates that the study on the supply of SCS alone is one-sided and neglects the non-negligible connection between upstream and downstream. The study of spatial flow can show the internal relationship between adjacent sub-basins or even non-adjacent sub-basins in the upstream and downstream. When the sediment amount in the upstream sub-basins decreases, the amount of sediment carried in the runoff can be reduced and SCS can be provided for the downstream areas. This result will encourage decision-makers for different administrative units upstream and downstream to strengthen cooperation to obtain win-win results. This approach considers the upstream and downstream as a whole, examines the remote coupling within the whole basin, and focuses on the change in cumulative effect to highlight the change in the benefit provided by the upstream for the downstream in different scenarios of land-use patterns, ultimately providing a basis for land-use optimization.
4.3 Uncertainties
The SWAT model includes complex processes, such as sediment delay in runoff, lateral flow, and sediment in underground runoff, and replaces rainfall factors with runoff factors without additional calculation of sediment separation and transport. These processes are convenient for simulating and calculating the flow and benefit of SCS and are more consistent with the actual situation. The SWAT model has a better simulation effect on the monthly hydrological process; however, sediment in the Loess Plateau is usually caused by short duration and high-intensity rainstorms in the flood season, which has a decisive influence on soil erosion (Zhao et al., 2020). Runoff and sediment in the Wuding River watershed rapidly reflect single-day rainfall, which is not well reflected in the SWAT model. In addition, the SWAT model is good for runoff simulation in the summer flood season but poor for spring floods or low rainfall in March and April, which is consistent with the application results of the SWAT model in other arid and semi-arid regions in China (Yao et al., 2015). These results may further affect the sediment simulation. Therefore, mastering the daily scale data combined with a model suitable for simulating spring floods will improve the simulation accuracy in future research.
The study of the SCS in the Wuding River watershed is based on the results of the MUSLE model used in the SWAT model, which is a hydraulic erosion model. The soil erosion pattern of the Wuding River watershed is dominated by hydraulic erosion, and approximately 1/6 of the sediment transport is caused by wind (Shi, 2006), which has not been considered in this study. In the future, wind erosion models, such as the revised wind erosion equation models (Fryear, and Bilbro, 2001), will be used to obtain results that are more consistent with the real situation in the Wuding River watershed.
To assess SCS based on the soil erosion–transport–deposition pathway in the remote coupling effect between the upstream and downstream, all downstream sub-basins were conceptually treated as benefit areas, and the SCS entering the downstream reaches was considered in the quantification of flow; however, the radiation distance was not considered in the quantification of the benefits, which may amplify the impact of land-use changes in the upstream sub-basins on the downstream SCS. Therefore, the radiation range of benefits should be further evaluated in future studies.
5 Conclusion
Different EPSs were established to determine the best strategy to handle future climate change through management optimization of land use patterns from the perspective of the SCS and its spatial flow and benefit. The SCS in the Wuding River watershed displayed an upward fluctuation trend from 2000 to 2020 and a strong correlation with precipitation, especially with heavy rainfall in the summer. In general, the SCS under SSP585 was higher than that under SSP245. However, due to intensive anthropogenic activities, the SCS under NDSs in 2050 showed a downward trend compared with that of 2030 under both future climate models. Nevertheless, through ecological protection and changing land-use patterns, SCS can be improved. Planning measures under the three EPSs can improve SCS to varying degrees. Further, S3, which is considered a slope, dry-wet zoning, and soil and water loss zone, will play a bigger role in areas with large topographic fluctuations. Flow and benefit can link upstream and downstream regions, thereby highlighting the role and impact of land use pattern change on the entire watershed. Human activities in the upstream region, such as urban expansion and an increase in cultivated land, will reduce the benefits in the downstream region; however, changing the distribution pattern of land use can reduce the adverse impacts and promote the sustainable development of the watershed.
Data availability statement
The original contributions presented in the study are included in the article/Supplementary Material; further inquiries can be directed to the corresponding authors.
Author contributions
YW and JL: conceptualization; data processing; methodology; software; calibration and validation; visualization; and writing-original draft, review, and editing. JL and XL: methodology; visualization; supervision and writing-review and editing. YW: data processing; methodology; software. JB: methodology, software, supervision. ZZ: supervision and writing-review and editing.
Funding
This research was supported by the National Natural Science Foundation of China, Grant Nos. 42071285 and 42171095; the Key R&D Program Projects in Shaanxi Province of China, Program No. 2022SF-382; the Fundamental Research Funds for the Central Universities, Shaanxi Normal University, 2021CSLY014, 2021TS013, GK202201008; the Social Science Foundation of Shaanxi Province, No. 2020D039, and Open Foundation of the State Key Laboratory of Urban and Regional Ecology of China, No. SKLURE2022-2-1.
Conflict of interest
The authors declare that the research was conducted in the absence of any commercial or financial relationships that could be construed as a potential conflict of interest.
Publisher’s note
All claims expressed in this article are solely those of the authors and do not necessarily represent those of their affiliated organizations, or those of the publisher, the editors and the reviewers. Any product that may be evaluated in this article, or claim that may be made by its manufacturer, is not guaranteed or endorsed by the publisher.
Supplementary material
The Supplementary Material for this article can be found online at: https://www.frontiersin.org/articles/10.3389/feart.2022.957520/full#supplementary-material
Abbreviations
CMIP6, coupled model inter-comparison project phase 6; EPS, ecological protection scenario; EPSs, ecological protection scenarios; MUSLE, modified universal soil loss equation; NDS, natural development scenario; NDSs, natural development scenarios; RCP, representative concentration pathway; RCPs, representative concentration pathways; SCS: soil conservation service; SSP, shared socioeconomic path; SSPs, shared socioeconomic paths; SWAT, soil and water assessment tool.
References
Bai, J. Z. (2021). Simulation of soil conservation service of the Jinghe River Basin under the background of climate change. Xi’an: Xi’an University of Science and Technology. [master’s thesis].
Bai, J. Z., Zhou, Z. X., Zou, Y. F., Pulatov, B., and Siddique, H. M. (2021). Watershed drought and ecosystem services: Spatiotemporal characteristics and Gray relational analysis. Ijgi 10, 43–21. doi:10.3390/IJGI10020043
Bryan, B. A., Ye, Y., Zhang, J. E., and Connor, J. D. (2018). Land-use change impacts on ecosystem services value: Incorporating the scarcity effects of supply and demand dynamics. Ecosyst. Serv. 32, 144–157. doi:10.1016/j.ecoser.2018.07.002
Bryan, K., and Albritton, C. C. (1943). Soil phenomena as evidence of climatic changes. Am. J. Sci. 241, 469–490. doi:10.2475/ajs.241.8.469
Chen, C. Z., Gan, R., Feng, D. M., Yang, F., and Zuo, Q. T. (2022). Quantifying the contribution of SWAT modeling and CMIP6 inputting to streamflow prediction uncertainty under climate change. J. Clean. Prod. 364, 132675. doi:10.1016/J.JCLEPRO.2022.132675
Chen, D. S., Li, J., Zhang, Y. M., Zhang, C., and Zhou, Z. X. (2020). Quantification and simulation of supply, demand and flow of water provision service in the Yanhe watershed, China. Acta Eco Sin. 40, 112–122. doi:10.5846/stxb201811132456
Feng, T. J., Wei, W., Chen, L. D., Rodrigo-Comino, R., Die, D., and Feng, X. R. (2018). Assessment of the impact of different vegetation patterns on soil erosion processes on semiarid loess slopes. Earth Surf. Process. Landforms. 43, 1860–1870. doi:10.1002/esp.4361
Feng, X. Y., Huang, B. B., Li, R. N., and Zheng, H. (2020). Response characteristics of ecosystems and soil conservation services to future climate change in the Three-Rivers region, China. Acta Ecol. Sin. 40, 6351–6361.
Fisher, B., Turner, R. K., and Morling, P. (2009). Defining and classifying ecosystem services for decision making. Ecol. Econ. 68, 643–653. doi:10.1016/j.ecolecon.2008.09.014
Fryear, D. W., and Bilbro, J. D. (2001). Rweq: Revised wind erosion equation models. Technol. Soil Water Conservation 02, 20–28.
Fu, B. J., Tian, H. Q., Tao, F. L., Zhao, W. W., and Wang, S. (2020). Progress of the impact of global change on ecosystem services. China Basic Sci. 22, 25–30.
Fu, B. J., Wang, S., Liu, Y., Liu, J. B., Liang, W., and Miao, C. Y. (2017). Hydrogeomorphic ecosystem responses to natural and anthropogenic changes in the loess Plateau of China. Annu. Rev. Earth Planet. Sci. 45, 223–243. doi:10.1146/annurev-earth-063016-020552
Fu, B. J., Zhang, L. W., Xu, Z. H., Zhao, Y., Wei, Y. P., and Skinner, D. (2015). Ecosystem services in changing land use. J. Soils Sediments 15, 833–843. doi:10.1007/s11368-015-1082-x
Gao, H. D., Li, Z. B., Jia, L. L., Li, P., Xu, G. C., Ren, Z. P., et al. (2016). Capacity of soil loss control in the Loess Plateau based on soil erosion control degree. J. Geogr. Sci. 26, 457–472. doi:10.1007/s11442-016-1279-y
Geneletti, G. (2013). Assessing the impact of alternative land-use zoning policies on future ecosystem services. Environ. Impact Assess. Rev. 40, 25–35. doi:10.1016/j.eiar.2012.12.003
Guo, L. J., Liu, R. M., Men, C., Wang, Q. R., Miao, Y. X., Muhammad, S., et al. (2021). Multiscale spatiotemporal characteristics of landscape patterns, hotspots, and influencing factors for soil erosion. Sci. Total Environ. 779, 146474. doi:10.1016/j.scitotenv.2021.146474
Haiyan, H. Y. (2021). Impacts of soil conservation measures on runoff and soil loss in a hilly region, Northern China. Agric. Water Manag. 247, 106740. doi:10.1016/j.agwat.2021.106740
Jiang, T., Lv, Y. R., Huang, J. L., Wang, Y. J., Su, B. D., and Tao, H. (2020). New scenarios of CMIP6 model (SSP-RCP) and its application in the Huaihe River basin. Adv. Meteorological Sci. Technol. 10, 102–109.
Kang, H. H., Pan, T., Gai, A. H., and Liu, Y. Q. (2017). Effects of ecological degradation and restoration on soil conservation function in three rivers headwater region. Bull. Soil Water Conservation 37, 7–14. doi:10.13961/j.cnki.stbctb.2017.03.002
Li, Z. Y., and Fang, H. Y. (2016). Impacts of climate change on water erosion: A review. Earth-Science Rev. 163, 94–117. doi:10.1016/j.earscirev.2016.10.004
Liang, L. L. (2019). Quantitative assessment and map-making on ecosystem services supply, demand and flow of soil erosion conservation and flood regulation based on SPANs model. Linfen: Shanxi Normal University. [master’s thesis]. [Linfen].
Liang, X., Liu, X. P., Li, X., Chen, Y. M., Tian, H., and Yao, Y. (2018). Delineating multi-scenario urban growth boundaries with a CA-based FLUS model and morphological method. Landsc. Urban Plan. 177, 47–63. doi:10.1016/j.landurbplan.2018.04.016
Liu, H., Liu, Y. X., Zhao, W. W., and Peng, D. (2021). Soil conservation assessment via climate change and vegetation growth scenarios in the Nile River basin. J. Mt. Sci. 18, 863–877. doi:10.1007/S11629-020-6304-Z
Liu, H. M., Liu, L. Y., Ren, J. Y., Bian, Z. Q., and Ding, S. Y. (2017). Progress of quantitative analysis of ecosystem service flow. Chin. J. Appl. Ecol. 28, 2723–2730. doi:10.13287/j.1001-9332.201708.025
Liu, Y., and Zhao, L. (2019). Assessing soil loss control and sediment reduction services of forest following process-effect-function-service cascade framework. Resour. Environ. Yangtze Basin 28, 883–892.
Ndrc, N. D. R. C. (2010). Outline of comprehensive control plan for loess Plateau region (2010-2030). China: National Development and Reform Commission.
O'Neill, B. C., Kriegler, E., Ebi, K. L., Kemp, B. E., Riahi, K., Rothman, D. S., et al. (2017). The roads ahead: Narratives for shared socioeconomic pathways describing world futures in the 21st century. Glob. Environ. Change 42, 169–180. doi:10.1016/j.gloenvcha.2015.01.004
Ouyang, Z. Y., Zheng, H., Xiao, Y., Polasky, S., Liu, J. G., Xu, W. H., et al. (2016). Improvements in ecosystem services from investments in natural capital. Science 352, 1455–1459. doi:10.1126/science.aaf2295
Rao, E. M., Xiao, Y., Ouyang, Z. Y., and Zheng, H. (2013). Spatial characteristics of soil conservation service and its impact factors in Hainan Island. Acta Ecol. Sin. 33, 746–755.
Shi, C. X. (2006). A quantitative analysis of the effects of wind erosion on sediment yield in the Wudinghe River watershed. Geogr. Res. 25, 285–293.
Shi, Z. H., Fang, N. F., Wu, F. Z., Wang, L., Yue, B. J., and Wu, G. L. (2012). Soil erosion processes and sediment sorting associated with transport mechanisms on steep slopes. J. Hydrology 454, 123–130. doi:10.1016/j.jhydrol.2012.06.004
Sun, W. Y., Shao, Q. Q., and Liu, J. Y. (2014). Assessment of soil conservation function of the ecosystem services on the loess Plateau. J. Nat. Resour. 29, 365–376.
Syrbe, R., and Walz, U. (2012). Spatial indicators for the assessment of ecosystem services: Providing, benefiting and connecting areas and landscape metrics. Ecol. Indic. 21, 80–88. doi:10.1016/j.ecolind.2012.02.013
Tarboton, D. G. (1997). A new method for the determination of flow directions and upslope areas in grid digital elevation models. Water Resour. Res. 33, 309–319. doi:10.1029/96WR03137
Wang, J. L., and Zhou, W. Q. (2019). Ecosystem service flows: Recent progress and future perspectives. Acta Ecol. Sin. 39, 4213–4222.
Wang, S. J. (2007). Comparison of sediment and runoff yield processes between different geomorphic regions in the Wudinghe River Basin. Geogr. Res. 26, 508–517.
Wang, S., Wang, H. Y., Xie, Y. S., and Luo, H. (2019). Evaluation of ecological service function of soil conservation before and after Grain for green project in yan’an city. Res. Soil Water Conservation 26, 280–286. doi:10.13869/j.cnki.rswc.2019.01.041
Wang, S. Y., Wang, G. Q., and Chen, Z. Y. (2005). Relationship between land use and soil erosion in Yellow River Basin. J. Nat. Disasters 14, 32–37.
Wang, T., Zheng, S. L., Li, S. Q., and Zhang, H. (2018). Temporal-spatial distribution of soil conservation and its dynamic changes in northern area of Shanxi. J. Arid Land Resour. Environ. 32, 188–195. doi:10.13448/j.cnki.jalre.2018.225
Wang, Y. D., Li, J., Zhou, Z. X., and Wang, Y. D. (2022). Simulation and analysis of supply, demand and flow of soil conservation service in the Wuding River watershed, China. J. Soil Water Conservation 36, 1–8. doi:10.13870/j.cnki.stbcxb.2022.03.020
Wang, Y. Z. (2019). A simulation of the spatial flow of soil conservation service on the basis of Service Path Attribute Nerworks Model. Linfen: Shanxi Normal University. [master’s thesis]. [Linfen].
Wang, Y. Z., Dong, Y. F., and Su, Z. A. (2020). Assessment of soil erosion change under land use and reforestation scenarios. J. Nat. Resour. 35, 1369–1380.
Xiao, J. Y., Xie, B. G., Zhou, K. C., Shi, S. N., Li, J. H., Yang, M. X., et al. (2021). Assessment of soil erosion in the Dongting Lake basin, China: Patterns, drivers, and implications. PloS one 16, e026182. doi:10.1016/j.scitotenv.2021.146474
Xiao, Y., Xie, G. D., Lu, C. X., and Xu, J. (2016). Involvement of ecosystem service flows in human wellbeing based on the relationship between supply and demand. Acta Ecol. Sin. 36, 3096–3102. doi:10.5846/stxb201411172274
Xin, Z. B., Ran, L. S., and Lu, X. X. (2012). Soil erosion control and sediment Load reduction in the loess Plateau: Policy perspectives. Int. J. Water Resour. Dev. 28, 325–341. doi:10.1080/07900627.2012.668650
Yang, C. L., and Qin, F. C. (2010). Study on dynamic of land use pattern in Dagoutou watershed. Res. Soil Water Conservation 17, 82–86.
Yao, H. F., Shi, C. X., Shao, W. W., and Bai, J. B. (2015). Using SWAT model to simulate the discharge of the Xiliugou in Inner Mongolia. J. Arid Land Resour. Environ. 29, 139–144. doi:10.13448/j.cnki.jalre.2015.201
Yin, C. C., Zhao, W. W., and Pereira, P. P. (2022). Soil conservation service underpins sustainable development goals. Glob. Ecol. Conservation 33, e01974. doi:10.1016/J.GECCO.2021.E01974
Yu, D. L., Shao, M. A., Xue, Y. F., and Yu, S. E. (2011). Soil-water conservation effects of slope land use pattern changes. Trans. CSAE 27, 22–27.
Zhang, S. H., Fan, W. W., Li, Y. Q., and Yi, Y. J. (2017). The influence of changes in land use and landscape patterns on soil erosion in a watershed. Sci. Total Environ. 574, 34–45. doi:10.1016/j.scitotenv.2016.09.024
Zhao, W. W., Liu, Y., Daryanto, S., Fu, B. J., Wang, S., and Liu, Y. X. (2018). Metacoupling supply and demand for soil conservation service. Curr. Opin. Environ. Sustain. 33, 136–141. doi:10.1016/j.cosust.2018.05.011
Zhao, Y., Liu, B., Zhang, X. M., and Bao, S. Z. (2020). Study on flood and sediment yield under extreme precipitation in the Wuding River basin of the Yellow River. J. Sediment Res. 45, 47–52. doi:10.16239/j.cnki.0468-155x.2020.06.008
Zheng, T. (2021). Simulation and analysis of soil conservation service flow in the ecosystem of Jinghe River basin. Xi’an: Xi’an University of Science and Technology. [master’s thesis].
Keywords: soil conservation service, spatial flow, land-use optimization, SWAT model, Wuding River watershed
Citation: Wang Y, Liu X, Li J, Wang Y, Bai J and Zhou Z (2022) Quantifying the spatial flow of soil conservation service to optimize land-use pattern under ecological protection scenarios. Front. Earth Sci. 10:957520. doi: 10.3389/feart.2022.957520
Received: 01 June 2022; Accepted: 21 July 2022;
Published: 29 August 2022.
Edited by:
Riccardo Scalenghe, University of Palermo, ItalyReviewed by:
Alessandro Buscaroli, University of Bologna, ItalyYanxu Liu, Beijing Normal University, China
Copyright © 2022 Wang, Liu, Li, Wang, Bai and Zhou. This is an open-access article distributed under the terms of the Creative Commons Attribution License (CC BY). The use, distribution or reproduction in other forums is permitted, provided the original author(s) and the copyright owner(s) are credited and that the original publication in this journal is cited, in accordance with accepted academic practice. No use, distribution or reproduction is permitted which does not comply with these terms.
*Correspondence: Xianfeng Liu, bGl1eGlhbmZlbmc3OTg3QDE2My5jb20=; Jing Li, bGlqaW5nQHNubnUuZWR1LmNu