
95% of researchers rate our articles as excellent or good
Learn more about the work of our research integrity team to safeguard the quality of each article we publish.
Find out more
REVIEW article
Front. Earth Sci. , 23 November 2022
Sec. Sedimentology, Stratigraphy and Diagenesis
Volume 10 - 2022 | https://doi.org/10.3389/feart.2022.956912
This article is part of the Research Topic Applications of E-Beam Automated Mineralogy, Petrography and Petrology View all 12 articles
 Shujun Han1,2*†
 Stefan C. Lӧhr1,3*
 April N. Abbott4
 Andre Baldermann5
 Juraj Farkaš3
 William McMahon6
 Kitty L. Milliken7
 Mehrnoush Rafiei1Cassandra Wheeler1
 Michael Owen8
Sedimentary rocks contain a unique record of the evolution of the Earth system. Deciphering this record requires a robust understanding of the identity, origin, composition, and post-depositional history of individual constituents. Petrographic analysis informed by Scanning Electron Microscope - Energy Dispersive Spectroscopy (SEM-EDS) mineral mapping can reveal the mineral identity, morphology and petrological context of each imaged grain, making it a valuable tool in the Earth Scientist’s analytical arsenal. Recent technological developments, including quantitative deconvolution of mixed-phase spectra (producing “mixels”), now allow rapid quantitative SEM-EDS-based analysis of a broad range of sedimentary rocks, including the previously troublesome fine-grained lithologies that comprise most of the sedimentary record. Here, we test the reliability and preferred mineral mapping work flow of a modern Field-Emission scanning electron microscope equipped with the Thermofisher Scientific Maps Mineralogy mineral mapping system, focusing on mud/siltstones and calcareous shales. We demonstrate that SEM-EDS mineral mapping that implements 1) a strict error minimization spectral matching approach and 2) spectral deconvolution to produce ‘mixels’ for mixed-phase X-ray volumes can robustly identify individual grains and produce quantitative mineralogical data sets comparable to conventional X-ray diffraction (XRD) analysis (R2 > 0.95). The correlation between SEM-EDS and XRD-derived mineralogy is influenced by mineral abundance, processing modes and mapped area characteristics. Minerals with higher abundance (>10 wt%) show better correlation, likely the result of increased uncertainty for XRD quantification of low-abundance phases. Automated spectral deconvolution to produce ‘mixels’ greatly reduces the proportion of unclassified pixels, especially in the fine-grained fraction, ultimately improving mineral identification and quantification. Mapping of larger areas benefits bulk mineralogy analysis, while customized area size and shape allows high-resolution in situ mineralogical analysis. Finally, we review SEM-EDS-based mineral mapping applications in the Earth Sciences, via case studies illustrating 1) approaches for the quantitative differentiation of various mineral components including detrital (allogenic), syndepositional (authigenic) and burial diagenetic phases, 2) the origin and significance of lamination, 3) the effectiveness and appropriateness of sequential leaching in geochemical studies, and 4) the utility of mineral maps to identify target grains within specific petrological contexts for in situ geochemical or geochronological analysis.
The sedimentary archive preserves a key record of the evolution of the biosphere and the Earth’s surficial processes (Davies et al., 2020). A range of physical and chemical processes acting on geological materials result in the alteration, decomposition and neoformation of sedimentary constituents. Therefore, any given sedimentary rock is potentially comprised of components of varying origin, composition and age. These components may record the complex histories of sedimentary rocks and the materials from which they derive, starting with protolith emplacement and continuing through weathering, erosion, transportation (re)deposition and diagenesis. For example, detrital particles in sedimentary rocks originated from physical weathering processes can record a signal of provenance, weathering regime and depositional process (Velde and Meunier, 2008). Authigenic phases may precipitate contemporaneously with the deposition of this detrital material or during early diagenesis. Together with contemporaneous biological archives such as (micro)fossils, these detrital and authigenic sedimentary constituents record climatic and hydrodynamic conditions, water chemistry and temporal changes in the biosphere. Combining these records allows for detailed paleoenvironmental reconstruction via a range of biological, sedimentological, mineralogical and geochemical proxies (Chamley, 1989; Bristow et al., 2009; Flügel and Munnecke, 2010). However, post-depositional processes, which include burial or meteoric diagenesis, hydrothermal activity and varying grades of metamorphism may alter the sediment and the proxy records it contains (Day-Stirrat et al., 2010; Arvidson and Morse, 2014; Rafiei and Kennedy, 2019; Skinner et al., 2019; Frank et al., 2020; Abbott et al., 2022). Once re-exposed at the Earth surface, these partially overprinted sedimentary rocks are subjected to erosion and alteration, starting a new round of weathering and rock recycling. In summary, while sedimentary rocks provide an invaluable window into the temporal evolution of conditions across Earth’s surface, post-depositional alteration may obscure the identity, origin, and fidelity of sedimentary constituents. Suitable approaches for determining primary, unaltered sedimentary components are thus key for recognizing environmentally relevant sediment-hosted signatures.
A wide range of petrographic, mineralogical, geochemical and modelling tools and approaches exist which may be deployed to address issues of the temporal evolution on Earth’s surface evolution (Moore and Reynolds, 1989; Xiao et al., 2010; Lerman and Clauer, 2014; Li and Schoonmaker, 2014; Cui et al., 2018; Llovet, 2019; Frank et al., 2020; Abbott et al., 2022). Amongst these, automated scanning electron microscope (SEM) energy dispersive spectroscopy (EDS) mineral mapping technology (Gottlieb et al., 2000; Gu, 2003; Kotula et al., 2003; Grauch et al., 2008; Schulz et al., 2020) is a relatively unknown and currently underutilized, but potentially ground-breaking tool. The coupling of X-ray spectroscopic mineral identification with high resolution SEM imaging provides petrographic and textural information about sedimentary rocks with which the origin and geological significance of each individual grain can theoretically be inferred (Rafiei and Kennedy, 2019; Rafiei et al., 2020). In addition, automation allows the scanning of large, representative areas by stitching together individual images and EDS datasets collected on smaller sample segments to achieve the required resolution (Grauch et al., 2008). This ultimately allows the production of sample images in which high-resolution visual details are complemented by a mineralogy layer identifying the nature of each imaged grain (Figure 1). This new approach is far more efficient than manual SEM imaging with EDS point analysis of individual grains, potentially allowing a fundamentally distinct, quantitative approach to sedimentary petrography (e.g., Rafiei et al., 2020). In addition, the large-scale images and compositional maps created greatly facilitate the targeting of individual grains in particular petrographic contexts at the micro-scale for detailed follow-up analysis via an increasing array of in situ or solution (micro-drilled) geochemical, isotopic and geochronology analytical tools (Hennekam et al., 2015; Sosa-Montes de Oca et al., 2018; Redaa et al., 2021; Redaa et al., 2022; Subarkah et al., 2022).
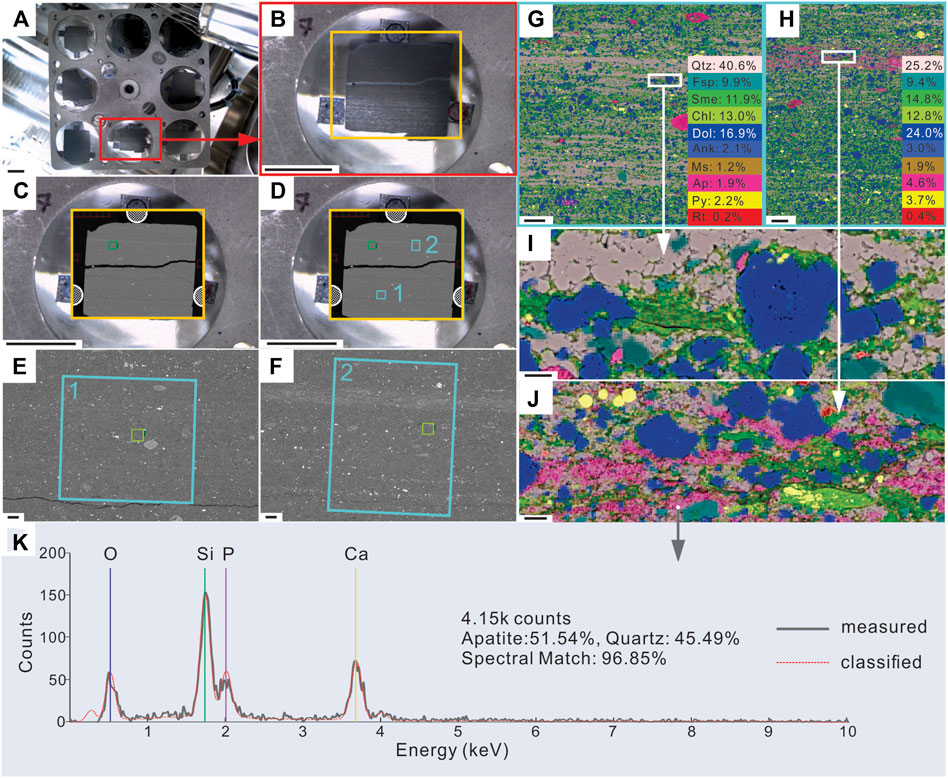
FIGURE 1. Mineral mapping workflow, from collection of sample overview BSE image to classification of an individual EDS spectrum. Scale bars represent 10 mm in (A–D), 100 μm in (E–H), 10 μm in (I,J). Minerals identified and mapped include Qtz, quartz; Fsp, feldspar; Sme: smectite, Chl, chlorite; I, illite; I/S, illite-smectite mixed-layer; Cal, calcite; Dol, dolomite; Ank, ankerite; Ms, muscovite; Ap, apatite; Py, pyrite; Rt, rutile. (A) Nav-Cam photo of the multi-sample stage allowing automated analysis of up to eight samples; (B) zoomed In Nav-Cam image of sample Qlk7, the orange rectangle shows the area selected for collection of a BSE overview scan; (C) stitched BSE overview image of sample Qlk7. The green box outlines a single BSE tile (1 mm × 1 mm, ∼ 0.5 µm pixel resolution), the overview image comprise 21 × 17 individual tiles stitched into a single image; (D) the blue rectangles identify the position of two ROIs selected for higher resolution BSE imaging and mineral mapping (i.e., collection of EDS spectra at 2 µm spacing) (E–F) stitched BSE images of ROIs one and two from (D), which are comprised of 13 × 12 and 12 × 15 individual tiles respectively. The light green boxes outline a single BSE tile (100 μm × 100 μm, ∼50 nm pixel resolution). These tiles are smaller than the tiles in (C) and (D) resulting in far better resolution (G,H) false-colour SEM-EDS-based mineral maps overlaid on BSE images of ROIs 1 (G) and 2 (H), showing mineral proportions. ROI1 contains more quartz and less dolomite or apatite than ROI2, which is also evident in their respective mineral maps; White boxes indicate areas further zoomed in for i and j. (I–J) Zoomed in images showing texture, grain morphology and phase associations (K) an example of a classified, mixed-phase EDS spectrum for intergrown quartz and apatite from the indicated white point on (J).
Although increasingly used to probe fundamental but otherwise intractable questions in the Earth Sciences (Pirrie et al., 2004; Hoal et al., 2009; Rollinson et al., 2011; Anderson et al., 2014; Vermeesch et al., 2017; Abbott et al., 2019; Rafiei and Kennedy, 2019; Rafiei et al., 2020; Schulz et al., 2020; Abbott et al., 2022), major limitations including the perceived lack of quantitative data and mineral misidentification have hampered the broader application of SEM-EDS mineral mapping (Johnson et al., 2015; Spaleta et al., 2020). This problem is particularly pertinent for fine-grained samples, defined here as mudrocks, including siltstone, mudstone and shale. These fine-grained rocks constitute the primary archive of information regarding Earth system change through time (Bristow et al., 2009; Bristow et al., 2012; Ilgen et al., 2017; Rafiei and Kennedy, 2019; Wei and Algeo, 2020a). Mineral identification relies on comparison of measured EDS spectra with synthetic spectra or standard spectra obtained from well characterized mineral specimens and is affected by the quality of both the measured spectra and data processing. Spectral quality is controlled by the condition of the specimen (e.g., surface roughness) as well as the operation of the EDS system (Newbury and Ritchie, 2013; Schulz et al., 2020) while the data processing relies on complete spectral or phase databases as well as suitable software tools, mineral identification protocols, and researcher discretion. Although previous studies comparing automated SEM-EDS mineralogy with quantitative XRD obtain broad agreement, discrepancies have been reported, especially for clay minerals and other fine grained components (Ayling et al., 2012). Such discrepancies can largely be attributed to the data processing limitations of traditional SEM-EDS mineral mapping, whereby the presence of mixed phases or multiple minerals with similar elemental composition (e.g., solid solutions) result in misidentification or no classification at all (Schulz et al., 2020). These problematic scenarios are typical of fine-grained lithologies, where mixed EDS spectra arise from the presence of multiple mineral constituents in the X-ray generating volume such as when the dimensions of individual grains are commonly smaller than the X-ray generating volume beneath the electron beam (Spaleta et al., 2020), or at mineral boundaries (Ayling et al., 2012; Johnson et al., 2015).
While all SEM-EDS processing techniques have a way of dealing with mixed pixels, most require the creation of multiple, tightly defined mixed phases, a time intensive process that requires a high degree of analyst expertise and is particularly challenging for fine-grained, clay-bearing lithologies. For example, traditional SEM-EDS mineral mapping systems such as Qemscan® assign a single mineral to each pixel (EDS spectrum) during data processing, and then apply user-defined multidimensional compositional fields to identify specific mineral phases, including mixed phases (Ayling et al., 2012; Schulz et al., 2020). This approach allows identification and quantification of simple, coarse-grained geological samples if the composition of the mineral phases present within a pixel are different enough that their compositional fields do not intersect, but remains difficult for fine-grained or clay-bearing rocks, such that SEM-EDS mineral mapping is rarely applied to mudstones or siltstones. Newer data processing approaches allow a mineral to be identified by computing an error score relative to a spectral reference for each mineral. The algorithm chooses the mineral that minimizes the error score, eliminating much of the potential user introduced uncertainty. This approach also allows for the interpolation between end-points in a solid solution and it can be used to distinguish the relative proportion of multiple minerals within a pixel; such as when the pixel falls on the boundary of minerals grains or incorporates multiple smaller grains and thus produce mixed spectra. This “mixel” approach provides a new, automated way to deal with mixed phases and improve mineral identification and quantification in SEM-EDS mineral mapping, particularly for fine-grained lithologies.
Here we test the use of Maps Mineralogy and Nanomin®, a novel SEM-EDS mineral mapping system developed by Thermofisher Scientific (formerly FEI Company), to investigate sedimentary rocks with a large proportion of fine-grained minerals. We show that data processing approaches which incorporate deconvolution of mixed X-ray spectra largely avoid mineral misidentification. This accuracy opens up a much greater proportion of the geological record to this technique. We discuss the advantages and limitations of SEM-EDS mineral mapping versus conventional XRD techniques for generating quantitative mineralogical data. We also explore the impact of region of interest (ROI) selection protocol (i.e., area and shape) for accurate “bulk” mineralogical quantification in homogeneous versus heterogeneous samples demonstrating that the selection of the sample area to be mapped is a critical step in the use of automated SEM-EDS mineral mapping tools. We explore and assess the novel capabilities of advanced SEM-EDS mineral mapping in addressing otherwise intractable problems in the Earth Sciences, illustrated using several case studies. These include 1) approaches for the quantitative differentiation of mineral components of detrital (physical versus chemical weathering), syndepositional (authigenic) and burial diagenetic origin, 2) the origin and significance of lamination, 3) a new approach for evaluating the effectiveness of sequential leaching in geochemical studies, and 4) the utilization of mineral maps to target specific mineral phases for in situ geochemical or geochronological analysis.
We evaluate the performance of SEM-EDS-based mineral identification and quantification by comparison to XRD-derived quantitative data, and by checking that grains identified in SEM-EDS match with grain outlines and characteristic mineral morphologies in backscatter electron (BSE) images. For these comparisons, 16 fine-grained rock samples were selected from the shale interbeds of the second member of the Ediacaran Doushantuo Formation at two different sites in the Yangtze Gorges Area, South China (Han et al., 2022): 1) the Sixi Section (30°45′25.8″ N, 110°55′51.0″ E) and; 2) the Qinglinkou Section (30°48′0.2″ N, 110°55′18.5″ E), which together include one black shale, 10 dolomitic shales and five shaly dolostones (Supplementary Table S1). A complementary dataset was obtained from Enorama Shale (Cryogenian Umbertana Group), Brachina Formation (Ediacaran Wilpena Group) and Bunyeroo Formation (Ediacaran Wilpena Group), which crop out within Brachina Gorge, central Flinders Ranges (South Australia; Rafiei et al., 2020). These locations include six finely laminated siliciclastic mudstones to siltstones (Rafiei et al., 2020) and span the Global Stratotype Section and Point (GSSP) for the Ediacaran Period. These two sets of samples are both sedimentary archives close to the boundary between Precambrian and Cambrian, documenting major environmental changes in Earth history. This combined sample set covers the majority of fine-grain lithologies found at the Earth surface, and provides good examples to understand detrital versus authigenic mineral assemblages (Rafiei et al., 2020).
Sample blocks with a 1–2 cm2 surface were cut perpendicular to the bedding plane and prepared as 30 mm diameter resin mounts with the cross section exposed. The resin mounts were polished by standard mechanical polishing techniques and subsequently ion milled using a Hitachi IM4000 Argon Ion Mill (15 min, 12° beam incident angle, 5 kV accelerating voltage and continuous sample rotation) to remove remaining surface damage. The specimens were then carbon coated for subsequent SEM imaging and mineral mapping.
The SEM imaging and SEM-EDS mineral mapping were carried out using a FEI Teneo LoVac field emission instrument equipped with dual Bruker XFlash 6/30 EDS detectors. Whole-of-sample (overview) BSE image tile sets (12 mm working distance; 15 kV accelerating voltage) were obtained and stitched using the Maps Mineralogy software (version 3.1). These overview BSE images were used to identify representative sample areas for optimal ROI placement. High-resolution BSE images (100 nm pixel resolution) and EDS spectra (1–2 µm step size/pixel resolution, 8 ms acquisition time, 3,000–6,000 counts per pixel) were subsequently collected for each ROI (Figure 1). One to two ROIs were analyzed per sample (20 ROIs over 16 samples), with ROI size ranging between 0.08 and 9.19 mm2 (Table 2; see Section 3.3). EDS spectra were classified using the Nanomin software (version 3.18), where mineral identification is achieved by comparison of individual EDS spectra to reference spectra collected on known mineral standards (Abbott et al., 2019; Frank et al., 2020; Rafiei et al., 2020). A full list of minerals included in the “mineral recipe” used for classification and the measurement parameters are given in Supplementary Table S2; the mineral list was informed by independent XRD-based mineral characterization of the samples. Mineral concentrations (reported as wt%) in the mapped areas are determined by converting the mineral area % to wt% using published densities for all identified sample constituents.
The Nanomin algorithm classifies individually measured EDS spectra by computing an error score relative to a subset of mineral reference spectra stored in a reference library (organized in user-defined “mineral recipes”), with the resulting classification being the mineral that incurs the lowest error score. Importantly, the algorithm can deconvolve mixed EDS spectra and assign up to three minerals per analyzed single spot (producing “mixels”), explicitly recognizing and resolving complex mineral mixtures that occur in the electron-beam excitation volume of a typical fine-grained material. Together with the implementation of “mixels”, the implementation of an error minimization-based classification with a strict goodness of fit cutoff (90% by default) has the potential to significantly improve mineral identification and quantification compared to previous generations of SEM-EDS mineral mapping tools, whilst requiring substantially less analyst input.
We evaluate the quality of mineralogy data from SEM-EDS mineral mapping by comparison to quantitative XRD results (see Section 3.2). To this end, we calculate the residual between mineral abundances obtained from SEM-EDS mineral mapping and XRD analysis [wt% (Residual) = wt% (SEM-EDS mineral mapping) - wt% (XRD)]. To determine the impact of spectral deconvolution allowing multiple minerals to be distinguished in each analytical volume, we process each dataset using both: 1) the three minerals per pixel (“mixel”) and 2) the one mineral pixel mode, and subsequently compared the results for each sample (see Section 3.3). To explore optimal ROI selection (see Section 3.4), sub-ROIs of varying size (∼5 mm2 and smaller) and geometry are placed on two samples that represent a homogenous lithology (SX22_1) and a heterogenous, laminated lithology (Qlk 6).
Subsamples for XRD analysis were cut next to the mineral mapping subsamples, crushed to powder in a Rock Labs RM100 Disc Mill and micronized (1–5 μm size range) with ethanol (Kleeberg et al., 2008) for 5 minutes in a McCrone mill with corundum beads. Samples were then oven dried and homogenized, before back loading into 23 mm stainless steel sample holders for analysis. XRD patterns spanning 3.5°–95° 2θ were collected using a Malvern Panalytical Aeris tabletop XRD instrument (Co radiation source with 40 kV generator voltage and 15 mA tube current, PIXcel3D-Medipix3 1×1 detector, 1/4-inch divergence slits) with 0.022° step size and total count time of 13 min. Diffraction patterns were interpreted using the Panalytical HighscorePlus software with the ICSD database for phase identification, phase quantification utilized Rietveld refinement as described in Richoz et al. (2017).
SEM-EDS mineral mapping and XRD analysis show that the Doushantuo Formation shale, dolomitic shales and dolostones mainly consist of dolomite (0–75.3 wt%), quartz (3.8–62.6 wt%), feldspar (0–33.1 wt%), clay minerals (4.3–34.4 wt%) and some accessory minerals (<0.5 wt%) such as rutile and zircon (Figures 1G,H; Figure 2A). Clay minerals are the main phases in the fine grain fraction of all samples. The dominant clay phases are smectite (saponite), chlorite (Mg-rich; clinochlore) and smectite-chlorite mixed-layer clay, often associated or intergrown with each other as described in more detail in Section 4.2. Brachina Gorge samples from Rafiei et al. (2020) are siliciclastic siltstones to mudstones. They have similar ranges of quartz and feldspar as the Doushantuo Formation samples, but with a higher clay mineral content (29–59 wt%) and only minor carbonate content (0–6 wt%) (Figure 2D). The Brachina Gorge samples contain a higher abundance of clastic material than the Doushantuo Formation samples. Their clay mineral contents are dominated by illite and chlorite with no smectite.
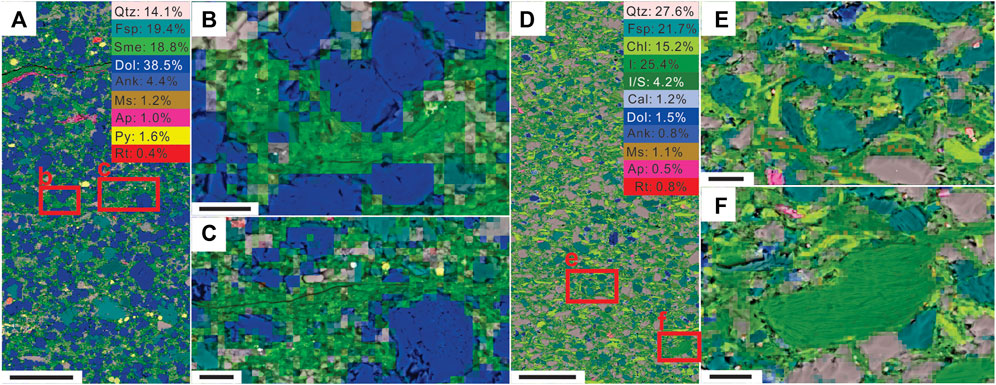
FIGURE 2. Representative mineral maps of the Doushantuo Formation (A–C) and Brachina Gorge (D–F) samples, overlaid on BSE images. Scale bars in (A) and (D) represent 100 μm; scale bars on zoomed in regions of interest (B,C,E,F) represent 10 μm. See Figure 1 for mineral legend details. Samples from the Doushantuo Formation are more calcareous and contain finer clay minerals, while the Enorama Shale is more siliceous and contains larger clay and mica flakes with discrete grain boundaries and cleavage.
We evaluate the accuracy of Nanomin mineral identification using two approaches. First, we compare the mineral boundaries assigned by Nanomin to the mineral boundaries in co-located BSE images. Overall, this shows good agreement, with only a few unclassified pixels (Figures 1, 2; Table 2). The diagnostic grain boundaries and differences in contrast identifying the diagnostic crystal forms (e.g., dolomite, pyrite) evident in BSE images (Figures 1, 2, 9) closely align with the boundaries defined by SEM-EDS mineral mapping.
Secondly, we compare SEM-EDS- and XRD-based mineral quantification. This shows a strong linear correlation (see Section 3.2) and near-identical mineral ranges (Supplementary Tables S1,S3) except for minor minerals such as rutile and zircon, minerals that mostly occur at concentrations beneath the XRD detection limit (León-Reina et al., 2016).
Up to eleven major mineral phases were detected both by mineral mapping and XRD in the 16 Doushantuo Formation samples, equating to 220 XRD and SEM-EDS mineral mapping data points across the 20 ROIs (Figures 3A, Supplementary Table S1). Together with the 48 previously published Brachina Gorge data points from Rafiei et al. (2020), this comparison of SEM-EDS and quantitative XRD data points shows a strong linear correlation (R2 = 0.98) with the trendline falling very close to the ideal 1:1 line (slope = 0.97) and a y-intercept that is very close to 0 (0.25; Figure 3A). The strength of this relationship at the individual mineral level is also strong, but does show some variation. Minerals which occur at higher abundances or across a greater range (e.g., quartz, dolomite, feldspars, illite/muscovite) generally display a stronger correlation between XRD and SEM-EDS than low abundance/range minerals (e.g., pyrite, kaolinite) (Table 1; Figures 3B–D). In general, the slope and R2 of the trendlines are closer to 1.0 for higher abundance minerals. Minerals present at elevated abundances (>10 wt%) have R2 values larger than 0.85 and slopes between 0.8 and 1.2, while less abundant minerals comprising <10 wt% (mostly <5 wt%, except 6 wt% for hematite) show lower R2 values or scatter away from the theoretical 1:1 line (Figures 3B–D).
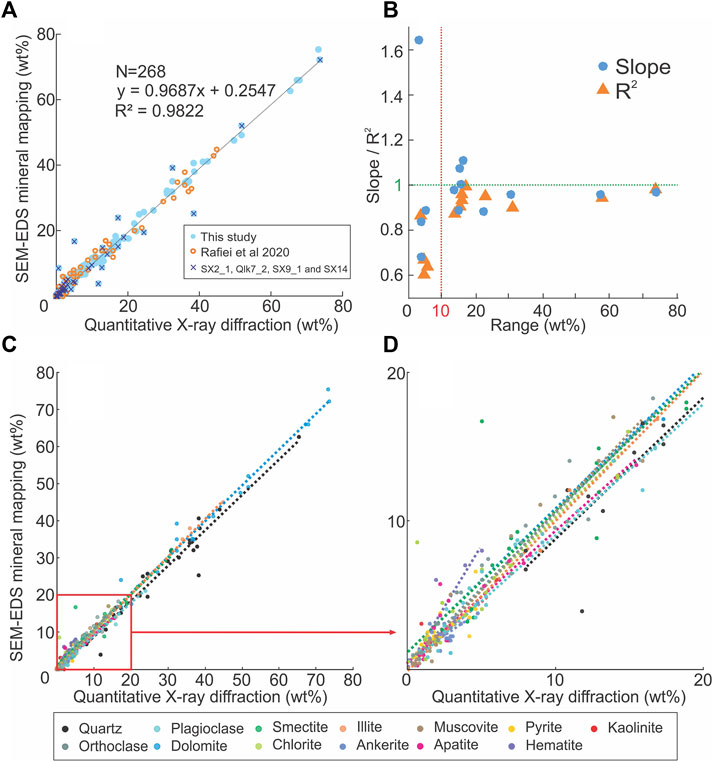
FIGURE 3. Correlation between mineral abundance independently determined by quantitative XRD versus SEM-EDS mineral mapping. (A), Cross plot of XRD mineralogy (x-axis) and SEM-EDS mineral mapping mineralogy (y-axis). Blue points represent data from this study. Dark blue crosses represent data points from four ROI (SX2_1, Qlk7_2, SX9_1, SX 14—see Section 4.1). Empty orange points represent data from Rafiei et al. (2020). (B), Cross plot of mineral abundance range (max-min; x-axis) versus slope and R2 values (y axis). Blue filled circles represent slope values and orange filled triangles represent R2 values. Minerals with ranges >10 wt% show a consistently stronger correlation between mineral abundances obtained from SEM-EDS mineral mapping and XRD analysis. (C), Cross plot of XRD mineralogy (x-axis) and SEM-EDS mineral mapping mineralogy (y-axis) for individual mineral types. Strong correlation overall is evident, but minerals present at less than 10 wt% across all samples show weaker correlations between XRD and SEM-EDS mineral mapping. (D), zoomed in plot of panel (C) from 0 to 20%.
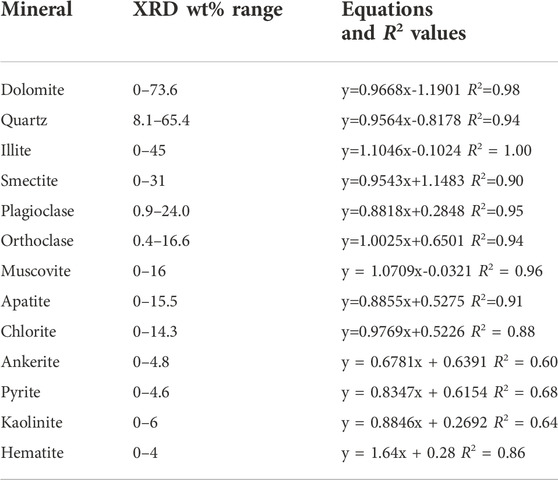
TABLE 1. Equations and R2 values of trend lines in Figures 3C,D.
To evaluate the effectiveness of the multi-phase approach, which produce “mixels” to deal with mixed phases, we reprocessed the same dataset allowing only one mineral to be identified per pixel and compared it with the results presented in Section 3.2 (which featured mixels with up to three minerals per pixel). Our results show that an average of 28.6% of each ROI remains unclassified when processed using the single pixel mode, reflecting the abundance of mixed phases in the X-ray generating volume across major parts of these fine-grained samples. The strict error (goodness of fit) cut-off we use (90% spectral match) means that these mixed signals are not matched to any single mineral reference spectra. Consistent with this, most unclassified pixels are on the boundaries of minerals and within the fine-grain fraction (Figure 4). In contrast, where the data is processed permitting a maximum of three minerals per pixel “mixel” mode, the average unclassified area of each ROI is only 1.1% (Table 2), a reduction by more than one order of magnitude.
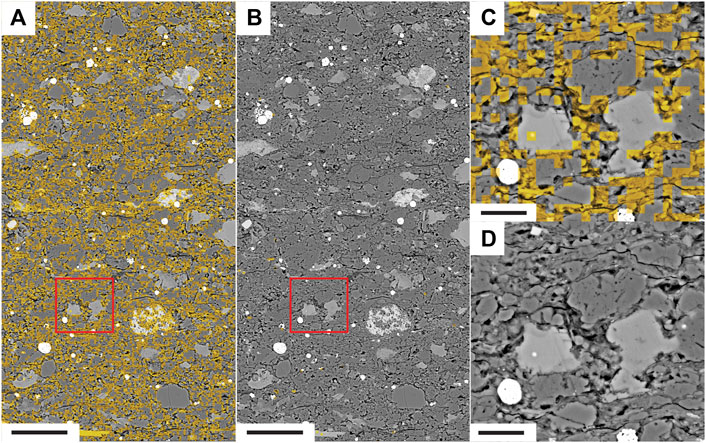
FIGURE 4. Comparison of one mineral per pixel versus three minerals per “mixel” modes reveals 27-fold greater proportion of unclassified pixels in single mineral per pixel mode. Scale bars represent 50 μm in (A,B) and 10 μm in (C,D). Yellow shading indicates unclassified areas. BSE image of SX22 with mineral map overlay showing unclassified area for (A) one mineral mode and (B) three minerals mode. (C,D) are zoom in images of red squares in (A,B) respectively. Unclassified pixels are concentrated in the fine-grained matrix and at boundaries of larger grains.
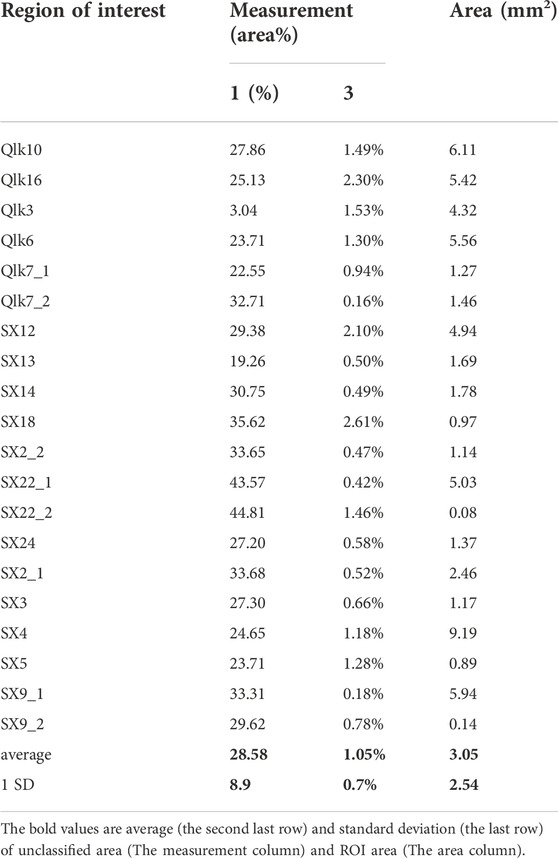
TABLE 2. Unclassified proportion obtained from one mineral mode versus three minerals mode.
Surprisingly, the dataset processed using the single pixel mode still shows a strong correlation between SEM-EDS mineral mapping and XRD results (R2 = 0.94, Supplementary Table S3). This is because the conversion of mineral area% to mineral wt% involves the normalization of total mineral areal abundances to 100 wt%. While this step corrects to some degree for the high proportion of unclassified pixels, close inspection of our results shows that this normalization also masks systematic errors associated with the single pixel mode. Importantly, there is significantly more scatter away from the 1:1 line than in the three mineral “mixel” mode (compare Figure 3A versus Figure 5A). As a result, the mean residual between mineral mapping and XRD mineralogy for the one mineral per pixel mode is 2.5 times larger than in the “mixel” mode (residuals of 2.3% compared to 0.9% respectively). Furthermore, not all minerals are impacted to the same degree by this correction. The abundance of coarser grained minerals such as fine sand to silt size quartz, feldspar and dolomite is systematically overestimated in the one-pixel mode, showing trendlines with slopes larger than 1, whereas fine-grained components are systematically underestimated with slopes consistently lower than 1 (e.g., slope is 0.76 for smectite; Figure 5B, Table 3). This pattern reflects the tendency of coarse-grained material to produce “pure” or single-phase X-ray spectra, except at grain boundaries, whereas fine-grained materials are more consistently associated with other fine-grained mineral components and hence more likely to produce mixed-phase X-ray spectra that remain “unclassified” (unless the spectral deconvolution of the “mixel” mode is employed).
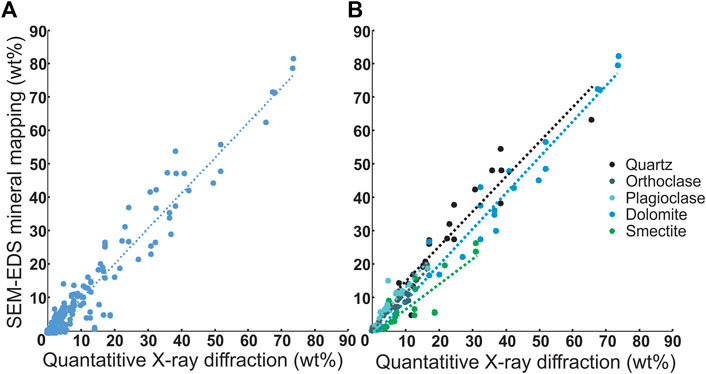
FIGURE 5. Comparison of XRD versus SEM-EDS mineral mapping (one mineral per pixel mode) shows significantly increased scatter away from the 1:1 line compared to the three minerals per “mixel” mode, and slopes for individual minerals that are significantly different to 1. (A) All data points, N = 220; (B) Data points of five major minerals (average wt% > 5%) N = 100.
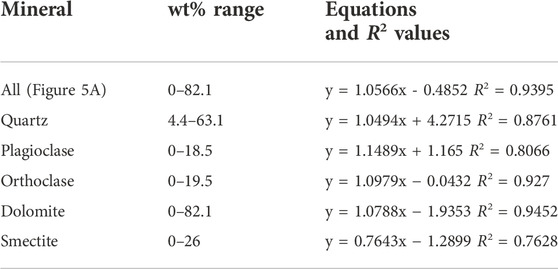
TABLE 3. Equations and R2 values of trend lines shown in Figure 5.
In summary, the large reduction in unclassified pixels and better match to bulk XRD shows that the automated spectral deconvolution of “mixel” mode accurately and effectively deals with mixed phases. This approach has the advantage of being a universally applicable, mathematical error minimization approach which does not require active user input or definition of bespoke mixed phases.
Our results demonstrate that SEM-EDS mineral mapping can accurately identify individual mineral grains and, in aggregate, produce quantitative mineralogical data consistent with that obtained by bulk sample XRD analysis. However, given that samples can be texturally and mineralogically heterogenous, appropriate ROI placement and geometry is key for obtaining reproducible bulk mineralogical data from SEM-EDS mineral mapping. We explore this here by comparing the impact of ROI placement and ROI size on bulk mineral results obtained for two very different samples: the first sample is relatively homogeneous (SX22_1; Figure 6), the other sample is laminated with major micro-scale textural and mineralogical variability (Qlk6; Figure 6). Both samples show good correlation between mineral mapping results and quantitative XRD results when using large ROIs (∼5 mm2) placed to ensure they are representative of the overall sample, with residuals consistently below 3 wt% (average <1 wt%).
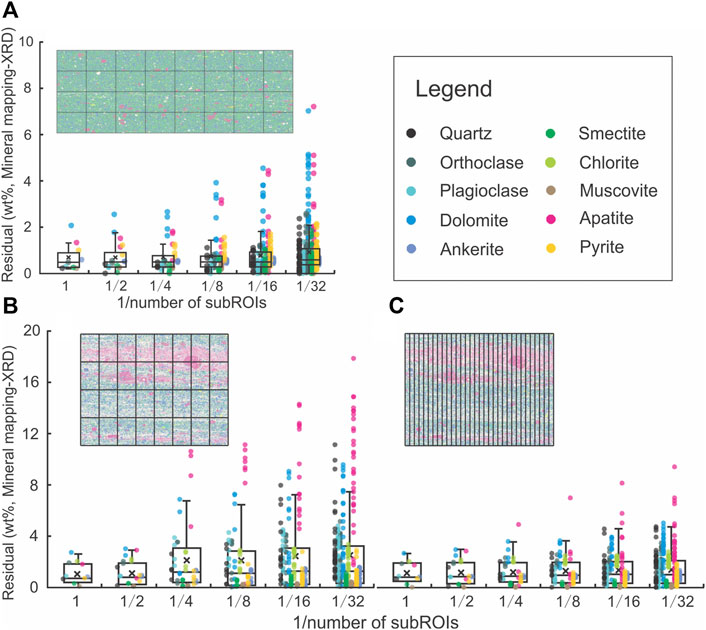
FIGURE 6. Box plots of mineral mapping-XRD residual for a homogeneous and a heterogenous sample highlighting the increasing difference and reduced reproducibility between bulk sample XRD composition and SEM-EDS mineral composition with decreasing ROI size. wt% (Residual) = wt% (SEM-EDS mineral mapping) - wt% (XRD). (A) Box plot of mineral mapping-XRD residual for homogeneous sample SX22_1 and mineral map overview image at 50% transparency. (B,C) Box plot of SEM-EDS mineral mapping-XRD residual for laminated sample Qlk6 ROI1 and mineral map overview image at 50% transparency with gridded ROIs (B) and columnar ROIs perpendicular to bedding (C). ROIs organized as vertical columns (C) provided results more consistent with bulk mineralogy for samples with significant compositional heterogeneity (e.g., mineralogically distinct laminae).
“We divided larger ROIs of both samples” larger ROIs into 2 (∼2.5 mm2), 4 (∼1.3 mm2), 8 (∼0.6 mm2), 16 (∼0.3 mm2) and 32 (∼0.15 mm2) equal-sized sub-ROIs (Figure 6). Comparison of SEM-EDS-based mineralogical data from the smaller sub-ROIs with XRD results shows that the greatest differences in mineral abundances between the two methods occurs with SEM-EDS-based mineralogy data obtained from the smallest sub-ROIs (Figure 6). While the average and median difference in SEM-EDS-based mineral abundance across all sub-ROIs versus XRD data only increases slightly with decreased sub-ROI size, the frequency and magnitude of outliers increases substantially with decreasing ROI size (Figure 6), demonstrating the importance of adequate ROI size for producing reproducible quantitative mineralogy from SEM-EDS mineral mapping even in relatively homogeneous samples.
In addition to the size of the sub-ROI, the shape and alignment of the sub-ROI also impacts on the agreement between SEM-EDS mineralogy and XRD mineralogy as measured by the residuals. The discrepancy between SEM-EDS and XRD mineral abundances is higher and more variable for the laminated sample Qlk6 when the sub-ROIs are divided as a grid than when the sub-ROIs are arranged as columns perpendicular to bedding (Figure 6). The residual values of Qlk6_1 in the gridded sub-ROIs range from 0 to 17.8 wt% and have averages from 1.2 wt% (whole study region) to 2.6 wt% (32 sub ROIs), which is much higher than for the homogeneous sample SX22_1 (0–7.17 wt%, averaging from 0.7 to 0.9 wt%). In contrast, when we use sub-ROIs that are arranged as columns for the laminated sample SX22 (Figure 6C), we find the residuals are similar between Qlk6 and SX22, ranging from 0 to 9.4% with averages from 1.2% (whole study region) to 1.4% (32 sub-ROIs for each sample).
We stress that the greater residuals (i.e., differences between SEM-EDS- and XRD-derived mineralogy) for the gridded ROI pattern versus the column ROI pattern does not reflect incorrect SEM-EDS-based mineralogy results within the gridded ROIs. Instead, the larger residuals reflect grid ROI geometry, size and positioning resulting in the mapped area being compositionally different to the average composition of the bulk sample for vertically heterogeneous samples. Indeed, one of the major advantages of SEM-EDS mineral mapping is the ability to target specific regions of the sample, for example to identify mineralogical differences between adjacent laminae or beds, something which cannot be accessed using bulk mineralogical techniques which only return average sample values. We discuss potential applications of this advantage in Section 4.2.3.
The strong linear correlation between quantitative bulk mineralogy obtained via powder XRD analysis versus SEM-EDS mineral mapping demonstrates the accuracy of SEM-EDS mineral identification and quantification, both for fine-grained calcareous (N = 220, R2 = 0.98) and siliciclastic (N = 48, R2 = 0.98) sedimentary sequences (Figure 3A). This is further supported by the consistent agreement between mineral and grain boundaries observed in BSE images and EDS-based mineral maps (Figures 1, 2, 9). This confirms that the next-generation SEM-EDS techniques implementing the “mixel” approach are able to accurately deconvolve the mixed-phase X-ray volumes that are characteristic of fine-grained lithologies and along grain boundaries, with minimal analyst input or sample-specific modification, representing a major advance over traditional SEM-EDS mineral mapping approaches (Ayling et al., 2012; Johnson et al., 2015; Schulz et al., 2020). However, while the Nanomin® data reduction algorithm removes much of the manual data processing burden, and therefore limits user introduced error compared to earlier SEM-EDS mineral mapping technologies, this new and improved approach has key points that must be considered, which are highlighted below.
1. Our results show that accurate quantitative SEM–EDS derived “bulk” mineralogical data requires careful ROI placement on representative sample sections and consideration of optimal ROI size and geometry. This point highlights the advantages of whole-of sample BSE overview images to inform ROI placement (Section 3.4). Notable outliers (Figure 3A), where data points fall away from the one to one trend line, are confined to four of the twenty ROIs: SX2_1, Qlk7_2, SX9_1 and SX14 (Figure 3A). Three of these ROIs (SX2_1, Qlk7_2 and SX9_1) were specifically placed to characterize areas that are compositionally unusual by comparison to the rest of the sample (i.e., sample regions distinct to the sample average, Figures 1G,H), therefore we would not expected them to fall along the 1:1 trend which is defined by the bulk composition of the samples. By contrast, additional ROIs measured on these three samples specifically positioned to characterize a representative “average” portion of the sample do plot along the 1:1 line (not outliers). Sample SX14 is the sole exception. However, hand sample and SEM inspection of this dolomitic shale shows it to be highly heterogeneous, with compositionally variable laminae as well as irregularly distributed early diagenetic silica cements (silica nodules) and quartz veins. We therefore attribute the outlier data points from this sample to extreme sample heterogeneity, resulting in genuine compositional differences between the SEM-EDS and bulk XRD sample aliquots even after careful ROI placement.
2. The agreement between SEM–EDS mineral mapping and XRD mineralogy is affected by the amount of a mineral present. Overall, minerals with high abundances demonstrate a better agreement between the two methods. This is, at least in part, due to the difference between SEM-EDS and XRD detection and quantification limits. The XRD detection limit is around 0.5% for crystalline phases (quartz, rutile, etc.) but may increase for poorly crystalline phases or mixed-layer clay minerals (smectite, I-S, etc.), and only contents higher than 1.0 wt% may yield analyses with relative errors lower than 20% (León-Reina et al., 2016), although this error assignment is heavily phase dependent. Nevertheless, XRD-based quantification of minerals present at less than 5 wt% is heavily impacted by the uncertainty while those with proportions exceeding 10% are less likely to be significantly impacted. SEM-EDS mineral mapping, by contrast, can better identify and quantify minor mineral phases compared to XRD, provided that the mapped ROI area in sufficiently large to obtain a robust measurement.
3. Agreement between SEM-EDS versus XRD mineral quantification is dependent on the design and use of “mineral recipes” for spectral classification that are appropriate for the sample suite being studied. The mineral list available to the Nanomin mineral identification algorithm (i.e., the user-defined “mineral recipe” used for classification of a particular sample set) is a subset of a much larger mineral reference list in the spectral library. In the original implementation of Maps Mineralogy/Nanomin, it had been hoped that a reference list of ∼4,000 minerals could be used to analyze any geological sample without requiring additional constraints. However, given that there are many minerals that are compositionally very similar (e.g., compositionally identical polymorphs such as quartz and opal or pyrite vs. marcasite; or hydrous vs. anhydrous minerals such as gypsum and anhydrite or hematite vs. goethite which cannot be distinguished as EDS cannot measure H content; or compositionally similar minerals such as muscovite and illite), it proved impossible to differentiate them all reliably using SEM-EDS mineral mapping. Thus, the use of unconstrained mineral lists commonly introduces unrealistic answers, resulting in the erroneous identification of minerals that are not present in a particular sample (i.e., false positives). A user-defined subset of the larger reference list (“mineral recipe”) is therefore used for spectral classification. When designing these mineral recipes, it is important to consider the geological context of the sample suite and hence the mineral phases likely present. To minimize the risk of false positives we further recommend that “mineral recipe” design be informed by independent qualitative mineralogical characterization (e.g., by XRD analysis) of a subset of samples for each new project. This is particularly relevant where accurate mineral identification is important, such as specific polytypes, mineral polymorphism or interstratified phases.
4. The ability to assign multiple phases per “mixel” can result in overinterpretation of the results and requires caution. Let us consider for instance a pixel at the boundary between a pyrite (FeS2) grain and a calcite (CaCO3) grain. An inexperienced user will not notice the error when the boundary is classified as gypsum (CaSO4) in cases when the pixel is far enough away from the pyrite grain for the contribution of the Fe peak to fall near background levels, but the S peak is still large enough to be observed. At the same time, the Ca peak from calcite is quite large, so the mathematical minimum error is found to be gypsum. There are tuning parameters available in the classification process to try to prevent this error and favor geological sensible solutions rather than strictly the mathematical minimum, but the existence of such tuning parameters does re-introduce a degree of operator dependence. To reduce potential overinterpretation, users can check the overlying BSE images which can help to rule out overprinted results by comparison to petrographic features.
The Nanomin® SEM-EDS mineral mapping tool presented here facilitates detailed petrographic characterization of fine-grained clastic and carbonate rocks. This represents a fundamental advance, potentially permitting a new approach to a wide range of basic questions in the Earth Sciences that have previously remained difficult to address, as illustrated in the following case studies. We have chosen these examples with the aim of illustrating a broad range of novel applications, and hope to encourage broader uptake of sedimentary petrography as a versatile, complementary tool in the Earth scientist’s arsenal.
Authigenic minerals are sensitive recorders of paleoenvironmental conditions (Singer, 1980; López-Quirós et al., 2019; Baldermann et al., 2020; Gebregiorgis et al., 2020), with the consumption or release of various elements and their isotopes during authigenic mineral formation further serving as an important control on elemental budgets at the Earth’s surface (Abbott et al., 2019; Baldermann et al., 2022). Marine reverse weathering, i.e., the precipitation of authigenic clays from seawater or from pore-water during early diagenesis, is particularly important in this context. Not only is authigenic clay composition sensitive to fluid composition and pH (Tosca et al., 2011; Baldermann et al., 2017, 2013), offering a means to reconstruct the evolution of seawater chemistry over time (Turchyn and DePaolo, 2019; Strauss and Tosca, 2020; Baldermann et al., 2022) and Reverse weathering may have been a primary regulator of marine pH and atmospheric pCO2 during much of Earth’s history (Isson and Planavsky, 2018; Krissansen-Totton and Catling, 2020; Kalderon-Asael et al., 2021), given that authigenic clay formation was presumably favored in the Precambrian ocean due to elevated seawater Si and Fe concentrations relative to the Phanerozoic (Conley et al., 2017). However, the difficulty of distinguishing and quantifying clay minerals of authigenic versus detrital versus burial diagenetic origin using conventional approaches (see Rafiei et al., 2020) means that marine authigenic clays are rarely identified except in instances where they form macroscopic pellets or concretions, such as glauconite grains or celadonite vesicles in oceanic basalts (e.g., Tang et al., 2017; Strauss and Tosca 2020; Baldermann et al., 2022). Consequently, important hypotheses regarding the evolution of seawater and atmospheric composition, including links to the global carbon and silica cycles (Isson and Planavsky, 2018; Kalderon-Asael et al., 2021), which predict secular changes in the authigenic clay content of the marine sedimentary record, have remained largely untestable. Petrographic analysis powered by high resolution automated SEM-EDS mineral mapping, as presented in this study, can address many of these problems, given that authigenic clays preserve distinctive petrographic features which allows their identification and quantification (Figure 7).
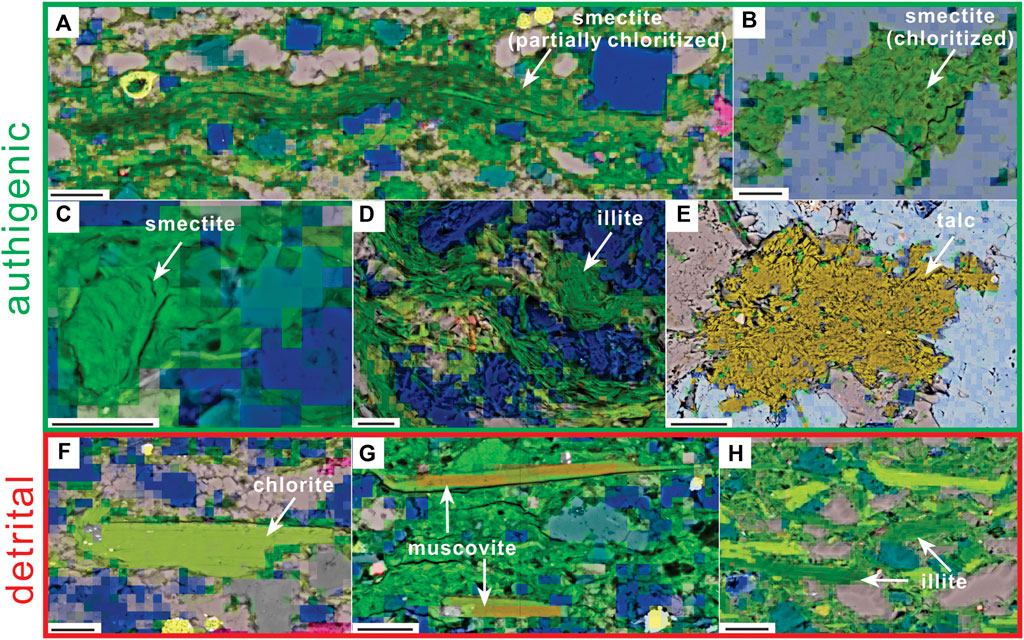
FIGURE 7. Representative petrographic images of authigenic and detrital clay minerals. Scale bars represent 10 μm. Mineral false colors are the same as in Figure 2 (A–G) are samples from the Doushantuo Formation. h is a sample from the Enorama Shale. (A) Wavy laminae of authigenic smectite (saponite, partially chloritized). Individual particles in wavy laminae display mostly bedding-parallel orientation, due to compaction; individual laminae are largely free of detrital grains, indicating they are not transported together with detrital fraction; (B) pore-filling chloritized saponite with individual particles showing random orientation due to sheltering from compaction. (C) Smectite intragranular pore-fill in feldspar. Feldspar helps to resist compaction so that smectite is randomly oriented; (D) fine-grained authigenic illite curved by compaction, showing distinct texture against detrital illite in (H); (E) authigenic talc concretion with individual particles randomly oriented; (F) detrital chlorite with discrete grain boundary and clear cleavage; (G) muscovite grains embedded in authigenic saponite; (H) detrital illite associated with other detrital minerals of similar size.
We use the Ediacaran Doushantuo Formation of South China as an example to explore these possibilities. The Doushantuo Formation represents a key record for understanding the evolution of eukaryotic life because it contains an abundance of well-preserved fossils, including candidates for the earliest metazoan life (Yin et al., 2016). Yet, to date, the environmental setting in which this important evolutionary step occurred remains disputed. The occurrence of saponite, a trioctahedral Mg-rich clay mineral that forms in a narrow range of environmental settings (Akbulut and Kadir, 2003; Bristow et al., 2009; Baldermann et al., 2014; Pozo and Calvo, 2018), at the center of the dispute. The presence of saponite in the second member of the Doushantuo Formation has been argued to require an alkaline lake or restricted marine depositional setting (Bristow et al., 2009), assuming that the saponite is of authigenic origin and hence recording local water chemistry. However, if the saponite is of detrital origin, originating as a terrestrial weathering product of mafic-ultramafic bedrock in the sediment source area as argued by others, then the Doushantuo Formation may have been deposited in an open marine setting (Huang et al., 2013). This ambiguity of the origin of the saponite highlights a fundamental limitation of previous studies: their reliance on bulk mineralogical and indirect geochemical techniques, both of which are unable to discriminate between detrital and authigenic saponite. But now with petrographic analysis informed by SEM-EDS mineral mapping it is possible to identify clay morphology, distribution and phase associations, and thus provide robust, semi-quantitative evidence of clay origin. Individual Doushantuo saponite crystals exhibits curvy, sheet-like, and fragile morphologies, typical of authigenic clays, and are concentrated in wavy laminae or pore-filling domains (Figures 1G–J, Figures 2A–C, Figure 7; Han et al., 2022). Saponite domains are affected by compaction, demonstrating a syndepositional origin (i.e., authigenic or detrital). The thin, fragile nature of the saponite clay particles means that they are unlikely to survive erosion and riverine transport, unlike the larger detrital clays which show discrete grain boundaries, more angular morphologies, and clear cleavage. Moreover, most saponite domains are free of detrital phases, indicating that saponite was not transported and deposited with other detrital grains (Figure 7). Most importantly, individual saponite particles show random orientation within larger aggregate grains and have diffuse contacts with neighboring grains and pore space; characteristics indicative of an early diagenetic, pre-compaction origin. We are thus able to conclude that the saponite is of syndepositional authigenic origin, and the extent of clay authigenesis in the Doushantuo is illustrated by the fact that authigenic saponite comprises ∼70% of the clay fraction, on average (Han et al., 2022). Furthermore, since saponite precipitation requires elevated Mg and Si (OH)4 concentrations, these observations suggest that the Doushantou Formation was deposited in a restricted and mildly evaporitic lagoonal setting, meaning that the Doushantuo biota did not evolve under normal open marine conditions (Bristow et al., 2009; Jiang et al., 2011; Han et al., 2022). This type of approach promises to identify the changing abundance of, and environmental controls on, marine clay authigenesis and reverse weathering over time.
Superimposed on tectonically and climatically driven cyclical changes in weathering intensity (Frings, 2019) the step-wise greening of the continents via the evolution of microbial mats, fungi, lichen and ultimately land plants has long been thought to have driven a secular change to the continental weathering regime (Algeo et al., 2001; Kennedy et al., 2006; Lenton and Daines, 2017; McMahon and Davies, 2018). This is challenged by conventional bulk mineralogy and geochemistry that suggest that the composition of sedimentary sequences has remained largely unchanged since the emergence of the first continents (Tosca et al., 2010; Wei and Algeo, 2020b; Lipp et al., 2021). A key limitation of bulk rock characterization approaches is their inability to differentiate sedimentary constituents that are products of weathering versus those arising from post-depositional alteration. This is particularly problematic given increasing evidence of extensive post-depositional, subsurface hydrolysis (“weathering”; Milliken, 2003), likely occurring under “wet” open-system conditions (Day-Stirrat et al., 2010) and producing similar mineral assemblages and geochemical signatures to those associated with terrestrial chemical weathering (Rafiei and Kennedy, 2019).
A petrographic approach utilizing SEM-EDS mineral mapping, by contrast, permits the quantitative differentiation of primary detrital phases versus secondary burial-alteration phases, as well as an assessment of the original “pre-alteration” sediment composition (as diagenetic phases commonly retain unaltered residues of precursor phases). Recent studies have used such an approach to investigate the Proterozoic continental weathering record. Black shales of the Mesoproterozoic Velkerri Formation, deposited in the McArthur Basin (NT, Australia), have been reported to exhibit key characteristics often ascribed to settings with intense chemical weathering (elevated proportions of kaolinite and illite but low feldspar, high Al2O3, Rafiei and Kennedy, 2019). Petrographic and geochemical analysis informed by SEM-EDS mineral mapping, however, demonstrates that these properties are associated with burial alteration of phases such as feldspar and mica, producing clay-rich mineral assemblages that are not representative of the original detrital composition. Instead of recording intense weathering prior to ultimate sediment deposition, the petrographically reconstructed detrital mineralogy shows only a minor clay content, indicating limited chemical weathering at this stage of the Mesoproterozoic but a high degree of post-depositional (burial diagenetic) overprinting (Rafiei and Kennedy, 2019). Similar results are obtained for mudrocks of the South Australian Enorama Shale (Cryogenian, 720 to 635 Ma) and Brachina Formation (lower Ediacaran), which are shown to be chemically immature and dominated by the products of physical weathering during the Ediacaran (Figure 8) with SEM-EDS petrographic techniques used to correct for the impact of burial diagenetic alteration (Rafiei et al., 2020). However, a sharp increase in pedogenic clay content (∼20%) in the mid-Ediacaran Bunyeroo Formation documents a shift from dominantly physical weathering to chemical weathering (Figure 8), potentially related to a hypothesized expansion of biotic soils during the Ediacaran Period (Kennedy et al., 2006; Knauth and Kennedy, 2009). These examples demonstrate the importance of incorporating a petrographic component in clay mineralogy and geochemical-proxy-based reconstructions of palaeoweathering conditions.
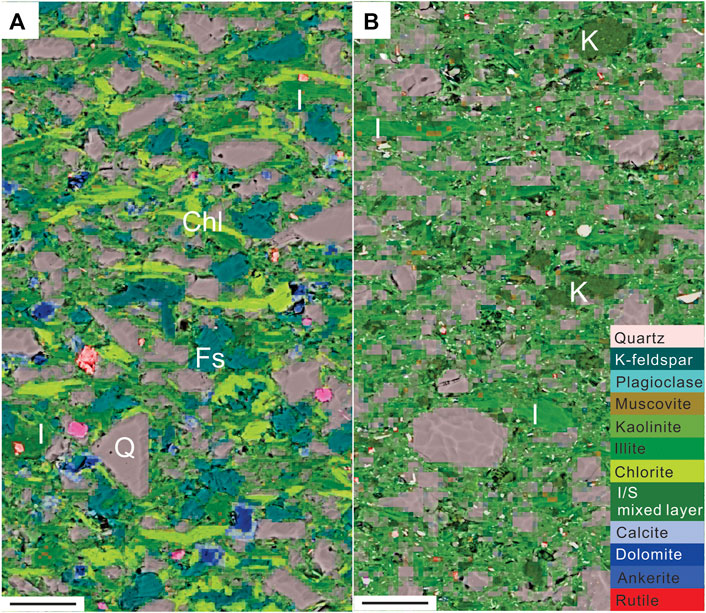
FIGURE 8. Representative petrographic images of the Cryogenian Enorama Shale (A) and the mid Ediacaran Bunyeroo Formation (B). Scale bars represent 20 μm. Minerals in Enorama Shale are mostly products of physical weathering (e.g., (sub)angular quartz and feldspar; coarse chlorite flakes), while minerals in Bunyeroo Formation show distinct features of pedogenic origin (e.g., patches of fine, randomly oriented illitic clays), arguing to intense chemical weathering. The enhanced chemical weathering from Cryogenian to mid Ediacaran could be mediated by expansion of terrestrial biomass during the Ediacaran Period (Rafiei et al., 2020).
Finely laminated, fine-grained sequences such as shales are commonly viewed as compositionally invariant. Despite laminations being a readily recognized and widely reported sedimentary feature important for interpreting depositional environments, subsurface fluid flow and reservoir properties as well as telling geological time. The compositional variation defining laminae is rarely documented, despite (O’Brien, 1996). SEM-EDS mineral mapping allows mineralogical variation to be determined and quantified at the sub-laminae scale, providing constraints on the causes and consequences of the high frequency paleoenvironmental or hydrodynamic/depositional variability recorded by laminae. We examine two examples to illustrate this.
The geological record identifies a strong bias toward organic carbon (OC) rich shales accumulating during greenhouse periods and OC that is intimately associated with fine-grained, chemically mature sediments. Permo-Carboniferous marine sediments in the Arckaringa Basin of Southern Australia, however, are an exception with anomalously high OC concentration of up to 11% total OC occurring within mineralogically immature siltstones that were deposited in deep, marine fjords in a proglacial setting (Debenham, 2015). SEM-EDS spot analyses and mineral mapping reveal an association between OC-rich laminae and high sulphur concentrations, occurring both bound to OC and in the form of framboidal pyrite. Pyrite and OM rich laminae alternate with organic poor laminae featuring abundant calcium manganese carbonate minerals (kutnohorite) at sub-mm scales (Figure 9). By analogy to Quaternary deposits of the Baltic Sea (Burke and Kemp, 2002), these couplets are likely to identify the seasonal oscillation of water column redox conditions. Pyrite deposition indicates local bottom-water or pore water euxinia whereas freshening results in precipitation of dissolved Mn as oxides which settle to the seafloor and ultimately convert into kuthnohorite. OC and pyrite enrichment can therefore be attributed to stratification in the ancient fjord, leading to H2S build up followed by mixing and bottom-water ventilation in response to seasonal temperature change. The reducing conditions of the fjord provided a chemical trap for Mn and S from seawater sulfate, with excess dissolved sulphur in the water column and sediment pores promoting the preservation of labile organic matter. By contrast, OC in kutnohorite rich laminae is mainly refractory terrigenous OC, consistent with limited preservation of labile marine OC due to improved bottom-water ventilation.
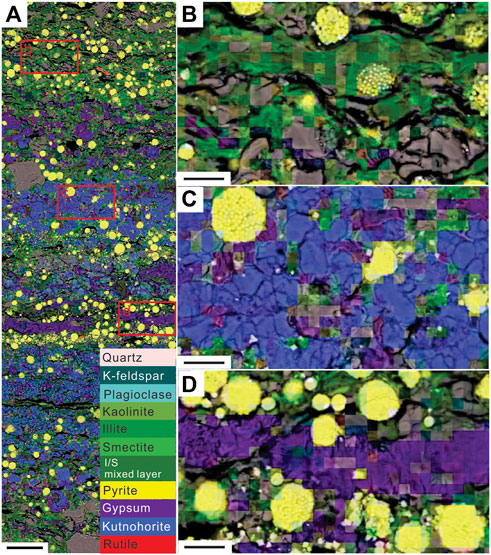
FIGURE 9. Representative petrographic images of laminated Permo-Carboniferous black shale from the Arckaringa Basin. Scale bars represent 50 μm in (A) and 10 μm in (B–D). Sub-millimetre laminae record seasonal oscillations in water column redox conditions, consistent with a periglacial, silled basin depositional setting. The occurrence of kutnohorite represents a return from periodical oxygenation to anoxic condition, finally resulting in the deposition of laminae rich in organic matter and framboidal pyrite under fully anoxic conditions. Importantly, these samples did not show evidence for compositional variation or lamination in hand sample, highlighting the commonly erroneous assumption that mudrocks are homogeneous and compositionally invariant.
Variably alternating laminae of detrital silicates, OM, calcite, Mg-carbonate and apatite in the late Eocene black shales of the Bohai Bay basin, China, identified by SEM-EDS mineral mapping, record seasonal to decadal scale changes in continental runoff, phytoplankton production, water column stratification and microbial reworking of OC (Xu et al., 2020, Figure 10). SEM-EDS-based mineralogical and petrographic characterization, coupled with mm-scale organic geochemical analysis of the Bohai Bay shales identified strong correlations between multiple organic geochemical parameters related to water body conditions and bacterial activity, the dolomite/calcite ratio of a given shale micro-layer, and the TOC content. These observations highlight the extent to which OC sequestration in lacustrine settings may be impacted by decadal or seasonal scale changes to water column stratification and photic zone euxinia.
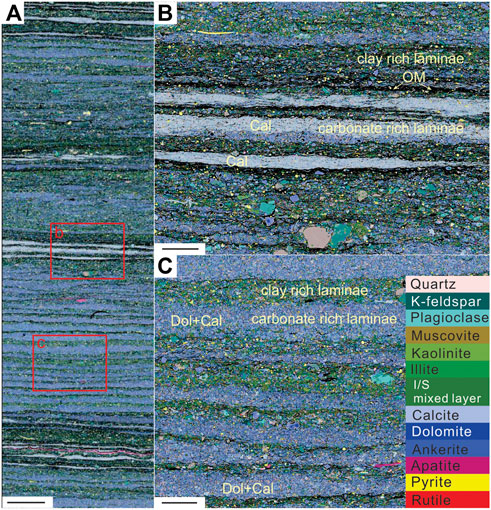
FIGURE 10. Representative petrographic images of laminated Eocene black shale in Bohai Bay Basin. Scale bars represent 500 μm in (A) and 100 μm in (B,C). (A) Overview image of laminated shale; (B) calcite laminae associated with OM rich laminae; (C) OM-poor clay laminae with dolomitic laminae. Laminae with different mineralogy host distinct organic geochemical features which cannot be recognized from bulk analysis.
In these examples, SEM-EDS mineral mapping enabled systematic and quantitative petrographic characterization which revealed that certain, apparently mundane, organic-rich fine-grained sediments are in fact markedly heterogeneous. The micron-scale, high resolution characterization of individual laminae provides detailed information of mineral texture and association which may help better constrain sediment origin. Automatic scans of large areas, in contrast, provide a contextual background and help distinguish laminae of different types, and their vertical alternating sets which record dynamic depositional environments and seasonal to annual climatic variability. These can then guide further high resolution or in situ geochemical analysis.
A wide range of elemental and isotopic proxies have been developed in an effort to deduce paleoclimatic and paleoceanographic change (e.g., proxies aimed at constraining marine redox conditions, ocean circulation, ice volume, phytoplankton productivity and organic carbon burial). Understanding the sedimentary phase or phases that host chemical signatures is critical to the interpretation of these records. In order to obtain meaningful environmental signals with which to reconstruct the local ocean conditions through time, signatures must be hosted within authigenic phases (e.g., carbonate cement, phosphate beds, foraminiferal shells, Fe-Mn oxyhydroxides) and analytical methods need to target these specific phases to avoid “contamination”. However, isotopic analytical techniques largely rely on operationally defined recovery methods such as sequential leaching to infer the target phase rather than direct observation (Du et al., 2016; Abbott et al., 2019; Horner et al., 2021). We explore the importance of constraining the context of geochemical records by considering two recent studies which combined SEM-EDS mineral mapping with traditional sediment leaching.
Neodymium (Nd) isotopes are widely used to reconstruct ocean circulation in the Earth’s past (Frank et al., 2002; Wilson et al., 2013; Homoky et al., 2016; Skinner et al., 2019; Abbott et al., 2022). Nd isotopes are thought to be quasi-conservative in the ocean, and because the residence time of Nd is less than typical ocean mixing times, Nd isotopes are regularly employed as a water mass tracer (e.g., Rutberg et al., 2000; Frank et al., 2002; Bayon et al., 2004). The Nd isotope signature of bottom water is then recorded in the sediments via authigenic biogenic components including foraminifera and fish debris, and within authigenic mostly abiogenic phases such as Fe-Mn oxy (hydr)oxides or phosphates (e.g., Elmore et al., 2011; Tachikawa et al., 2017). While the foraminifera and fish debris can be easily isolated and cleaned, the fine mineral precipitates require sequential leaching with indicators such as Fe/Al or Nd/Fe ratios often used to evaluate the success of the extraction protocol (Du et al., 2016; Skinner et al., 2019). Potential issues with leaching include the dissolution of non-target phases and redistribution through secondary precipitation (Wilson et al., 2013; Homoky et al., 2016; Skinner et al., 2019; Abbott et al., 2022). Using SEM-EDS mineral mapping, Abbott et al. (2019) showed that the authigenic Fe or Mn oxyhydroxide phases, widely assumed to be the primary sedimentary host phase for Nd isotopes, are not sufficiently abundant to account for the high Nd concentrations recovered from leaching. Iron in these sediments was instead largely associated with clay minerals including Fe-smectite, glauconite and chlorite. A clay mineral role in the benthic Nd cycle suggests that early diagenetic influences on any primary seawater Nd signature incorporated into the sediments may be significant and must be considered when interpreting such records.
The chromium (Cr) isotopic signature recovered from marine authigenic phases is increasingly used as a proxy for Earth surface redox conditions, yet at present there is no standard, verified technique for extracting “authigenic” Cr from siliciclastic sedimentary materials. Frank et al. (2020) used SEM-EDS mineral mapping and step-wise sediment leaching on Cambrian- and Ediacaran-aged black shales to examine which sedimentary phases sequential leaching for Cr isotope analyses were targeting. As with Nd, Cr in authigenic phases is assumed to represent a primary seawater signature, but unintentional dissolution of detrital Cr-bearing phases can compromise this pristine marine signature. Using SEM-EDS mineral mapping to image the leach residue after each step of leaching to identify which phases were being targeted (Figure 11), Frank et al. (2020) found that the majority of the Cr in the analyzed shales were hosted in the silicate fraction. The SEM-EDS mineral mapping also allowed them to confirm that the authigenic phosphates and carbonates could be isolated with sequential leaching, demonstrating that the similarity between the Cr isotopic signature of the authigenic phases and the detrital Cr isotopic signature was not just a consequence of the leach targeting an unintentional (detrital) phase (Frank et al., 2020). This finding suggests that authigenic phases experience diagenetic overprinting of the primary seawater signature, so that siliciclastic sediments may only rarely preserve a primary marine Cr signature, consistent with recent similar results for other isotope systems (Abbott et al., 2022).
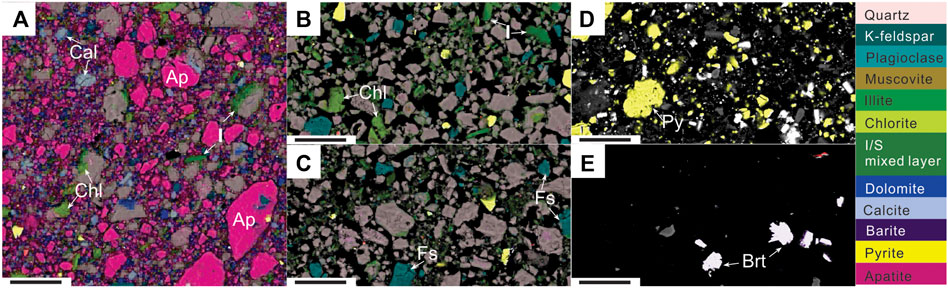
FIGURE 11. Representative petrographic images of step leaching products for Cr isotope analysis. Scale bars represent 20 μm. In addition to the mineral legend on the right, key minerals are labeled: barite (Brt), calcite (Cal), apatite (Ap), feldspar (Fs), pyrite (Py), illite (I), and chlorite (Chl). (A) Pre-leach material; (B) same sample after a 0.5 M HCl leach which visibly removed the highly reactive mineral phases, e.g., carbonates and phosphates; (C) after an additional 6 M HCl leach which dissolved moderately reactive mineral phases e.g., clay minerals; (D) following a third leach with HF that dissolved the bulk of silicate minerals; (E) after a fourth leach of Aqua Regia that dissolved any remaining mineral phases, but contributed to secondary barite precipitation. The visual results helped to check the target phases for geochemical analysis, confirming the separation of detrital and authigenic phases. The bright mineral in (E) is barite, which is very bright in the BSE image making the purple false color overlay almost invisible.
Wider application of in situ geochemical approaches such as core scanning XRF (providing continuous mm-resolution records up to 10s of meters long; Croudace and Rothwell, 2015; Falster et al., 2018) or µm-scale in in-situ laser-ablation mass spectrometric analyses of individual grains or sediment laminae (Jilbert and Slomp, 2013; Sosa-Montes de Oca et al., 2020) increasingly provide paleoenvironmental records at the centennial to seasonal scale. When combined with SEM-EDS mineral mapping, these approaches promise to reveal the drivers and rate of environmental change, as well as previously unavailable constraints on the extent of high-frequency, high-amplitude environmental variability (see also Section 4.2.3). Placing these findings into a robust temporal framework requires radiometric dating of sedimentary sequences. A major advance in this context is the in situ, microscale application of beta-decay geochronometers such as Rb-Sr, K-Ca, Lu-Hf, and Re-Os. Recent developments in reaction cell mass spectrometry now allow parent-daughter isobaric overlaps to be resolved online, when coupled to laser ablation this technology permits in situ dating of individual grains or phases in their petrogenetic context (Zack and Hogmalm, 2016; Hogmalm et al., 2017; Redaa et al., 2021; Simpson et al., 2021; Scheiblhofer et al., 2022; Subarkah et al., 2022). This major advance provides simple, rapid, and low-cost alternative approaches to constraining the depositional age of sedimentary sequences where well-preserved, contaminant-free, unaltered authigenic phases (e.g., glauconite, illite, apatite, pyrite) of sufficient size are present. This means that petrographic characterization and screening of samples and target grains prior to in situ analysis is key for obtaining geologically meaningful results.
SEM-EDS mineral mapping can potentially play a role here, providing the information required to identify unaltered suitable grains of the target phase, as well as a BSE and mineral map which facilitates laser targeting. We illustrate this here using the recent work which focuses on in situ Rb-Sr dating of seemingly pristine vs. diagenetically modified (i.e., illitized) glauconite (Löhr et al., 2021). Glauconite, an authigenic clay commonly found in marine sediments, presents as mm-scale pellets, and has long been a target phase for Rb-Sr and K-Ar geochronology. Since glauconite is prone to burial alteration which can impact Rb-Sr systematics and consequently any obtained ages, the targeted grains must be well preserved and free of impurities (Scheiblhofer et al., 2022). SEM-EDS mineral mapping has been used to identify and characterize a range of altered to well-preserved glauconite grains within exposed lower Cambrian sedimentary sequences from the Arrowie (South Australia) and Amadeus (Central Australia) basins, which were subsequently targeted for in situ Rb-Sr dating (Figure 12, Löhr et al., 2021). The results show that the presence of alteration phases such as illite and carbonate affected the obtained in-situ Rb-Sr ages, emphasizing the need for petrographic observation prior to in situ Rb-Sr dating.
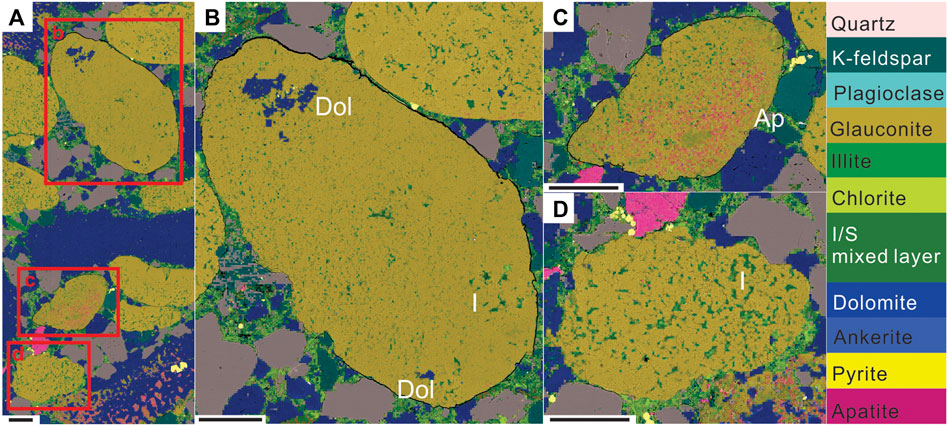
FIGURE 12. Representative petrographic images of glauconite-bearing, dolomitized sandstones from the lower Cambrian Tempe Formation in the Amadeus Basin for in situ Rb-Sr dating. Scale bars represent 100 μm. (A) A 1.8 × 0.8 mm overview image of sample H41; (B) glauconite grains with dolomite and illite inclusions; (C) glauconite grain with apatite and illite inclusions; (D) glauconite grain with illite inclusions. The mineral mapping visualize impurities of the targeted mineral, which can guide the sample selection for Rb-Sr dating and inform the data interpretation.
Beyond the detailed examples outlined above, EDS mineral mapping at high resolution offers valuable information broadly across sedimentary petrology. For example, pores, analogously to mineral components, can represent diverse origins, primary and secondary, and also varying relationships with respect to the detrital grains, inter- versus intra-granular. Placing pore formation into the correct context of burial history is essential to prediction and requires knowledge of the mineralogy and paragenesis of pore walls that can only be obtained by direct inspection at the appropriate scale (Milliken and Curtis, 2016). The SEM-EDS information could further be assisted by other approaches (e.g., μ/n CT methods) for 3D purposes.
Assessment of the detrital grain assemblage is another broad area in which high-magnification study of mineralogy and fabric allows more accurate determinations. Grain assemblage characterization serves two main areas, one backward-looking to the source of grains (provenance analysis; Dickinson et al., 1983; Folk et al., 1970), the other a forward-looking approach to predict the evolution of rock properties in the subsurface (reservoir quality prediction; Ajdukiewicz and Lander, 2010). The main grain types employed in both types of grain studies are quartz (Q), feldspar (F), and lithic grains (L). For the lithic grains (small fragments of the actual source lithologies), high-resolution SEM-EDS mineral mapping provides rich detail that allows for the accurate determination of grain type, even in silt-size particles (e.g., Milliken et al., 2019, 2017).
This study demonstrates that with multiple mineral identification per pixel to produce “mixels”, SEM-EDS-based mineral identification and quantification produces quantitative level in situ mineralogy data comparable to conventional XRD quantification while retaining the visible petrographic information provided by high resolution SEM images. Additionally, SEM-EDS mineral mapping can detect minor components in abundances below the detection limit for XRD. However, collecting representative results is still user dependent, with the selection of the ROI particularly important. We show that an area of 1 mm2 is an ideal ROI for obtaining the representative bulk mineralogy of fine-grained samples. The analysis of smaller areas provided less accurate quantitative results. The orientation of these ROIs is also important, with a column-like ROIs aligned perpendicular to the bedding best suited for bulk mineralogy (equivalent to XRD). However, a row-like ROI aligned parallel to the bedding is best suited for the investigation of mineralogical variation, such as that between laminations. Our case studies demonstrate that the coupling of quantitative mineralogical data with high-resolution petrographic information is a powerful tool to provide new insights that can guide geochemical protocols and resolve previous intractable paleoenvironmental and paleodepositional questions in Earth Science studies.
Conceptualization: SL. Investigation: SH, SL, AB, MR, and CW. Visualization: SH. Supervision: SL, AA. Writing—original draft: SH, SL, and AA. Writing—review and editing: SL, AA, AB, WM, KM, MO, CW, MR, and SH.
This work was conducted at Macquarie University while SH was a cotutelle student of China University of Geosciences Beijing and Macquarie University supervised by SL and AA, and funded by China Scholarship Council (No. 201906400045; to SH), the Australian Research Council (DP210100462; grant to JF and SL) and the Australia-New Zealand IODP Consortium (ANZIC), which provided Legacy funding via several grants to SL and AA. ANZIC is supported by the Australian Government through the Australian Research Council’s LIEF funding scheme [LE160100067].
We thank Sean Murray for lab work assistance, and Ananyaa Deepak, Hannah Wilson and Hafiz Shahid Hussain for helpful discussions.
MO was employed by Thermofisher Scientific.
The remaining authors declare that the research was conducted in the absence of any commercial or financial relationships that could be construed as a potential conflict of interest.
All claims expressed in this article are solely those of the authors and do not necessarily represent those of their affiliated organizations, or those of the publisher, the editors and the reviewers. Any product that may be evaluated in this article, or claim that may be made by its manufacturer, is not guaranteed or endorsed by the publisher.
The Supplementary Material for this article can be found online at: https://www.frontiersin.org/articles/10.3389/feart.2022.956912/full#supplementary-material
Abbott, A. N., Löhr, S., and Trethewy, M. (2019). Are clay minerals the primary control on the oceanic rare Earth element budget? Front. Mar. Sci. 6, 504. doi:10.3389/fmars.2019.00504
Abbott, A. N., Löhr, S. C., Payne, A., Kumar, H., and Du, J. (2022). Widespread lithogenic control of marine authigenic neodymium isotope records? Implications for paleoceanographic reconstructions. Geochim. Cosmochim. Acta 319, 318–336. doi:10.1016/j.gca.2021.11.021
Ajdukiewicz, J. M., and Lander, R. H. (2010). Sandstone reservoir quality prediction: The state of the art. Am. Assoc. Pet. Geol. Bull. 94, 1083–1091. doi:10.1306/intro060110
Akbulut, A., and Kadir, S. (2003). The geology and origin of sepiolite, palygorskite and saponite in Neogene lacustrine sediments of the Serinhisar-Acipayam Basin, Denizli, SW Turkey. Clays Clay Min. 51, 279–292. doi:10.1346/CCMN.2003.0510304
Algeo, T. J., Scheckler, S. E., and Maynard, J. B. (2001). “12. Effects of the middle to late devonian spread of vascular land plants on weathering regimes, marine biotas, and global climate,” in 12. Effects of the middle to late devonian spread of vascular land plants on weathering regimes, marine biotas, and global climate (Columbia University Press), 213–236. doi:10.7312/gens11160-013
Anderson, K. F. E., Wall, F., Rollinson, G. K., and Moon, C. J. (2014). Quantitative mineralogical and chemical assessment of the Nkout iron ore deposit, Southern Cameroon. Ore Geol. Rev. 62, 25–39. doi:10.1016/j.oregeorev.2014.02.015
Arvidson, R. S., and Morse, J. W. (2014). “9.3 - formation and diagenesis of carbonate sediments,” in Treatise on geochemistry. Editors H. D. Holland, and K. K. Turekian. Second Edition (Oxford: Elsevier), 61–101. doi:10.1016/B978-0-08-095975-7.00703-8
Ayling, B., Rose, P., Petty, S., Zemach, E., and Drakos, P. (2012). “QEMSCAN® (quantitative evaluation of minerals by scanning electron microscopy): capability and application to fracture characterization in geothermal systems,” in Thirty-Seventh Workshop on Geothermal Reservoir Engineering,, Stanford, CA, January 30–February 1, 2012.
Baldermann, A., Warr, L. N., Grathoff, G. H., and Dietzel, M. (2013). The rate and mechanism of deep-sea glauconite Formation at the ivory coast – Ghana marginal ridge. Clays Clay Min. 61, 258–276. doi:10.1346/CCMN.2013.0610307
Baldermann, A., Dohrmann, R., Kaufhold, S., Nickel, C., Letofsky-Papst, I., and Dietzel, M. (2014). The Fe-Mg-saponite solid solution series – a hydrothermal synthesis study. Clay Min. 49, 391–415. doi:10.1180/claymin.2014.049.3.04
Baldermann, A., Dietzel, M., Mavromatis, V., Mittermayr, F., Warr, L. N., and Wemmer, K. (2017). The role of Fe on the formation and diagenesis of interstratified glauconite-smectite and illite-smectite: A case study of upper cretaceous shallow-water carbonates. Chem. Geol. 453, 21–34. doi:10.1016/j.chemgeo.2017.02.008
Baldermann, A., Mittermayr, F., Bernasconi, S. M., Dietzel, M., Grengg, C., Hippler, D., et al. (2020). Fracture dolomite as an archive of continental palaeo-environmental conditions. Commun. Earth Environ. 1, 35–12. doi:10.1038/s43247-020-00040-3
Baldermann, A., Banerjee, S., Czuppon, G., Dietzel, M., Farkaš, J., Lӧhr, S., et al. (2022). Impact of green clay authigenesis on element sequestration in marine settings. Nat. Commun. 13, 1527. doi:10.1038/s41467-022-29223-6
Bayon, G., German, C. R., Burton, K. W., Nesbitt, R. W., and Rogers, N. (2004). Sedimentary Fe–Mn oxyhydroxides as paleoceanographic archives and the role of aeolian flux in regulating oceanic dissolved REE. Earth Planet. Sci. Lett. 224, 477–492. doi:10.1016/j.epsl.2004.05.033
Bristow, T. F., Kennedy, M. J., Derkowski, A., Droser, M. L., Jiang, G., and Creaser, R. A. (2009). Mineralogical constraints on the paleoenvironments of the ediacaran Doushantuo Formation. Proc. Natl. Acad. Sci. U. S. A. 106, 13190–13195. doi:10.1073/pnas.0901080106
Bristow, T. F., Kennedy, M. J., Morrison, K. D., and Mrofka, D. D. (2012). The influence of authigenic clay formation on the mineralogy and stable isotopic record of lacustrine carbonates. Geochim. Cosmochim. Acta 90, 64–82. doi:10.1016/j.gca.2012.05.006
Burke, I. T., and Kemp, A. E. S. (2002). Microfabric analysis of Mn-carbonate laminae deposition and Mn-sulfide formation in the gotland deep, Baltic Sea. Geochim. Cosmochim. Acta 66, 1589–1600. doi:10.1016/S0016-7037(01)00860-2
Conley, D. J., Frings, P. J., Fontorbe, G., Clymans, W., Stadmark, J., Hendry, K. R., et al. (2017). Biosilicification drives a decline of dissolved Si in the oceans through geologic time. Front. Mar. Sci. 4, 397. doi:10.3389/fmars.2017.00397
I. W. Croudace, and R. G. Rothwell (Editors) (2015). Micro-XRF studies of sediment cores: Applications of a non-destructive tool for the environmental sciences, developments in paleoenvironmental research (Dordrecht: Springer Netherlands). doi:10.1007/978-94-017-9849-5
Cui, H., Kitajima, K., Spicuzza, M. J., Fournelle, J. H., Denny, A., Ishida, A., et al. (2018). Questioning the biogenicity of Neoproterozoic superheavy pyrite by SIMS. Am. Mineral. 103, 1362–1400. doi:10.2138/am-2018-6489
Davies, N. S., Shillito, A. P., Slater, B. J., Liu, A. G., and McMahon, W. J. (2020). Evolutionary synchrony of Earth’s biosphere and sedimentary-stratigraphic record. Earth-Science Rev. 201, 102979. doi:10.1016/j.earscirev.2019.102979
Day-Stirrat, R. J., Milliken, K. L., Dutton, S. P., Loucks, R. G., Hillier, S., Aplin, A. C., et al. (2010). Open-system chemical behavior in deep wilcox Group mudstones, Texas gulf coast, USA. Mar. Petroleum Geol. 27, 1804–1818. doi:10.1016/j.marpetgeo.2010.08.006
Debenham, N. (2015). Controls on organic carbon enrichment in a Permian periglacial setting (Arckaringa Basin). Sydney, Australia: Macquarie University.
Dickinson, W. R., Beard, L. S., Brakenridge, G. R., Erjavec, J. L., Ferguson, R. C., Inman, K. F., et al. (1983). Provenance of North American Phanerozoic sandstones in relation to tectonic setting. Geol. Soc. Am. Bull. 94, 222–235. doi:10.1130/0016-7606(1983)94<222:ponaps>2.0.co;2
Du, J., Haley, B. A., and Mix, A. C. (2016). Neodymium isotopes in authigenic phases, bottom waters and detrital sediments in the Gulf of Alaska and their implications for paleo-circulation reconstruction. Geochim. Cosmochim. Acta 193, 14–35. doi:10.1016/j.gca.2016.08.005
Elmore, A. C., Piotrowski, A. M., Wright, J. D., and Scrivner, A. E. (2011). Testing the extraction of past seawater Nd isotopic composition from North Atlantic deep sea sediments and foraminifera. Geochem. Geophys. Geosyst. 12. doi:10.1029/2011GC003741
Falster, G., Tyler, J., Grant, K., Tibby, J., Turney, C., Löhr, S., et al. (2018). Millennial-scale variability in south-east Australian hydroclimate between 30, 000 and 10, 000 years ago. Quat. Sci. Rev. 192, 106–122. doi:10.1016/j.quascirev.2018.05.031
Flügel, E., and Munnecke, A. (2010). Microfacies of carbonate rocks: analysis, interpretation and application. 2nd ed. Heidelberg; New York: Springer.
Folk, R. L., Andrews, P. B., and Lewis, D. W. (1970). Detrital sedimentary rock classification and nomenclature for use in New Zealand. N. Z. J. Geol. Geophys. 13, 937–968. doi:10.1080/00288306.1970.10418211
Frank, M., Whiteley, N., Kasten, S., Hein, J. R., and O’Nions, K. (2002). North atlantic deep water export to the southern ocean over the past 14 Myr: Evidence from Nd and Pb isotopes in ferromanganese crusts. Paleoceanography 17, 12-1–12–9. doi:10.1029/2000PA000606
Frank, A. B., Klaebe, R. M., Löhr, S., Xu, L., and Frei, R. (2020). Chromium isotope composition of organic-rich marine sediments and their mineral phases and implications for using black shales as a paleoredox archive. Geochim. Cosmochim. Acta 270, 338–359. doi:10.1016/j.gca.2019.11.035
Frings, P. J. (2019). Palaeoweathering: How do weathering rates vary with climate? Elem. (Que). 15, 259–265. doi:10.2138/gselements.15.4.259
Gebregiorgis, D., Deocampo, D. M., Longstaffe, F. J., Simpson, A., Ashley, G. M., Beverly, E. J., et al. (2020). Oxygen isotopes in authigenic clay minerals: Toward building a reliable salinity proxy. Geophys. Res. Lett. 47, e2019GL085576. doi:10.1029/2019GL085576
Gottlieb, P., Wilkie, G., Sutherland, D., Ho-Tun, E., Suthers, S., Perera, K., et al. (2000). Using quantitative electron microscopy for process mineralogy applications. JOM 52, 24–25. doi:10.1007/s11837-000-0126-9
Grauch, R., Eberl, D., Butcher, A., and Botha, P. (2008). Quantitative mineralogy of fine-grained sedimentary rocks: A preliminary look at QEMSCAN®. Microsc. Microanal. 14, 532–533. doi:10.1017/S1431927608082858
Gu, Y. (2003). Automated scanning electron microscope based mineral liberation analysis an introduction to JKMRC/FEI mineral liberation analyser. JMMCE 02, 33–41. doi:10.4236/jmmce.2003.21003
Han, S., Lӧhr, S. C., Abbott, A. N., Baldermann, A., Voigt, M., and Yu, B. (2022). Authigenic clay mineral evidence for restricted, evaporitic conditions during the emergence of the Ediacaran Doushantuo Biota. Commun. Earth Environ. 3, 165. doi:10.1038/s43247-022-00495-6
Hennekam, R., Jilbert, T., Mason, P. R. D., de Lange, G. J., and Reichart, G.-J. (2015). High-resolution line-scan analysis of resin-embedded sediments using laser ablation-inductively coupled plasma-mass spectrometry (LA-ICP-MS). Chem. Geol. 403, 42–51. doi:10.1016/j.chemgeo.2015.03.004
Hoal, K. O., Stammer, J. G., Appleby, S. K., Botha, J., Ross, J. K., and Botha, P. W. (2009). Research in quantitative mineralogy: Examples from diverse applications. Miner. Eng. 22, 402–408. doi:10.1016/j.mineng.2008.11.003
Hogmalm, K. J., Zack, T., Karlsson, A. K.-O., Sjöqvist, A. S. L., and Garbe-Schönberg, D. (2017). In situ Rb–Sr and K–Ca dating by LA-ICP-MS/MS: an evaluation of N2O and SF6 as reaction gases. J. Anal. At. Spectrom. 32, 305–313. doi:10.1039/C6JA00362A
Homoky, W. B., Weber, T., Berelson, W. M., Conway, T. M., Henderson, G. M., van Hulten, M., et al. (2016). Quantifying trace element and isotope fluxes at the ocean–sediment boundary: a review. Phil. Trans. R. Soc. A 374, 20160246. doi:10.1098/rsta.2016.0246
Horner, T. J., Little, S. H., Conway, T. M., Farmer, J. R., Hertzberg, J. E., Janssen, D. J., et al. (2021). Bioactive trace metals and their isotopes as paleoproductivity proxies: An assessment using GEOTRACES-era data. Glob. Biogeochem. Cycles 35, e2020GB006814. doi:10.1029/2020GB006814
Huang, J., Chu, X., Lyons, T. W., Planavsky, N. J., and Wen, H. (2013). A new look at saponite formation and its implications for early animal records in the Ediacaran of South China. Geobiology 11, 3–14. doi:10.1111/gbi.12018
Ilgen, A. G., Heath, J. E., Akkutlu, I. Y., Bryndzia, L. T., Cole, D. R., Kharaka, Y. K., et al. (2017). Shales at all scales: Exploring coupled processes in mudrocks. Earth-Science Rev. 166, 132–152. doi:10.1016/j.earscirev.2016.12.013
Isson, T. T., and Planavsky, N. J. (2018). Reverse weathering as a long-term stabilizer of marine pH and planetary climate. Nature 560, 471–475. doi:10.1038/s41586-018-0408-4
Jiang, G., Shi, X., Zhang, S., Wang, Y., and Xiao, S. (2011). Stratigraphy and paleogeography of the ediacaran Doushantuo Formation (ca. 635–551Ma) in south China. Gondwana Res. 19, 831–849. doi:10.1016/j.gr.2011.01.006
Jilbert, T., and Slomp, C. P. (2013). Rapid high-amplitude variability in Baltic Sea hypoxia during the holocene. Geology 41, 1183–1186. doi:10.1130/G34804.1
Johnson, C., Pownceby, M. I., and Wilson, N. C. (2015). The application of automated electron beam mapping techniques to the characterisation of low grade, fine-grained mineralisation; potential problems and recommendations. Miner. Eng. 79, 68–83. doi:10.1016/j.mineng.2015.05.005
Kalderon-Asael, B., Katchinoff, J. A. R., Planavsky, N. J., Hood, A. v. S., Dellinger, M., Bellefroid, E. J., et al. (2021). A lithium-isotope perspective on the evolution of carbon and silicon cycles. Nature 595, 394–398. doi:10.1038/s41586-021-03612-1
Kennedy, M., Droser, M., Mayer, L. M., Pevear, D., and Mrofka, D. (2006). Late precambrian oxygenation; inception of the clay mineral factory. Science 311, 1446–1449. doi:10.1126/science.1118929
Kleeberg, R., Monecke, T., and Hillier, S. (2008). Preferred orientation of mineral grains in sample mounts for quantitative XRD measurements: How random are powder samples? Clays Clay Min. 56, 404–415. doi:10.1346/CCMN.2008.0560402
Knauth, L. P., and Kennedy, M. J. (2009). The late Precambrian greening of the Earth. Nature 460, 728–732. doi:10.1038/nature08213
Kotula, P. G., Keenan, M. R., and Michael, J. R. (2003). Automated analysis of SEM X-ray spectral images: A powerful new microanalysis tool. Microsc. Microanal. 9, 1–17. doi:10.1017/S1431927603030058
Krissansen-Totton, J., and Catling, D. C. (2020). A coupled carbon-silicon cycle model over Earth history: Reverse weathering as a possible explanation of a warm mid-Proterozoic climate. Earth Planet. Sci. Lett. 537, 116181. doi:10.1016/j.epsl.2020.116181
Lenton, T. M., and Daines, S. J. (2017). Matworld – the biogeochemical effects of early life on land. New Phytol. 215, 531–537. doi:10.1111/nph.14338
León-Reina, L., García-Maté, M., Álvarez-Pinazo, G., Santacruz, I., Vallcorba, O., De la Torre, A. G., et al. (2016). Accuracy in Rietveld quantitative phase analysis: a comparative study of strictly monochromatic Mo and Cu radiations. J. Appl. Crystallogr. 49, 722–735. doi:10.1107/S1600576716003873
Lerman, A., and Clauer, N. (2014). “9.16 - stable isotopes in the sedimentary record,” in Treatise on geochemistry. Editors H. D. Holland, and K. K. Turekian. Second Edition (Oxford: Elsevier), 437–481. doi:10.1016/B978-0-08-095975-7.00716-6
Li, Y.-H., and Schoonmaker, J. E. (2014). “9.1 - chemical composition and mineralogy of marine sediments,” in Treatise on geochemistry. Editors H. D. Holland, and K. K. Turekian. Second Edition (Oxford: Elsevier), 1–32. doi:10.1016/B978-0-08-095975-7.00701-4
Lipp, A. G., Shorttle, O., Sperling, E. A., Brocks, J. J., Cole, D. B., Crockford, P. W., et al. (2021). The composition and weathering of the continents over geologic time. Geochem. Persp. Let. 17, 21–26. doi:10.7185/geochemlet.2109
Llovet, X. (2019). “Microscopy | electron probe microanalysis,” in Encyclopedia of analytical science. Editors P. Worsfold, C. Poole, A. Townshend, and M. Miró. Third Edition (Oxford: Academic Press), 30–38. doi:10.1016/B978-0-12-409547-2.14369-0
Löhr, S., Farkaš, J., Rafiei, M., Baldermann, A., Alard, O., and Brock, G. (2021). “In situ Rb-Sr dating of glauconite in partially altered Cambrian sedimentary sequences,” in Presented at the Goldschmidt2021, July 4–9, 2021. doi:10.7185/gold2021.6594
López-Quirós, A., Escutia, C., Sánchez-Navas, A., Nieto, F., Garcia-Casco, A., Martín-Algarra, A., et al. (2019). Glaucony authigenesis, maturity and alteration in the Weddell Sea: An indicator of paleoenvironmental conditions before the onset of Antarctic glaciation. Sci. Rep. 9, 13580. doi:10.1038/s41598-019-50107-1
McMahon, W. J., and Davies, N. S. (2018). Evolution of alluvial mudrock forced by early land plants. Science 359, 1022–1024. doi:10.1126/science.aan4660
Milliken, K. L., and Curtis, M. E. (2016). Imaging pores in sedimentary rocks: Foundation of porosity prediction. Mar. Pet. Geol. 73, 590–608. doi:10.1016/j.marpetgeo.2016.03.020
Milliken, K. L., Shen, Y., Ko, L. T., and Liang, Q. (2017). Grain composition and diagenesis of organic-rich lacustrine tarls, triassic yanchang formation, ordos basin, China. Interpretation 5, SF189–SF210. doi:10.1190/INT-2016-0092.1
Milliken, K. L., Reed, R. M., McCarty, D. K., Bishop, J., Lipinski, C. J., Fischer, T. B., et al. (2019). Grain assemblages and diagenesis in the vaca muerta formation (Jurassic-Cretaceous), neuquén basin, Argentina. Sediment. Geol. 380, 45–64. doi:10.1016/j.sedgeo.2018.11.007
Milliken, K. L. (2003). Late diagenesis and mass transfer in sandstone shale sequences. Treatise Geochem. 7, 159–190. doi:10.1016/B0-08-043751-6/07091-2
Moore, D. M., and Reynolds, R. C. (1989). X-ray diffraction and the identification and analysis of clay minerals. Oxford: Oxford University Press.
Newbury, D. E., and Ritchie, N. W. M. (2013). Is scanning electron microscopy/energy dispersive X-ray spectrometry (SEM/EDS) quantitative?: Quantitative SEM/EDS analysis. Scanning 35, 141–168. doi:10.1002/sca.21041
O’Brien, N. R. (1996). Shale lamination and sedimentary processes. Geol. Soc. Lond. Spec. Publ. 116, 23–36. doi:10.1144/GSL.SP.1996.116.01.04
Pirrie, D., Butcher, A. R., Power, M. R., Gottlieb, P., and Miller, G. L. (2004). Rapid quantitative mineral and phase analysis using automated scanning electron microscopy (QemSCAN); potential applications in forensic geoscience. Geol. Soc. Lond. Spec. Publ. 232, 123–136. doi:10.1144/GSL.SP.2004.232.01.12
Pozo, M., and Calvo, J. (2018). An overview of authigenic magnesian clays. Minerals 8, 520. doi:10.3390/min8110520
Rafiei, M., and Kennedy, M. (2019). Weathering in a world without terrestrial life recorded in the Mesoproterozoic Velkerri Formation. Nat. Commun. 10, 3448. doi:10.1038/s41467-019-11421-4
Rafiei, M., Lӧhr, S., Baldermann, A., Webster, R., and Kong, C. (2020). Quantitative petrographic differentiation of detrital vs diagenetic clay minerals in marine sedimentary sequences: Implications for the rise of biotic soils. Precambrian Res. 350, 105948. doi:10.1016/j.precamres.2020.105948
Redaa, A., Farkaš, J., Gilbert, S., Collins, A. S., Wade, B., Löhr, S., et al. (2021). Assessment of elemental fractionation and matrix effects during in situ Rb–Sr dating of phlogopite by LA-ICP-MS/MS: Implications for the accuracy and precision of mineral ages. J. Anal. At. Spectrom. 36, 322–344. doi:10.1039/D0JA00299B
Redaa, A., Farkaš, J., Hassan, A., Collins, A. S., Gilbert, S., and Löhr, S. C. (2022). Constraints from in-situ Rb-Sr dating on the timing of tectono-thermal events in the Umm Farwah shear zone and associated Cu-Au mineralisation in the Southern Arabian Shield, Saudi Arabia. J. Asian Earth Sci. 224, 105037. doi:10.1016/j.jseaes.2021.105037
Richoz, S., Baldermann, A., Frauwallner, A., Harzhauser, M., Daxner-Höck, G., Klammer, D., et al. (2017). Geochemistry and mineralogy of the oligo-miocene sediments of the valley of lakes, Mongolia. Paleobiodivers. Paleoenviron. 97, 233–258. doi:10.1007/s12549-016-0268-6
Rollinson, G. K., Andersen, J. C. Ø., Stickland, R. J., Boni, M., and Fairhurst, R. (2011). Characterisation of non-sulphide zinc deposits using QEMSCAN®. Miner. Eng. 24, 778–787. doi:10.1016/j.mineng.2011.02.004
Rutberg, R. L., Hemming, S. R., and Goldstein, S. L. (2000). Reduced north atlantic deep water flux to the glacial southern ocean inferred from neodymium isotope ratios. Nature 405, 935–938. doi:10.1038/35016049
Scheiblhofer, E., Moser, U., Lӧhr, S., Wilmsen, M., Farkaš, J., Gallhofer, D., et al. (2022). Revisiting glauconite geochronology: Lessons learned from in situ radiometric dating of a glauconite-rich cretaceous shelfal sequence. Minerals 12, 818. doi:10.3390/min12070818
Schulz, B., Sandmann, D., and Gilbricht, S. (2020). SEM-based automated mineralogy and its application in geo- and material Sciences. Minerals 10, 1004. doi:10.3390/min10111004
Simpson, A., Gilbert, S., Tamblyn, R., Hand, M., Spandler, C., Gillespie, J., et al. (2021). In-situ LuHf geochronology of garnet, apatite and xenotime by LA ICP MS/MS. Chem. Geol. 577, 120299. doi:10.1016/j.chemgeo.2021.120299
Singer, A. (1980). The paleoclimatic interpretation of clay minerals in soils and weathering profiles. Earth-Science Rev. 15, 303–326. doi:10.1016/0012-8252(80)90113-0
Skinner, L. C., Sadekov, A., Brandon, M., Greaves, M., Plancherel, Y., de la Fuente, M., et al. (2019). Rare Earth Elements in early-diagenetic foraminifer ‘coatings’: Pore-water controls and potential palaeoceanographic applications. Geochim. Cosmochim. Acta 245, 118–132. doi:10.1016/j.gca.2018.10.027
Sosa-Montes de Oca, C., de Lange, G. J., MartÃnez-Ruiz, F., and RodrÃguez-Tovar, F. J. (2018). Application of laser ablation-ICP-MS to determine high-resolution elemental profiles across the Cretaceous/Paleogene boundary at Agost (Spain). Palaeogeogr. Palaeoclimatol. Palaeoecol. 497, 128–138. doi:10.1016/j.palaeo.2018.02.012
Sosa-Montes de Oca, C., de Lange, G. J., Martínez-Ruiz, F., Ortega-Huertas, M., and Rodríguez-Tovar, F. J. (2020). Microscale trace-element distribution across the Cretaceous/Palaeogene ejecta layer at the Agost section: Constraining the recovery of pre-impact conditions. Chem. Geol. 533, 119431. doi:10.1016/j.chemgeo.2019.119431
Spaleta, K. J., Hayes, S. M., Newberry, R. J., and Piatak, N. M. (2020). Evaluating the utility of principal component analysis on EDS X-ray maps to determine bulk mineralogy. Geostand. Geoanal. Res. 44, 821–843. doi:10.1111/ggr.12349
Strauss, J. V., and Tosca, N. J. (2020). Mineralogical constraints on Neoproterozoic pCO2 and marine carbonate chemistry. Geology 48, 599–603. doi:10.1130/G47506.1
Subarkah, D., Blades, M. L., Collins, A. S., Farkaš, J., Gilbert, S., Löhr, S. C., et al. (2022). Unraveling the histories of Proterozoic shales through in situ Rb-Sr dating and trace element laser ablation analysis. Geology 50, 66–70. doi:10.1130/G49187.1
Tachikawa, K., Arsouze, T., Bayon, G., Bory, A., Colin, C., Dutay, J.-C., et al. (2017). The large-scale evolution of neodymium isotopic composition in the global modern and Holocene ocean revealed from seawater and archive data. Chem. Geol. 457, 131–148. doi:10.1016/j.chemgeo.2017.03.018
Tang, D., Shi, X., Jiang, G., Zhou, X., and Shi, Q. (2017). Ferruginous seawater facilitates the transformation of glauconite to chamosite: An example from the Mesoproterozoic Xiamaling Formation of North China. Am. Mineral. 102, 2317–2332. doi:10.2138/am-2017-6136
Tosca, N. J., Johnston, D. T., Mushegian, A., Rothman, D. H., Summons, R. E., and Knoll, A. H. (2010). Clay mineralogy, organic carbon burial, and redox evolution in Proterozoic oceans. Geochim. Cosmochim. Acta 74, 1579–1592. doi:10.1016/j.gca.2009.12.001
Tosca, N. J., Macdonald, F. A., Strauss, J. V., Johnston, D. T., and Knoll, A. H. (2011). Sedimentary talc in Neoproterozoic carbonate successions. Earth Planet. Sci. Lett. 306, 11–22. doi:10.1016/j.epsl.2011.03.041
Turchyn, A. V., and DePaolo, D. J. (2019). Seawater chemistry through phanerozoic time. Annu. Rev. Earth Planet. Sci. 47, 197–224. doi:10.1146/annurev-earth-082517-010305
Velde, B., and Meunier, A. (2008). The origin of clay minerals in soils and weathered rocks. Berlin, Heidelberg: Springer Berlin Heidelberg.
Vermeesch, P., Rittner, M., Petrou, E., Omma, J., Mattinson, C., and Garzanti, E. (2017). High throughput petrochronology and sedimentary provenance analysis by automated phase mapping and LAICPMS. Geochem. Geophys. Geosyst. 18, 4096–4109. doi:10.1002/2017GC007109
Wei, W., and Algeo, T. J. (2020a). Elemental proxies for paleosalinity analysis of ancient shales and mudrocks. Geochim. Cosmochim. Acta 287, 341–366. doi:10.1016/j.gca.2019.06.034
Wei, W., and Algeo, T. J. (2020b). Secular variation in the elemental composition of marine shales since 840 Ma: Tectonic and seawater influences. Geochim. Cosmochim. Acta 287, 367–390. doi:10.1016/j.gca.2020.01.033
Wilson, D. J., Piotrowski, A. M., Galy, A., and Clegg, J. A. (2013). Reactivity of neodymium carriers in deep sea sediments: Implications for boundary exchange and paleoceanography. Geochim. Cosmochim. Acta 109, 197–221. doi:10.1016/j.gca.2013.01.042
Xiao, S., Schiffbauer, J. D., McFadden, K. A., and Hunter, J. (2010). Petrographic and SIMS pyrite sulfur isotope analyses of Ediacaran chert nodules: Implications for microbial processes in pyrite rim formation, silicification, and exceptional fossil preservation. Earth Planet. Sci. Lett. 297, 481–495. doi:10.1016/j.epsl.2010.07.001
Xu, H., Hou, D., Löhr, S. C., Liu, Q., and George, S. C. (2020). Early diagenetic pyrite cementation influences molecular composition of sedimentary organic matter in the Dongying Depression, China. Org. Geochem. 144, 104019. doi:10.1016/j.orggeochem.2020.104019
Yin, Z., Zhu, M., Bottjer, D. J., Zhao, F., and Tafforeau, P. (2016). Meroblastic cleavage identifies some Ediacaran Doushantuo (China) embryo-like fossils as metazoans. Geology 44, 735–738. doi:10.1130/G38262.1
Keywords: SEM-EDS mineral mapping, sedimentary records, fine-grained rocks, petrographic analyses, Earth system
Citation: Han S, Lӧhr SC, Abbott AN, Baldermann A, Farkaš J, McMahon W, Milliken KL, Rafiei M, Wheeler C and Owen M (2022) Earth system science applications of next-generation SEM-EDS automated mineral mapping. Front. Earth Sci. 10:956912. doi: 10.3389/feart.2022.956912
Received: 30 May 2022; Accepted: 09 November 2022;
Published: 23 November 2022.
Edited by:
Duncan Pirrie, University of South Wales, United KingdomReviewed by:
Matthew Power, Vidence Inc, CanadaCopyright © 2022 Han, Lӧhr, Abbott, Baldermann, Farkaš, McMahon, Milliken, Rafiei, Wheeler and Owen. This is an open-access article distributed under the terms of the Creative Commons Attribution License (CC BY). The use, distribution or reproduction in other forums is permitted, provided the original author(s) and the copyright owner(s) are credited and that the original publication in this journal is cited, in accordance with accepted academic practice. No use, distribution or reproduction is permitted which does not comply with these terms.
*Correspondence: Shujun Han, Y3VnYmhhbnNqQDEyNi5jb20=; Stefan C. Lӧhr, c3RlZmFuLmxvZWhyQG1xLmVkdS5hdQ==
†Present Address: Shujun Han, Research Institute of Petroleum Exploration and Development, PetroChina, Beijing, China
Disclaimer: All claims expressed in this article are solely those of the authors and do not necessarily represent those of their affiliated organizations, or those of the publisher, the editors and the reviewers. Any product that may be evaluated in this article or claim that may be made by its manufacturer is not guaranteed or endorsed by the publisher.
Research integrity at Frontiers
Learn more about the work of our research integrity team to safeguard the quality of each article we publish.